Abstract
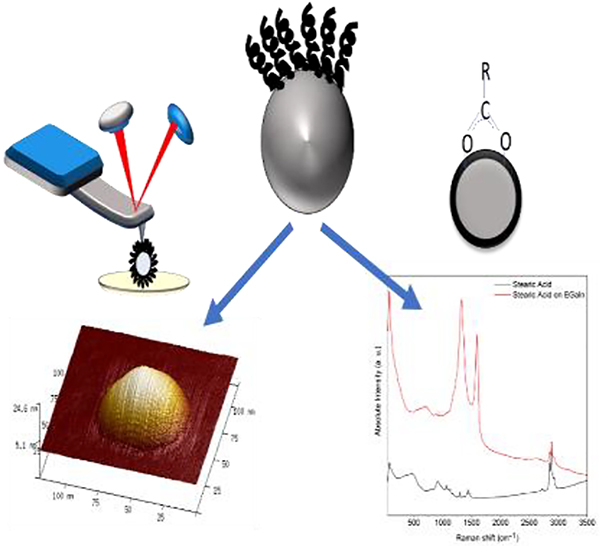
Eutectic gallium indium (EGaIn), a Ga-based liquid metal alloy holds great promise for designing next generation core-shell nanoparticles (CSNs). A shearing assisted ligand-stabilization method has shown promise as a synthetic method for these CSNs; however, determining the role of the ligand on stabilization demands an understanding of the surface chemistry of the ligand-nanoparticle interface. EGaIn CSNs have been created functionalized with aliphatic carboxylates of different chain length allowing a fundamental investigation on ligand stabilization of EGaIn CSNs. Raman and diffuse reflectance Fourier transform spectroscopies (DRIFTS) confirm reaction of the ligand with the oxide shell of the EGaIn nanoparticles. Changing the length of the alkyl chain in the aliphatic carboxylates (C2-C18) may influence the size and structural stability of EGaIn CSNs, which is easily monitored using atomic force microscopy (AFM). No matter how large the carboxylate ligand, there is no obvious effect on the size of the EGaIn CSNs, except the particle size got more uniform when coated with longer chain carboxylates. The AFM force distance (F-D) measurements are used to measure the stiffness of the carboxylate coated EGaIn CSN. In corroboration with DRIFTS analysis, the stiffness studies show that the alkyl chains undergo conformational changes upon compression.
Keywords: EGaIn, liquid metal core-shell nanoparticles, AFM, FTIR, Raman spectroscopy
Graphical Abstract
1. Introduction
Room-temperature liquid metals offer an intriguing platform for developing functional nanocomposite materials which have a variety of engineering applications, including flexible bionic nanorobots,[1,2] flexible electronics,[3–7] 3D metal printing,[8,9] microfluidic channels,[10,11] and implantable medical devices.[12–16] Ga-based liquid eutectic alloys such as eutectic gallium indium (EGaIn, Gallium 75 wt% and Indium 25 wt%) have attracted great attention due to their interesting surface and bulk properties such as shape transformability, flexible and stretchable mechanical properties, excellent electrical and thermal conductivities, biocompatibility, facile functionalization accessibility, catalytic properties, and self-healing capability.[17,18] Microparticles formed from EGaIn have attracted significant attention for soft electronics.[1,2] The surface of EGaIn nanoparticles is easily oxidized in the presence of oxygen, forming an amorphous self-passivating gallium oxide (Ga2O3) layer that imparts mechanical stability to the resulting nanoparticles.[19,20] A few studies suggest that tethering organic ligands to the oxide surface of EGaIn particles may stabilize them by inhibiting particle growth, preventing particle aggregation and coagulation; however, the resulting ligand coated particles have irregular distributions of size and shape.[21] To date, most of the work published about EGaIn particles focuses on synthetic strategies for stabilizing CSNs[13,22–28] or analyzing them in different reaction media.[21] For example, Hohman et al. developed a procedure directed by molecular self-assembly where EGaIn CSNs were created using ultrasonication in the presence of an ethanolic solution of alkyl thiolates as stabilizers.[22] The authors demonstrated that chemisorption of sulfur atoms with gallium or indium atoms on the surface stabilized EGaIn CSNs, resulting in perfect spheres with a liquid core. Tevis et al. fabricated core-shell EGaIn microparticles in acetic acid using a simple approach of shearing liquids into complex particles (SLICE).[23] The dispersed EGaIn particles were stabilized by acetate monolayers via in situ oxidation and self-assembly on the oxide surface. However, such investigations encounter inherent difficulties when trying to characterize these core-shell particles effectively, resulting in an often incomplete understanding of the surface coating. A significant missing piece of the puzzle is an absence of strategies to characterize surface ligands in such a way as to understand the influence they have on the formation of well dispersed nanoparticles with a uniform morphology. Therefore, to understand the colloidal stability of these nanoparticles, it is necessary to develop more precise and credible protocols to gather knowledge about their surface chemistry. It is a fascinating challenge and becomes the focus of ongoing efforts because so little information is reported on the efficacy of ligand induced stabilization of core-shell liquid metal nanoparticles. Recently, Finkenauer et al. evaluated the role of functional group as well as chain length of nonpolar groups of ligands on the size and yield of EGaIn CSNs by ultrasonication.[21] The authors tested aliphatic ligand systems with long alkyl chain bearing functional group of thiols, carboxylates and amines. They noted that the yield of EGaIn CSNs formation increased by increasing the number of carbon atoms in the aliphatic chain of alkyl thiolates. Taking the conclusions of these previous studies, it is noted that ligand compositions play a fundamental role on EGaIn CSNs stabilization and uniformity. However, determining the efficacy of ligand stabilization based on particle size alone is insufficient. Understanding the role of ligand composition on mechanical properties of EGaIn CSNs also needs to be considered since ligands may also provide mechanical stability. Therefore, more research is needed to understand the effect of alkyl chain length on the mechanical properties of EGaIn CSNs.
In our previous work, it was observed that the mechanical strength of the oxide shell of acetate coated EGaIn microparticles was enhanced as the temperature of the microparticle was increased from ambient to higher temperatures.[29] It was determined that the oxide film thickness increases as a function of temperature which also changes the surface coating from flexible at room temperature to much stiffer after heat treatments. These observations have led to an examination of ligand composition as a way to tune the mechanical properties of EGaIn CSNs. The present study aims to develop a systematic evaluation exploring ligand effects on morphological changes and mechanical behaviors of carboxylate coated EGaIn CSNs by tuning the ligand composition with increasingly nonpolar (aliphatic) groups.
Here, a detailed characterization of EGaIn CSNs coated with straight chain saturated carboxylates is described. First, EGaIn CSNs are fabricated with aliphatic carboxylic acids of different alkyl chain length using the SLICE[23] method under ambient conditions. Aliphatic carboxylic acids were considered for this study because of their high affinity towards the robust gallium oxide surface.[21] Still, the nature of how the ligand molucules bind to the gallium oxide surface of EGaIn nanoparticles is an unresolved question. Raman and IR spectroscopy are used to determine if the thin oxide layer of the particles is functionalized with chemisorbed carboxylate groups. Second, the role of alkyl chain length of carboxylates on stabilizing EGaIn CSNs is evaluated. AFM is used to determine the size distribution of the EGaIn nanoparticles, quantitatively, as a function of the length of the alkyl chain. Lastly, changes in the nanomechanical properties of the functionalized oxide shell is analyzed using AFM force spectroscopy as a function of the alkyl chain length. This fundamental investigation will assist in the understanding of the particle-ligand interface, which will be beneficial for tuning the shape and size as well as mechanical stability of EGaIn CSNs.
2. Results and Discussion
2.1. EGaIn nanoparticle formation
Using the SLICE[23] approach, EGaIn CSNs were synthesized in ethanolic solutions of a selection of straight chain saturated carboxylic acids as tabulated in Table-1. The shearing process breaks up the bulk EGaIn liquid into small nanoparticles concurrent with surface oxidation and ligand self-assembly on the oxide surface. Carboxylic acids react with the gallium oxide creating chemisorbed carboxylate molecules which form an outer organic shell on the liquid metal nanoparticles.[23]
Table 1.
List of aliphatic carboxylic acids as ligand precursors along with formula and ligand identifiers
| Ligand precursors | Formula | Ligand Identifiers | Ligand precursors | Formula | Ligand Identifiers |
|---|---|---|---|---|---|
| Stearic Acid | C17H35COOH | C18 | Octanoic acid | C7H15COOH | C8 |
| Palmitic Acid | C15H31COOH | C16 | Hexanoic Acid | C5H11COOH | C6 |
| Myristic Acid | C₁3H27COOH | C14 | Butanoic Acid | C3H7COOH | C4 |
| Lauric Acid | C11H23COOH | C12 | Acetic Acid | CH3COOH | C2 |
| Decanoic Acid | C9H19COOH | C10 |
2.2. Bonding behaviour of ligands on EGaIn CSNs
2.2.1. Characterization by Raman spectroscopy
Surface characterization using Raman spectroscopy on EGaIn CSNs fabricated with carboxylic acids under ambient conditions confirms the attachment of carboxylic acid to the gallium oxide layer on the surface of the EGaIn particles. Figure 1 shows the Raman signal of pure stearic acid and stearic acid bound to EGaIn CSNs. Spectral assignments are made in accordance with the literature.[30–32] Raman spectra of pure stearic acid shows narrow sharp peaks at 860 cm−1, 1029 cm−1, 1095 cm−1, 1262 cm−1 and 1404 cm−1. The peaks at 1029 cm−1 and 1095 cm−1 can be assigned to C-C stretching in a hydrocarbon chain and the 1262 cm−1 to a CH2 twist. The region between 1500–1400 cm−1 is a group of bands assigned to CH2 bending. Raman bands observed around 2846 and 2890 cm−1 were assigned to the symmetric (νs) and asymmetric (νas) stretching vibrations of the CH2 groups of the alkyl chain, respectively. The carbonyl peak expected around 1700 cm−1, is absent due to the long alkyl chain which makes the C=O bond less polarizable.
Figure 1.
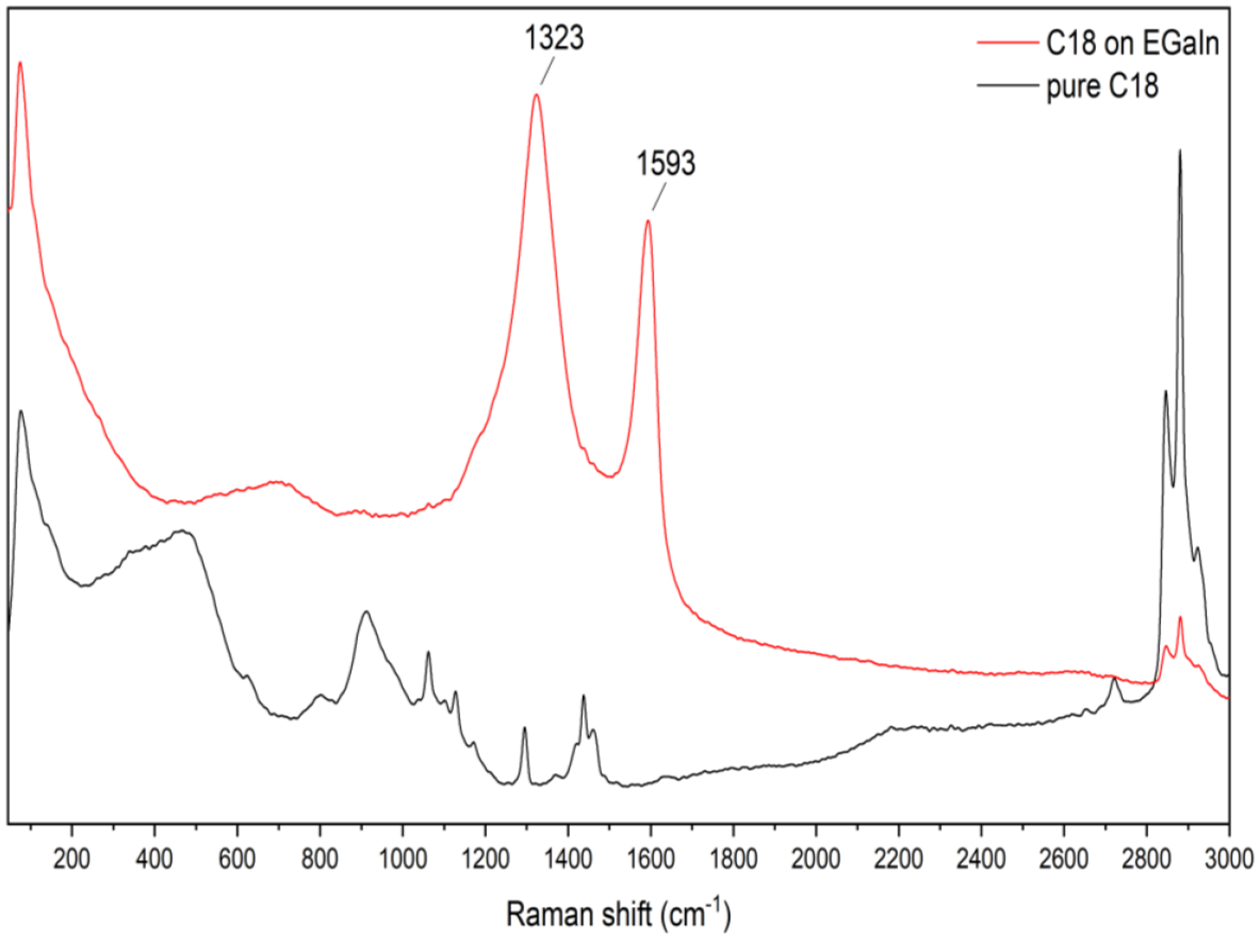
Raman spectra of pure stearic acid and stearic acid coated EGaIn CSNs.
The Raman spectrum of coated EGaIn CSNs created in stearic acid is distinctive from its corresponding pure fatty acid, as shown in Figure 1. The asymmetric and symmetric carboxylate stretching modes are found at 1594 cm−1 and 1324 cm−1. In addition, in the region between 1500 and 1400 cm−1, there is a group of bands can be associated with the CH2 bends. A broad absorption centred around 700 cm−1 is characteristic of all dispersed EGaIn CSNs and is most likely due to the Ga-O vibrations of the shell[31,33,34] (see Figure S1 in the supporting information for Raman spectra of all the acid coated EGaIn CSNs). The appearance of the symmetric and asymmetric carboxylate stretches in the Raman of the coated particles confirms that the acid has indeed reacted with the gallium oxide layer on the surface creating a stearate coated EGaIn CSNs.[35–37]
2.2.2. Characterization by DRIFT spectroscopy
Diffuse Reflectance Infrared Fourier Transform Spectroscopy (DRIFTS) was used to investigate the bonding behavior between the carboxylates and EGaIn CSNs. The IR spectra of pure stearic acid and stearic acid coated EGaIn CSNs between 3000 and 800 cm−1 are presented in Figure 2. The IR spectra of all the acids coated EGaIn CSNs can be found in Figure S2 in the supporting information. As is well known,[31,38,39] there are eight bands between about 1320 and 1180 cm−1 region which are due to CH2 wagging modes coupled with the carboxyl vibration. The appearance of the bands for stearic acid coated EGaIn CSNs attributed to the COO– asymmetric and symmetric stretch in the red spectrum at 1580 and 1384 cm−1, respectively, indicates that the stearic acid has reacted with the oxide resulting in the formation of gallium carboxylate on the surface of the nanoparticle.
Figure 2.
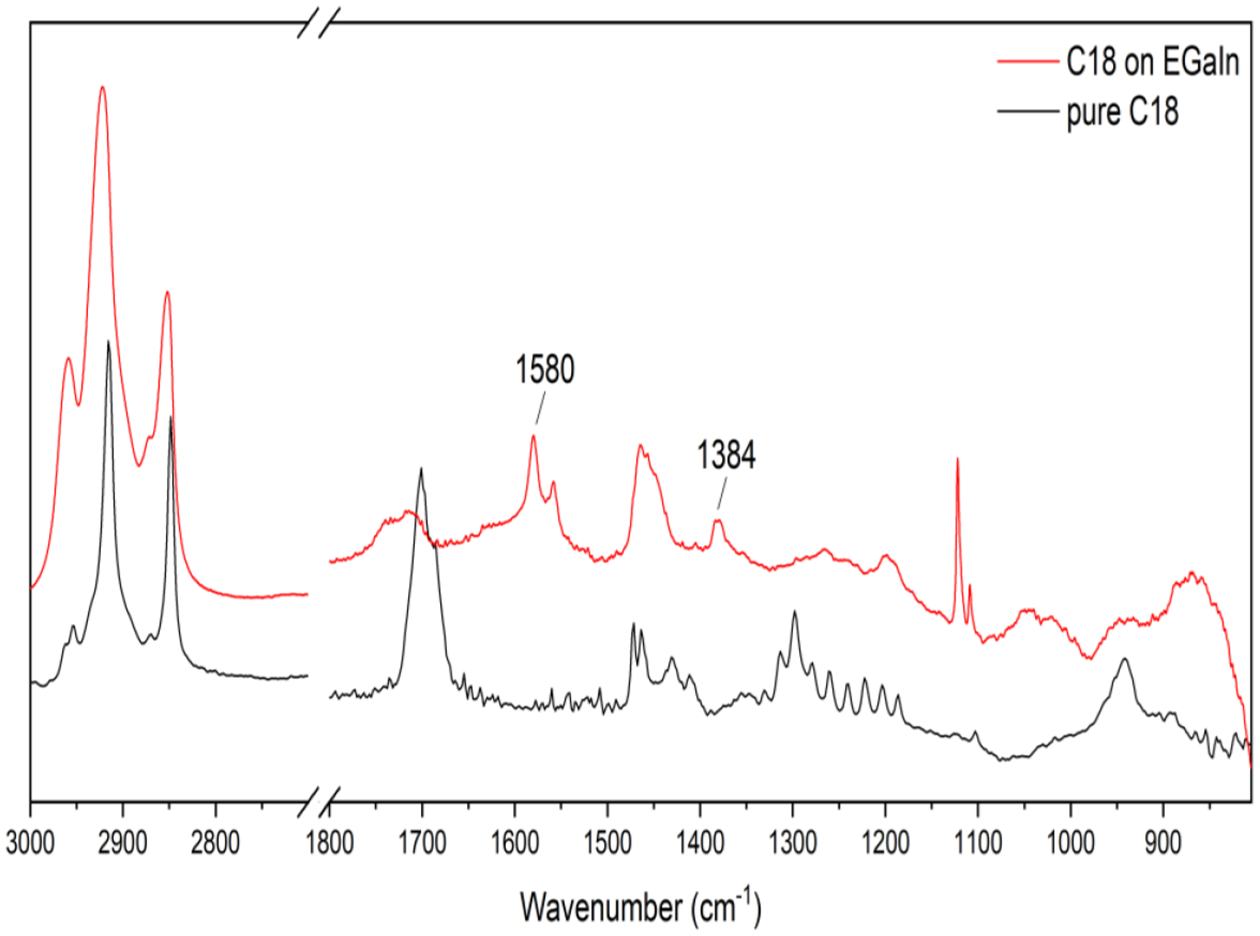
DRIFTS spectra of pure stearic acid and stearic acid coated EGaIn CSNs.
It is interesting to note that, the COO– asymmetric stretch consists of a doublet around 1580 and 1550 cm−1. Moreover, the formation of a carboxylate is marked by the dramatically weakening of C=O around 1700 cm−1 and -OH bend (out of plane) around 950 cm−1. For metal-oxide nanoparticles, ligand molecules normally coordinate to the metal ions by a chelating or bridging bidentate bonding and this coordination structure can be determined by the wavenumber separation between the asymmetric and symmetric band in the spectrum. The chelating bidentate bonding has wavenumber separation <110 cm−1 and that of bridging bidentate structure is 140–190 cm−1.[40] The wavenumber separation for stearic acid coated EGaIn CSNs is about 196 cm−1 suggesting that the carboxylate forms bidentate bridging bond with the gallium atoms. In general, it can be seen that all the acids were found to form carboxylate films that are conformationally unstable or defective in some manner on the EGaIn CSNs.
2.3. Topographical analysis
Tapping mode AFM was used to collect topographical images of the coated EGaIn CSNs. Multiple areas on each sample were investigated and about 15–30 images were collected for each sample. The areas to be scanned were chosen based on the appearance of clear morphological data. AFM images of all the different carboxylate coated EGaIn CSNs are shown in Figure 3, where individual EGaIn CSNs (yellow spheres) appear on a flat mica surface (orange background). Additionally, there are some small particles or other contaminants that can be seen within the background, but the large yellow spheres represent the coated EGaIn CSNs. The images shown in Figure 3 were chosen based on the number of nanoparticles on each image and do not reflect a size comparison of the nanoparticles which will be discussed in detail later. The images show spherical or mostly spherical particles with a smooth surface texture. Visually, there does not seem to be any significant difference in the morphology of the nanoparticles due to the alkyl chain length (C0 - C18) of the carboxylate ligands.
Figure 3.
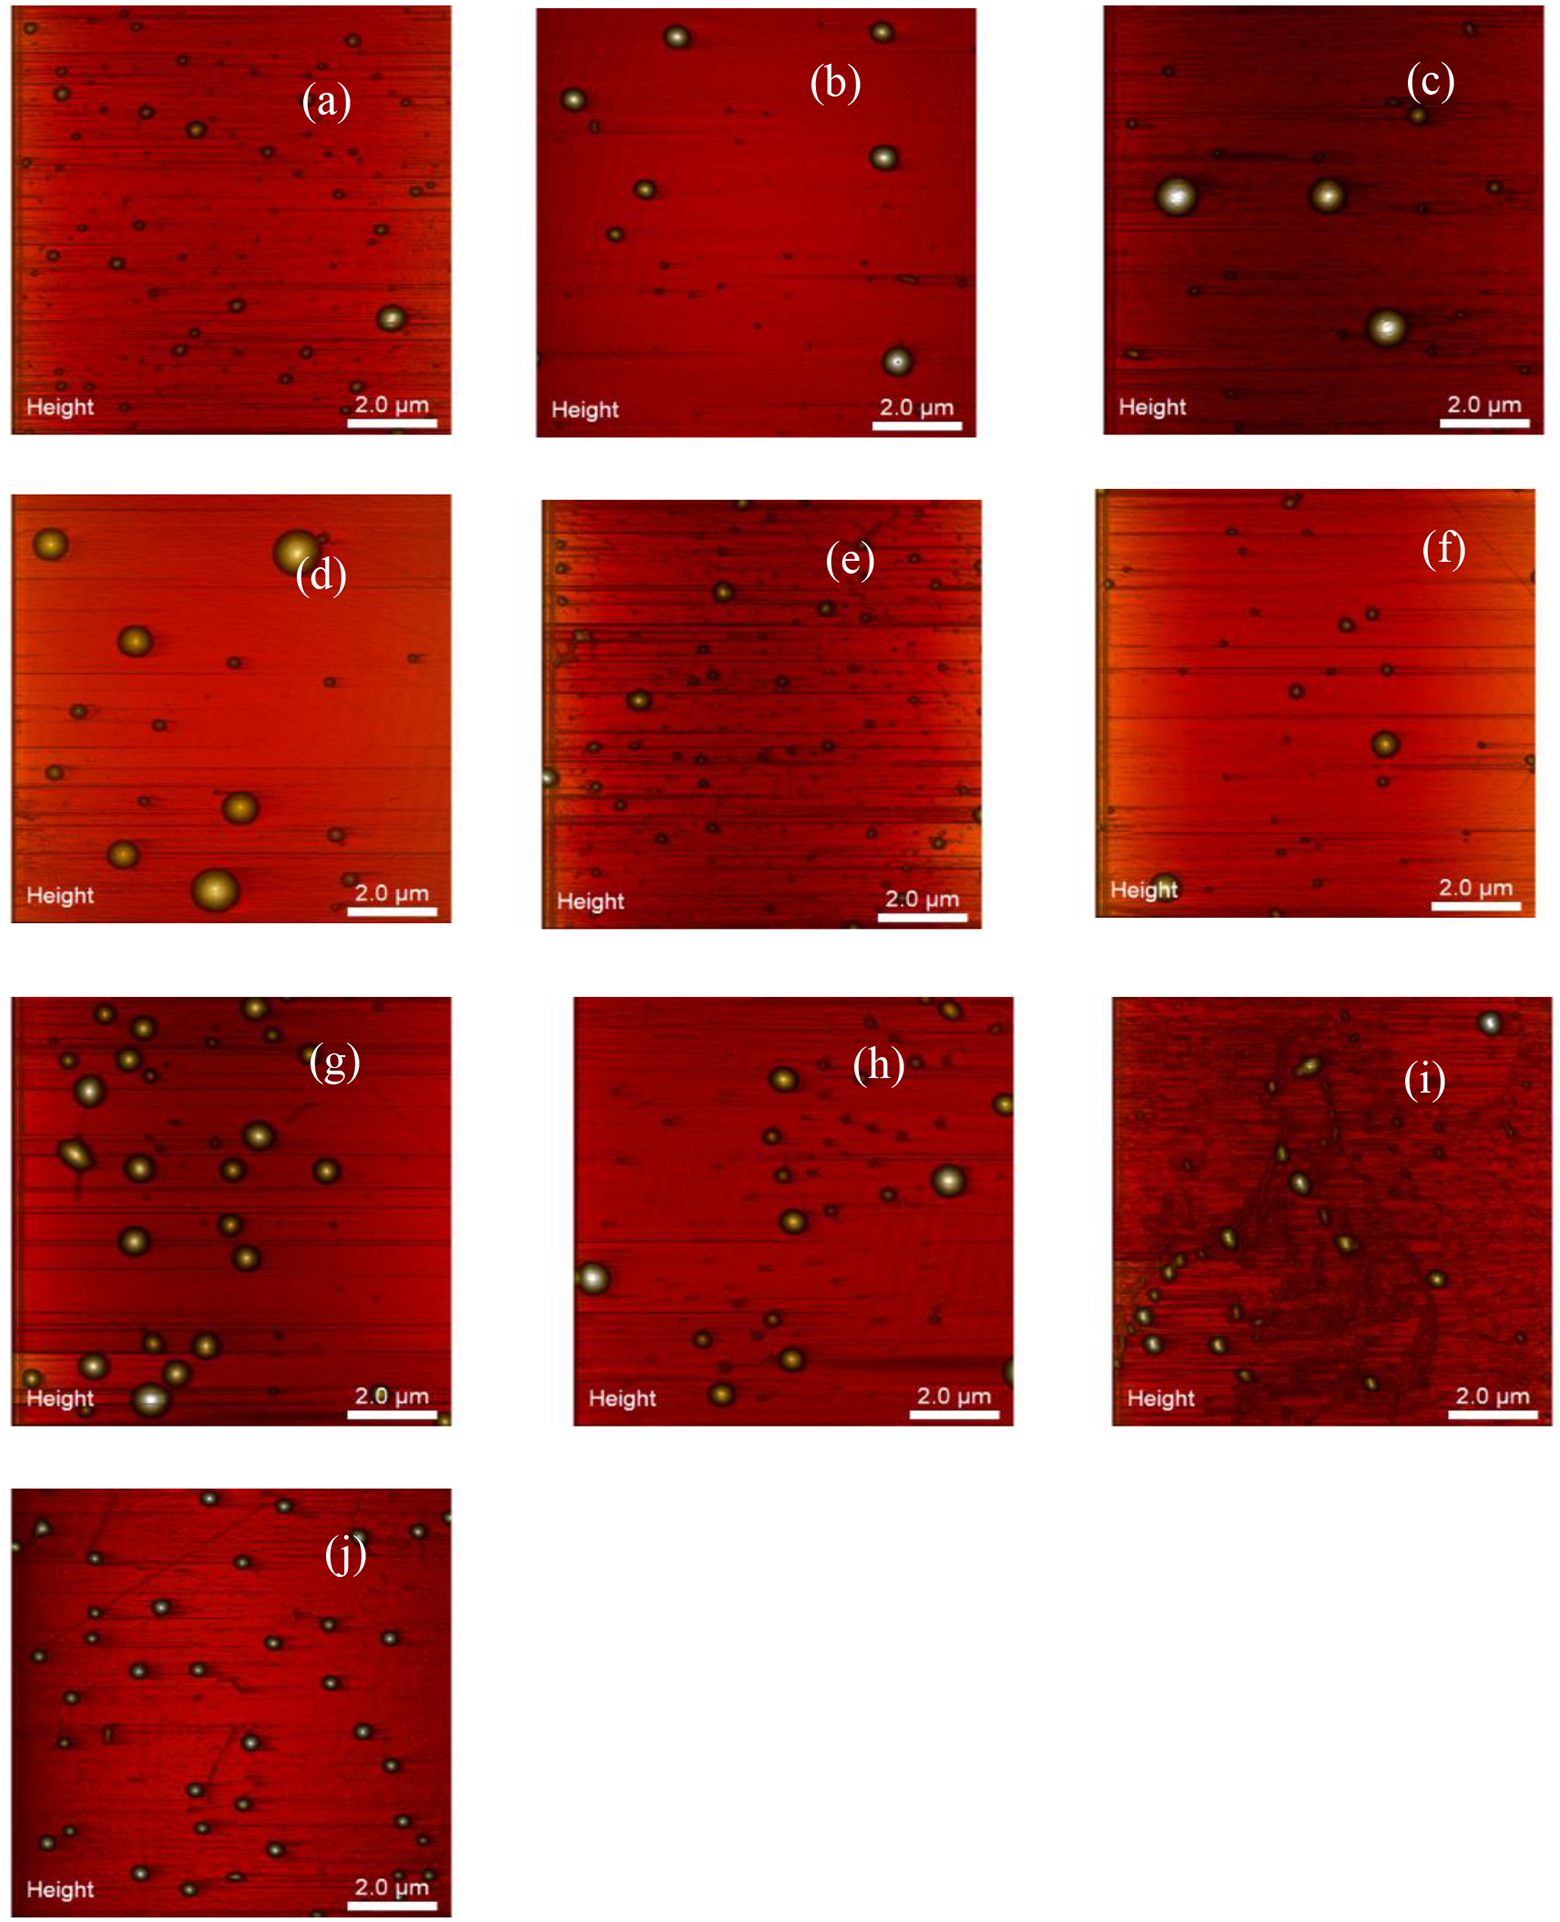
Topographical images of EGaIn CSNs coated with carboxylic acids with ligand identifier of (a) C0 (b) C2 (c) C4 (d) C6 (e) C8 (f) C10 (g) C12 (h) C14 (i) C16 (j) C18 obtained by AFM tapping mode. The images are 3D height representative image.
Each individual AFM image in Figure 3 shows a collection of nanoparticles, mostly <100 nm in size; however, to get a true measure of their sizes further analysis must be performed. The diameters of EGaIn CSNs were measured in the AFM images using sectional analysis. Since the particles are spherical, the peak height corresponds to the diameter of the particle. For each sample, a minimum of 200 height measurements were performed to determine the particle size distribution, the average and average deviation are reported as average ± average deviation in Figure 4. Example histograms for acetate (C2) and stearate (C18) coated EGaIn CSNs are shown in Figure 4(a, b) and histograms for all other measured CSNs are shown in Figure S3. All sizes were measured on individual particles only. AFM was chosen over traditional analytical techniques such as dynamic light scattering (DLS) for size measurements because some studies have concluded that AFM is more accurate in determining size distribution for polydisperse samples.[41–43] The average diameter for EGaIn CSNs coated with acetate, the shortest chain carboxylic acid used to react with the surface, was determined to be 44 ± 19 nm. The averaged diameter of the particles was found 21 ± 3 nm for stearate coated EGaIn CSNs, the longest chain carboxylate considered in the study. The size distribution results for all carboxylate coated EGaIn results are summarized more quantitatively in Figure 4(c, d). From Figure 4a it can be seen that for EGaIn CSNs created in acetic acid, a larger average diameter was observed with a wide size distribution from 5 to 65 nm. The double peak on C2 suggests both small and large particles were formed. The bimodal size distribution is indicative of coalescence. For C18 one peak suggests that the sample was monodispersed due to the increased interfacial colloidal stability created by the longer carboxylate chain. Interestingly, figure 4c clearly shows that octanoic acid (C8) creates the smallest sized nanoparticles. DLS measurements, shown in Table S4, suggest that it is a less suitable technique for these nanoparticles since the presence of a small fraction of larger size particles scatter more light than the small nanoparticles that dominate the sample by number concentration as AFM data suggests.
Figure 4.
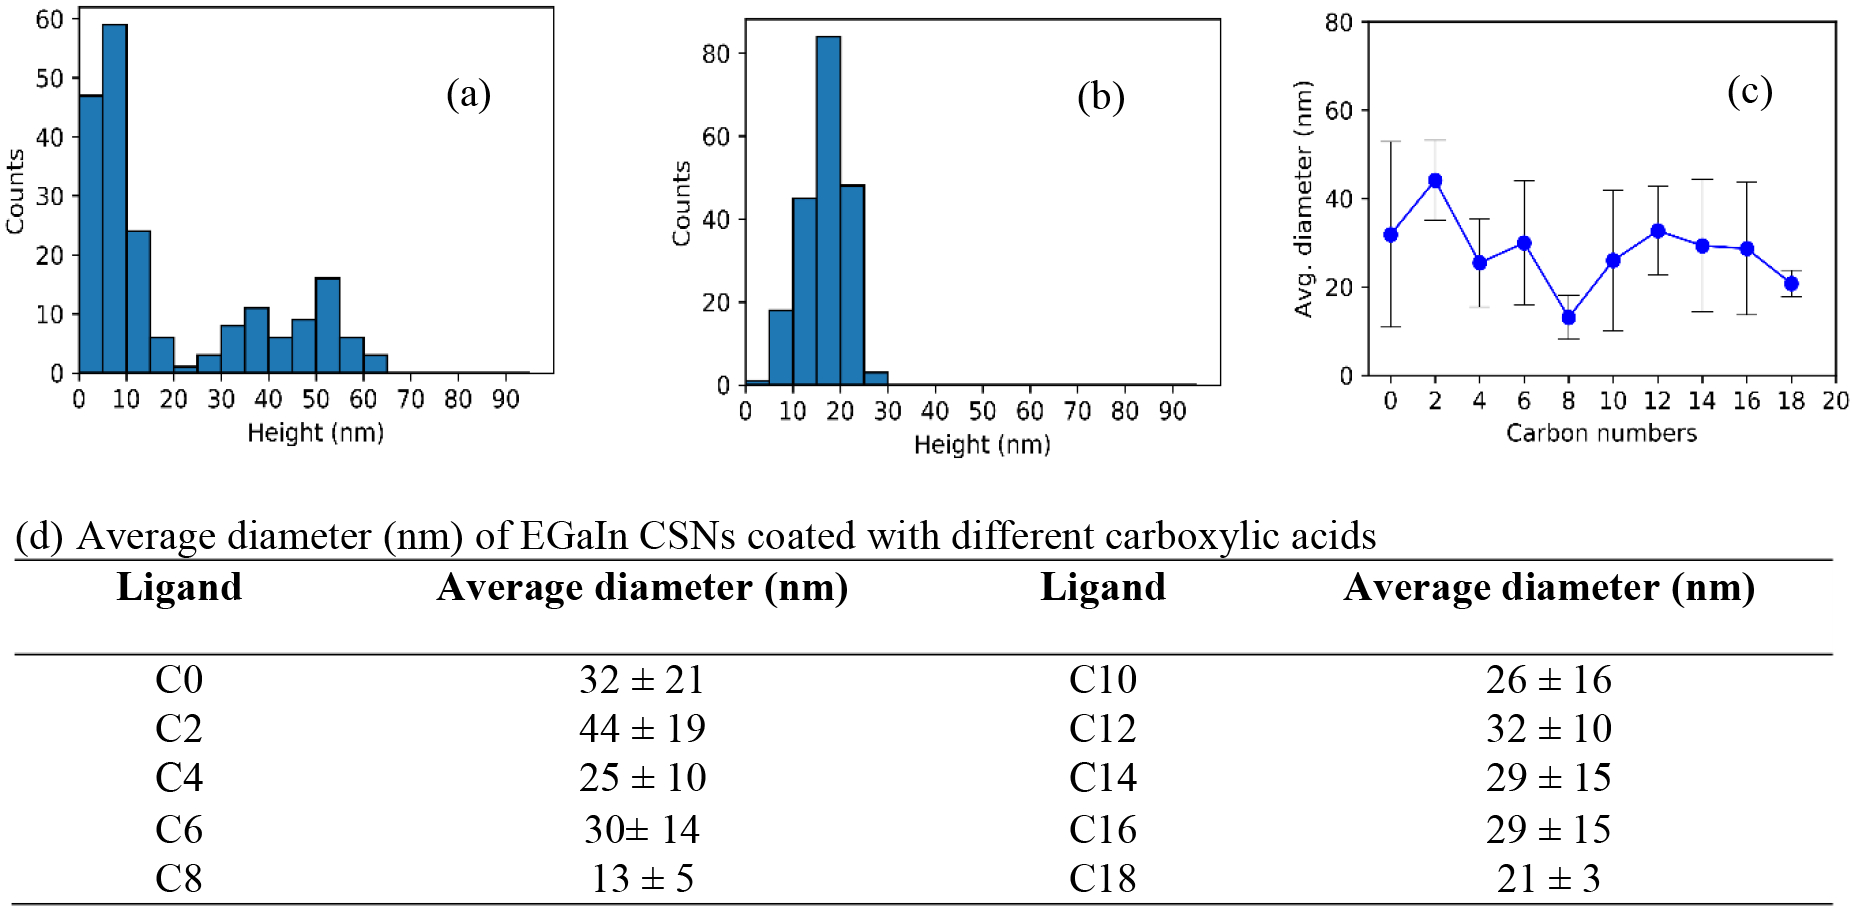
Size distribution of 200 EGaIn CSNs coated with different carboxylic acids (a) C2 (b) C18. (c) Average diameter vs. hydrocarbon chain length with the average deviation as error bars. (d) Average diameter (nm) of EGaIn CSNs coated with different carboxylic acids.
For EGaIn CSNs, ligand adsorption to the gallium oxide thin outer shell is dictated by the reaction with -COOH, resulting in the formation of a surface carboxylate. The EGaIn CSNs synthesized without any carboxylate coating has an average diameter of 32 ± 21 nm, showing the broad size distribution of the sample. Figure 4c indicates that the particle size does not overly depend on the alkyl chain length or the structure of the carboxylate, with a minimum particle size for C8-EGaIn CSNs. However, changes in alkyl chain conformation may influence the colloidal stability of these nanoparticles. Previous studies have shown that alkanethiol monolayers on gold substrate of 16 carbons or greater exhibit more order in an all trans configuration whereas those with carbon 8 or lesser show disorder because of more gauche defects.[44,45] Possibly EGaIn CSNs coated with shorter chains exhibit a relatively disordered structure with a large number of gauche defects and are most likely oriented randomly on the surface, thus resulting in surface variability in the particles which is observed as a broad size distribution. With an increase in the alkyl chain to C18, chain disorder is decreased leading to chains oriented in a more orderly fashion with some tilt and a few gauche defects which will be expanded upon later. This could result in more densely packed carboxylates on the surface of EGaIn CSNs through hydrocarbon-hydrocarbon interactions and stabilizing Van der Waals forces exerted by the surrounding hydrocarbon chains,[46,47] thus controlling the size distribution more effectively. However, on gold nanoparticles it was determined that when the diameter is less than 20 times the length of the ligand in its extended conformation, the particle curvature can affect the ligand layer thickness.[48] Therefore, even if the intermolecular van der Waals interactions between the carboxylates drive the C18 coated nanoparticles to be densely packed and well-ordered, it is likely that the long chain carboxylates will have a higher tilt angle due to nanoparticle curvature, and the total shell thickness will be less than the length of the fully extended ligand.[49] In general, the data indicates that significant changes in nanoparticles size distribution occur for C8 and C18 carboxylates creating CSNs with a narrow size distribution. For all of the carboxylate coated EGaIn CSNs, there is a fairly narrow span of particle size, ranging from 13–33 nm in diameter for a carboxylate chain of 4 carbons or larger, with no clear trend resulting from the length of the chain; however, size distribution of the nanoparticles becomes narrower due to interfacial stabilization in the longest alkyl chain, C18.
2.3. AFM force curve analysis
Force distance (F-D) curves measure the deflection of the AFM cantilever as a function of distance as it interacts with a surface, providing information about surface mechanical parameters such as adhesion, stiffness, hardness, and shell thickness.[42,50] To better understand the nature of the ligand modified oxide shell on the EGaIn CSNs, F-D curves were used to investigate mechanical properties of EGaIn CSNs coated with carboxylates containing varying lengths of alkyl chains. Figure 5a shows a sample F-D curve for the EGaIn CSNs coated with acetate which measures the force on the cantilever as a function of distances from the EGaIn CSNs surface. In F-D curves, a positive force shows that the EGaIn CSN is pushing against the tip (repulsive forces), and a negative force indicates the EGaIn CSN is pulling the tip (attractive forces) and is thus a measure of the intermolecular forces between the tip and the substrate. Upon approach (in black), zero force was acting between the sample and the tip until, at a separation of ~0.17 μm, the tip jumps onto the sample surface (this is the jump to contact point) followed by repulsion as the tip compresses the sample. Upon retraction (in red), the tip is being pulled off the sample surface and a stretched pull-off force (adhesion force) is detected at separation distances between 0.12–0.3 μm. Force distance curves for EGaIn CSNs coated with all the different lengths of carboxylates are shown in Figure S6.
Figure 5.
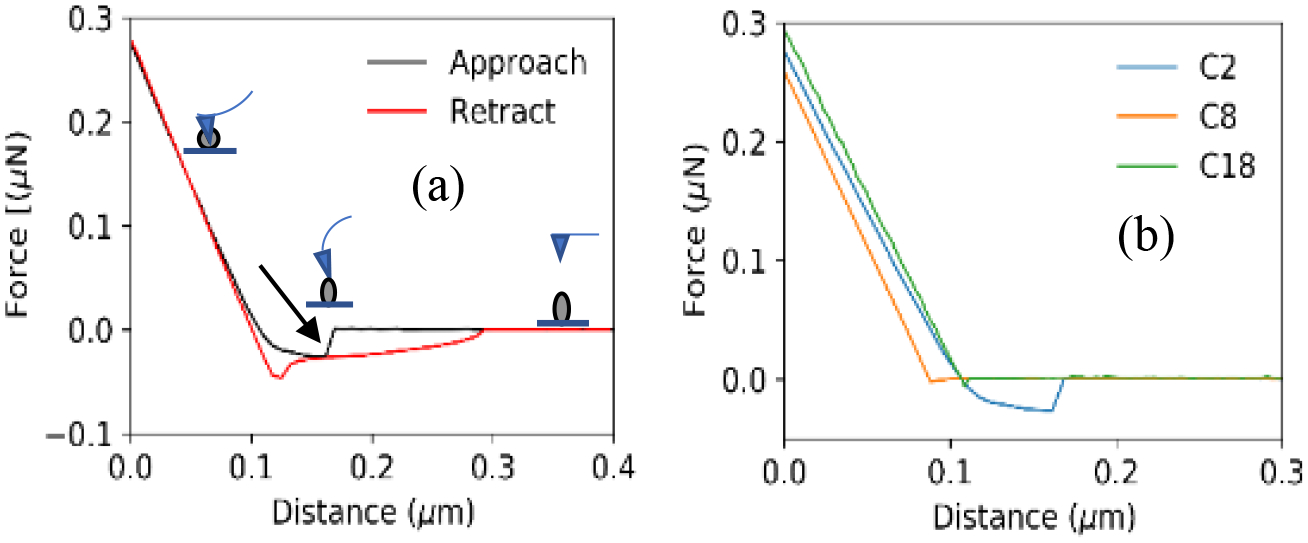
(a) A typical force-distance curve for EGaIn CSNs coated with acetate. The black curve shows the approach of the tip towards the sample and the red curve shows the retraction of the tip from the sample surface. The black arrow shows the penetration of the CSN by the AFM tip. (b) Approach curves for particles coated with different carboxylic acids of carbon number C2, C8 and C18 for stiffness comparison.
While approaching (the black curve in Figure 5a), the tip is not in contact with the C2 coated EGaIn CSNs between the distance 0.2–0.4 μm. But after reaching the contact point at ~0.18 μm, the tip begins to compress the carboxylate shell. At ~0.17 μm, there is a sudden penetration of this layer (marked by the arrow in Figure 5a) and the tip is in contact with the inner liquid core of the particle indicated by the negative dip the line. As the tip pushes more into the liquid core, no further penetration is observed finally reaching a distance of 0 μm when the tip is in contact with the hard silicon surface. During retraction (red line in Figure 5a), the pull off region (at 0.12–0.3 μm separation) is different due to the liquid and adhesion of the oxide shell/liquid core of the EGaIn CSN that holds the tip. Further separation of the tip and sample stretches the liquid until it breaks apart. The nonlinearity in the contact regime of the approach is caused by flexibility of the viscoelastic shell. Figure 5b shows the approach curves for 3 different EGaIn CSNs coated with C2, C8, and C18 carboxylates. Interestingly, the sudden penetration observed in C2 CSNs is not seen in C8 or C18 CSNs or any other ones (see Figure S6).
When the chain length of the coated carboxylate is increased, the slope of the F-D curves also changes, which provides information about the effect of the chain length of the aliphatic group on the mechanical properties of the EGaIn CSNs. Particle shell stiffness is a measure of the stability of the shell. It can be calculated from the slope of the repulsive contact region of the approach curve defined by
| (1) |
where k is the stiffness of the shell, f is the force, and δ is the tip-sample separation of the AFM.[14] The approach curves are used for stiffness calculation as the AFM tip pushes on the sample upon approach and deflects depending on the stiffness of the sample surface. For each type of EGaIn CSN, 15 different approach curves from 15 individual particles were used to calculate the average shell stiffness (see Figure S5 for an example). The average shell stiffness of all EGaIn CSNs coated with different chain length carboxylates are plotted as a function of length and tabulated in Figure 6. The error bars of the averaged values likely stem from subtle differences in the EGaIn CSNs size. It is apparent in Figure 5b that there are differences in the slopes and jump to contact points as the EGaIn CSNs were coated with different chain length carboxylates. The slope of the curve for C8 is little bit steeper than that of C2 and C18 resulting in a higher stiffness value.
Figure 6.
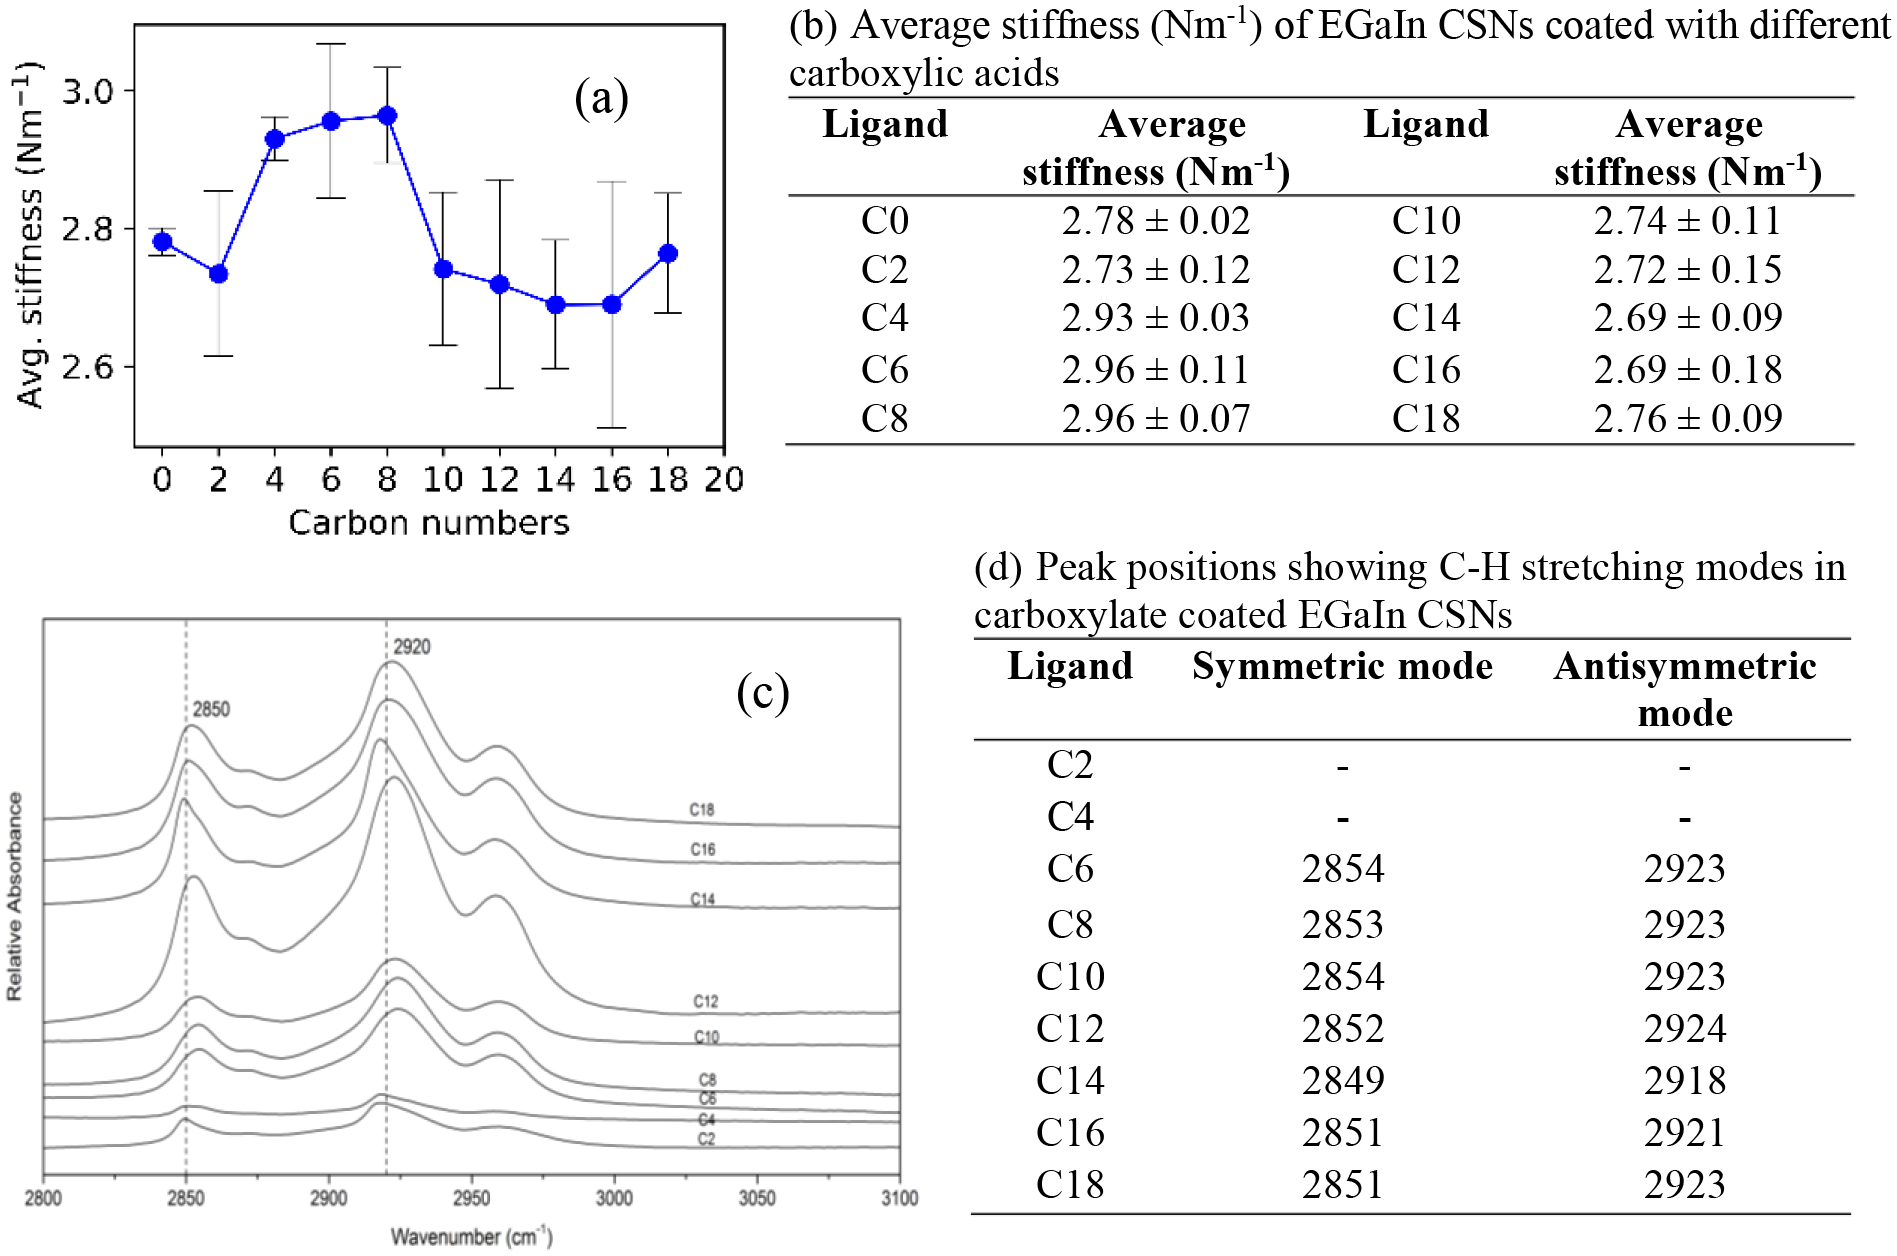
(a) Average stiffness vs. hydrocarbon chain length of coated carboxylate with the standard deviation as error bars. (b) Average stiffness (N m−1) of EGaIn nanoparticles coated with different carboxylates (c) DRIFTS spectra of all the acid coated EGaIn CSNs at C-H stretching region (2800 – 3000 cm−1) (d) Peak positions showing C-H stretching modes in carboxylate coated EGaIn CSNs
A plot of average shell stiffness as a function of carboxylate chain length is presented in Figure 6a, which shows there is a maximum stiffness with a C8 coating. In order to understand this deformation process, it is necessary to understand the structural changes occurring to the sample during compression. DRIFTS can be used to investigate the conformation of the alkyl chain. Previous studies on 2D-SAMs have shown that the C-H stretching region for methylene (-CH2- group) contain valuable information about the orientation of the alkyl chains.[51] For example, the position of the symmetric and antisymmetric peaks of the methylene stretching vibration with chain length indicate the conformational order of the alkyl chains.[51,52] For crystalline, all trans alkyl chains, the symmetric and antisymmetric methylene bands appear at 2850 and 2918 cm−1, respectively; whereas, for alkyl chains with a liquid-like structure containing gauche defects, these bands appear at slightly higher wavenumbers 2855 and 2924 cm-1, respectively.[51–54] Figure 6(c & d) present a closer look at the DRIFTS spectra of the C-H stretching modes from methylene -CH2- in the region between 2800–3000 cm−1. A comparison of the peak positions (figure 6c) reveals that as the length of the alkyl chain decreases, the peaks shift towards higher wavenumbers. Until C10, the shifts are +4 and +5 cm−1 for these modes indicating a possibly liquid like surface. For C12-C18 the symmetric modes are between 2849–2852 cm−1, within ±2 cm−1 of the position designated for a crystalline phase. However, the asymmetric mode of these alkyl chain has shifted more than +3 from the crystalline phase indicating presence of some disorder which is possibly from the end gauche defects for the longer chain (except for C14). This behavior had been reported previously for C18/Au colloids where the alkyl chains are in coexistence with extended all-trans chains and a smaller population of liquid-like disordered chains at room temperature.[55,56] Therefore, C12 -C18 alkyl chains are not completely all trans rather is a combination of all trans with higher number of end gauche defects. The bands for C4 has a very low intensity and it is difficult to assign the peak and C2 doesn’t have any -CH2- groups. From the DRIFTS analysis it was determined that CSNs coated with the shorter chain alkyl carboxylates (C10 and less) exhibit a more disordered, liquid-like surface, while those coated with longer chains (C12 and greater) exhibit a more ordered, crystalline-like surface.
AFM f-d measurements can provide more insights into the conformation of the alkyl chains under compression. The stiffness values suggest that the pressure exerted by the AFM tip can create distortion to the surface of CSNs coated with the short chain molecules; however, on the CSNs coated with longer alkyl chains, the pressure can form more gauche defects at the end of the chain resulting in more disorder.[55] Perhaps increasing the chain length from C2 to C8, the force exerted by the tip is not enough to create substantial distortion within the chain because of an absence of end gauche defects. Thus, there is a dramatic increase in the stiffness of the particle surface leading C8 to a maximum suggesting that the surface coatings are more ordered and rigid. However, the sudden decrease in stiffness from C10-C18 could be due to the substantial distortion of the chains induced by the tip pressure because of the already existing higher number of end gauche defects. Therefore, the long alkyl chains on the spherical nanoparticles may curl up on the surface resulting in more defects which is not seen on a flat gold substrate.[57] Thus, as the AFM tip compresses the coated EGaIn CSNs, energy is dissipated by creating more end gauche defects in the longer hydrocarbon chains and the overall rigidity of the carboxylate shell is decreased.
3. Conclusion
EGaIn CSNs have been created by functionalizing nanoparticles with aliphatic carboxylates of different alkyl chain length and detailed investigations on the stabilization of EGaIn CSNs are presented exploring the effect of alkyl chain length. Analysis of AFM topographical images of EGaIn CSNs coated with different chain lengths of aliphatic carboxylates, from C2 to C18, reveals that the size of EGaIn CSNs are mostly independent of the size of the straight chained carboxylate ligand; however, there is a slight decrease in average diameter when particles are coated with C8. The propensity of creating more uniform size EGaIn CSNs is greater when coated with C18 compared to less than C18 indicates that the structure and conformation of the alkyl chain influence the particle uniformity, but further investigation is needed for EGaIn CSNs coated with bulky or longer ligand molecules. Additionally, analysis of DRIFTS and AFM F-D curves of the EGaIn CSNs reveals the effect of orientation of terminal alkyl chain in stiffness of the shell of the EGaIn CSNs. The results can be attributed to an increase in order in the monolayers of carboxylate coating the surface of the EGaIn CSNs. The calculated stiffness of the carboxylate coated EGaIn CSNs reflects three interface regions transitioning from disordered and poorly formed interface (C2), to somewhat ordered (C4-C8) and finally to a transition zone (C10-C18) which is in coexistence with extended all trans conformation with a higher population of end gauche defects resulting into more distortion within the chains under compression. Thus, it has been shown that changing the ligand length provides a method to understand the role ligands play on the structural stability as well as mechanical properties of liquid metal CSNs. Additionally, it has been shown AFM is an effective and powerful tool for providing a total picture of the surface properties of these coated EGaIn CSNs. These results are important since understanding the chemistry of the ligand-particle interface represents state of the art for designing these next generation core-shell liquid metal nanoparticles for use in a multitude of applications.
4. Experimental Section
Materials
All chemicals were purchased from Sigma-Aldrich (Allentown, PA, USA) except ethanol (190 proof), which was purchased from Pharmaco-Aaper and used as received.
Synthesis
EGaIn particles were synthesized in carboxylic acids in ethanolic solution using a previously reported procedure, the SLICE method, to synthesize core–shell EGaIn particles.23 EGaIn (30μL) was added in a flat-top glass vial, which contained acid solution in ethanol (10mL, 5mM). The EGaIn droplet was then sheared using cross shaped polytetrafluoroethylene (PTFE) shearing implement. The supply voltage of the tool was adjusted to 55 V by a variable transformer to maintain a fixed rotational speed. Shearing time was 30 min and settling time was 2 hours. The larger particles settle to the bottom of the vial and the nanoparticles remain dispersed in the supernatant. Afterwards, the supernatant is decanted, resuspended in ethanol (50:50), drop cast on the freshly cleaved mica substrate, washed with DI water and dried. The sample was then ready for AFM topographical analysis. To get the AFM based size distribution of each kind CSNs at least three samples and a total of 200 particles were analyzed. For the force measurements same procedure was followed except a Si wafer was used as substrate. Undoped silicon wafers were cut into squares, sonicated in acetone and dried with N2 gas.
Atomic force microscopy (AFM)
AFM measurements were performed with Bruker Innova AFM under ambient conditions. All measurements were performed in taping mode. Silicon probes (Bruker) with a spring constant of 2.8 Nm−1 were used. The topographical images and force-distance curves were recorded at 512 line resolution. The deflection vs. displacement plots were converted into force vs. distance plots using the probe signal sensitivity (nm V−1) and spring constant (nN nm−1). The images were processed using NanoScope Analysis software (Bruker). The force curves were processed using a custom MATLAB procedure.
Raman spectroscopy
Raman measurements were performed with a Bruker SENTERRA confocal Raman Microscope in air using a 532 nm laser, 20 mW of laser power and a 9–15 cm−1 resolution. The light was focused to a spot size of approximately 2 μm in diameter, using a 50x objective and a slit aperture of 50×1000 μm. The xyz movement was controlled accurately using a motorized stage. Raman signals for cluster of EGaIn nanoparticles with different carboxylates combination were collected at multiple spots using a 10s integration time and 2 coadditions at each selected spot in order to reduce the signal-to-noise ratio. Spectra were collected in the wavenumber range of 45 – 4450 cm−1.
Diffuse reflectance infrared spectroscopy
Infrared spectra (128 scans, 2 cm−1 resolution) were collected using a Nicolet iS 50 FT-IR spectrometers (Thermo Fisher Scientific, MCT-High D* detector) equipped with a Praying Mantis diffuse reflectance accessory (Harrick Scientific). The Praying Mantis accessory was situated inside the sample compartment of the FTIR, which was under constant N2 purge. The EGaIn CSNs was drop cast on KBr powder filled sample cup.
Dynamic Light Scattering
Zetasizer Nano ZS Dynamic Light Scattering Instrument (Malvern Panalytical) was used to measure the hydrodynamic diameter and polydispersity index of the EGaIn. The measurements reported are an average of three separate readings.
Supplementary Material
Eutectic Gallium Indium (EGaIn).
Eutectic Gallium Indium (EGaIn) liquid metal nanoparticles are created in solutions of n-alkane fatty acids resulting in core-shell nanoparticles (CSNs) coated in carboxylates of varying alkyl chain length. Atomic force microscopy (AFM) and vibrational spectroscopies (DRIFTS, Raman) reveal that changing the chain-length of the carboxylate ligand has an effect on the size, stability, and robustness of the CSNs.
Acknowledgements
This research was supported by the NCI funded UMass Boston – DF/HCC U54 Partnership (grant number U54 CA156734) and a Sanofi Genzyme Doctoral Research Fellowship. We thank Tayyaba Hasan at the Wellman Center for Photomedicine at Massachusetts General Hospital for the DLS measurements and Hasnain Hafiz at Carnegie Mellon University for helping with MATLAB code development.
References
- [1].Sheng L, Zhang J, Liu J, Adv. Mater 2014, 26, 6036. [DOI] [PubMed] [Google Scholar]
- [2].Zhang J, Yao Y, Sheng L, Liu J, Adv. Mater 2015, 27, 2648. [DOI] [PubMed] [Google Scholar]
- [3].Liang S, Liu J, Sci. China Technol. Sci 2018, 61, 110. [Google Scholar]
- [4].Lu T, Wissman J, Ruthika C. Majidi, ACS Appl. Mater. Interfaces 2015, 7, 26923. [DOI] [PubMed] [Google Scholar]
- [5].Kramer RK, Majidi C, Wood RJ, Adv. Funct. Mater 2013, 23, 5292. [Google Scholar]
- [6].Zheng Y, Zhang Q, Liu J, AIP Adv. 2013, 3, 112117. [Google Scholar]
- [7].Tabatabai A, Fassler A, Usiak C, Majidi C, Langmuir 2013, 29, 6194. [DOI] [PubMed] [Google Scholar]
- [8].Wang L, Liu J, Sci. China Technol. Sci 2014, 57, 1721. [Google Scholar]
- [9].Tang S-Y, Zhu J, Sivan V, Gol B, Soffe R, Zhang W, Mitchell A, Khoshmanesh K, Adv. Funct. Mater 2015, 25, 4445. [Google Scholar]
- [10].Gao M, Gui L, Lab Chip 2014, 14, 1866. [DOI] [PubMed] [Google Scholar]
- [11].Jeong SH, Hagman A, Hjort K, Jobs M, Sundqvist J, Wu Z, Lab. Chip 2012, 12, 4657. [DOI] [PubMed] [Google Scholar]
- [12].Yi L, Jin C, Wang L, Liu J, Biomaterials 2014, 35, 9789. [DOI] [PubMed] [Google Scholar]
- [13].Lu Y, Hu Q, Lin Y, Pacardo DB, Wang C, Sun W, Ligler FS, Dickey MD, Gu Z, Nat. Commun 2015, 6, 10066. [DOI] [PMC free article] [PubMed] [Google Scholar]
- [14].Lear TR, Hyun S-H, Boley JW, White EL, Thompson DH, Kramer RK, Extreme Mech. Lett 2017, 13, 126. [Google Scholar]
- [15].Zavabeti A, Ou JZ, Carey BJ, Syed N, Orrell-Trigg R, Mayes EL, Xu C, Kavehei O, O’mullane AP, Kaner RB, Science 2017, 358, 332. [DOI] [PubMed] [Google Scholar]
- [16].Liang S, Rao W, Song K, Liu J, ACS Appl. Mater. Interfaces 2018, 10, 1589. [DOI] [PubMed] [Google Scholar]
- [17].Hu Q, Chen Q, Gu Z, Biomaterials 2018, 178, 546. [DOI] [PubMed] [Google Scholar]
- [18].Bo G, Ren L, Xu X, Du Y, Dou S, Adv. Phys. X 2018, 3, 1446359. [Google Scholar]
- [19].Regan MJ, Tostmann H, Pershan PS, Magnussen OM, DiMasi E, Ocko BM, Deutsch M, Phys. Rev. B 1997, 55, 10786. [Google Scholar]
- [20].Dickey MD, Chiechi RC, Larsen RJ, Weiss EA, Weitz DA, Whitesides GM, Adv. Funct. Mater 2008, 18, 1097. [Google Scholar]
- [21].Finkenauer LR, Lu Q, Hakem IF, Majidi C, Bockstaller MR, Langmuir 2017, 33, 9703. [DOI] [PubMed] [Google Scholar]
- [22].Hohman JN, Kim M, Wadsworth GA, Bednar HR, Jiang J, LeThai MA, Weiss PS, Nano Lett. 2011, 11, 5104. [DOI] [PubMed] [Google Scholar]
- [23].Tevis ID, Newcomb LB, Thuo M, Langmuir 2014, 30, 14308. [DOI] [PubMed] [Google Scholar]
- [24].Boley JW, White EL, Kramer RK, Adv. Mater 2015, 27, 2355. [DOI] [PubMed] [Google Scholar]
- [25].Lin Y, Liu Y, Genzer J, Dickey MD, Chem. Sci 2017, 8, 3832. [DOI] [PMC free article] [PubMed] [Google Scholar]
- [26].Sudo S, Nagata S, Kokado K, Sada K, Chem. Lett 2014, 43, 1207. [Google Scholar]
- [27].Yamaguchi A, Mashima Y, Iyoda T, Angew. Chem. Int. Ed 2015, 54, 12809. [DOI] [PubMed] [Google Scholar]
- [28].Yu F, Xu J, Li H, Wang Z, Sun L, Deng T, Tao P, Liang Q, Prog. Nat. Sci. Mater. Int 2018, 28, 28. [Google Scholar]
- [29].Cutinho J, Chang BS, Oyola-Reynoso S, Chen J, Akhter SS, Tevis ID, Bello NJ, Martin A, Foster MC, Thuo MM, ACS Nano 2018, 12, 4744. [DOI] [PubMed] [Google Scholar]
- [30].Chan JW, Motton D, Rutledge JC, Keim NL, Huser T, Anal. Chem 2005, 77, 5870. [DOI] [PubMed] [Google Scholar]
- [31].Otero V, Sanches D, Montagner C, Vilarigues M, Carlyle L, Lopes JA, Melo MJ, J. Raman Spectrosc 2014, 45, 1197. [Google Scholar]
- [32].Sobanska S, Barbillat J, Moreau M, Nuns N, De Waele I, Petitprez D, Tobon Y, Brémard C, Phys. Chem. Chem. Phys 2015, 17, 10963. [DOI] [PubMed] [Google Scholar]
- [33].Shafiei M, Hoshyargar F, Motta N, O’Mullane AP, Mater. Des 2017, 122, 288. [Google Scholar]
- [34].Han J, Yang J, Tang J, Ghasemian MB, Hubble LJ, Syed N, Daeneke T, Kalantar-Zadeh K, J. Mater. Chem. C 2019, 7, 6375. [Google Scholar]
- [35].Marekha BA, Bria M, Moreau M, De Waele I, Miannay F-A, Smortsova Y, Takamuku T, Kalugin ON, Kiselev M, Idrissi A, J. Mol. Liq 2015, 210, 227. [Google Scholar]
- [36].Oomens J, Steill JD, J. Phys. Chem. A 2008, 112, 3281. [DOI] [PubMed] [Google Scholar]
- [37].Bai KS, Proc. Indian Acad. Sci. - Sect. A 1940, 11, 212. [Google Scholar]
- [38].Robinet L, Corbeil-a M-C, Stud. Conserv 2003, 48, 23. [Google Scholar]
- [39].Mesubi MA, J. Mol. Struct 1982, 81, 61. [Google Scholar]
- [40].Taguchi M, Yamamoto N, Hojo D, Takami S, Adschiri T, Funazukuri T, Naka T, RSC Adv 2014, 4, 49605. [Google Scholar]
- [41].Baalousha M, Lead JR, Colloids Surf. Physicochem. Eng. Asp 2013, 419, 238. [Google Scholar]
- [42].Martin Y, Williams CC, Wickramasinghe HK, J. Appl. Phys 1987, 61, 4723. [Google Scholar]
- [43].Baalousha M, Lead JR, Environ. Sci. Technol 2012, 46, 6134. [DOI] [PubMed] [Google Scholar]
- [44].Comeau KD, Meli MV, Langmuir 2012, 28, 377. [DOI] [PubMed] [Google Scholar]
- [45].Si KJ, Chen Y, Shi Q, Cheng W, Adv. Sci 2018, 5, 1700179. [DOI] [PMC free article] [PubMed] [Google Scholar]
- [46].Ulman A, Chem. Rev 1996, 96, 1533. [DOI] [PubMed] [Google Scholar]
- [47].Yamamoto M, Kashiwagi Y, Nakamoto M, Langmuir 2006, 22, 8581. [DOI] [PubMed] [Google Scholar]
- [48].Heinz H, Pramanik C, Heinz O, Ding Y, Mishra RK, Marchon D, Flatt RJ, Estrela-Lopis I, Llop J, Moya S, Ziolo RF, Surf. Sci. Rep 2017, 72, 1. [Google Scholar]
- [49].Hinterwirth H, Kappel S, Waitz T, Prohaska T, Lindner W, Lämmerhofer M, ACS Nano 2013, 7, 1129. [DOI] [PMC free article] [PubMed] [Google Scholar]
- [50].Cappella B, Dietler G, Surf. Sci. Rep 1999, 34, 1. [Google Scholar]
- [51].Zhang S, Leem G, Srisombat L, Lee TR, J. Am. Chem. Soc 2008, 130, 113. [DOI] [PubMed] [Google Scholar]
- [52].Snyder RG, Strauss HL, Elliger CA, J. Phys. Chem 1982, 86, 5145. [Google Scholar]
- [53].Porter MD, Bright TB, Allara DL, Chidsey CED, J. Am. Chem. Soc 1987, 109, 3559. [Google Scholar]
- [54].Hostetler MJ, Stokes JJ, Murray RW, Langmuir 1996, 12, 3604. [Google Scholar]
- [55].Badia A, Gao W, Singh S, Demers L, Cuccia L, Reven L, Langmuir 1996, 12, 1262. [Google Scholar]
- [56].Badia A, Cuccia L, Demers L, Morin F, Lennox RB, J. Am. Chem. Soc 1997, 119, 2682. [Google Scholar]
- [57].Griesemer SD, You SS, Kanjanaboos P, Calabro M, Jaeger HM, Rice SA, Lin B, Soft Matter 2017, 13, 3125. [DOI] [PubMed] [Google Scholar]
Associated Data
This section collects any data citations, data availability statements, or supplementary materials included in this article.


