Abstract
The outbreak of COVID-19 pandemic has impacted all the aspects of environment. The numbers of COVID-19 cases and deaths are increasing across the globe. In many countries lockdown has been imposed at local, regional as well as national level to combat with this global pandemic that caused the improvement of air quality. In India also lockdown was imposed on 25th March, 2020 and it was further extended in different phases. The lockdown due to outbreak of COVID-19 pandemic has showed substantial reduction of PM2.5 concentrations across the cities of India. The present study aims to assess concentration of PM2.5 across 12 cities located in different spatial segments Indo-Gangetic Plain (IGP). The result showed that there was substantial decrease of PM2.5 concentrations across the cities located in IGP after implementation of lockdown. Before 30 days of lockdown, average PM2.5 across cities was 65.77 µg/m3 that reached to 42.72 µg/m3 during lockdown periods (decreased by 35%). Maximum decrease of PM2.5 concentrations has been documented in Lower Gangetic Plain (LGP) cities (57%) followed by Middle Gangetic Plain (MGP) cities (34%) and Upper Gangetic Plain (UGP) cities (27%) respectively. Among all the cities of IGP, maximum decrease of PM2.5 concentrations was recorded in Kolkata (64%) (LGP) followed by Muzaffarpur (53%) (MGP), Asansol (51%) (LGP), Patna (43%) (MGP) and Varanasi (33%) (MGP).Therefore, this study has an immense potentiality to understand the impact of lockdown on a physical region (Ganga River Basin) and it may be also helpful for planners and policy makers to implement effective measures at regional level to control air pollution.
Keywords: Lockdown, COVID-19, Indo-Gangetic Plain (IGP), Particle matter (PM2.5), Upper Gangetic Plain (UGP)
Introduction
COVID-19 has emerged as a serious global public health threats (Das et al. 2020). Due to outbreak of COVID-19, nationwide lockdown was implemented for the first time from 25th March to 14th April, 2020 for the first phase and lockdown was extended in different phases since 31st May, 2020. The functions of all industries and transportations that are the main source of air quality deteriorations were strictly prohibited. Thus lockout due to lockdown of industries and transpirations brought an immense alteration in pollution level across the cities of India. The pollution level started declining rapidly during first phases (25th March to 14th April, 2020) and more rapidly during third phase (4–17th May, 2020) respectively (CPCB, 2020). Many regions of the world experienced a dramatic reduction of air pollution due to implementation of lockdown. Wang et al. (2020) found that there was a significant decline of PM2.5 concentrations due to suspension of transportation and industrial activities. In India a number of research studies were performed to assess the concentration of PM2.5 across the cities previously (Nagar et al. 2019; Mahesh et al. 2019; Guttikunda et al. 2014; Chowdhury et al. 2019) but very few studies were conducted to examine the impact of lockdown on air quality. Particularly the concentration of aerosols (PM2.5) across the most polluted cities of India remains unexplored during COVID-19 pandemic. Considering this research gap, present study aims to assess the impact lockdown on the concentration of PM2.5 across the most polluted cities of India.
As per as report published by World Health Organization (WHO) (2018), a number of the cities of India were the most polluted that exceeded the tolerate limits. Out of 15 most polluted cities of the world, 14 cities are located in India in terms of PM2.5 concentrations. These most polluted cities are Kanpur (in Bihar) followed by Faridabad (in Haryana), Varanasi (in Uttar Pradesh), Gaya, Patna (in Bihar), Delhi, Lucknow (in Uttar Pradesh). The World Air Quality Report (2018) recorded the similar fact that Indian cities were the most polluted cities in the world. The report highlighted that out of 10 most polluted cities of the world seven cities were located in India (on the basis of average annual concentration). As per as this report, Gurugram was the most polluted city in the world (135.8 µg/m3) followed by Faridabad (129.1 µg/m3), Patna (119.7 µg/m3), Lucknow (115.7 µg/m3), Delhi (113.5 µg/m3). Even Delhi was the most polluted capital city of the world (average annual PM2.5 was 113.8 µg/m3). Most of these cities are located in Upper Gangetic Plain (UGP) and Middle Gangetic Plain (MGP). The cities (Kolkata, Asansol) located in Lower Gangetic Plain (LGP) are relatively least polluted. In addition to this, out of 20 most polluted cities in south-east Asia, 18 most polluted cities were in India. From the above global reports, it was clear that the pollution level of Indian cities is not acceptable for environmental sustainability. But after the implementation of lockdown substantial reduction of air pollutants in the atmosphere have been observed across many cities of the world. The most of the cities of the world experienced significant improvement of air quality after lockdown down. Recently a number of studies already have been performed to examine the impact of lockdown on air pollution level and result showed that there was substantial improvement of air pollution level (He et al. 2020; Liu et al. 2020; Watts and Kommenda 2020; Cadotte 2020; Ogen 2020; Coccia 2020). Such outcomes of the previous studies really inspired to formulate few research questions- (a) how far the most polluted cities of IGP gets impacted during lockdown in PM2.5 concentrations? (b) Is there any variation of PM2.5 concentrations across cities in different spatial segments of IGP? To address these research questions, this mainly focuses on the assessment impact of lockdown due to COVID-19 across the cities of Indo-Gangetic Plain (IGP) of India. To validate the impact, the concentration of PM2.5 across the cities of IGP has been assessed in last two years (2018–2020). The result of the study surely assists planner and policy makers to understand the scenario of PM2.5 concentrations during non-pandemic (2018 and 2019) as well as present pandemic (COVID-19) situation during same periods. Thus this study may be also helpful to implement policies at regional level to fight with air pollution level in India.
Material and methods
Study area
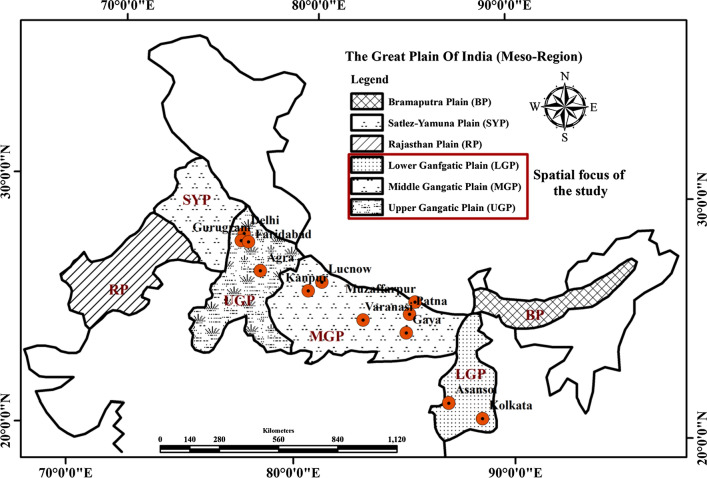
In this study, concentration of PM2.5 has been assessed across 12 cities located Indo-Gangetic Plain (IGP) in India. The entire IGP has been categorized into three regions namely- (i) Upper Gangetic Plain (UGP), (ii) Middle Gangetic Plain (MGP) and Lower Gangetic Plain (LGP) respectively (Details of the cities are presented in Table 1 and 2). These 12 cities stretch over four union territories (UT)/ states namely Delhi UT, Uttarpradesh, Bihar and West Bengal. In many reports and literatures, it was well recognized that these cities (particularly UGP and MGP cities) are one of the polluted cities of India. In this region relatively higher concentration of PM2.5 was recorded due to industries, power plants, transportations, construction activities etc. (Pant et al. 2016; Srimuruganandam and Nagendra 2012; Liu et al. 2013; Villalobos et al. 2015). As per as WHO’s report published in 2018 on PM2.5 concentrations, out of ten most polluted cities of the world, seven most polluted cities were located in India and the capital city of India i.e. Delhi was the most polluted city of the world. The report also showed that Gurugram was the most polluted city in the world (135 µg/m3). The profile of the cities is presented in Table 2 in details (Fig. 1).
Table 1.
Categorization of Indo-Gangetic Plain (IGP) cities considered in this study
| Region | Cities | No of cities studied |
|---|---|---|
| Upper Gangetic Plain (UGP) | Delhi, Gurugram, Faridabad, Agra | 4 |
| Middle Gangetic Plain (MGP) | Kanpur, Lucknow, Varanasi, Patna, Gaya, Muzaffarpur | 6 |
| Lower Gangetic Plain (LGP) | Kolkata, Asansol | 2 |
Table 2.
Brief profile of cities located in IGP of India
| Cities | Area (km2) (2011) | Pop. density (km2) (2011) | Total population (2011) | World air quality report (2018) | WHO's report (2016) | |
|---|---|---|---|---|---|---|
| PM2.5 (µg/m3)* | ||||||
| UGP | Delhi UA | 561 | 11,312 | 16.31 | 113.5 | 143 |
| Gurugram | 738 | 4803 | 0.87 | 135.8 | 113 | |
| Agra | 121 | 13,152 | 1.74 | 104.8 | 131 | |
| Faridabad | 204 | 6932 | 1.40 | 130.4 | 172 | |
| MGP | Kanpur | 403 | 10,377 | 2.92 | 120.3 | 173 |
| Lucknow | 349 | 8077 | 2.90 | 115.7 | 138 | |
| Varanasi | 163 | 14,598 | 1.43 | 105.3 | 151 | |
| Patna | 136 | 15,640 | 2.04 | 119.7 | 144 | |
| Gaya | 308 | 9450 | 0.47 | 96.6 | 149 | |
| Muzaffarpur | 93 | 13,411 | 0.35 | 110.3 | 120 | |
| LGP | Asansol | 326 | 3500 | 1.24 | – | – |
| Kolkata | 1851 | 7950 | 14.11 | – | – | |
*Average annual PM2.5
Fig. 1.
Location map of the study area (shown in brown color)
PM2.5 data
Data to assess the impact of lockdown on concentration of PM2.5 was collected from different air quality monitoring stations across the cities. The daily hourly air quality data were extracted from Central Pollution Control Board (CPCB) online portal (https://app.cpcbccr.com/AQI_India/). CPCB provides data regarding the concentration of major seven air pollutants (such as Sulphur Dioxide (SO2), Nitrogen Dioxide (NO2), Carbon Monoxide (CO), Ozone (O3) and Ammonia (NH3) as we as concentration of fine particles matter (PM2.5 and PM10) respectively. From CPCB on line portal, PM2.5 data were collected from1st January to 17th May, 2020 to compare PM2.5 concentrations before and during lockdown periods. In addition to this, to examine the spatial scenario of PM2.5 over the region (across cities), data were collected in last two years (2018 to 2020).
Statistical analysis
In this study, Coefficient of Variation (CV) has been used to find out the spatial variation of PM2.5 concentration different phases of lockdown. In addition to this, one way ANOVA has also been used to examine the significant difference of PM2.5 concentrations across cities in different phases of lockdown.
Result
Regional scenario of PM2.5 (µg/m3) concentration in Indo-Gangetic Plain (IGP)
In this present study, the spatial concentration of PM2.5 has been assessed at regional (in different spatial segments of Gangetic Plain).
Upper Gangetic Plain (UGP)
From this region of IGP, four major cities have selected which comprises 33% of total cities of the study area. These major cities are- Delhi, Gurugram, Agra and Faridabad. These cities are located in Delhi UT (1) (Union Territory), Hariyana (1) and Uttar Pradesh (2) respectively. These cities are the most polluted cities of the country (discussed in previous literatures).
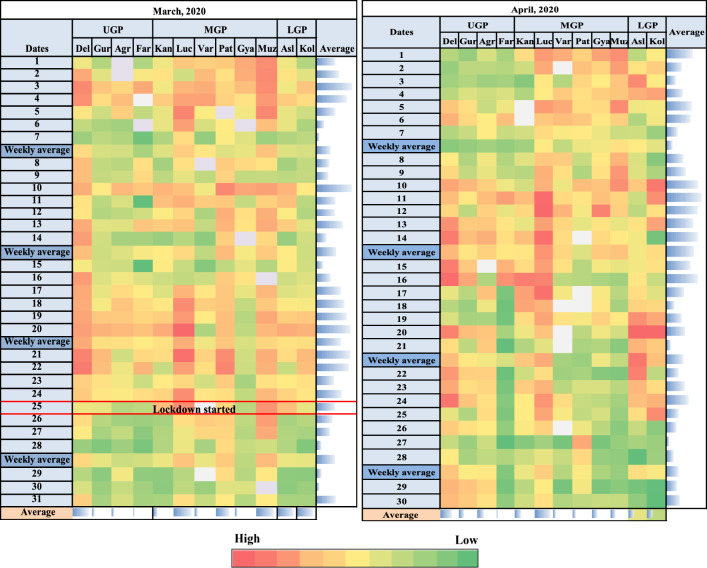
As per as result, it has been observed that before 30 days of lockdown, the average concentration of PM2.5 was 66.73 that reached to 39.63 during phase I and slightly increased during second phase (45.45) and third phase (51.15) of lockdown respectively. Before lockdown highest concentration of PM2.5 has been found in Delhi (75.00) followed by Faridabad (69.5), Gurugram (63.4) and Agra (59.00) respectively.
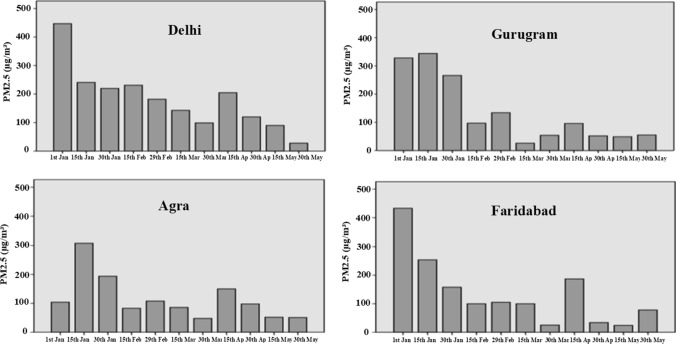
During entire phase of lockdown (from phase I to phase IV), the average concentration of PM2.5 was 48.74 with highest concentration of PM2.5 reported from Delhi (51.15), Agra (50.05) followed by, Faridabad (47.93), Gurugram (45.83) respectively (Figs. 2, 3).
Fig. 2.
Concentration of PM2.5 across cities of UGP (since 1st January to 30th May, 2020)
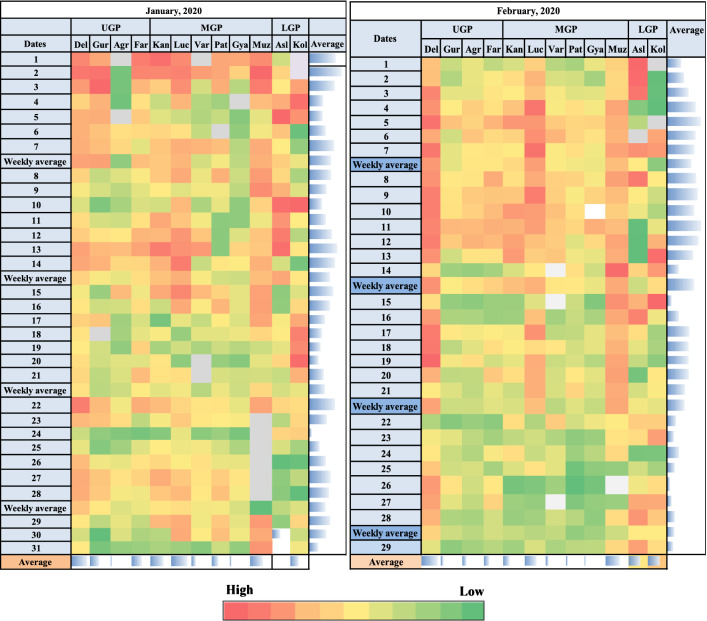
Fig. 3.
Daily concentration of PM2.5 across cities during January–February, 2020 (pre-lockdown periods)
Middle Gangetic Plain (MGP)
From this part of IGP, six major cities have been considered in this study. These cities are stretched over Uttar Pradesh (3) and Bihar (3). These major cities are—Kanpur, Lucknow, Varanasi, Patna, Gaya, Muzaffarpur. In many reports and previous literatures, it has been highlighted that these cities are one of the most polluted in India (discussed in above section).
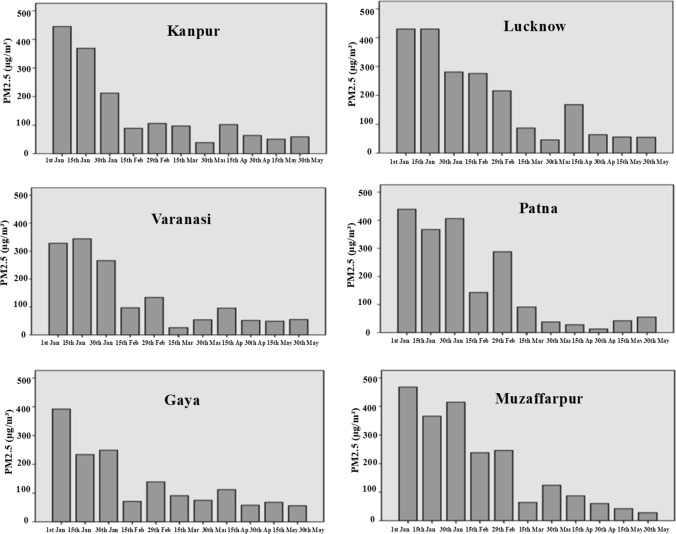
In this region of IGP, the average concentration of PM2.5 was 66.42 before 30 days of lockdown whereas it declined to 52 during first phase of lockdown and 42.57 during fourth phase of lockdown. The average concentration of PM2.5 during entire phase of lockdown (from phase I to phase IV), the average concentration of PM2.5 was 44.16 (it was higher than UGP and LGP) with highest average concentration of 57.45 in Lucknow followed by Kanpur (47.10), Varanasi (41.5), Gaya (40.58) respectively (Fig. 4).
Fig. 4.
Concentration of PM2.5 across cities of MGP (since 1st January to 30th May, 2020)
Lower Gangetic Plain (LGP)
Lower Gangetic Plain (LGP) mainly covers a vast geographical area of West Bengal. From this region, two major cities have been studied namely—Kolkata and Asansol. In these cities, the average concentration of PM2.5 was 61.90 with highest concentration of 63.3 in Asanasol and 60.5 in Kolkata before 30 days of lockdown and average concentration of PM2.5 declined to 35.05 during first pahse and 21.90 during second phase of lockdown. During entire periods of lockdown, average concentration of PM2.5 was 26.39 with highest concentration in Asansol (30.88) and Kolkata (21.90) (Figs. 5, 6).
Fig. 5.
Daily concentrations of PM2.5 across cities during March to April, 2020
Fig. 6.
Concentration of PM2.5 across cities of LGP (since 1st January to 30th May, 2020)
Regional variation of PM2.5 (µg/m3) in IGP
The result of the study showed that there was substantial regional variation of PM2.5 concentration in IGP across the cities. The concentration of PM2.5 was relatively high over the cities located in UGP as compared to MGP and LGP during different periods of lockdown and even 30 days before lockdown. Before 30 days of lockdown, average concentration of PM2.5 in IGP was 65.01 with highest concentration of 66.73 in UGP followed by MGP (65.42) and LGP (61.90) respectively. During lockdown phases also, highest average concentration of PM2.5 has been recorded from UGP. The result showed that during entire phases of lockdown, average concentration of PM2.5 was 39.76 with highest concentration of 48.74 again in UGP followed by MGP (44.16) and LGP (26.39) respectively. Thus from the result it is clear that PM2.5 concentrations was relatively higher over the cities located in UGP such as Delhi, Gurugram, Agra and Faridabad as compare to those cities located in MGP and LGP respectively. During fourth phase of lockdown, average concentration across most of the cities increased due to relaxation of guidelines implemented by Central as well as State government.
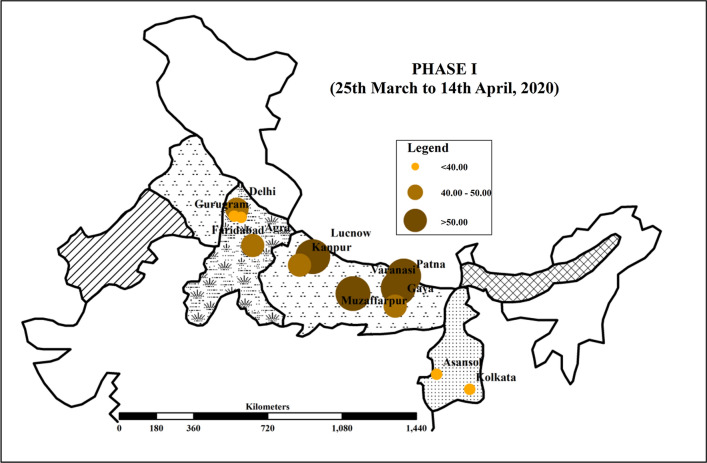
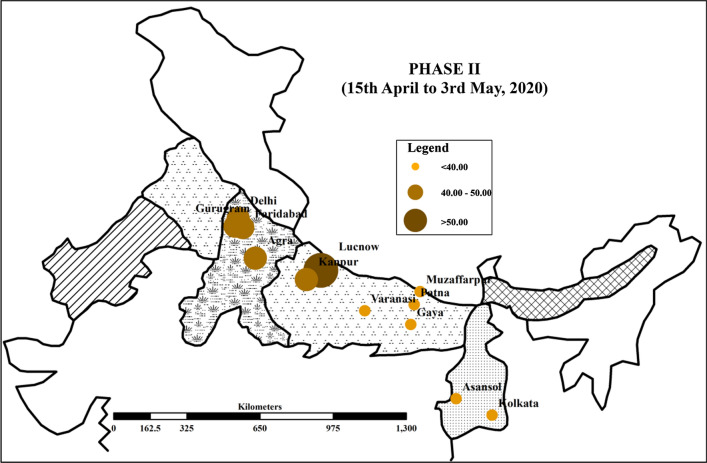
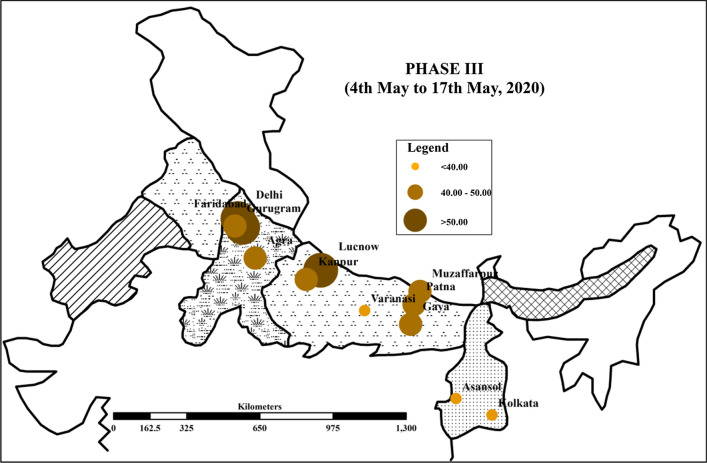
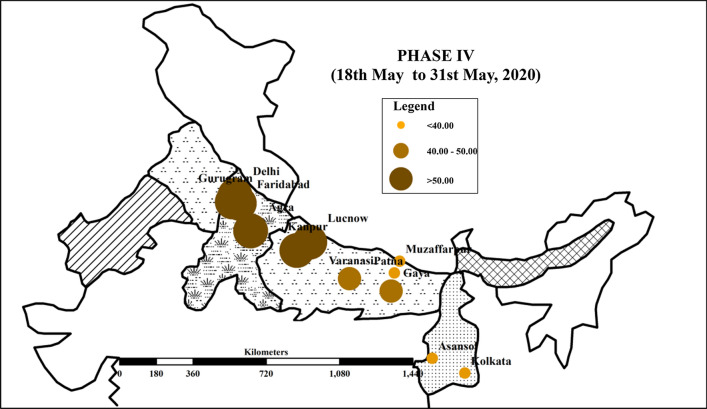
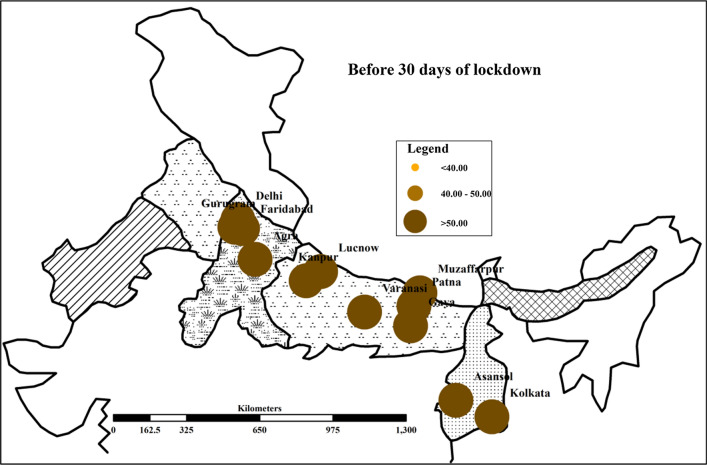
There were substantial variations of PM2.5 concentrations in different phases of lockdown and before 30 days of lockdown (Figs. 7, 8, 9, 10, 11). Table 3 represents the number of cities of IGP on the basis of average PM2.5 (µg/m3) concentration in different phases of lockdown and 30 days before lockdown. It clearly denotes that there were all 12 cities with average concentration of PM2.5 above 50. But after implementation of lockdown, the number of cities with average concentration of PM2.5 above 50 declined. It clearly indicates that average concentration of PM2.5 across the cities of IGP declined during lockdown periods. During 4th phase of lockdown, number of cities with average concentration of PM2.5 above 50 increased. This was most probably due to relaxations of guidelines during this phase of lockdown.
Fig. 7.
Concentration of PM2.5 across cities of IGP (Phase I)
Fig. 8.
Concentration of PM2.5 across cities of IGP (Phase II)
Fig. 9.
Concentration of PM2.5 across cities of IGP (Phase III)
Fig. 10.
Concentration of PM2.5 across cities of IGP (Phase IV)
Fig. 11.
Concentration of PM2.5 across cities of IGP (30 days before lockdown)
Table 3.
Number of cities based on average PM2.5 (µg/m3) concentration
| PM2.5 | 30 days before lockdown | Phase I | Phase II | Phase III | Phase IV |
|---|---|---|---|---|---|
| < 40 | 0 | 4 | 6 | 3 | 4 |
| 40–50 | 0 | 4 | 5 | 6 | 2 |
| > 50 | 12 | 4 | 1 | 3 | 6 |
Monthly variation of PM2.5 (µg/m3) in IGP before lockdown
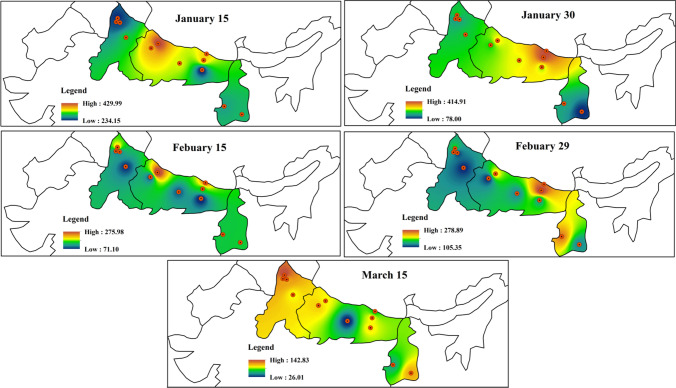
In this section of the study, monthly variation of PM2.5 concentrations has been examined before lockdown (from January to 24th March, 2020). During January, average concentration of PM2.5 was (252) with highest concentration of 316 in Delhi (UGP) followed by Lucknow (310.68), Kanpur (283.71) respectively (MGP).
The average concentration of PM2.5 over the cities of IGP was 206 during the month of February. The highest average concentration of PM2.5 during month was recorded Delhi (297.41) (UGP) again followed by Lucknow (248), Kanpur (202.59), Varanasi (199.69) respectively (MGP).
During the month of March, average concentration of PM2.5 was 123 with highest average concentration of 164 (Lukhnow) followed by Muzaffarpur (163.03) (MGP), Delhi (161.58) (UGP), Patna (151) (MGP) respectively (Fig. 12).
Fig. 12.
Concentration of PM2.5 before lockdown in IGP
Monthly variation of PM2.5 (µg/m3) in IGP during lockdown
In India, lockdown was imposed on 24th March for 21 days (24th March to 14th April) for the first phase and it was further extended from 15th April to 3rd May (19 days); from 4th May to 17th May (14 days) and from 18th May to 31st May (13 days), 2020. After the implementation of lockdown there was a substantial decrease of PM2.5 concentrations over the cities stretched in IGP.
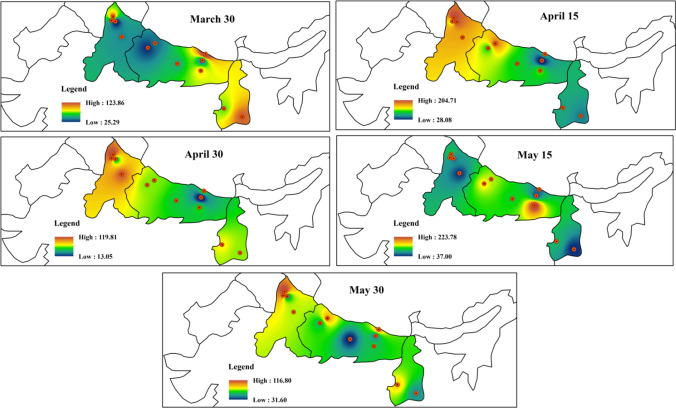
In earlier section of the study it has been stated that during March average monthly PM2.5 concentrations across the cities of IGP was 123 that reached to 83.30 during the month of April (decreased by more than 30%).
In April, average PM2.5 concentration was 83.80 with highest concentration of 132 in Lucknow (MGP) followed by Delhi (110.83), Agra (88) (UGP) and Kanpur (82.27) (MGP).
During the month of May, average concentration of PM2.5 88.79 with highest average concentration of 154 in Lucknow (MGP) followed by Gurugram (107.50), Agra (96.58), Delhi (95.80). Thus, form the overall analysis it is oblivious fact that relatively higher concentration of PM2.5 was recorded in Delhi, Lucknow, Gurugram, Agra, Kanpur and Muzaffarpur respectively. All these cities are located in UGP and MGP. The concentration of PM2.5 was relatively low across LGP cities (Kolkata and Asansol) (Fig. 13).
Fig. 13.
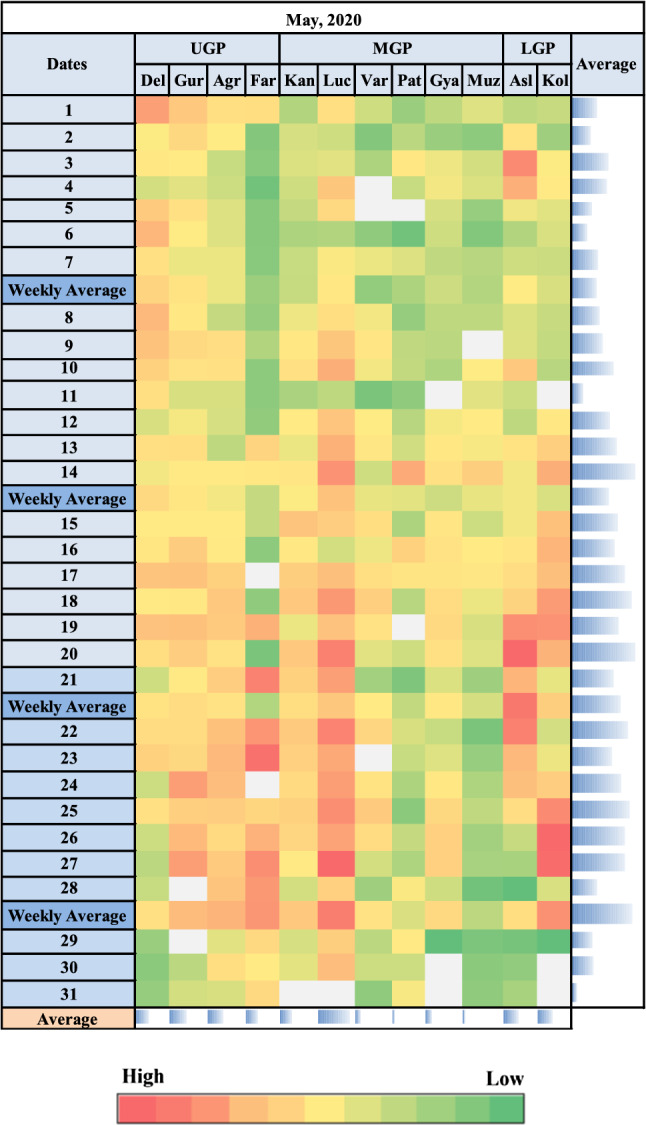
Daily concentration of PM2.5 across cities during May, 2020
Table 4 represents the variation of PM2.5 (µg/m3) over IGP in pre-lockdown and during lockdown phases. Regional variation of PM2.5 can be well understood by coefficient of variation (CV). The result showed that before 30 days of lockdown, CV was 10.49% that gradually decreased in successive phases (except Phase III) and reached to 6.18% during fourth phase of lockdown in UGP. It clearly denotes that spatial variation concentration of PM2.5 over the cities of UGP declined since before lockdown. On the other hand, CV increased in case of cities located in MGP and LGP since before lockdown to during lockdown phases. For example, in MGP before 30 days of lockdown CV was 14.70% that reached to 36.74% during fourth phase of lockdown. Similar fact can be found for LGP. It clearly indicates the fact that spatial variation of PM2.5 concentration increased across cities located in MGP and LGP. As per as one way ANOVA analysis, it was observed that there were no significant difference of PM2.5 concentrations across cities in different phases of lockdown in IGP (p value was 0.437 which was not significant at p < 0.05).
Table 4.
Basic statistics on concentration of PM2.5 (µg/m3) in IGP
| Cities | 30 days before | Phase I | Phase II | Phase III | Phase IV | Average (during lockdown period) | |
|---|---|---|---|---|---|---|---|
| UGP | Delhi UA | 75.00 | 42.20 | 46.50 | 55.60 | 60.30 | 51.15 |
| Gurugram | 63.40 | 36.50 | 44.90 | 48.50 | 53.40 | 45.83 | |
| Agra | 59.00 | 43.60 | 49.60 | 45.50 | 61.50 | 50.05 | |
| Faridabad | 69.50 | 36.20 | 40.80 | 55.00 | 59.70 | 47.93 | |
| Mean | 66.73 | 39.63 | 45.45 | 51.15 | 58.73 | 48.74 | |
| SD | 7.00 | 3.83 | 3.66 | 4.95 | 3.63 | 2.36 | |
| CV | 10.49 | 9.66 | 8.06 | 9.68 | 6.18 | 4.84 | |
| MGP | Kanpur | 61.40 | 44.80 | 48.50 | 43.80 | 51.30 | 47.10 |
| Lucknow | 69.20 | 56.50 | 54.20 | 52.00 | 67.10 | 57.45 | |
| Varanasi | 62.60 | 55.80 | 33.10 | 36.80 | 41.30 | 41.75 | |
| Patna | 67.30 | 51.00 | 25.60 | 46.50 | 30.90 | 38.50 | |
| Gaya | 54.60 | 41.70 | 36.60 | 41.60 | 42.40 | 40.58 | |
| Muzaffarpur | 83.40 | 67.00 | 28.80 | 40.10 | 22.40 | 39.58 | |
| Mean | 66.42 | 52.80 | 37.80 | 43.47 | 42.57 | 44.16 | |
| SD | 9.76 | 9.11 | 11.29 | 5.32 | 15.64 | 7.17 | |
| CV | 14.70 | 17.25 | 29.86 | 12.23 | 36.74 | 16.24 | |
| LGP | Asansol | 63.30 | 35.80 | 26.50 | 35.00 | 26.20 | 30.88 |
| Kolkata | 60.50 | 34.30 | 17.20 | 18.50 | 17.60 | 21.90 | |
| Mean | 61.90 | 35.05 | 21.85 | 26.75 | 21.90 | 26.39 | |
| SD | 1.98 | 1.06 | 6.58 | 11.67 | 6.08 | 6.35 | |
| CV | 3.20 | 3.03 | 30.10 | 43.62 | 27.77 | 24.05 | |
Comparison PM2.5 concentrations during lockdown and without lockdown
In this section, the concentrations of PM2.5 were compared between lockdown period due to COVID-19 of 2020 (April and May) and same period of 2018 and 2019. Here it was seen the substantial decline of PM2.5 concentrations across the region during full lockdown of 2020 to that of 2018–2019 (without lockdown) (Table 5). The average concentration of PM2.5 was 177.35 (2018) and 164.49 (2019) across UGP cities that reached to 109.35 in 2020 (decreased by 38% and 33%) during same periods (April–May). Similarly, in MGP concentration of PM2.5 declined by 30% from 2018–2019 with highest decrease in Varanasi (49%) followed by Gaya (48%), Patna (36%), Kanpur (20%) respectively. In LGP cities, concentration of PM2.5 decreased by more than 30% since 2018–2020 (April–May).
Table 5.
Concentration of PM2.5 with lockdown and without lockdown periods
| Cities | 2018 | 2019 | 2020 | Change (2018–2020) | 2019–2020 | |
|---|---|---|---|---|---|---|
| UGP | Delhi UA | 157.84 | 186.45 | 143.15 | − 9.31 | − 23.22 |
| Gurugram | 236.53 | 187.55 | 99.71 | − 57.84 | − 46.83 | |
| Agra | 146.46 | 136.70 | 97.31 | − 33.56 | − 28.81 | |
| Faridabad | 168.57 | 147.25 | 97.21 | − 42.33 | − 33.99 | |
| MGP | Mean | 177.35 | 164.49 | 109.35 | − 38.34 | − 33.52 |
| Kanpur | 118.79 | 110.81 | 94.87 | − 20.13 | − 14.38 | |
| Lucknow | 190.45 | 213.83 | 163.90 | − 13.94 | − 23.35 | |
| Varanasi | 153.68 | 177.14 | 77.75 | − 49.41 | − 56.11 | |
| Patna | 164.98 | 125.34 | 106.25 | − 35.60 | − 15.23 | |
| Gaya | 158.48 | 118.45 | 82.22 | − 48.12 | − 30.59 | |
| Muzaffarpur | 114.38 | 112.59 | 106.86 | − 6.58 | − 5.09 | |
| LGP | Mean | 150.13 | 143.03 | 105.31 | − 29.85 | − 26.37 |
| Asansol | 161.23 | 170.21 | 112.51 | − 30.22 | − 33.90 | |
| Kolkata | 149.32 | 163.58 | 98.62 | − 33.95 | − 39.71 | |
| Mean | 155.28 | 166.90 | 105.57 | − 32.01 | − 36.75 | |
Thus, from the overall result among all three regions (UGP, MGP and LGP), highest decrease of PM2.5 concentrations was recorded over LGP cities (36.75%) followed by UGP (33.52%) and MGP (26.37%).
Weekly concentration of PM2.5 across the cities located in IGP has been examined since first week of January to 2nd week of May, 2020 (Fig. 14). The upper part (upper whisker) and lower part (lower whisker) of box plots indicates the maximum and minimum average concentrations of PM2.5. A line within box (middle quartile) represents the median value of PM2.5 concentrations. The results showed that there was sharp decline of PM2.5 concentrations after 3rd week of February, 2020. In addition to this, there were also variations of PM2.5 concentrations across cities of IGP. In India, first COVID-19 confirm case was reported from Kerala on 30th January 2020 and second as well as third cases was also reported from the same state on 2nd and 3rd February, 2020. Since the outbreak of COVID-19, government imposed a number of restrictions on travel advisory, transportations etc. Thus implementation of restrictions resulted in the reduction of PM2.5 concentrationsfrom the early stage of COVID-19 outbreak (from February, 2020) (Figs. 15, 16).
Fig. 14.
Concentration of PM2.5 during lockdown in IGP
Fig. 15.
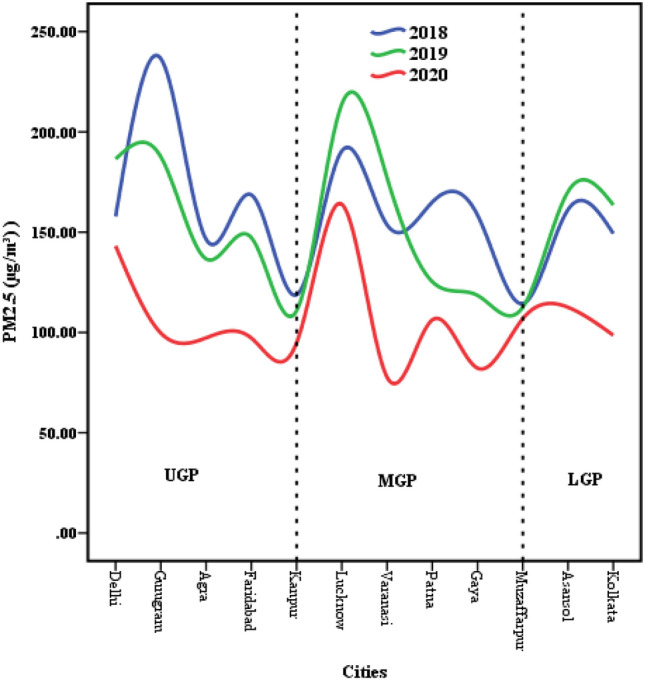
Concentration of PM2.5 in different spatial segments of IGP (across cities) in last two year
Fig. 16.
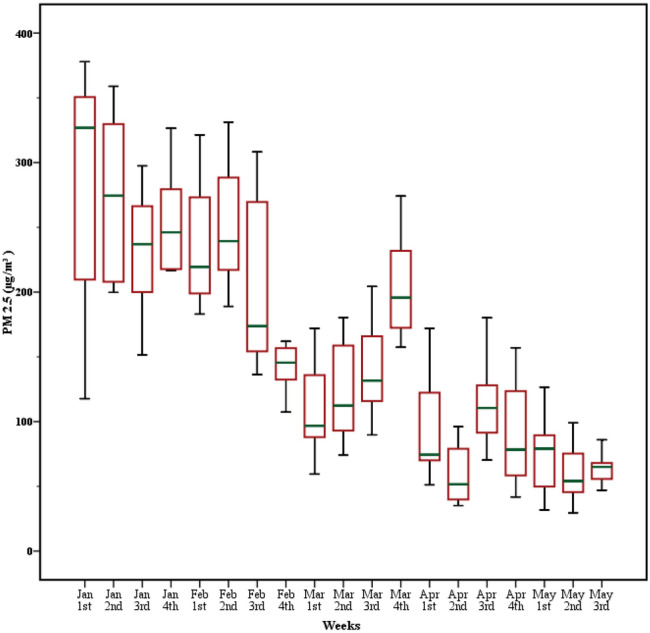
Weekly concentration of PM2.5 in IGP across the cities
Metrological conditions over the region in last five years (2015–2020)
In this section of the study, the basic weather conditions (air temperature, wind speed, rainfall and relative humidity) during the same periods has been assessed across different spatial segments of IGP in last five years (2015–2020). The result showed that there was no extreme variation of weather conditions (except rainfall) since last five years (2015–2020). Average rainfall over the region of LGP, MGP and UGP (except 2019) was relatively high in 2020 in comparison to previous last five years (Table 6). Except rainfall, there were no extreme variations of air temperature, rainfall and wind speed in last five years during same periods.
Table 6.
Meteorological conditions during same periods (lockdown) in last five years (2015–2020)
| Parameters | Statistics | LGP | MGP | UGP | |||||||||||||||
|---|---|---|---|---|---|---|---|---|---|---|---|---|---|---|---|---|---|---|---|
| 2015 | 2016 | 2017 | 2018 | 2019 | 2020 | 2015 | 2016 | 2017 | 2018 | 2019 | 2020 | 2015 | 2016 | 2017 | 2018 | 2019 | 2020 | ||
| Temperature (°C) | Mean | 32.7 | 32.2 | 32.7 | 32.5 | 35.8 | 33.5 | 35.3 | 35.3 | 35.2 | 34.5 | 38.4 | 35.6 | 34.7 | 35.3 | 35.3 | 23.8 | 38.1 | 37.0 |
| SD | 1.3 | 1.6 | 1.0 | 1.0 | 1.0 | 0.5 | 2.7 | 0.6 | 1.5 | 2.0 | 1.9 | 2.1 | 3.6 | 2.5 | 1.4 | 2.0 | 3.1 | 2.4 | |
| CV | 3.9 | 5.0 | 3.2 | 3.1 | 2.9 | 1.5 | 7.8 | 1.7 | 4.3 | 5.8 | 5.0 | 5.9 | 10.5 | 7.1 | 4.0 | 8.3 | 8.2 | 6.4 | |
| Rainfall (mm) | Mean | 23.2 | 9.5 | 12.7 | 24.2 | 80.8 | 106.4 | 19.8 | 16.2 | 8.6 | 11.2 | 21.9 | 80.8 | 18.7 | 11.1 | 7.9 | 13.1 | 36.7 | 19.5 |
| SD | 20.1 | 9.7 | 14.7 | 23.4 | 84.4 | 100.9 | 22.6 | 17.9 | 5.8 | 8.0 | 24.1 | 111.7 | 20.2 | 11.2 | 9.6 | 18.3 | 44.2 | 5.7 | |
| CV | 86.7 | 102.1 | 115.6 | 96.6 | 104.5 | 94.9 | 114.3 | 110.1 | 68.0 | 71.2 | 110.5 | 138.3 | 108.0 | 100.9 | 121.5 | 139.8 | 120.5 | 29.0 | |
| Relative Humidity (%) | Mean | 54.2 | 50.3 | 56.0 | 53.5 | 49.8 | 53.8 | 30.4 | 30.9 | 31.3 | 32.4 | 28.8 | 33.8 | 23.4 | 23.7 | 22.0 | 23.2 | 19.0 | 23.6 |
| SD | 5.7 | 7.8 | 2.6 | 4.6 | 4.5 | 8.0 | 7.0 | 12.1 | 5.6 | 6.9 | 8.9 | 16.3 | 7.8 | 8.9 | 8.0 | 7.8 | 2.9 | 4.8 | |
| CV | 10.5 | 15.5 | 4.6 | 8.6 | 9.1 | 14.9 | 23.0 | 39.1 | 17.9 | 21.3 | 31.0 | 48.3 | 33.2 | 37.8 | 36.5 | 33.5 | 15.2 | 20.5 | |
| Wind speed (kmph) | Mean | 18.4 | 12.8 | 13.1 | 12.7 | 15.8 | 16.0 | 13.8 | 12.4 | 12.1 | 12.8 | 13.9 | 13.1 | 11.7 | 10.5 | 10.5 | 10.5 | 12.0 | 19.9 |
| SD | 6.0 | 0.2 | 0.7 | 1.3 | 1.6 | 1.1 | 1.0 | 1.2 | 0.5 | 1.0 | 1.4 | 0.8 | 0.9 | 0.4 | 0.7 | 1.3 | 1.4 | 14.0 | |
| CV | 32.3 | 1.3 | 5.0 | 10.2 | 9.8 | 6.8 | 6.9 | 9.4 | 4.0 | 8.2 | 9.9 | 5.8 | 8.0 | 3.7 | 7.1 | 12.2 | 11.7 | 8.5 | |
Seasonal variations of PM2.5 concentrations (µg/m3) across regions
In this section, the seasonal variation (winter-January to March and pre-monsoon-April and May) of PM2.5 for 2020 has been discussed and compared with last two years (2018–2019). From the result. it was well documented that there was substantial decrease of PM2.5 concentrations during pre-monsoon (April–May, 2020), which was the lockdown period due to COVID-19.I 2018, during pre-monsoon season, the average PM2.5 concentrations over the region was 248 ± 59 that declined to 215 ± 44 in 2019 and 128 ± 34 2020. In 2020, during pre-monsoon season, theaverage concentrations of PM2.5 was observed in UGP (179 ± 49 in Delhi) followed by MGP (121 ± 26 in Lucknow) and LGP (82 ± 26 in Asansol) In 2018, during winter season, average PM2.5 concentrations over the region was 288 ± 106 that declined to 248 ± 84 in 2019 and 212 ± 48 2020. In 2020, during winter, average concentrations of PM2.5 was observed in UGP (241 ± 38 in Delhi) followed by MGP (238 ± 56 in Lucknow) and LGP (221 ± 47 in Asansol) (Table 7).
Table 7.
Seasonal variations of PM2.5 concentrations across the region
| Regions | Cities | 2018 | 2019 | 2020 | |||
|---|---|---|---|---|---|---|---|
| winter | Pre-monsoon | winter | Pre-monsoon | winter | Pre-monsoon | ||
| UGP | Delhi | 336 ± 112 | 380 ± 42 | 270 ± 114 | 242 ± 41 | 272 ± 50 | 249 ± 68 |
| Gurugram | 352 ± 113 | 492 ± 69 | 268 ± 68 | 359 ± 48 | 193 ± 35 | 138 ± 44 | |
| Agra | 298 ± 98 | 180 ± 53 | 230 ± 86 | 259 ± 45 | 184 ± 53 | 138 ± 45 | |
| Faridabad | 268 ± 101 | 345 ± 78 | 241 ± 60 | 246 ± 41 | 208 ± 15 | 190 ± 42 | |
| MGP | Kanpur | 229 ± 73 | 168 ± 44 | 230 ± 69 | 140 ± 33 | 202 ± 42 | 151 ± 34 |
| Lucknow | 210 ± 86 | 348 ± 26 | 344 ± 122 | 334 ± 86 | 295 ± 68 | 183 ± 49 | |
| Varanasi | 321 ± 146 | 235 ± 56 | 299 ± 136 | 188 ± 52 | 216 ± 38 | 66 ± 16 | |
| Patna | 338 ± 153 | 228 ± 61 | 268 ± 69 | 143 ± 48 | 255 ± 75 | 133 ± 11 | |
| Gaya | 386 ± 20 | 245 ± 66 | 258 ± 88 | 264 ± 50 | 209 ± 59 | 98 ± 28 | |
| Muzaffarpur | 314 ± 123 | 124 ± 24 | 283 ± 100 | 145 ± 34 | 252 ± 54 | 98 ± 15 | |
| LGP | Asansol | 214 ± 101 | 186 ± 58 | 225 ± 61 | 182 ± 39 | 201 ± 44 | 86 ± 29 |
| Kolkata | 186 ± 123 | 159 ± 89 | 198 ± 82 | 156 ± 46 | 168 ± 51 | 79 ± 23 | |
Discussion
This present mainly focuses on the assessment the impact of lockdown on the PM2.5 concentrationsacross the most polluted cities of Indo-Gangetic Plain (IGP) of India. Result of the study clearly denoted that there was substantial reduction ofPM2.5 concentrations across the cities of IGP after the implementation of lockdown. The maximum reduction of PM2.5 concentration since 2019–2020 during same periods has been recorded from cities located in Lower Gangetic Plain (36.75%) followed by the cities located in Upper Gangetic Plain (33.52%) and Lower Gangetic Plain (26.38%) respectively. This result of the study is similar with other recent studies (He et al. 2020; Liu et al. 2020; Watts and Kommenda 2020; Cadotte 2020; Ogen 2020; Coccia 2020). The outback of COVID-19 of course has brought serious threats to the entire human world. Apart from this it has also helped to realize how human activities made the environment polluted. COVID-19 outbreak has also helped environment to restore its capacity. In many recent studies it was well recognized that air quality in many of the cities significantly improved due to lockdown. Most recently, a study was conducted by Mahato et al. (2020) over Delhi megacity and the result of the study documented that there was substantial decrease of PM2.5 concentrations of during lockdown. Wang et al. (2020) performed a study on major cities of China and the study result showed that the concentration of PM2.5 across the cities declined by more than 20%. In addition to this, other cities of the world also experienced rapid improvement of air quality during lockdown such as Milan in Italy (Collivignarelli et al. 2020), Sao Paulo state in Brazil (Nakada and Urban, 2020), Northern China (Wang et al. 2020), 22 cities in India (Sharma et al. 2020), Barcelona in Spain (Tobías et al. 2020), Rio de Janeiro in Brazil (Dantas et al. 2020), 120 cities in China (Zhu et al. 2020) respectively.
Many countries of the world adopted a number of measures to combat with COVID-19 such as travel restrictions, social distancing, closing of most public spaces etc. Along with measures, lockdown has emerged as an effective measure to the severely affected countries of the world to slow down the speed of COVID-19 transmissions such USA, Spain, France as well as India (Nigam 2020). In India nationwide lockdown has been imposed from 24th March to 31st May, 2020 (in four phases). During these lockdown, all social spaces (such as restaurants, shopping malls, and educational institutions) were closed. All type of transportations services (except essential services), manufacturing as well as industrial activates were strictly prohibited and shutdown. Thus complete nationwide lockdown has brought immense negative impact on socio-economic lives of the people. But outbreak of COVID-19 has also given us an opportunity to understand the dramatic improvement of air pollution level due to restricted emissions from transportations and limited economic activates (Gautam 2020) in manufacturing and industrial sectors. Although Central government of India imposed nationwide lockdown to combat with COVID-19 pandemic but later on states government adopted their own additional measures related to lockdown to control COVID-19 transmissions. A number of measures have been also imposed by the state governments in severely affected cities such as Delhi, Kolkata, Kanpur, Varanasi, Patna, Gurugram etc. For example, in case of UGP cities like Delhi and Gurugram, there were no permission on metro services, opening of shopping malls and strict restrictions on construction activities, transportations (such as 2 and 20 passengers in taxis and buses). The cities located in MGP (such as Patna, Varanasi, Kanpur, Lucknow etc.) and LGP (such as Kolkata, Asansol) also adopted a number of measures to control COVID-19 transmission on restricted use of public spaces, transpirations and other economic activities within the city. The adoptions of effective measures by both central and state governments have shown immense impact on the restricted emissions from various sources (such as transportations, industrial activities). Thus measures related to lockdown ultimately results reduction of air pollution across the cities of IGP.
Conclusion
From the overall analysis it was well recognized that the concentration of PM2.5 was substantially declined. The outbreak of COVID-19 of course has brought threats to the human lives but apart from this it has also brought an immense impact on the improvement of air quality. The lockdown due to outbreak of COVID-19 has given a scope to realize the restoration capacity of environment. The air pollution across the polluted cities can be checked if emissions from different sources can control through effective measures such as short term lockdown. The long term lockdown may lead extreme burden on socio-economic condition of the people particularly in developing countries like India. Sustainable development and environmental sustainability is not possible through the implementation of long term lockdown. In this context short term lockdown may be an effective measure to build environmental restoration. The result of the study showed that the concentration of PM2.5 was substantially decreased just after one week of lockdown. Therefore, the short term lockdown (3 to 7 days) may be an alternative measure for environmental restoration.
Footnotes
Publisher's Note
Springer Nature remains neutral with regard to jurisdictional claims in published maps and institutional affiliations.
Contributor Information
Manob Das, Email: dasmanob631@gmail.com.
Arijit Das, Email: arijit3333@gmail.com.
Raju Sarkar, Email: rajusarkar@dce.ac.in.
Sunil Saha, Email: sunilgeo.88@gmail.com.
References
- Cadotte M (2020) Early evidence that COVID-19 government policies reduce urban air pollution. 10.31223/osf.io/nhgj3
- Chowdhury S, Dey S, Di Girolamo L, Smith KR, Pillarisetti A, Lyapustin A. Tracking ambient PM2.5 build-up in Delhi national capital region during the dry season over 15 years using a high-resolution (1 km) satellite aerosol dataset. Atmos Environ. 2019;204:142–150. doi: 10.1016/j.atmosenv.2019.02.029. [DOI] [Google Scholar]
- Coccia M. Factors determining the diffusion of COVID-19 and suggested strategy to prevent future accelerated viral infectivity similar to COVID. Sci Total Environ. 2020 doi: 10.1016/j.scitotenv.2020.138474. [DOI] [PMC free article] [PubMed] [Google Scholar]
- Collivignarelli MC, Abbà A, Bertanza G, Pedrazzani R, Ricciardi P, Miino MC. Lockdown down for CoViD-2019 in Milan: what are the effects on air quality? Sci Total Environ. 2020;732:139280. doi: 10.1016/j.scitotenv.2020.139280. [DOI] [PMC free article] [PubMed] [Google Scholar]
- Dantas G, Siciliano B, França BB, da Silva CM, Arbilla G. The impact of COVID-19 partial lockdown down on the air quality of the city of Rio de Janeiro Brazil. Sci Total Environ. 2020;729:139085. doi: 10.1016/j.scitotenv.2020.139085. [DOI] [PMC free article] [PubMed] [Google Scholar]
- Das A, Das M, Ghosh S. Impact of nutritional status and anemia on COVID-19: is it a public health concern? Evidence from National Family Health Survey-4 (2015–2016) India Public Health. 2020;185:93. doi: 10.1016/j.puhe.2020.06.001. [DOI] [PMC free article] [PubMed] [Google Scholar]
- Guttikunda SK, Goel R, Pant P. Nature of air pollution, emission sources, and management in the Indian cities. Atmos Environ. 2014;95:501–510. doi: 10.1016/j.atmosenv.2014.07.006. [DOI] [Google Scholar]
- Guttikunda SK, Nishadh KA, Jawahar P. Air pollution knowledge assessments (APnA) for 20 Indian cities. Urban Climate. 2019;27:124–141. doi: 10.1016/j.uclim.2018.11.005. [DOI] [Google Scholar]
- He G, Pan Y, Tanaka T (2020) COVID-19, city lockdown downs, and air pollution: evidence from China. medRxiv. 10.1101/2020.03.29.20046649
- Liu F, Page A, Strode SA, Yoshida Y, Choi S, Zheng B et al (2020) Abrupt declines in tropospheric nitrogen dioxide over China after the outbreak of COVID-19. Science Advances, eabc2992 [DOI] [PMC free article] [PubMed]
- Nakada LYK, Urban RC. COVID-19 pandemic: impacts on the air quality during the partial lockdown down in São Paulo state, Brazil. Sci Total Environ. 2020 doi: 10.1016/j.scitotenv.2020.139087. [DOI] [PMC free article] [PubMed] [Google Scholar]
- Ogen Y. Assessing nitrogen dioxide (NO2) levels as a contributing factor to the coronavirus (COVID-19) fatality rate. Sci Total Environ. 2020 doi: 10.1016/j.scitotenv.2020.138605. [DOI] [PMC free article] [PubMed] [Google Scholar]
- Pant P, Guttikunda SK, Peltier RE. Exposure to particulate matter in India: a synthesis of findings and future directions. Environ Res. 2016;147:480–496. doi: 10.1016/j.comnet.2015.08.003. [DOI] [PubMed] [Google Scholar]
- Sharma S, Zhang M, Gao J, Zhang H, Kota SH. Effect of restricted emissions during COVID-19 on air quality in India. Sci Total Environ. 2020;728:138878. doi: 10.1016/j.scitotenv.2020.138878. [DOI] [PMC free article] [PubMed] [Google Scholar]
- Srimuruganandam B, Nagendra SS. Source characterization of PM10 and PM2. 5 mass using a chemical mass balance model at urban roadside. Sci Total Environ. 2012;433:8–19. doi: 10.1016/j.scitotenv.2012.05.082. [DOI] [PubMed] [Google Scholar]
- Tobías A, Carnerero C, Reche C, Massagué J, Via M, Minguillón MC, et al. Changes in air quality during the lockdown down in Barcelona (Spain) one month into the SARS-CoV-2 epidemic. Sci Total Environ. 2020 doi: 10.1016/j.scitotenv.2020.138540. [DOI] [PMC free article] [PubMed] [Google Scholar]
- Villalobos AM, Amonov MO, Shafer MM, Devi JJ, Gupta T, Tripathi SN, et al. Source apportionment of carbonaceous fine particulate matter (PM2. 5) in two contrasting cities across the Indo–Gangetic Plain. Atmos Pollut Res. 2015;6(3):398–405. doi: 10.5094/APR.2015.044. [DOI] [Google Scholar]
- Wang Y, Yuan Y, Wang Q, Liu C, Zhi Q, Cao J. Changes in air quality related to the control of coronavirus in China: implications for traffic and industrial emissions. Sci Total Environ. 2020 doi: 10.1016/j.scitotenv.2020.139133. [DOI] [PMC free article] [PubMed] [Google Scholar]
- Watts J, Kommenda N (2020). Coronavirus pandemic leading to huge drop in air pollution. The Guardian 23. https://www.dhushara.com/Biocrisis/20/3/pollution%20drop.Reduce%20to%20300%20dpi%20average%20quality%20-%20STANDARD%20COMPRESSION.pdf
- World Health Organization . WHO global ambient air quality database (update 2018) Geneva: World Health Organization; 2018. [Google Scholar]


