

Abstract
BACKGROUND:
There have been no prior investigations of the cost effectiveness of transfusion strategies for trauma resuscitation. The Pragmatic, Randomized, Optimal Platelet and Plasma Ratios (PROPPR) study was a Phase III multisite, randomized trial in 680 subjects comparing the efficacy of 1:1:1 transfusion ratios of plasma and platelets to red blood cells with the 1:1:2 ratio. We hypothesized that 1:1:1 transfusion results in an acceptable incremental cost-effectiveness ratio, when estimated using patients’ Age-specific life expectancy and cost of care during the 30-day PROPPR trial period.
STUDY DESIGN AND METHODS:
International Classification of Diseases, Ninth Revision codes were prospectively collected, and subjects were matched 1:2 to subjects in the Healthcare Utilization Program State Inpatient Data to estimate cost weights. We used a decision tree analysis, combined with standard costs and estimated years of expected survival to determine the cost effectiveness of the two treatments.
RESULTS:
The 1:1:1 group had higher overall costs for the blood products but were more likely to achieve hemostasis and decreased hemorrhagic death by 24 hours (p = 0.006). For every 100 patients treated in the 1:1:1 group, eight more achieved hemostasis than in the 1:1:2 group. At 30 days, the total hospital cost per 100 patients was $5.6 million in the 1:1:1 group compared with $5.0 million in the 1:1:2 group. For each 100 patients, the 1:1:1 group had 218.5 more years of life expectancy. This was at a cost of $2994 per year gained.
CONCLUSION:
The 1:1:1 transfusion ratio in severely injured hemorrhaging trauma patients is a very cost-effective strategy for increasing hemostasis and decreasing trauma deaths.
Trauma is the leading cause of death of those aged 1 to 44 years old.1 It is estimated to be the sixth most costly health care condition in the United States2 resulting in between $168 billion to over $400 billion dollars in total yearly costs2,3 including $38 billion to $80 billion in direct costs. The vast majority of the total variation in expenditures reflects the difficulty in quantifying indirect expenditures including costs associated with loss of life expectancy.3–5
The largest loss of life from preventable causes of death is attributed to hemorrhage, and most of these deaths happen early in hospitalization.6–8 Although most of these deaths occur within 6 hours, the care of these patients is extraordinarily resource intensive, including highly trained personnel, equipment, consuming precious blood products, and costing significant fiscal dollars.
Strategies aimed at improving outcome from hemorrhagic death have included balanced deployment of plasma and platelet-rich blood transfusion practices.9,10 Retrospective and prospective observational data have suggested that trauma patients suffering hemorrhagic injury benefit from receiving blood product resuscitation that aims to achieve equal ratios of red blood cells (RBCs) and plasma.9–11 No prior investigations of the cost effectiveness of these strategies exist in the literature. The optimal transfusion protocol would improve hemostasis, decrease trauma deaths, and prevent organ damage without increasing overall hospital costs.12,13
The Pragmatic, Randomized, Optimal Platelet and Plasma Ratios (PROPPR) study6 was a Phase III multisite, randomized trial in 680 subjects comparing the efficacy and safety of 1:1:1 transfusion ratios of plasma and platelets to RBCs with the 1:1:2 ratio. The co-primary outcomes of 24-hour and 30-day mortality were previously reported.3 In parallel with the primary endpoints was a planned prospective economic analysis to quantify costs associated with the two transfusion strategies. We hypothesized, a priori, that 1:1:1 transfusion results in an acceptable incremental cost-effectiveness ratio (ICER), when estimated using patients’ age-specific life expectancy and cost of care during the 30-day PROPPR trial period.
METHODS
PROPPR trial description
This economic analysis uses data from the PROPPR Phase III multisite trial conducted for safety and efficacy.6 Details of the enrollment, primary outcomes (24 hr and 30 days mortality), and protocol have been previously published.6,14 In summary, this was the largest randomized, prospective trial of differing blood product transfusion ratios for use in traumatic hemorrhage to date. Patients were enrolled if they were a highest-level trauma activation with severe injury at one of 12 North American Level 1 trauma centers. Patients were randomized within each site to receive either a 1:1:1 transfusion ratio or a ratio of 1:1:2 of blood products. The two groups differed in the amount of plasma that was received, with the 1:1:1 group receiving equal packed RBCs to plasma to platelets and the 1:1:2 group receiving a lower quantity of plasma compared with RBCs (one-half as much plasma). The blood products were transfused in a prespecified order depending upon the assigned treatment group to ensure that the ratios were correct. The trial also included real-time recording of predetermined complications of interest using standard definitions, including but not limited to infectious, transfusion, pulmonary, cardiac, renal, and multiorgan failure.6,14 Patients were followed until 30 days or until death if occurring before 30 days.
Design
The economic analysis focuses on the estimated total hospital costs of the first 30 days of care. A decision tree design was used to examine the economic cost and consequences of using the two specific (1:1:1 vs. 1:1:2) transfusion protocols in the PROPPR study.15 The tree organizes the clinical trial data to reflect the original trial results for two standard populations of 100 patients (Fig. 1). We used a decision tree populated by the prespecified trial outcomes, combined with standard costs and estimated years of expected survival from public health statistical reports16 to structure the data for comparison of the cost effectiveness of the two treatments.10
Fig. 1.
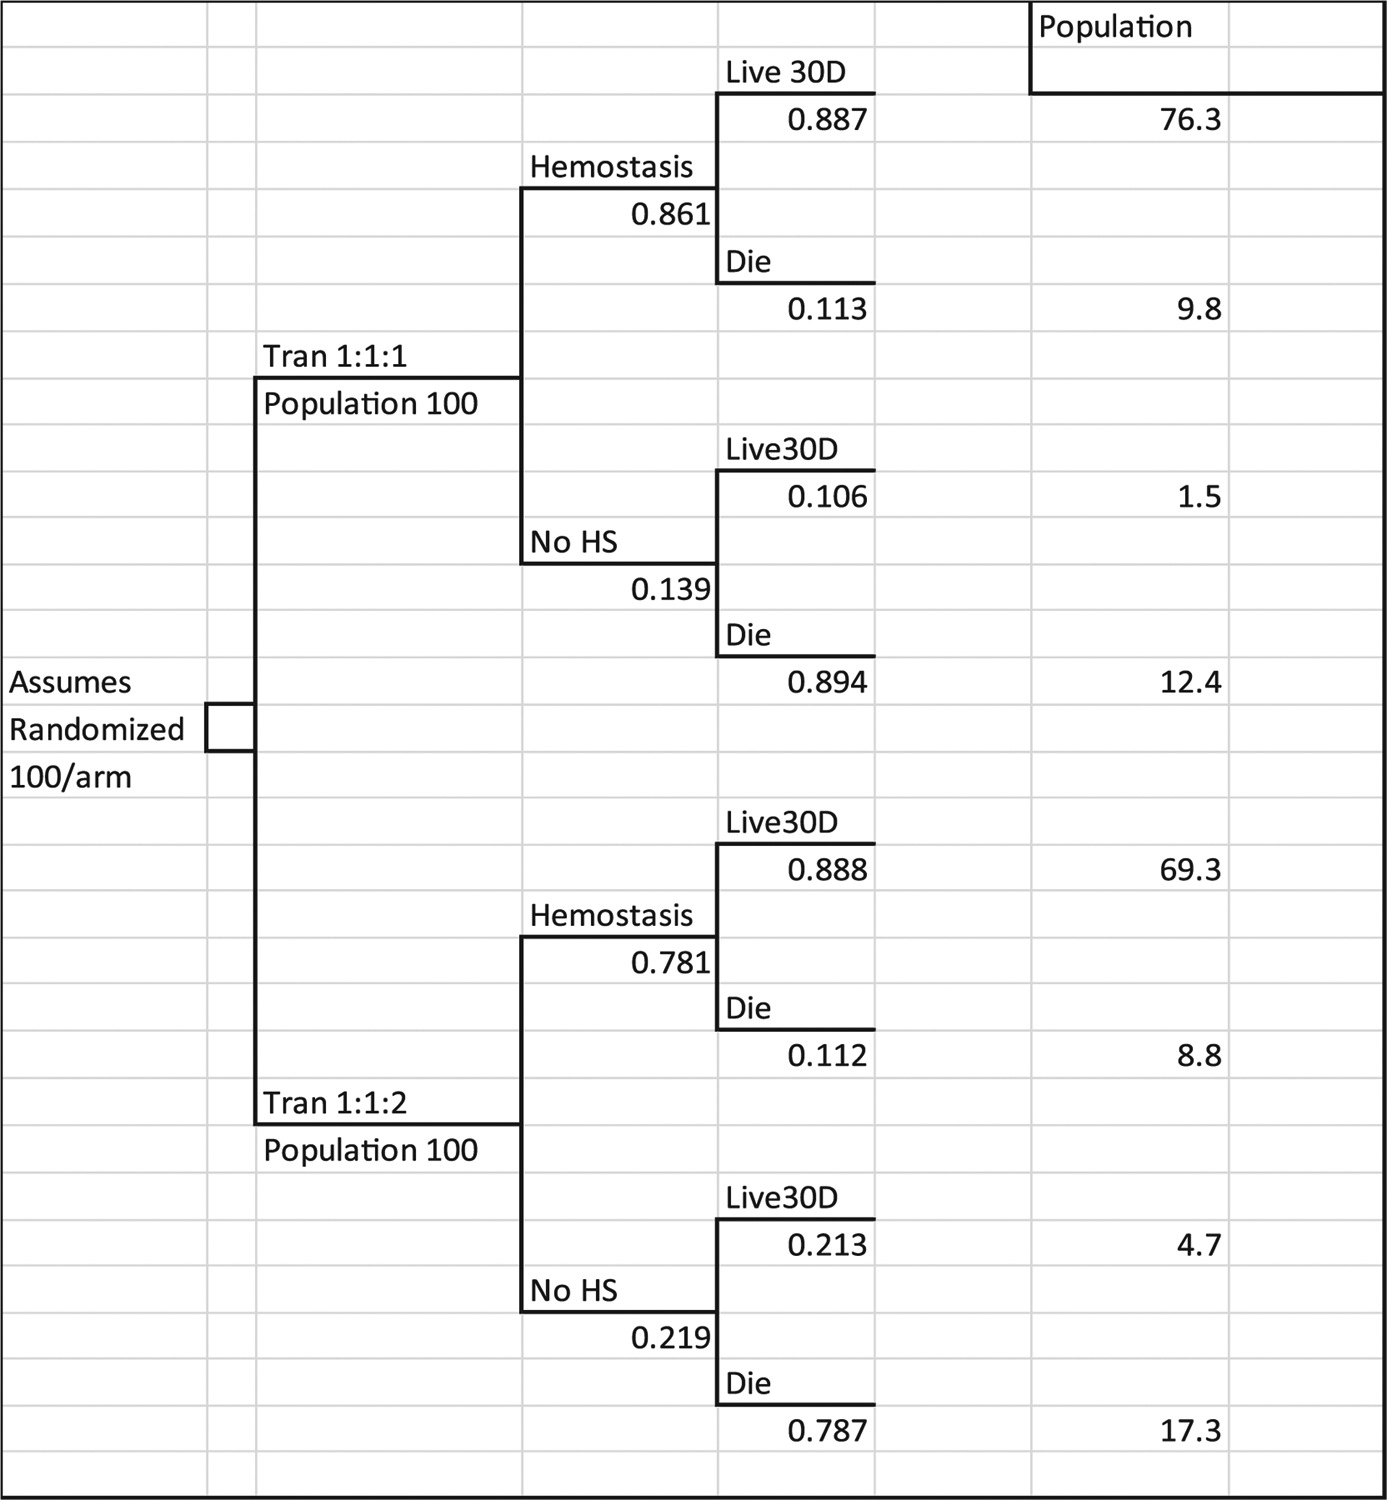
Decision tree used to estimate trial cost-effectiveness ratios. Tran 1:1:1 denotes treatment group. No HS is proportion who did not reach hemostasis. Live 30D are patients surviving at end of study. Die are patients who died during the study period. Population are the estimated number of patients on each tree branch expected if 100 patients were enrolled in each trial arm. Numbers under each branch in the tree are the proportion of patients in the PROPPR trial with the outcome.
The economic analysis used a decision tree design with an assumption of 100 patients randomized on each arm of the tree. The economically enriched clinical study data were analyzed to provide the proportions and parameters for populating the decision tree. Figure 1 shows the distribution of study patients among the tree branches. The upper part of the tree reflects outcomes for the 338 patients randomized to receive 1:1:1 protocol transfusions, and the lower branch shows the distribution of the 342 patients who were randomized to receive 1:1:1 protocol transfusions. The tree captures the 86.1 and 78.1% hemostasis rates reported in the clinical paper and shows the survival rates for each group based on hemostasis. The column “Population” shows the number of patients out of 100 per treatment who were recorded for each branch at the end of the study, 30 days from randomization. Thus, the tree organizes the clinical trial data to reflect the trial results for two standard populations of 100 patients.
Each branch of the tree has a number of “twigs” that capture the population observed in the study with the specific outcomes. Mean cost of blood and hospital care, and the mean number of years of life expectancy were calculated for each twig. The parameters were then used to calculate costs and outcomes for each twig and summed for the two branches that reflect the treatment groups.
Analyses were performed with computer software (SAS version 9.4, SAS Institute). Multivariable models with a log-link transformation were used to control for any differential effects of age, race, and study site when costs were compared by treatment group.
Estimating overall cost of care
The standard approach used for economic studies in clinical trials that are performed in many sites is to collect data on the treatment resources used and apply “standard” cost weight to the resource counts.1,8,9 This approach is chosen because neither charges nor estimated costs may be assumed to be similar across the sites. Thus, we collected data only on resource use during the hospital admission, and use the International Classification of Diseases, Ninth Revision (ICD-9) diagnosis and procedure codes to estimate costs per hospital day from a US database that contain all-payer hospital cost data. The effect of this approach was examined in a sensitivity analysis. Hospital length of stay (LOS), including days in the intensive care unit, was recorded, as was the time on ventilator and adverse events (complications) that may impact cost of care and/or LOS.
Thus, all ICD-9 code diagnosis and procedure data reported were prospectively collected on the 680 patients enrolled in the study.6 We used the Healthcare Cost and Utilization Program (HCUP) State Inpatient Data (SID)17 set for the estimation of the study cost weights. Patients were matched in a 2:1 ratio of HCUP patients to PROPPR study patients matched upon ICD-9 codes for primary diagnosis. Patients were also matched for LOS, death, intensive care stay, ventilator status, and use of blood. Matching was successful for over 95% of the cohort (1296 controls from HCUP for 680 PROPPR patients). The mean cost per hospital day was estimated from the matched trauma cases admitted in New York during 2012 and 2013. PROPPR was conducted from August 2012 to December 2013.3
The data from New York contained detailed revenue information including unit numbers and charges for any blood components. This level of detail was needed to allow separation of the blood product charges from the total charges. Blood product data were not universally available in the other state SID. Standard daily cost weights were calculated from the extracted New York discharge records for patient subgroups defined by LOS and survival. The cost weights used in the study reflected the mean cost per day of care for trauma patients in the states represented in the study. The derived cost weights were then used to calculate the cost per admission for the PROPPR trial patients based on their survival status and recorded LOS. The cost weights used in the model are provided in Table 1. A sensitivity analysis of the study estimates was performed using state-specific (Kentucky, New Jersey, Florida, Washington, Arizona, Texas) cost weights from the 2011 National Inpatient Sample (NIS) for a matched sample.
TABLE 1.
Cost weights used to estimate model values
| Type | Cost weight per unit or per day | Source |
|---|---|---|
| RBC/unit | $230 | Study sites |
| Plasma/unit | $65 | |
| Platelets/unit | $575 | |
| Cryo/unit | $55 | |
| Admission LOS <2, survivor | $4664 | Matched HCUP SID data* |
| Admission LOS 2–5, survivor | $3116 | |
| Admission LOS 6–10, survivor | $2793 | |
| Admission LOS 11–20, survivor | $2634 | |
| Admission LOS 21–29, survivor | $2558 | |
| Admission LOS 30+, survivor | $3023 | |
| Admission LOS <2, died | $9230 | |
| Admission LOS 2–5, died | $4306 | |
| Admission LOS 6–10, died | $3963 | |
| Admission LOS 11–20, died | $3272 | |
| Admission LOS 21–29, died | $2428 | |
| Admission LOS 30+, died | $2994 |
Cost of blood excluded, cost calculated using HCUP cost-to-charge ratio data.
HCUP = Healthcare Cost and Utilization Program; LOS = length of stay; SID = State Inpatient Data.
Estimating the cost of transfusions
Transfusion cost was assessed separately to evaluate the direct marginal cost of each intervention. Cost of blood was calculated for each patient from the transfusion records in the trial. We used a cost per unit of $230 for RBCs; $65 for plasma, $575 for platelets, and $55 for cryoprecipitate, which were the mean costs reported across the PROPPR sites. We examined the mean blood unit costs calculated from the New York SID billing data in 2012 and 2013 and found very similar mean cost values. Cannon and colleagues30 report that in a survey of 213 blood banks, the mean purchase cost per unit from a supplier was $211 for RBCs, $61 for plasma, and $533 for platelets.
Incremental cost-effectiveness ratio and sensitivity analysis
The probability of different outcomes observed in the trial, combined with life expectancy for trial patients, were used together with the standard cost data to estimate the ICER of the interventions. Because the cost weights were based on mean values, this estimate exhibits less variation than would be expected if using individual cost and survival data for trial patients. To examine the potential effects of changes in the model parameters, we used a Monte Carlo estimation statistical approach (Excel, Microsoft; Crystal Ball, Oracle), which demonstrates the effect that random variation would be expected to have on the ICER.18
This approach reestimates the model results using randomly drawn data points from the critical modeling parameters. We used the calculations of the ICER for total cost per additional year of life expectancy for the sensitivity analysis because this estimate included three important measures used together: 1) blood use, 2) hospital cost, and 3) life expectancy. A total of 1000 simulations were performed to show the effects of variations in the blood and hospital cost and life expectancy parameters on the cost-effectiveness estimates of the main decision model. The results were graphed in a scatter plot to show the effect of the variability of the trial data on the economic estimate. Figure 2 shows how the 1000 estimates were distributed. The horizontal axis shows the difference in cost per patient on protocol 1:1:1 versus protocol 1:1:2. The vertical axis shows the difference in life expectancy achieved for a patient on protocol 1:1:1 versus protocol 1:1:2. All estimates above the horizontal axis show that protocol 1:1:1 patients had better life expectancy, and estimates below the horizontal axis show that patients on protocol 1:1:2 had better life expectancy. The units are differences in the cost per patient.
Fig. 2.

Sensitivity analysis of cost and life expectancy differences. Sensitivity analysis represents cost and life expectancy differences between treatments for 1000 Monte Carlo simulations of ICERs for model estimates for total costs per additional year of life expectancy with the percentage of simulations per quadrant.
RESULTS
Direct cost of blood products and outcomes between treatment arms
The original study outcomes have been reported previously.6 In summary, the 1:1:1 treatment group (n = 338 patients) and the 1:1:2 group (n = 342 patients) were similar with regard to all baseline characteristics including age, race, and injury severity (injury severity score, 26.5 vs. 26; p = NS; Table 2). Overall blood products used in the first 24 hours were 25.5 units in the 1:1:1 group compared with 19 units in the 1:1:2 group.6 In considering only the cost attributable to the blood products, the 1:1:1 group had higher overall costs for the blood products but were more likely to achieve hemostasis and decreased hemorrhagic death by 24 hours p = 0.006; (Table 2).
TABLE 2.
Distribution of patients in the PROPPR trial and model parameters derived from the clinical trial and the linked economic data
| Variable | Treatment group 1:1:1 N = 338 | Treatment group 1:1:2 N = 342 | p value |
|---|---|---|---|
| Age (SD) | 39.0 (17.4) | 38.4 (17.5) | 0.66 |
| Race, n (%) | 0.35 | ||
| White | 210 (62.1) | 224 (65.5) | |
| Black | 93 (27.5) | 93 (27.2) | |
| Other | 35 (10.4) | 25 (7.3) | |
| Hemostasis, n (%) | 291 (86.1) | 267 (78.1) | 0.006 |
| Died in study, n (%) | 75 (22.4) | 89 (26.1) | 0.26 |
| Time to death from exsanguination, median (IQR) | 106 minutes (54–198) | 96 minutes (43–194) | 0.57 |
| Blood cost* | |||
| Hemostasis, survivor | 7,662 (6,866–8,551) | 4,530 (4,036–5084) | |
| Hemostasis, died | 13,320 (9,761–18,177) | 9,401 (6,788–13,019) | |
| No hemostasis, died | 16,023 (12,187–21,066) | 9,132 (7,249–11,505) | |
| Total hospital cost* | |||
| Hemostasis, survivor | 56,131 (52,434–60,088) | 54,590 (50,834–58,624) | |
| Hemostasis, died | 19,431 (16,990–23,613) | 25,255 (20,632–30,914) | |
| No hemostasis, died | 11,009 (9273–13,069) | 10,830 (9386–12,496) | |
| Estimated life expectancy, mean (SD) | 36.5 (23.1) | 34.3 (23.8) | 0.22 |
Mean and 95% confidence interval estimated controlling for patient age, race, and study site.
IQR = interquartile range; SD = standard deviation.
The mean blood cost for patients on protocol 1:1:1 who achieved hemostasis and survived 30 days were $7662, compared to $4530 for those on protocol 1:1:2 (Table 2). For those patients who did not survive, blood costs were higher if they were in the 1:1:1 group. Specifically, if a patient died before achieving hemostasis, mean blood costs were $16,023 versus $9132 (Table 2).
Direct overall hospital costs and life expectancy between treatment arms
The two treatment arms resulted in differing mean hospital costs that reflect the expected economic “penalty” for survival. In PROPPR, at 30 days, difference in survival was 3.7% higher in the 1:1:1 group.6 For patients who survived after achieving hemostasis, protocol 1:1:1 was more expensive compared with 1:1:2 ($56,131 vs. $54,590; Table 2). In contrast, hospital costs for patients who initially achieved hemostasis on the protocol but ultimately did not survive were lower ($19,431 vs. $25,255). If hemostasis was never achieved resulting in death, the hospital costs were the lowest ($11,009 vs. $10,830).
ICER of 1:1:1 compared with 1:1:2 treatment arm
The ICER of each intervention is presented in Table 3. For total blood costs per 100 patients, the cost was $934,883 for protocol 1:1:1 and $584,744 for protocol 1:1:2. For every 100 patients treated in the 1:1:1 group, 8 more achieved hemostasis than in the 1:1:2 group. The ICER for these additional patients achieving hemostasis was $43,634, which is the difference in cost divided by the difference in the benefit achieved by the two approaches.
TABLE 3.
Decision tree model results: cost, benefits, and ICER for 100 patients for each treatment
| Costs and benefits | Treatment group 1:1:1 N = 100 | Treatment group 1:1:2 N = 100 | Difference or ICER* |
|---|---|---|---|
| Base models: | |||
| Total blood cost | $934,883 | $584,744 | $350,139 |
| Total hemostasis | 86.1 | 78.1 | 8.0 |
| Cost per additional hemostasis achieved | $43,634 | ||
| Total survivors at 30 days | 77.8 | 74.0 | 3.8 |
| Cost per additional survivor | $91,324 | ||
| Total cost at 30 days | $5,659,725 | $5,005,639 | $654,086 |
| Total expected life years | 3,658.3 | 3,429.8 | 218.5 |
| Cost per additional expected life year | $2994 |
Note: The calculation of the ICER uses the standard formula (CostT1:1:1 − CostT1:1:2) − (BenefitT1:1:1 − BenefitT1:1:2) = ΔCost/ΔBenefits.
ICER = incremental cost-effectiveness ratio.
At 30 days, the total hospital cost per 100 patients was approximately $5.6 million in the 1:1:1 group compared with $5.0 million in the 1:1:2 group (Table 3). For each additional survivor in the 1:1:1 treatment arm, the ICER was $91,324. Although this group was more expensive, there were 218.5 more years of life expectancy gained. Thus, the ICER per year of life expectancy gained from 1:1:1 transfusion was $2994 when estimated using patients’ age-specific life expectancy and cost of care during the 30-day trial period.
Sensitivity analysis
To evaluate the effect of selecting New York cost data for our estimates, we performed a sensitivity analysis for the calculation of the ICER per year of life expectancy. No centers enrolling patients in PROPRR were located in New York. Therefore, we used the 2011 NIS state-specific costs for mean cost per day for matched trauma patients from the states enrolling patients in PROPPR. This resulted in an increase in the ICER from $2994 to $3258 (9% difference).
A Monte Carlo sensitivity analysis was performed to show the effects of variations in the blood and hospital cost and life expectancy parameters on the cost-effectiveness estimates of the main decision model. The results are shown in Fig. 2. The simulation found that protocol 1:1:1 resulted in better life expectancy and lower cost in 30% of the simulations, and better life expectancy and higher cost in 48% of the simulations. Thus, in 860 of the 1000 simulations that used randomly drawn data points from the study data, the model estimated that protocol 1:1:1 achieved better outcome, and 380 of the 1000 simulations also estimated cost savings. Thus, random variation in the data demonstrated minimal effect on the ICER estimates.
ICER for subgroups of interest
The effects of the treatment arms were examined for subgroups including penetrating trauma, initial altered mental status (Glasgow Coma Scale [GCS] score < 9), and structural confirmation of significant traumatic brain injury (TBI) as measured by Abbreviated Injury Scale (AIS) Head score greater than 2 (Table 4). The ICER for blood cost per additional hemostasis was slightly improved over the base estimate for the penetrating trauma subgroup, and greatly improved for those with a GCS score less than 9 at baseline ($19,472 vs. $43,634), and for patients with an AIS Head score greater than 2 at baseline ($24,480 vs. $43,634). The ICER for total cost per additional year of life expectancy improved to $2243 for the penetrating injury subgroup and $1196 for the subgroup with AIS Head score greater than 2 at baseline.
TABLE 4.
Decision tree model results: base model and sub-group analyses estimates
| Costs and benefits | Difference in costs | Difference in benefits | ICER |
|---|---|---|---|
| Base model: blood cost per additional hemostasis: | $350,139 | 8.0 | $43,634 |
| Penetrating trauma patients only | $326,156 | 7.6 | $42,858 |
| Severe brain injury patients only (GCS <9) | $350,411 | 18.0 | $19,472 |
| Severe head trauma patient AIS Head >2 | $272,885 | 11.1 | $24,480 |
| Base model: blood cost per additional survivor | $350,139 | 3.8 | $91,324 |
| Penetrating trauma patients only | $326,156 | 4.5 | $72,732 |
| Severe brain injury patients only (GCS <9) | $350,411 | 12.1 | $28,924 |
| Severe head trauma patient AIS Head >2 | $272,885 | 9.6 | $28,370 |
| Base model: hospital cost per additional year of life expectancy | $654,086 | 218.5 | $2994 |
| Penetrating trauma patients only | $390,271 | 174.0 | $2243 |
| Severe brain injury patients only (GCS <9) | $1,044,788 | 607.9 | $1719 |
| Severe head trauma patient AIS Head >2 | $714,596 | 597.4 | $1196 |
AIS = Abbreviated Injury Scale; GCS = Glasgow Coma Scale; ICER = incremental cost-effectiveness ratio.
DISCUSSION
Trauma is the leading cause of death worldwide3,19 and in the United States in those aged 1 to 44 years old.4 Hemorrhage is the leading cause of potentially preventable death. The economic burden is tremendous, with it ranking first in the number of productive life years lost,9 but the actual cost of care has been sparsely investigated. Expenditures are estimated between $168 and $400 billion per year,2,3 including $38 to $80 billion in direct costs.3–5 Although massively bleeding patients represent a small percentage of overall trauma patients, they are the most resource intensive to care for and have substantially more direct cost attributable to them.19,20
In recent years, there has been great interest in defining the optimum transfusion strategy for these bleeding patients. Those resuscitated with more balanced ratios of plasma:platelets:RBCs have shown an improved mortality compared with the historic strategies that were plasma and platelet poor.10,21,22 Recently, in PROPPR, a randomized controlled trial of differing transfusion ratios, a small survival advantage for those suffering exsanguinating hemorrhage was found in those receiving a 1:1:1 ratio.6 More patients in the 1:1:1 arm also achieved hemostasis compared with the 1:1:2 arm.6 Based on these results, the American College of Surgeons Trauma Quality Improvement Program, the Eastern Association for the Surgery of Trauma and the United Kingdom’s National Health Service have promulgated guidelines endorsing a balanced transfusion approach13,23,24 as the standard of care.
The standard approach used for economic studies in multicenter clinical trials is to collect data on the treatment resources used and apply “standard” costs to each resource.1,4,5 This addresses variation in charges or costs across sites when determining ICERs. The strength of this study includes the a priori decision to investigate the economic impact of the two treatment arms. This allowed prospective, high-fidelity data collection of economically meaningful variables (ICD-9 codes). Thus, all data necessary to calculate cost weights that are relevant to real practice were available. As expected, those receiving the 1:1:1 strategy had higher direct blood costs. This reflects the study design, whereby this group would receive more plasma and platelets. Likewise, the total hospital costs were higher compared with the 1:1:2 group, but there were substantial gains in life expectancy (218.5 years) for this added cost.
Our estimates of hospitalization costs are similar to the only other US study including trauma patients that examined blood costs. Costs were $46,033 per hospitalization using 2010 to 2012 figures.20 This is nearly identical to our cost found in patients with penetrating trauma who survived. However, the Zbrozek study also included cardiac surgery patients and did not account for years of life gained for the transfusions or differences in transfusion strategies. In contrast, in the current study we were able to determine the ICER for additional years of life gained by the 1:1:1 approach, which was only $2994. This number is very low compared with accepted cost-effectiveness benchmarks in the literature that range from $20,000 to $100,000 per quality-adjusted life year.25 Thus, our data support that the 1:1:1 ratio is a cost-effective use of scarce medical resource.
In a sensitivity analysis, the 1:1:1 ratio resulted in increased life expectancy in 86% of the simulations. We used the calculations of the ICER for total cost per additional year of life expectancy for the sensitivity analysis by accounting for the most important determinants: blood use, hospital cost, and life expectancy. This approach is important because improved transfusion protocols are expected to decrease early deaths from trauma, but they may have economic implications, over and above the cost of the blood products used. The results of the study show the importance of collecting data for an economic analysis alongside a clinical trial for patients with costly conditions where the “economic penalty” for even small differences in increased survival is especially heavy. The cost of care can reflect the length of time a patient survives. Those who die of hemorrhage within hours of presentation will appear much less expensive if life expectancy is not considered, whereas those who survive an initial hemorrhagic insult may be extremely costly due to increased length of stay. Thus, it is important to consider ICERs for this study that are derived from more than just blood products used. These analyses are particularly important to slow or halt the diffusion of interventions that do not deliver good value for our health care dollars.4
The usefulness of the 1:1:1 ratio was further demonstrated by the decreased ICER for subgroups of particular interest including TBI and those suffering penetrating trauma. The fiscal dollars spent on TBI care are staggering, with the lifetime costs for severe TBI eclipsing $1.8 million per case.26 The cost effectiveness of plasma and platelet-rich resuscitation in patients presenting with concomitant TBI and hemorrhage has not been previously reported. The ICER was only $1196 for those with an AIS Head score greater than 2 supporting 1:1:1 as an especially beneficial and cost-effective strategy in TBI patients.
This study was designed to focus on the cost attributable to the initial 30 days following enrollment in the trial. Within the first days, patients accrue almost all the acute care hospital costs that may be expected to be affected by difference in approaches to achieving hemostasis. The largest cost “driver” in a trauma episode in the first 30 days is nearly always hospital LOS and intensity of hospital care.27 The data, however, are also limited by this short time horizon, and we cannot draw conclusions about the long-term indirect costs for survivors. Postdischarge data were not available for trial participants including functional and quality-of-life outcomes.
The charges used for this economic analysis were taken from the data collected for the PROPPR patients and matched controls from New York. We were limited to using only New York data as they were the only available SID that contained detailed revenue charge codes including unit numbers and charges for blood components. Ideally, one would use the SID from the states of the centers enrolling patients in PROPPR, but the individual SIDs did not contain the necessary data for the ICER calculations for transfusion.
To assess the applicability of these economic data, we performed a sensitivity analysis examining the overall ICER of each treatment using hospital costs available in the SID from the states enrolling patients in PROPPR. The daily cost weights were very similar compared to those using the NY data. For example, weights derived from New York were within 2% of those derived from Texas, the highest-enrolling state. When the cost weights used reflected the mean cost per day of care for trauma patients based on a state-specific analysis using NIS 2011, the ICER increased slightly, from $2994 to $3258. Thus, we believe our results to be reflective of the relative charges associated with transfusion and overall hospital charges for the study groups.
The methodology applied in this analysis is similar to that which is used in economic studies of multicenter clinical trials and uses “standard” cost weights.18,28,29 This approach is an important strength of this study. The use of absolute charges or costs can result in erroneous estimates for ICER. These figures cannot be assumed to be similar across the sites and using them has a risk of introducing bias toward a cost that more predominantly reflects the highest-enrolling centers. Finally, this study uses a Monte Carlo simulation to estimate the effect of random variation in the data used in the model for ICER calculations. Standard statistical tests are not used in analyses that use decision trees to estimate an ICER. Instead, the stability of the model is determined using a Monte Carlo approach that reestimates the model results using randomly drawn data points from the critical modeling parameters.
CONCLUSIONS
Few studies have examined the economic penalty or benefit of a trauma intervention. The PROPPR study offered the opportunity to examine the question whether two different transfusion strategies were clinically and economically different. The 1:1:1 transfusion ratio in severely injured hemorrhaging trauma patients is a cost-effective strategy for increasing hemostasis and decreasing trauma deaths.
ACKNOWLEDGMENTS
All authors were involved in the planning, design, data collection, data analysis, interpretation of results, and writing of the manuscript. Study design: RAC, KNS, SB, EEF, BCT, JBH; data analysis: RAC, KNS, SB, EEF, BCT; data interpretation: RAC, KNS, JBH; writing: RAC, KNS; critical review: SB, EEF, BCT, JBH.
No sponsors were involved in the decision to submit the manuscript for publication. The content is the sole responsibility of the authors and is not to be construed as official or as reflecting the views of any sponsor.
Source of funding: This work was sponsored by the US National Heart, Lung, and Blood Institute (U01HL077863) and the US Department of Defense, as well as Defense Research and Development Canada in partnership with the Canadian Institutes of Health Research (CIHR)- Institute of Circulatory and Respiratory Health (CRR-120612). The National Heart, Lung, and Blood Institute and the Department of Defense were consulted regarding study design only.
Rachael Callcut is supported by a career development award from the NIH K01ES026834 and NIH R01HL149670.
ABBREVIATIONS:
- AIS
Abbreviated Injury Scale
- GCS
Glasgow Coma Scale
- HCUP
Healthcare Cost and Utilization Program
- ICD-9
International Classification of Diseases, Ninth Revision
- ICER
incremental cost-effectiveness ratio
- LOS
length of stay
- NIS
National Inpatient Sample
- PROPPR
Pragmatic, Randomized, Optimal Platelet and Plasma Ratios
- SID
State Inpatient Data
- TBI
traumatic brain injury
Footnotes
CONFLICTS OF INTEREST
The authors have disclosed no conflicts of interest.
REFERENCES
- 1.Luo F, Florence C. State-level lifetime medical and work-loss costs of fatal injuries - United States, 2014. MMWR Morb Mortal Wkly Rep 2017;66:1–11. [DOI] [PMC free article] [PubMed] [Google Scholar]
- 2.Dieleman JL, Baral R, Birger M, et al. US spending on personal health care and public health, 1996–2013. JAMA 2016;316:2627–46. [DOI] [PMC free article] [PubMed] [Google Scholar]
- 3.Corso P, Finkelstein E, Miller T, et al. Incidence and lifetime costs of injuries in the United States. Inj Prev 2006;12:212–8. [DOI] [PMC free article] [PubMed] [Google Scholar]
- 4.Alghnam S, Vanness DJ, Gaskin DJ, et al. Estimating annual medical and out-of-pocket expenditures associated with traumatic injuries in the United States. J Trauma Acute Care Surg 2016;80:258–64. [DOI] [PubMed] [Google Scholar]
- 5.Velopulos CG, Enwerem NY, Obirieze A, et al. National cost of trauma care by payer status. J Surg Res 2013;184:444–9. [DOI] [PMC free article] [PubMed] [Google Scholar]
- 6.Holcomb JB, Tilley BC, Baraniuk S, et al. Transfusion of plasma, platelets, and red blood cells in a 1:1:1 vs a 1:1:2 ratio and mortality in patients with severe trauma: the PROPPR randomized clinical trial. JAMA 2015;313:471–82. [DOI] [PMC free article] [PubMed] [Google Scholar]
- 7.Fox EE, Holcomb JB, Wade CE, et al. Earlier endpoints are required for hemorrhagic shock trials among severely injured patients. Shock 2017;47:567–73. [DOI] [PMC free article] [PubMed] [Google Scholar]
- 8.Oyeniyi BT, Fox EE, Scerbo M, et al. Trends in 1029 trauma deaths at a level 1 trauma center: Impact of a bleeding control bundle of care. Injury 2017;48:5–12. [DOI] [PMC free article] [PubMed] [Google Scholar]
- 9.Holcomb JB. Optimal use of blood products in severely injured trauma patients. Hematology Am Soc Hematol Educ Program 2010;2010:465–9. [DOI] [PMC free article] [PubMed] [Google Scholar]
- 10.Holcomb JB, del Junco DJ, Fox EE, et al. The prospective, observational, multicenter, major trauma transfusion (PROMMTT) study: comparative effectiveness of a time-varying treatment with competing risks. JAMA Surg 2013;148:127–36. [DOI] [PMC free article] [PubMed] [Google Scholar]
- 11.Sperry JL, Guyette FX, Brown JB, et al. Prehospital plasma during air medical transport in trauma patients at risk for hemorrhagic shock. N Engl J Med 2018;379:315–26. [DOI] [PubMed] [Google Scholar]
- 12.Johansson PI, Stensballe J, Oliveri R, et al. How I treat patients with massive hemorrhage. Blood 2014;124:3052–8. [DOI] [PubMed] [Google Scholar]
- 13.Cannon JW, Khan MA, Raja AS, et al. Damage control resuscitation in patients with severe traumatic hemorrhage: a practice management guideline from the Eastern Association for the Surgery of Trauma. J Trauma Acute Care Surg 2017;82:605–17. [DOI] [PubMed] [Google Scholar]
- 14.Baraniuk S, Tilley BC, del Junco DJ, et al. Pragmatic randomized optimal platelet and plasma ratios (PROPPR) trial: design, rationale and implementation. Injury 2014;45:1287–95. [DOI] [PMC free article] [PubMed] [Google Scholar]
- 15.Simpson KN. Modeling with clinical trial data: getting from the data researchers have to the data decision makers need. Drug Inf J 1995;29:1431–40. [Google Scholar]
- 16.Kochanek KD, Murphy SL, Xu JQ, Tejada-Vera B. Deaths:Final data for 2014 National vital statistics reports; vol 65 no 4 Hyattsville, MD: National Center for Health Statistics; 2016. [PubMed] [Google Scholar]
- 17.HCUP National Inpatient Sample (NIS). Healthcare Cost and Utilization Project (HCUP). 2012. Agency for Healthcare Research and Quality, Rockville, MD: Available from: http://www.hcup-us.ahrq.gov/nisoverview.jsp. [Google Scholar]
- 18.Simpson KN, Tilley BC. Economic analysis of secondary trial data. Prog Cardiovasc Dis 2012;54:351–6. [DOI] [PubMed] [Google Scholar]
- 19.Campbell HE, Stokes EA, Bargo DN, et al. Quantifying the healthcare costs of treating severely bleeding major trauma patients: a national study for England. Crit Care 2015;19:276: 1–15. [DOI] [PMC free article] [PubMed] [Google Scholar]
- 20.Zbrozek A, Magee G. Cost of bleeding in trauma and complex cardiac surgery. Clin Ther 2015;37:1966–74. [DOI] [PubMed] [Google Scholar]
- 21.Brasel KJ, Vercruysse G, Spinella PC, et al. The association of blood component use ratios with the survival of massively transfused trauma patients with and without severe brain injury. J Trauma 2011;71(2 Suppl 3): S343–52. [DOI] [PubMed] [Google Scholar]
- 22.Holcomb JB, Wade CE, Michalek JE, et al. Increased plasma and platelet to red blood cell ratios improves outcome in 466 massively transfused civilian trauma patients. Ann Surg 2008;248:447–58. [DOI] [PubMed] [Google Scholar]
- 23.Camazine MN, Hemmila MR, Leonard JC, et al. Massive transfusion policies at trauma centers participating in the American College of Surgeons Trauma Quality Improvement Program. J Trauma Acute Care Surg 2015;78(6 Suppl 1): S48–53. [DOI] [PubMed] [Google Scholar]
- 24.Haider AH, Piper LC, Zogg CK, et al. Military-to-civilian translation of battlefield innovations in operative trauma care. Surgery 2015;158:1686–95. [DOI] [PubMed] [Google Scholar]
- 25.Neumann PJ, Cohen JT, Weinstein MC. Updating cost-effectiveness-the curious resilience of the $50,000-per-QALY threshold. N Engl J Med 2014;371:796–7. [DOI] [PubMed] [Google Scholar]
- 26.Fu TS, Jing R, McFaull SR, et al. Health & economic burden of traumatic brain injury in the emergency department. Can J Neurol Sci 2016;43:238–47. [DOI] [PubMed] [Google Scholar]
- 27.Fakhry SM, Martin B, Al Harakeh H, et al. Proportional costs in trauma and acute care surgery patients: dominant role of intensive care unit costs. J Am Coll Surg 2013;216:607–14 discussion 14–6. [DOI] [PubMed] [Google Scholar]
- 28.Chumney EC, Biddle AK, Simpson KN, et al. The effect of cost construction based on either DRG or ICD-9 codes or risk group stratification on the resulting cost-effectiveness ratios. Pharmacoeconomics 2004;22:1209–16. [DOI] [PubMed] [Google Scholar]
- 29.Mauldin PD, Simpson KN, Palesch YY, et al. Design of the economic evaluation for the Interventional Management of Stroke (III) trial. Int J Stroke 2008;3:138–44. [DOI] [PMC free article] [PubMed] [Google Scholar]
- 30.Toner RW, Pizzi L, Leas B, Ballas SK, Quigley A, Goldfarb NI. Costs to hospitals of acquiring and processing blood in the US: a survey of hospital-based blood banks and transfusion services. Appl Health Econ Health Policy 2011;9(1): 29–37. [DOI] [PubMed] [Google Scholar]