ABSTRACT
Pancreatic cancer is a major cause of mortality with a poor diagnosis and prognosis that most often occurs in elderly patients. Few studies, however, focus on the interplay of age and pancreatic cancer at the transcriptional level. Here we evaluated the possible roles of age-dependent, differentially expressed genes (DEGs) in pancreatic cancer. These DEGs were used to construct a correlation network and clustered in six gene modules, among which two modules were highly correlated with patients’ survival time. Integrating different datasets, including ATAC-Seq and ChIP-Seq, we performed multi-parallel analyses and identified eight age-dependent protein coding genes and two non-coding RNAs as potential candidates. These candidates, together with KLF5, a potent functional transcription factor in pancreatic cancer, are likely to be key elements linking cellular senescence and pancreatic cancer, providing insights on the balance between them, as well as on diagnosis and subsequent prognosis of pancreatic cancer.
KEYWORDS: Senescence, pancreatic Cancer, non-coding RNA, RNA-Seq, gene Module
Introduction
Cellular senescence was first discovered by Leonard Hayflick and Paul Moorhead when they described the finite proliferative capacity of cultured normal human fibroblasts [1]. Cellular senescence is a complex progressive process that can be triggered as a defence mechanism for various stressors, including telomere shortening, DNA damage response, oncogenic activation, oxidative stress and ageing [2–4]. Senescent cells generally manifest as an irreversible cell cycle arrest, positive staining of senescence-associated β-galactosidase (SA-β-gal), upregulation of p16INK4a (CDKN2A), secretion of senescence-associated secretory phenotype (SASP) and formation of senescence-associated heterochromatin foci (SAHF) [5,6]. At the molecular level, in addition to p16-RB upregulation, cellular senescence is also accompanied by activation of the p53 pathway in multifarious human cell strains [7]. These two pathways can function either collaboratively or independently in senescence progression in different microenvironments.
Pancreatic cancer is a malignant tumour with ineffective treatment choices and high mortality rates. The four major driver genes of pancreatic cancer are KRAS, p16INK4a (CDKN2A), p53 and SMAD4 [8]. Pancreatic cancer has an overall 5-year survival rate of <7%, and almost all survivors are patients undergoing surgical resections, with survival rates of 15–25% [8,9]. Pancreatic ductal adenocarcinoma (PDAC) is the most common type of pancreatic cancer. PDAC arises from non-invasive precursor lesions, accompanied by microscopic non-invasive epithelial proliferations within the pancreatic ducts, termed pancreatic intraepithelial neoplasias (PanINs) [10,11]. PanINs, believed to be the precursors of the cancer, were divided into three stages, PanINs 1–3, with higher stages manifesting similar genetic changes to those in PDAC [12].
As both senescence effectors and tumour suppressors, p16INK4a and p53 are involved in pancreatic cancer as driver genes, indicating that senescence might function as a tumour suppressive mechanism and represent significant barriers to malignant tumour progressions [4,13]. In oncogene-induced senescence, these tumour suppressors were activated, triggering senescence in response to oncogenic signalling [14]. In addition to these canonical protein-coding factors, non-coding RNAs have emerged as crucial regulators in numerous processes [15], including nuclear organizations [16], epigenetic regulations [17,18], and cancer progressions [19–22]. Among them, some long non-coding RNAs (lncRNAs) with lengths exceeding 200 nucleotides have been well studied, as exemplified by the imprinted H19 in both cancers [23,24] and senescence [25], Malat1 in both cancers [26,27] and senescence [28,29], and Neat1 in the paraspeckle [30,31].
Senescence is likely to occur during the earliest stages of PDAC [4]. Other researchers demonstrated that senescent cells staining positively for senescence markers (p16, Dec1 and DcR2) were detected within early grade PanINs lesions, but not in normal ducts or PDAC [4,9]. Moreover, cooperatively genetic deficiency of p16INK4a/Arf and activation of Kras triggered an early PanIN lesions and accelerated invasive and metastatic PDAC [32]. These data implied that senescence is a barrier against PDAC progression. Nevertheless, pathological processes are always complicated. Accumulating evidences revealed that senescence, as a proinflammatory process, secretes a prolonged or deregulated SASP to promote tumorigenesis [33,34]. Indeed, overexpression of IL-1a, a SASP component and a target downstream of Kras, correlated with Kras mutation, NF-kB activity and poor survival in PDAC [35].
In the highly inflammatory context of pancreatic cancer, the exact regulatory interplay between senescence and PDAC at the transcriptional level is still unclear, especially for lncRNAs. Of note, pancreatic cancer is likely to be age-dependent, with most cases occurring in older patients [10,36], strengthening the value of studying this interplay.
In this study, we used RNA-Seq to profile the transcriptomes of BALB/c and C57 mouse embryo fibroblast (MEF) cells, integrating different published datasets, including ATAC-Seq and ChIP-Seq, using multi parallel analyses, and illustrated the interplay between senescence and pancreatic cancer at transcriptional regulation and post-transcriptional levels.
Results
Identifying differentially expressed genes in proliferating and senescent MEFs
We chose MEF as a cellular replicative senescence model to study senescence mechanisms. We isolated MEF cells from pregnant BALB/c and C57 mice and in vitro sub-cultured isolated cells until they lost the ability to proliferate. Cells from passage 2 (P2) and passage 8/9 (BALB/c: P8 and C57: P9) were defined as proliferating and senescent cells, respectively. High senescence-associated β-galactosidase activity (SA-β-gal), which is a traditional senescence marker [7], was detected in senescent cells, but not in proliferating cells (Fig. 1(A), Figure S1).
Figure 1.
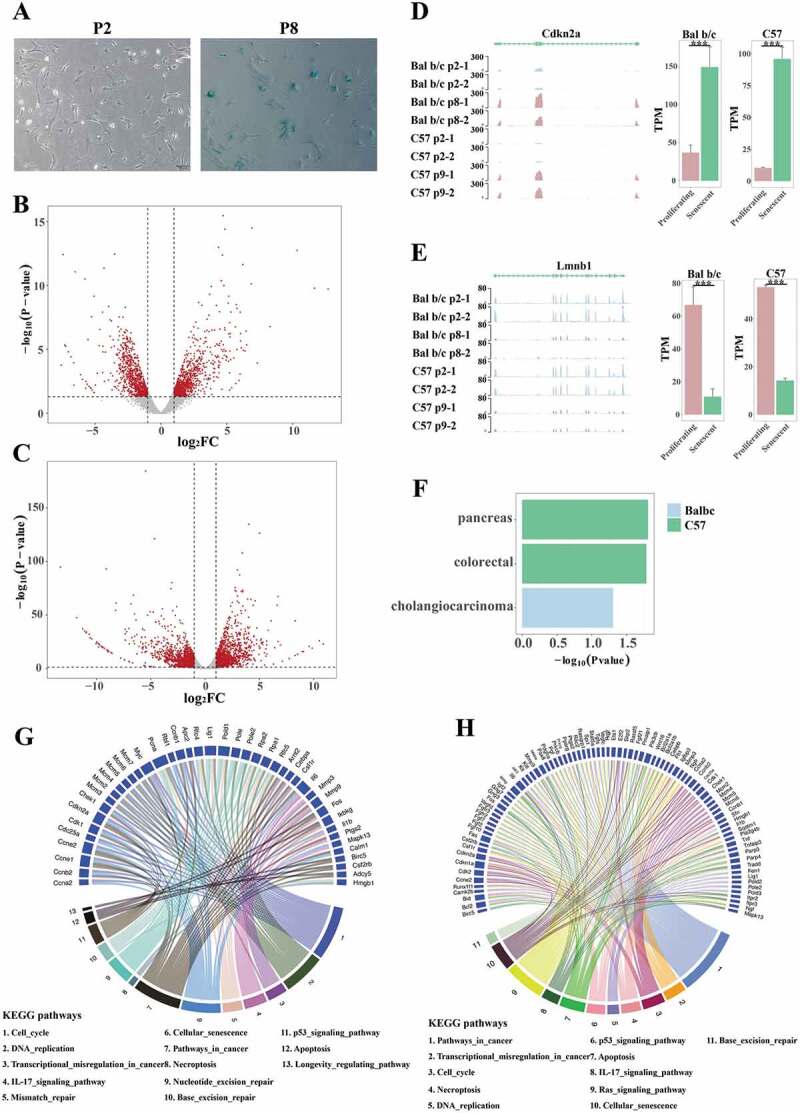
Characterization of RNA-Seq data from proliferating and senescent MEFs RNA-Seq data. (A) β-gal staining of proliferating (P2) and senescent (P8) BALB/c MEFs. Senescent MEFs presented β-gal staining positivity. (B, C) Volcano plots of differentially expressed genes (DEGs) of BALB/c (B) and C57 (C) MEFs. The red dots stand for significant DEGs based on the thresholds, indicated by dotted lines. X-axis stands for log2(fold change) and y-axis stands for -log10(p-value). (D, E) Expression patterns of senescent marker p16INK4a (D, left) and Lmnb1 (E, left), modified from the WashU epigenome browser [37]. The bar plots presented in RNA-Seq show the quantification and differential analysis results of p16INK4a (D, right) and Lmnb1 (E, right). (F) Network of Cancer Genes (NCG) enrichments of significant terms in two MEF datasets, indicated by different colours. X-axis stands for -log10(p-value). (G, H) KEGG enrichment results of BALB/c (G) and C57 (H) DEGs demonstrated the interfaces of cellular senescence, DNA damage, cancers and their related pathways, as well as genes involved in the complex network. Links in different colours connected different pathways and genes involved. We selected pathways related to senescence, DNA damage and cancers, to complete the figure. All pathways presented were significantly enriched, with p-value<0.05.
RNA-Seq of eight MEF samples (two replicates of proliferating and senescent MEFs from BALB/c and C57 mouse separately) revealed 3,405 differentially expressed genes (DEGs, 2,626 protein-coding and 779 non-coding RNAs) in senescent C57 MEFs and 1,887 DEGs (1,547 protein-coding and 340 non-coding RNAs) in BALB/c (p-value<0.05 and abs (log2FC)>1 (FC, Fold Change); Fig. 1(B,C)). In both MEFs, the numbers of up-regulated DEGs were approximately equal to the down-regulated ones. Canonical senescence markers changed significantly in senescent MEFs, such as p16INK4a (Cdkn2a) and Lmnb1 (Fig. 1(D,E)).
In senescence processes, genes in various pathways are altered and respond to intracellular and extracellular environmental changes, so we selected these DEGs for functional enrichment analyses. KEGG pathway and Network of Cancer Genes (NCG) enrichments were performed with geneSCF [38], based on p-value<0.05. Many genes were found to participate in senescence, DNA damage and cancer related pathways (Fig. 1(G,H)). p16IKN4a (Cdkn2a) is essential in senescence processes [7], and at the same time is an indispensable tumour suppressor gene in cancers [39]. As shown in Fig. 1(G,H), p16IKN4a participated in cellular senescence pathway (mmu04218), cell cycle pathway (mmu04110), p53 signalling pathway (mmu04115) and pathway in cancer (mmu05200). In addition, Myc was involved in cell cycle pathway (mmu04110), cellular senescence pathway (mmu04218), transcriptional mis-regulation in cancer pathway (mmu05202) and pathways in cancer (mmu05200).
Considering senescence-related cancers, we observed three cancers (pancreatic cancer, colorectal cancer and cholangiocarcinoma) that were significantly enriched in NCG of the DEGs in senescent MEFs (Fig. 1(F)). These data suggested that genes affecting senescence processes are inclined to function in some cancers, therefore indicating that the developments and progressions of these cancers may be age-dependent.
Identifying age-dependent DEGs in pancreatic cancer patients
We obtained TCGA pancreatic cancer data from UCSC xena browser GDC hub. Since we focused on pancreatic ductal adenocarcinoma (PDAC), we filtered the data and retained 187 PDAC patients’ RNA-Seq data. Regarding age-dependent PDAC, we defined two stages: age less than 50 was defined as ‘young’, and age more than 80 as ‘very old’. According to this interval division, 915 genes (858 protein coding and 57 non-coding RNAs) showed age-dependent differential expression (Fig. 2(A)). Upregulated genes in very old patients were about 1.4 times the number of down-regulated genes. Further we checked the expression levels of these 915 DEGs in PDAC patients aged between 51 and 79 (‘middle-aged’). Taking the average expression levels as indicators, these 915 DEGs exhibited gradually upregulations or downregulations from ‘young’ to ‘very old’ (Fig. 2(B,C)).
Figure 2.
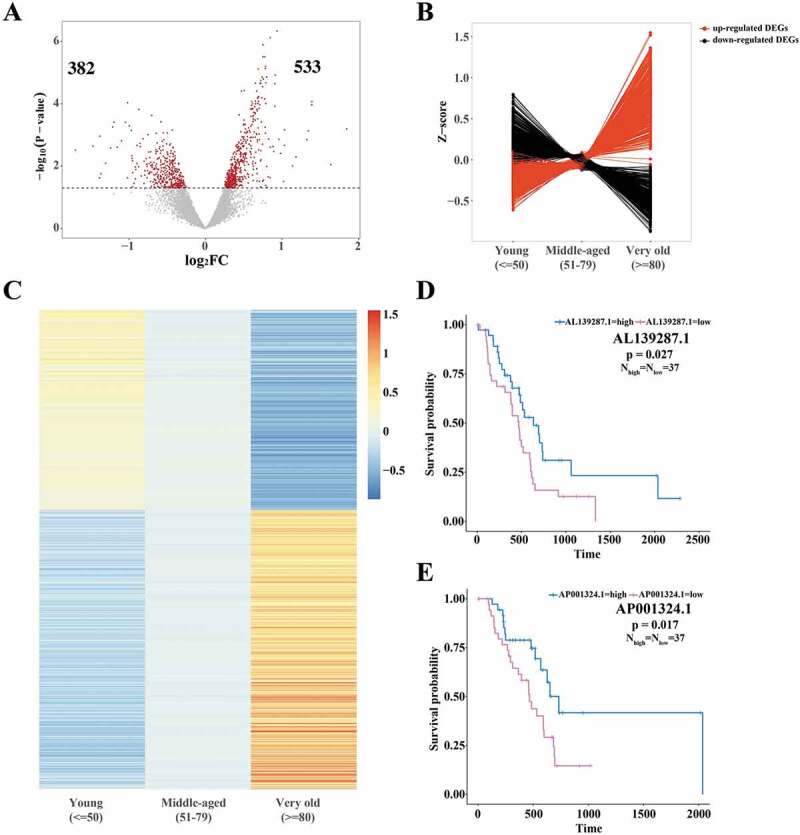
Characterization of TCGA RNA-Seq data of ‘young’ and ‘very old’ PDAC patients. (A) Volcano plots of differentially expressed genes (DEGs) of ‘young’ and ‘very old’ PDAC patients. X-axis stands for log2(fold change) and y-axis stands for -log10(p-value). The red dots represent significant DEGs based on the threshold (p-value<0.05), indicated by dotted lines. The numbers revealed 533 upregulated genes and 382 downregulated genes in ‘very old’ PDAC patients. (B, C) Line plot (B) and heatmap (C) exhibited the gradual expression changes of 915 differentially expressed genes in ‘young’ and ‘very old’ patients. Patients aged from 51 to 79 were defined as ‘middle-aged’. For the 915 genes, average FPKMs from patients in three groups were normalized to z-scores. (D, E) Survival analysis of non-coding RNAs AL139287.1 and AP001324.1. Low expressions of both non-coding RNAs are significantly associated with decreased survival probability.
For 57 differentially expressed non-coding RNAs, cut-off thresholds were determined by Q4 versus Q1 quartile to define high and low expression, which were then subjected to survival analyses. In total, two long non-coding RNAs (lncRNAs) were significantly (p-value<0.05) associated with the patients’ survival status (Fig. 2(D,E)). Low expression of AL139287.1 and AP001324.1 lncRNA both significantly decreased patients’ survival probabilities (Fig. 2(D,E)). Thus, these two lncRNAs were likely to act as regulators in PDAC development and progression.
Identifying gene modules highly correlated with clinical traits
For the 915 age-dependent DEGs, we employed the WGCNA package [40] to construct a weighted correlation network. For network construction, we selected power 6 as the soft threshold with R-square more than 0.85 and mean connectivity less than 100 (Fig. 3(A,B)). In the network, DEGs were assigned to six gene modules based on their interaction patterns, indicated by different colours (Fig. 3(C)). Genes classified in one gene module, indicated by one colour, had similar expression profiles. We next calculated correlations between gene modules and clinical traits to discover genes highly associated with PDAC clinical traits (Fig. 3(D)). Since the input genes were age-dependent, the gene modules and ageing were relatively highly correlated. Beyond that, the blue module, with 182 genes, was highly associated with patients’ survival time and neoplasm histologic grade (Fig. 3(D)). This was the same case for the green module, with 98 genes, which was also highly associated with patients’ survival time and vital status (Fig. 3(D)). These results revealed two gene modules associated with survivals, one of which was associated with PDAC histologic grade.
Figure 3.
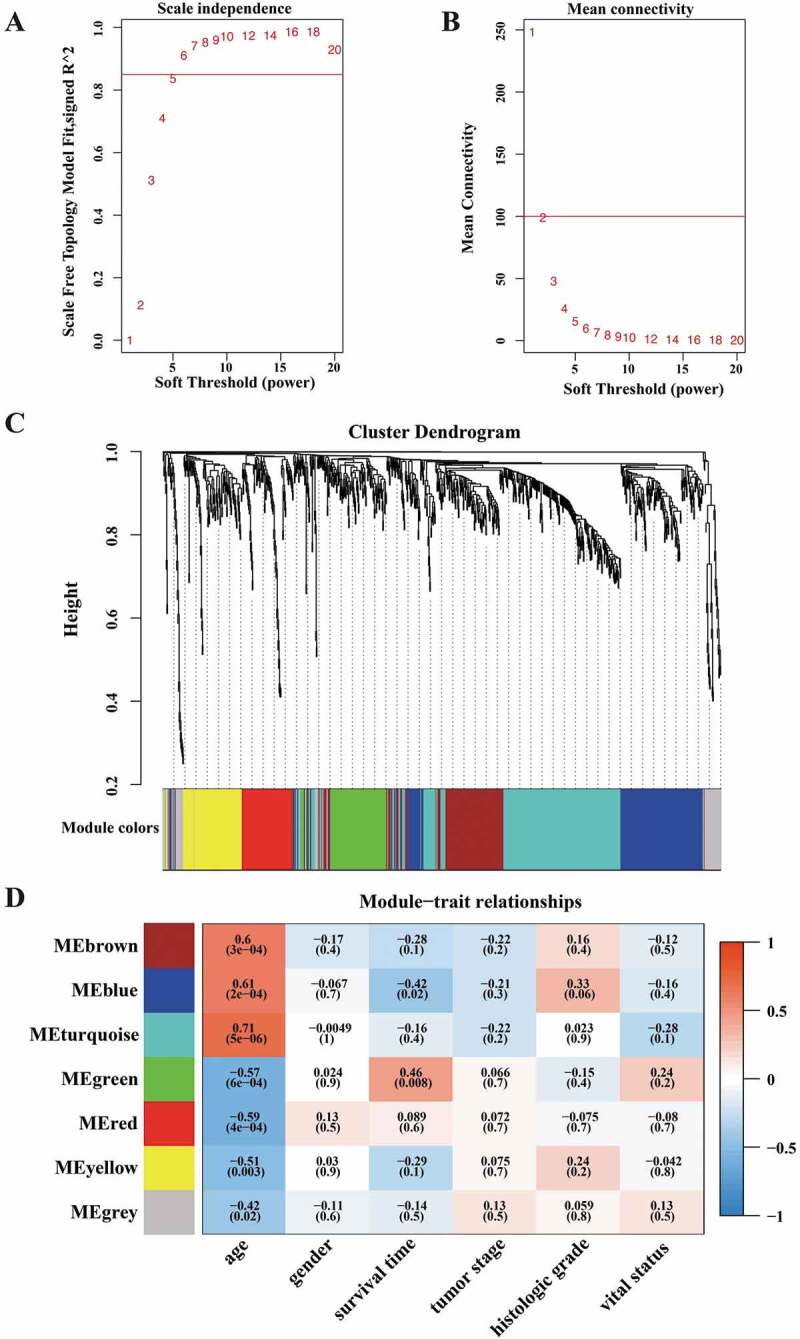
Weighted correlation network analysis of age-dependent DEGs in PDAC. (A) In WGCNA, soft threshold power was determined as the minimum value based on a scale free topology fit index more than 0.85, which was 6 here. (B) Analysis of mean connectivity in WGCNA for different values. (C) DEGs were clustered into six gene modules, indicated by different colours. Genes classified in one gene module had similar expression profiles. (D) Heatmap presentation of Pearson correlations between gene modules and clinical traits. In the clinical traits, age stands for age at initial pathologic diagnosis, gender stands for demographic gender, survival time stands for days to death of patients, tumour stage stands for tumour stages (e.g. I, II, III, and IV) in diagnoses, histologic grade stands for neoplasm histologic grade (e.g. G1, G2, G3, and G4), and vital status stands for patients’ survival status.
Identifying regulatory transcription factors in PDAC
We next obtained high-throughput ATAC-Seq data of pancreatic control and cancer samples from SRP102442 (GSE97008) [41] to elucidate potential transcription factors (TFs) controlling the gene modules. After aligning sequencing reads to the UCSC human genome (hg38), we evaluated genome-wide differential chromatin accessibility, either different accessible status or differential accessible levels. We discovered a total of 95,782 differential open chromatin regions, with 4,604 (about 4.81%) located at promoter-TSS regions (Fig. 4(A)). We then used the HOMER known motif finding tool [42] and identified 314 TFs potentially functioning in pancreatic cancer development with p-value less than 0.05 (Fig. 4(B)), as exemplified by the top six candidates (Fig. 4(C)). bZIP family proteins were identified as essential roles, since the top nine candidates all belonged to the bZIP family and had a highly conserved motif. Focusing on age-dependent factors, we merged the common genes between potential TFs and DEGs from either BALB/c or C57 MEFs, and generated a significative list of 50 TFs (Fig. 4(D)). In addition, seven of these 50 factors were reported to be related to PDAC grade (Figure S2) [43]. Of note, Klf5 was significantly downregulated (Fig. 4(E)), and Foxa1 was upregulated in senescent MEFs (Fig. 4(F)), indicating their age-dependent functions in PDAC development. In addition to the known TFs, new factors also appeared as promising age-dependent regulators associated with pancreatic cancer.
Figure 4.
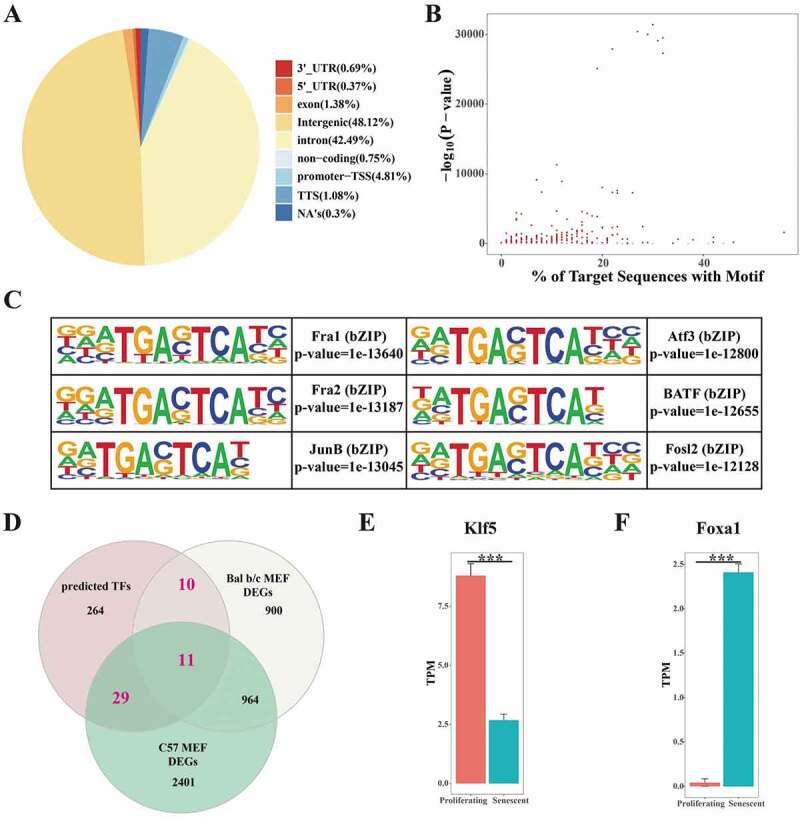
Characterization of ATAC-Seq and age-dependent transcription factors (TFs). (A) Classifications of differential accessible chromatin regions in pancreatic cancer. Different colours stand for different signatures, and NA’s stood for peaks that couldn’t be recognized as the above signatures. (B) Identified TFs and their motif coverage. X-axis stands for the percentage of target sequences with motif and y-axis stands for -log10(p-value). (C) Presentation of top six significant TFs and their motifs. (D) Venn plot illustrating the common parts of identified TFs and MEF DEGs, as age-dependent TFs, potentially functioning in both cellular senescence and pancreatic cancer. (E, F) Differential expressions of Klf5 (E) and Foxa1 (F), two TFs in the common parts in D. Klf5 was significantly downregulated and Foxa1 was significantly upregulated in senescent MEFs.
Identifying potential targets of TFs in PDAC
Using ChIP-Seq data from the Cistrome DB, we found that KLF5 and FOXA1 bound at no less than 70% of the above mentioned blue and green module genes (KLF5: 70%, FOXA1: 72%), suggesting their direct regulation of the targets (Fig. 5(A,B)). We also checked two new factors in PDAC, MAFK and ETS1. We found that MAFK bound at over 90% and ETS1 bound at about 38% of the two module genes (Figure S3). As shown in these figures, the blue links demonstrated connections between TFs and their targets in both modules.
Figure 5.
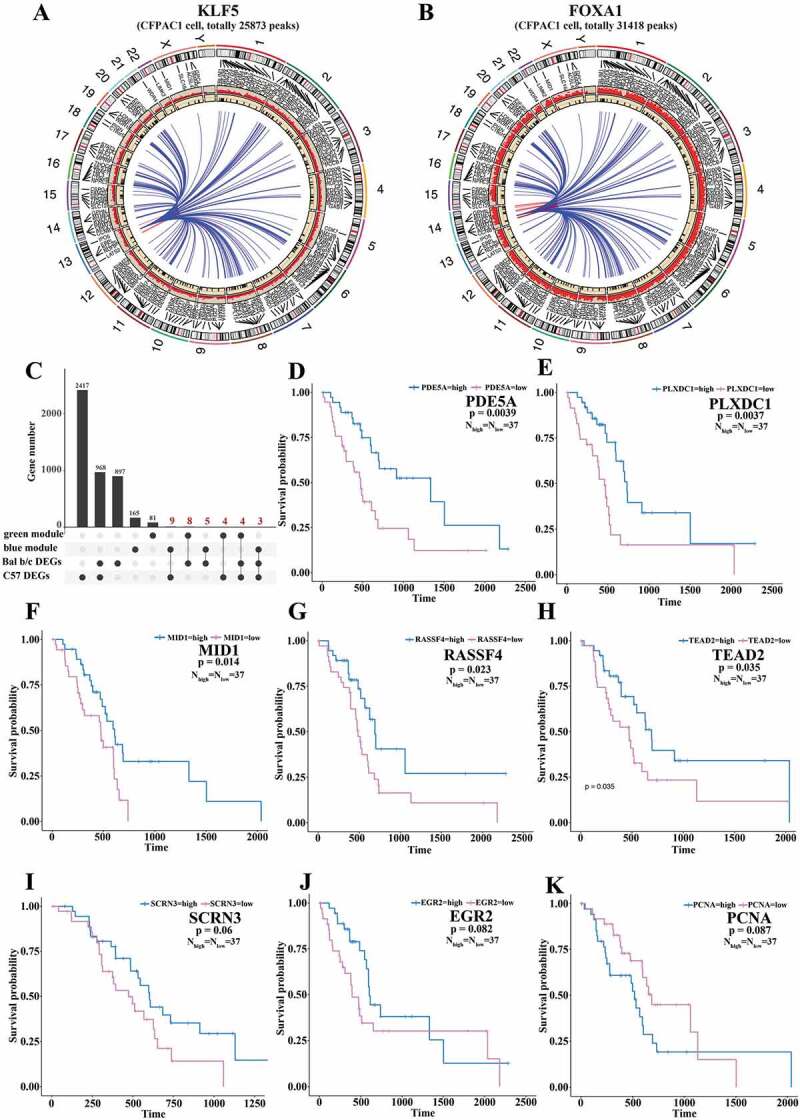
Targets identification of transcription factors (TFs) in pancreatic cancer and corresponding survival analyses. (A, B) ChIP-Seq binding sites presentations of KLF5 (A) and FOXA1 (B) in pancreatic CFPAC1 cell. The outermost circle is chromosome information, and besides lines and names are the two module genes. The red circle represents ChIP-Seq binding sites, and the inner black circle represents two module genes’ locations. The blue links are connections between TFs and their targets in both modules. The red links connected their targets on the same chromosome. (C) Common parts of two module genes and MEF DEGs. Four groups of genes below were divided into several sub-groups, indicated by black dots in the same row. Y-axis stands for the total gene number, the number above the bar plots stands for gene number of corresponding sub-groups, black dot stands for a single sub-group, and black line links the sub-groups for further investigations. We merged the sub-groups of genes indicated in red, a total of 33 genes. (D-K) Survival analyses illustrate eight of the 33 common genes were associated with survival probability. P-value is indicated in corresponding figures.
To obtain conserved and consistent targets, we merged the common genes of each gene module and MEF DEGs, generating a set of 33 genes (Fig. 5(C)). Survival analysis indicated that expression levels of eight of the 33 genes (PDE5A, RASSF4, PLXDC1, TEAD2, MID1, EGR2, PCNA, and SCRN3) influenced patients’ survival with p-values less than 0.1 (Fig. 5(D–K)). The results demonstrated that these specific genes, targeted by regulatory TFs (e.g. KLF5, FOXA1), had essential roles in PDAC developments and affected patients’ survival.
KLF5 regulates potential age-dependent targets in PDAC
To further confirm that the candidate genes and non-coding RNAs are age-dependent, we collected and analysed RNA-Seq data from replicative senescence and various induced senescence. Fold changes of each candidate demonstrated their consistent differential expressions in various types of senescence (Fig. 6(A)). MID1, TEAD2 and PCNA were significantly downregulated in many types of senescence, while RASSF4 and EGR2 were significantly upregulated (Fig. 6(A)). Expressions of the two candidate lncRNAs (AL139287.1 and AP001324.1) also changed significantly in different types of senescence (Fig. 6(A)). These results support their age-dependent roles in senescence processes.
Figure 6.
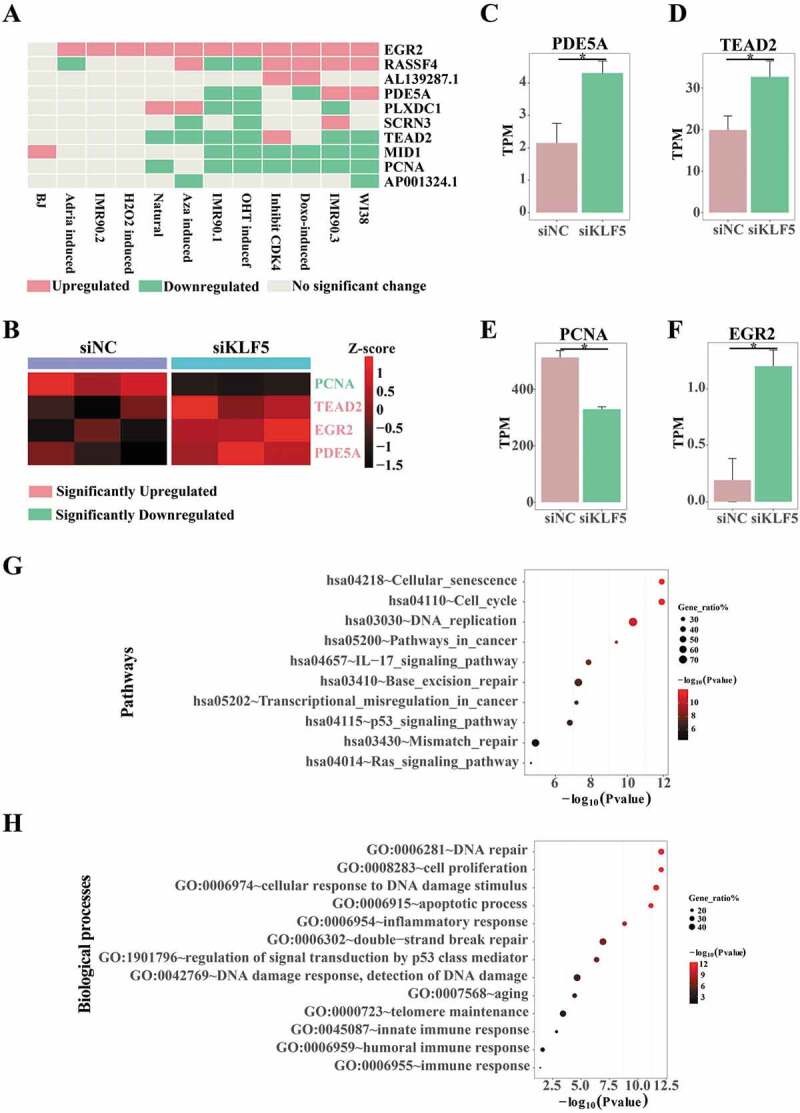
Expression profiles of candidates in cellular senescence and KLF5 KD data. (A) Expression validations of 10 candidates (8 coding genes and 2 non-coding RNAs) in various senescence. X-axis stands for various senescence data, publicly available, and y-axis stands for 10 candidates. Pink is upregulation in senescent cells, while green is downregulation in senescent cells. (B) Expression validations of candidates significantly changed in KLF5 KD data. Expression levels were normalized to z-scores, indicated by scale bar. Pink label stands for upregulation in KLF5 KD data, while green label stands for downregulation in KLF5 KD data. (C-F) Expression comparisons of PDE5A (C), TEAD2 (D), PCNA (E) and EGR2 (F) in KLF5 KD data. (G, H) KEGG pathway enrichments (G) and Gene ontology biological process enrichments (H) of differentially expressed genes in KLF5 KD data. We selected pathways related to senescence, DNA damage and cancers, to complete the figure. All terms are significantly enriched, with p-value<0.05. X-axis stands for -log10(p-value) and y-axis stands for enriched terms. Different colours of dots stand for different significances, and different sizes of dots stand for different ratios of enriched genes to all genes in corresponding terms.
We further applied KLF5 knocking down (KD) data to further validate the regulation of KLF5 on expressions of these candidates. RNA-Seq data of KLF5 KD from GSE88977 [44] revealed that PCNA was significantly down-regulated, while TEAD2, EGR2, and PDE5A were up-regulated when KLF5 was knocked down (Fig. 6(B–F)). These results strongly suggest that, KLF5 directly regulated the expressions of these candidates, further functioning in senescence and PDAC progressions.
We next applied Gene ontology (GO) and KEGG pathway enrichments to analyse the total number of DEGs triggered by KLF5 KD. Results indicated that these DEGs were involved in senescence processes, DNA damage-related pathways and cancer pathways, indicating that KLF5 might not only function in cancers, but also be an essential factor in DNA damage processes linking senescence and cancers (Fig. 6(G,H)).
Validating potential targets of TFs in PDAC
Based on the Human Protein Atlas (HPA) database, immunohistochemistry (IHC) staining results were employed to validate the protein levels of the above identified candidate genes in normal and pancreatic cancer samples [45,46]. The HPA database classified the IHC staining as four grades: high, medium, low and not detected. For visualization, we respectively scored these grades as 3, 2, 1 and 0. For validation, PDE5A was downregulated in pancreatic cancer (Fig. 7(A)), relatively consistent with the decreased survival identified in patients with low PDE5A expression (Fig. 5(E)). Furthermore, staining positivity of PDE5A decreased in ‘very old’ pancreatic cancer patients (Fig. 7(B)), consistent with its downregulation in ‘very old’ PDAC patients identified in TCGA data. Beyond that, PCNA exhibited opposite changes, manifesting increased expression both in pancreatic cancer (Fig. 7(C)) and in ‘very old’ PDAC patients (Fig. 7(D)). Then we presented four representative figures of PDE5A (Fig. 7(E–H)) from the HPA database [45,46], as original data of statistical differences. The data taken together demonstrate that these candidates may be promising linker genes between cellular senescence and pancreatic cancer, which positively influences the survival probability of PDAC patients.
Figure 7.
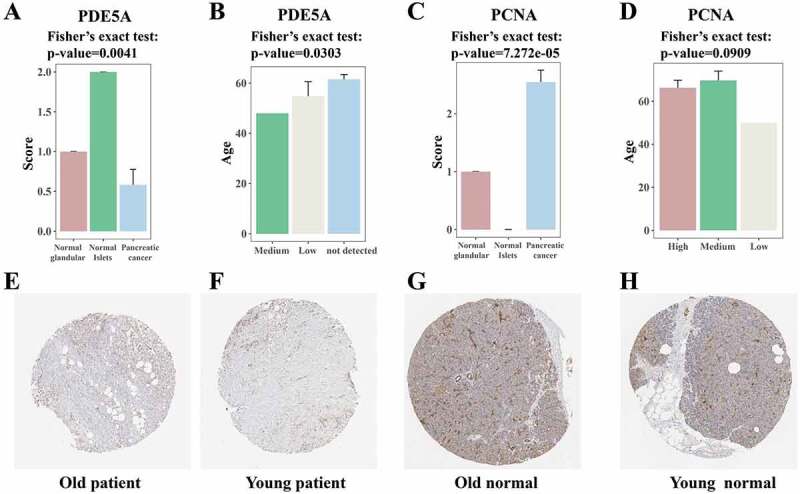
Immunohistochemistry (IHC) quantification results of candidate genes from the Human Protein Atlas (HPA) database. (A) Visualization of PDE5A IHC positivity in normal tissues and pancreatic cancers. The HPA database classified the IHC staining as four grades: high, medium, low and not detected. For visualization, we separately scored these grades as 3, 2, 1, and 0. Y-axis stands for scores and x-axis stands for normal tissues and cancers. The significance was tested with Fisher’s exact test. (B) Average population ages of different PDE5A expression levels. Y-axis stands for ages and x-axis stands for IHC staining grades. The significance was tested with Fisher’s exact test. (C) Visualization of PCNA IHC positivity in normal tissues and pancreatic cancers. (D) Average population ages of different PCNA expression levels. (E-H) Four representative IHC staining figures of PDE5A from HPA database. * p-value<0.05, ** p-value<0.01, *** p-value<0.001 by Fisher’ exact test.
AL139287.1 and PDE5A function in pancreatic cancer and senescence
To address their regulatory functions, we next knocked down and overexpressed AL139287.1 and PDE5A in Panc1 cells. After knocking down AL139287.1 in Panc1, we checked expression levels of senescence, proliferation, and pancreatic cancer markers (Fig. 8(A)). LMNB1 was upregulated, and PCNA, a proliferation marker, was also upregulated (Fig. 8(A)). RAD51, whose overexpression contributed to pancreatic cancer developments, was upregulated after knocking down AL139287.1 (Fig. 8(A)). MSLN and VEGFA, both highly expressed in cancers, were upregulated after knocking down AL139287.1 (Fig. 8(A)). Differential expressions of these markers were consistent with the survival analysis showing that patients with low levels of AL139287.1 had lower overall survival rates. Furthermore, P53 and P21, both senescence markers, were upregulated (Fig. 8(A)), consistent with the differential results that AL139287.1 was downregulated in very old patients. Contrarily, AL139287.1 overexpression exhibited opposite effects on the differential expression of LMNB1, RAD51, PCNA, and P21 (Fig. 8(B,C)). In addition to these changes, HIF1A and WNT7B, both upregulated in pancreatic cancer, were downregulated (Fig. 8(C)). Besides AL139287.1, after knocking down PDE5A in Panc1, PCNA, CCND1, and MKI67 were upregulated (Fig. 8(D)), indicating increased proliferative potential. SMAD4, a tumour suppressor gene, was upregulated after PDE5A KD, while WNT7B, which was highly expressed in PDAC cell line, was downregulated (Fig. 8(D)).
Figure 8.
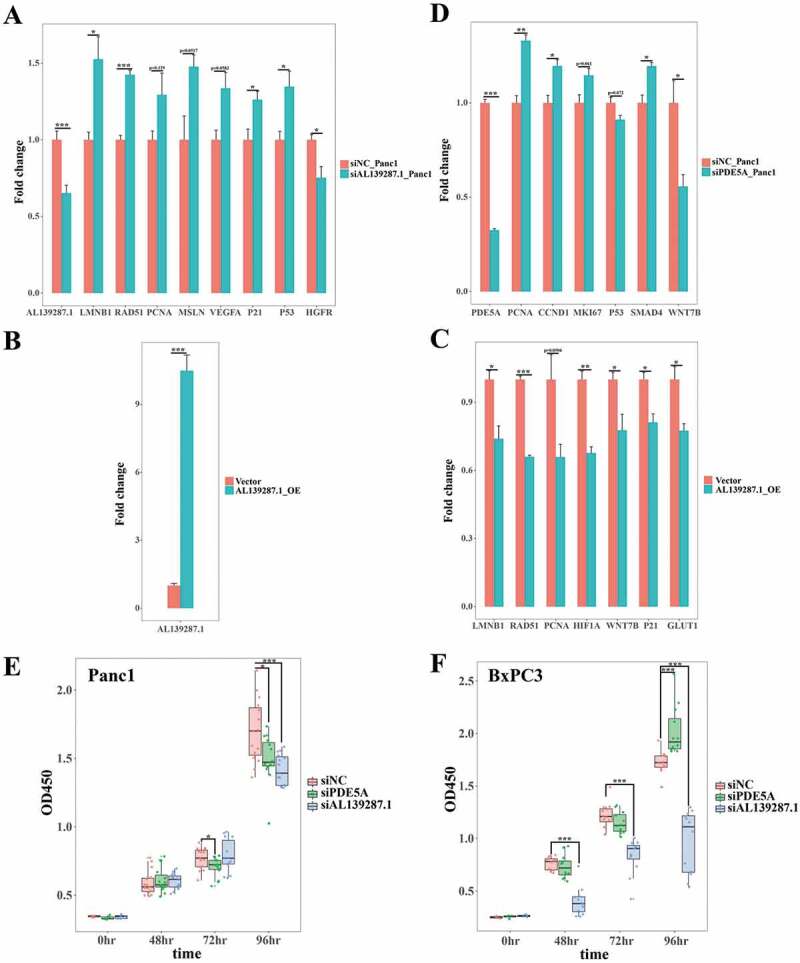
PDE5A and AL139287.1 expression affected pancreatic cancer cell proliferation and senescence. (A) Knocking down AL139287.1 in Panc1 cells affected the expressions of proliferation markers (PCNA), pancreatic cancer markers (RAD51, MSLN, VEGFA, and HGFR), and senescence markers (LMNB1, P53, and P21). X-axis stands for different markers and y-axis stands for fold changes. (B, C) Overexpressing AL139287.1 in Panc1 cells (B) affected the expressions of proliferation markers (PCNA), pancreatic cancer markers (RAD51, HIF1A, WNT7B, and GLUT1), and senescence markers (LMNB1 and P21, C). X-axis stands for different markers and y-axis stands for fold changes. (D) Knocking down PDE5A in Panc1 cells affected the expressions of proliferation markers (PCNA, CCND1, and MKI67), pancreatic cancer markers (SMAD4 and WNT7B), and senescence markers (P53). X-axis stands for different markers and y-axis stands for fold changes. (E, F) CCK8-assay tested the cell viability and proliferation after knocking down PDE5A and AL139287.1 in Panc1 cells (E) and BxPC3 cells (F). X-axis stands for time after siRNA transfection and y-axis stands for OD450 values. Knocking down PDE5A decreased cellular proliferation in Panc1, while increased cellular proliferation in BxPC3 cells about 96 hours after siRNA transfection. Knocking down AL139287.1 significantly decreased cellular proliferation in both cells 96 hours after siRNA transfection. * p-value<0.05, ** p-value<0.01, *** p-value<0.001 by Students’ t-test.
We also applied CCK-8 assay to AL139287.1 and PDE5A KD in Panc1 (Fig. 8(E)) and BxPC3 cells (Fig. 8(F)). Knocking down AL139287.1 significantly decreased cellular proliferation in both cells 96 hours after siRNA transfection (Fig. 8(E,F)). Knocking down PDE5A decreased cellular proliferation in Panc1, while increased cellular proliferation in BxPC3 cells about 96 hours after siRNA transfection.
Discussion
To unravel the relationship between cellular senescence and cancers, we evaluated the possible roles of DEGs in senescent MEFs. Enrichment analyses revealed that these DEGs participated in a complicated network of senescence and cancers, including pancreatic cancer. Focusing on PDAC, we identified 915 DEGs in ‘very old’ PDAC patients, including differential non-coding RNAs and mRNAs. Among the dysregulated non-coding RNAs, AL139287.1 and AP001324.1 significantly influenced patients’ survival. Moreover, in the WGCNA and survival analysis, we elucidated eight age-dependent protein coding genes as highly essential regulatory elements. Further integrating ATAC-Seq and ChIP-Seq data, we confirmed KLF5 and FOXA1 as their upstream TFs. We next confirmed their age-dependent roles in various types of senescence and their dysregulation in KLF5 KD data. In total, we established that eight protein coding genes and two non-coding RNAs as age-dependent essential elements in linking cellular senescence and pancreatic cancer and influencing survival rates, thus serving as potential diagnostic and prognostic indicators.
Analysis of MEF cells replicative senescence data provided a hint that parts of age-dependent DEGs were significantly involved in the pancreatic cancer network. This result implied a potential link between senescence and pancreatic cancer, encouraging us to further focus on the roles of age-dependent DEGs in pancreatic cancer with human TCGA data. Moreover, the DEGs in MEF cells were overlapped with those in pancreatic cancer (Figure S5A). DEGs in pancreatic cancer shared 53 genes with BALB/c MEF DEGs and 68 genes with C57 MEF DEGs (Figure S5A).
Among the candidates, PDE5A was upregulated in senescent MEFs (Figure S4A), while it was downregulated in ‘very old’ PDAC patients (Figure S4B). We hypothesized that this phenomenon was mainly due to the decreased expression levels in pancreatic cancer. Thus, the decreased expression of PDE5A triggered by pancreatic cancer may potently reverse its upregulation triggered by senescence to a very low level in ‘very old’ PDAC patients. Moreover, this opposite effect also occurred on PCNA, MID1, and RASSF4.
In the knockdown experiments of AL139287.1, the cellular system maintained a dynamic balance between senescence and pancreatic cancer. AL139287.1 was downregulated in very old PDAC patients in TCGA data (Figure S4C). Knocking down this lncRNA in Panc1 cells triggered changes in senescent markers towards senescence, e.g. increased P53 and increased P21, consistent with its downregulation in very old PDAC patients. Meanwhile, low levels of AL139287.1 were significantly associated with low survivals in PDAC patients. Knocking down AL139287.1 induced some changes in markers towards increased proliferations in pancreatic cancer, e.g. increased PCNA, increased RAD51, and increased MSLN, contributing to death from cancer. AL139287.1 overexpression triggered the inverse changes in expression, e.g. decreased P21, decreased PCNA, decreased RAD51, and decreased LMNB1. Thus, we hypothesized cells maintained a dynamic system to cope with the balance between senescence and pancreatic cancer.
Among the predicted TFs from ATAC-Seq, AP1 ranked at the top place. Indeed, AP1 was previously reported to rank first among the enriched motifs at enhancer elements, which played indispensable roles in pancreatic cancer progression [47]. Moreover, FOXA1 acted as a key factor to promote the enhancer activation and cancer metastasis [47]. In addition, AP1 phosphorylation played an essential role in pancreatic cancer [48]. These studies provided deeper insights into pancreatic cancer pathogenesis, which would be a great follow-up study in the near future.
At the interface of cellular senescence and cancer, DNA damage is thought to be one of the pivotal linkers [49]. DNA damage accumulation and decreased capacity for DNA repair could trigger progressive impairments of functions and ageing [50], as well as increase the risk of cancer [49]. Eliminating DNA damage could, however, delay both cancer development and the ageing process [49]. In our enrichments of MEF DEGs (Fig. 1(G,H)), cellular senescence, DNA damage and cancer pathways interaction, supported the belief that DNA damage is a potential linker between senescence and cancer. In addition to influencing cellular senescence and cancer-related pathways, knocking down KLF5 also affected DNA damage and repair processes (Fig. 6(G,H)). In addition, previous research has shown that a prolonged or deregulated SASP, secreted by senescent cells, could promote tumorigenesis, since senescence is a proinflammatory process [33,34]. In our results, inflammatory pathways appeared as an effector (Figs. 1(G,H) and 6(G,H)). Overall, we provided evidences supporting these views at the transcriptional and post-transcriptional level.
In addition, colorectal cancer and cholangiocarcinoma were also inclined to behave in age-dependent manners (Fig. 1(F)). VEGFR2 signalling was reported to prevent colorectal cancer senescence to promote tumorigenesis in mice and inhibition of VEGFR2 signalling induced colorectal cancer cell senescence of both human and mouse [51]. We believe these results will shed light on future research regarding the cellular senescence and cancers, as well as pivotal regulatory coding and non-coding factors.
Materials and methods
Cell isolation and cell culture
We selected 12.5-day pregnant BALB/c and C57 mice as donors; primary MEFs were isolated from the embryos. The medium used to culture MEF cells was DMEM (GIBCO) supplemented with 10% FBS (foetal bovine serum; GIBCO) and 1% penicillin/streptomycin (GIBCO). Cell culture conditions included a humidified 37°C incubator with 5% CO2. In order to obtain replicative senescent MEF cells, we in vitro sub-cultured MEF cells for more than eight passages. Every time we plated the same amount of MEF cells (1.2x10e6) into 100-mm dishes every 3 days until the cells stopped proliferating and we finally got senescent MEF cells. Senescence-associated β-galactosidase activities in MEF cells were assessed using a detection kit (Beyotime Biotech), following the manufacturer’s protocol.
Panc1 cells followed the same culture conditions as MEFs. BxPC3 followed the same culture conditions except 1640 medium (GIBCO). CCK8-assay was assessed using a detection kit (Vazyme).
RNA isolation and high-throughput sequencing
Total RNA of proliferating and senescent MEF cells was extracted using TRIzol Reagent (Ambion) following the manufacturer’s protocol. For RNA-Seq, rRNAs were removed by rRNA probes from total RNAs, and remaining RNAs were used to construct sequencing libraries. Libraries were generated following the Illumina protocol for preparing samples for sequencing of mRNA and lncRNAs. After library construction, library quality was assessed on the Agilent Bioanalyzer 2100 and sequenced on the HiSeq 4000 platform. Sequencing was performed at GENEWIZ (Suzhou) and Novogene (Tianjin). The accession number for the sequencing data in this paper is BIG data center: CRA002300.
Data processing and identifying DEGs
For MEF RNA-Seq data, the raw reads were trimmed by removing Illumina adapter sequences and low-quality bases. Clean reads were mapped to the reference genome mm10 using hisat2 [52,53] with default parameters. Quantifications of gene expression were performed using stringtie [53,54]. For identifying DEGs, we first filtered out genes with TPM less than 1 in half of the samples, and differential analyses were performed with edgeR [55,56] in R environment [57]. Genes with p-value less than 0.05 and abs(log2(Fold change)) more than 1 were considered significant.
For the collected RNA-Seq data of human senescence, sequencing reads were processed following the same procedures and mapped to human genome hg38. Genes with p-value less than 0.05 were considered significant.
For TCGA RNA-Seq data, quantifications from patients younger than 50 or older than 80 were considered, and read counts were processed in edgeR [55,56] for differential analysis. Genes with p-value less than 0.05 were considered significant.
Gene ontology and KEGG pathway enrichment analysis
Gene ontology and KEGG pathway enrichments were performed with the geneSCF command line tool [38]. In the enrichment figure demonstrations, we selected biological processes or pathways associated with cellular senescence, DNA damage and cancers, to complete the figure, since there were many GO terms or pathways involved. GO terms or pathways with p-value less than 0.05 were considered significant.
ATAC-Seq and ChIP-Seq data processing
For ATAC-Seq data, Bowtie2 (v2.3.4.3) [58] was use
d to align reads to reference human genome hg38 with default parameters. Peak calling was performed with MACS2 (v2.1.2) [59] with default parameters. For discovering differential peaks, reads mapped to each peak were counted with featureCounts [60], and processed in edgeR [55,56].
For ChIP-Seq data, the peak files and targets were directly downloaded from the Cistrome data browser [61,62]. Targets were identified based on corresponding gene score no less than 0.2 in the downloaded files.
Identification of transcription factor binding site motifs
All differential ATAC-Seq peaks were extracted to perform motif analyses using the HOMER motif finding tool with default parameters [42]. Motifs with p-value less than 0.05 were considered significant.
Weighted correlation network construction
DEGs from ‘young’ and ‘very old’ PDAC patients were used for weighted correlation network construction with WGCNA package [40] in R environment [57]. In network construction, with a power β (soft thresholding), aij = |cor(xi, xj)|β represents the adjacency of an unsigned network, and emphasizes high correlations. β was chosen based on the criterion of R-square more than 0.85 and mean connectivity less than 100. The network was constructed according to a minimum module size of 30 genes. Highly interconnected genes are clustered in one gene module. To obtain gene modules associated with clinical traits, correlations between gene modules and traits were calculated and displayed with pheatmap package [63] in R [57].
Survival analysis
The clinical data for survival analyses were downloaded from UCSC Xena TCGA GDC hub. Survival analyses were performed with the survival package [64]. Cut-Off thresholds were conducted with Q1 versus Q4 quartile for high and low expression groups of various coding genes and non-coding RNAs and plots were proceeded with survminer package [65] in R environment [57].
Data collection
We downloaded expression profiles and clinical traits data of human pancreatic cancer from UCSC Xena TCGA GDC hub (https://xenabrowser.net/datapages/), screening from clinic information of 187 PDAC patients’ data for further analyses. The ATAC-Seq datasets from SRP102442 (GSE97008) [41], including one pancreatic control sample and two pancreatic cancer samples, were downloaded from the EBI (European Bioinformatics Institute) database (https://www.ebi.ac.uk/). For KLF5 and FOXA1 ChIP-Seq data, the peak files and targets were downloaded from the Cistrome data browser (http://cistrome.org/db/) [61,62]. The immunohistochemistry (IHC) staining data were downloaded from the human protein atlas database (https://www.proteinatlas.org/) [45,46]. Replicative senescence datasets GSE74324 (IMR90) [66], GSE63577 (IMR90, WI38 and BJ) [67,68] and GSE53356 (IMR90) [69] were employed for senescent validations. Ras-induced senescence datasets GSE61130 [70] and various other induced senescence datasets (GSE74620 [71] and GSE60340 [72]) were also used for verifying candidate gene expressions in senescence, while GSE60340 [72] included replicative senescence as well. The KLF5 KD dataset GSE88977 [44] was utilized to confirm its regulatory relationship to candidates. All these datasets were downloaded from GEO (https://www.ncbi.nlm.nih.gov/geo/) unless otherwise specified.
Supplementary Material
Acknowledgments
We thank Dr. Ting Ni (Fudan U.) for sharing the established senescence model’s protocol with us. We thank Dr. Qingsong Liu (University of Science and Technology of China) for sharing Panc1 cells and thank Dr. Yucai Wang (University of Science and Technology of China) for sharing BxPC3 cells with us. This work was funded by grants from the National Natural Science Foundation of China (91540107) and the Major/Innovative Program of Development Foundation of Hefei Center for Physical Science and Technology (2014FXCX009).
Correction Statement
This article has been republished with minor changes. These changes do not impact the academic content of the article.
Funding Statement
This work was supported by the Innovative Program of Development Foundation of Hefei Center for Physical Science and Technology [2014FXCX009]; National Natural Science Foundation of China [91540107].
Disclosure of Potential Conflicts of Interest
No potential conflict of interest was reported by the authors.
Supplementary material
Supplemental data for this article can be accessed here.
References
- [1].Hayflick L, Moorhead PS.. The serial cultivation of human diploid cell strains. Exp Cell Res. 1961;25:585–621. [DOI] [PubMed] [Google Scholar]
- [2].Mun˜oz-Espı´n D, Serrano M.. Cellular senescence: from physiology to pathology. Nat Rev Mol Cell Biol. 2014;15:482–496. [DOI] [PubMed] [Google Scholar]
- [3].Montes M, Lund AH. Emerging roles of lncRNAs in senescence. Febs J. 2016;283:2414–2426. [DOI] [PubMed] [Google Scholar]
- [4].Porciuncula A, Hajdu C, David G. The dual role of senescence in pancreatic ductal adenocarcinoma[M]//Advances in cancer research. Acad Press. 2016;131:1–20. [DOI] [PubMed] [Google Scholar]
- [5].Rodier F, Campisi J. Four faces of cellular senescence. J Cell Biol. 2011;192(4):547–556. [DOI] [PMC free article] [PubMed] [Google Scholar]
- [6].Sharpless NE, Sherr CJ. Forging a signature of in vivo senescence. Nat Rev Cancer. 2015;15(7):397. [DOI] [PubMed] [Google Scholar]
- [7].Kuilman T, Michaloglou C, Mooi WJ, et al. The essence of senescence. Genes Dev. 2010;24:2463–2479. [DOI] [PMC free article] [PubMed] [Google Scholar]
- [8].Kleeff J, Korc M, Apte M, et al. Pancreatic cancer. Nat Rev Dis Primers. 2016;2:16022. [DOI] [PubMed] [Google Scholar]
- [9].Collado M, Gil J, Efeyan A, et al. Tumour biology: senescence in premalignant tumours. Nature. 2005;436:642. [DOI] [PubMed] [Google Scholar]
- [10].Kamisawa T, Wood LD, Itoi T, et al. Pancreatic cancer. Lancet. 2016;388(10039):73–85. [DOI] [PubMed] [Google Scholar]
- [11].Hruban RH, Adsay NV, Albores-Saavedra J, et al. Pancreatic intraepithelial neoplasia: a new nomenclature and classifi cation system for pancreatic duct lesions. Am J Surg Pathol. 2001;25:579–586. [DOI] [PubMed] [Google Scholar]
- [12].Feldmann G, Beaty R, Hruban RH, et al. Molecular genetics of pancreatic intraepithelial neoplasia. J Hepatobiliary Pancreat Surg. 2007;14(3):224–232. [DOI] [PMC free article] [PubMed] [Google Scholar]
- [13].Collado M, Serrano M. Senescence in tumours: evidence from mice and humans. Nat Rev Cancer. 2010;10:51–57. [DOI] [PMC free article] [PubMed] [Google Scholar]
- [14].Collado M, Blasco MA, Serrano M. Cellular senescence in cancer and aging. Cell. 2007;130:223–233. [DOI] [PubMed] [Google Scholar]
- [15].Cheng Q, Ke S, Ghanam AR, et al. LncRNAs: the Ideal composer of the melody for life. Biomed Sci. 2016;2(2):11–15. [Google Scholar]
- [16].Quinodoz S, Guttman M. Long noncoding RNAs : an emerging link between gene regulation and nuclear organization. Trends Cell Biol. 2014;24:651–663. [DOI] [PMC free article] [PubMed] [Google Scholar]
- [17].Rinn JL, Kertesz M, Wang JK, et al. Functional demarcation of active and silent chromatin domains in human HOX loci by noncoding RNAs. Cell. 2007;129(7):1311–1323. [DOI] [PMC free article] [PubMed] [Google Scholar]
- [18].Schaukowitch K, Kim TK. Emerging epigenetic mechanisms of long non-coding RNAs. Neuroscience. 2014;264:25–38. [DOI] [PMC free article] [PubMed] [Google Scholar]
- [19].Zhang A, Zhao J, Kim J, et al. LncRNA HOTAIR enhances the androgen-receptor-mediated transcriptional program and drives castration-resistant prostate cancer. Cell Rep. 2015;13(1):209–221. [DOI] [PMC free article] [PubMed] [Google Scholar]
- [20].Kogo R, Shimamura T, Mimori K, et al. Long noncoding RNA HOTAIR regulates polycomb-dependent chromatin modification and is associated with poor prognosis in colorectal cancers. Cancer Res. 2011;71(20):6320–6326. [DOI] [PubMed] [Google Scholar]
- [21].Nakagawa T, Endo H, Yokoyama M, et al. Large noncoding RNA HOTAIR enhances aggressive biological behavior and is associated with short disease-free survival in human non-small cell lung cancer. Biochem Biophys Res Commun. 2013;436(2):319–324. [DOI] [PubMed] [Google Scholar]
- [22].Kim K, Jutooru I, Chadalapaka G, et al. HOTAIR is a negative prognostic factor and exhibits pro-oncogenic activity in pancreatic cancer. Oncogene. 2013;32(13):1616–1625. [DOI] [PMC free article] [PubMed] [Google Scholar]
- [23].Kallen AN, Zhou XB, Xu J, et al. The imprinted H19 lncRNA antagonizes let-7 microRNAs[J]. Mol Cell. 2013;52(1):101–112. [DOI] [PMC free article] [PubMed] [Google Scholar]
- [24].Monnier P, Martinet C, Pontis J, et al. H19 lncRNA controls gene expression of the imprinted gene network by recruiting MBD1. Proc Nat Acad Sci. 2013;110(51):20693–20698. [DOI] [PMC free article] [PubMed] [Google Scholar]
- [25].Hofmann P, Sommer J, Theodorou K, et al. Long non-coding RNA H19 regulates endothelial cell aging via inhibition of STAT3 signalling. Cardiovasc Res. 2018;115(1):230–242. [DOI] [PMC free article] [PubMed] [Google Scholar]
- [26].Ji P, Diederichs S, Wang W, et al. MALAT-1, a novel noncoding RNA, and thymosin β4 predict metastasis and survival in early-stage non-small cell lung cancer. Oncogene. 2003;22(39):8031. [DOI] [PubMed] [Google Scholar]
- [27].Arun G, Diermeier S, Akerman M, et al. Differentiation of mammary tumors and reduction in metastasis upon Malat1 lncRNA loss. Genes Dev. 2016;30(1):34–51. [DOI] [PMC free article] [PubMed] [Google Scholar]
- [28].Abdelmohsen K, Panda A, Kang MJ, et al. Senescence‐associated l nc RNA s: senescence‐associated long noncoding RNA s. Aging Cell. 2013;12(5):890–900. [DOI] [PMC free article] [PubMed] [Google Scholar]
- [29].Tripathi V, Shen Z, Chakraborty A, et al. Long noncoding RNA MALAT1 controls cell cycle progression by regulating the expression of oncogenic transcription factor B-MYB. PLoS Genet. 2013;9(3):e1003368. [DOI] [PMC free article] [PubMed] [Google Scholar]
- [30].Yamazaki T, Souquere S, Chujo T, et al. Functional domains of NEAT1 architectural lncRNA induce paraspeckle assembly through phase separation. Mol Cell. 2018;70(6):1038–1053. e7. [DOI] [PubMed] [Google Scholar]
- [31].Mao YS, Sunwoo H, Zhang B, et al. Direct visualization of the co-transcriptional assembly of a nuclear body by noncoding RNAs. Nat Cell Biol. 2011;13(1):95. [DOI] [PMC free article] [PubMed] [Google Scholar]
- [32].Aguirre AJ, Bardeesy N, Sinha M, et al. Activated Kras and Ink4a/Arf deficiency cooperate to produce metastatic pancreatic ductal adenocarcinoma. Genes Dev. 2003;17(24):3112–3126. [DOI] [PMC free article] [PubMed] [Google Scholar]
- [33].Krtolica A, Parrinello S, Lockett S, et al. Senescent fibroblasts promote epithelial cell growth and tumorigenesis: a link between cancer and aging. Proc Natl Acad Sci USA. 2001;98:12072–12077. [DOI] [PMC free article] [PubMed] [Google Scholar]
- [34].Coppe J-P, Patil CK, Rodier F, et al. Senescence-associated secretory phenotypes reveal cell-nonautonomous functions of oncogenic RAS and the p53 tumor suppressor. PLoS Biol. 2008;6:2853–2868. [DOI] [PMC free article] [PubMed] [Google Scholar]
- [35].Ling J, Kang Y, Zhao R, et al. KrasG12D-induced IKK2/β/NF-κB activation by IL-1α and p62 feedforward loops is required for development of pancreatic ductal adenocarcinoma. Cancer Cell. 2012;21(1):105–120. [DOI] [PMC free article] [PubMed] [Google Scholar]
- [36].Hruban RH, Boff Etta P, Hiraoka N, et al. Ductal adenocarcinoma of the pancreas. In: Hruban RH, Hiraoka N, Iacobuzio-Donahue C, et al. editors. WHO classifi cation of tumours of the digestive system. In: Bosman FTJ, Lakhani SR, Ohgaki H. WHO classifi cation of tumours. 4th ed. Lyon: International Agency for Research on Cancer; 2010. p. 281–291. [Google Scholar]
- [37].Zhou X, Maricque B, Xie M, et al. The human epigenome browser at Washington University. Nat Methods. 2011;8:989–990. [DOI] [PMC free article] [PubMed] [Google Scholar]
- [38].Subhash S, Kanduri C. GeneSCF: a real-time based functional enrichment tool with support for multiple organisms. BMC Bioinformatics. 2016;17(1):365. [DOI] [PMC free article] [PubMed] [Google Scholar]
- [39].Liggett WH Jr, Sidransky D. Role of the p16 tumor suppressor gene in cancer. J Clin Oncol. 1998;16(3):1197–1206. [DOI] [PubMed] [Google Scholar]
- [40].Langfelder P, Horvath S. WGCNA: an R package for weighted correlation network analysis[J]. BMC Bioinformatics. 2008;9(1):559. [DOI] [PMC free article] [PubMed] [Google Scholar]
- [41].Bhattacharyya S, Pradhan K, Campbell N, et al. Altered hydroxymethylation is seen at regulatory regions in pancreatic cancer and regulates oncogenic pathways. Genome Res. 2017;27(11):1830–1842. [DOI] [PMC free article] [PubMed] [Google Scholar]
- [42].Heinz S, Benner C, Spann N, et al. Simple combinations of lineage-determining transcription factors prime cis-regulatory elements required for macrophage and B cell identities. Mol Cell. 2010. May 28;38(4):576–589. [DOI] [PMC free article] [PubMed] [Google Scholar]
- [43].Diaferia GR, Balestrieri C, Prosperini E, et al. Dissection of transcriptional and cis‐regulatory control of differentiation in human pancreatic cancer. Embo J. 2016;35(6):595–617. [DOI] [PMC free article] [PubMed] [Google Scholar]
- [44].Zhang X, Choi PS, Francis JM, et al. Somatic superenhancer duplications and hotspot mutations lead to oncogenic activation of the KLF5 transcription factor. Cancer Discov. 2018;8(1):108–125. [DOI] [PMC free article] [PubMed] [Google Scholar]
- [45].Uhlén M, Fagerberg L, Hallström BM, et al. Tissue-based map of the human proteome. Science. 2015;347(6220):1260419. [DOI] [PubMed] [Google Scholar]
- [46].Uhlen M, Zhang C, Lee S, et al. A pathology atlas of the human cancer transcriptome. Science. 2017;357:6352. [DOI] [PubMed] [Google Scholar]
- [47].Roe JS, Hwang CI, Somerville TDD, et al. Enhancer reprogramming promotes pancreatic cancer metastasis. Cell. 2017;170(5):875–888. e20. [DOI] [PMC free article] [PubMed] [Google Scholar]
- [48].Shin S, Asano T, Yao Y, et al. Activator protein-1 has an essential role in pancreatic cancer cells and is regulated by a novel Akt-mediated mechanism. Mol Cancer Res. 2009;7(5):745–754. [DOI] [PMC free article] [PubMed] [Google Scholar]
- [49].Hoeijmakers JHJ. DNA damage, aging, and cancer. N Engl J Med. 2009;361(15):1475–1485. [DOI] [PubMed] [Google Scholar]
- [50].Kirkwood TBL. Understanding the odd science of aging. Cell. 2005;120(4):437–447. [DOI] [PubMed] [Google Scholar]
- [51].Foersch S, Sperka T, Lindner C, et al. VEGFR2 signaling prevents colorectal cancer cell senescence to promote tumorigenesis in mice with colitis. Gastroenterology. 2015;149(1):177–189. e10. [DOI] [PubMed] [Google Scholar]
- [52].Kim D, Langmead B, Salzberg SL. HISAT: a fast spliced aligner with low memory requirements. Nat Methods. 2015;12(4):357. [DOI] [PMC free article] [PubMed] [Google Scholar]
- [53].Pertea M, Kim D, Pertea GM, et al. Transcript-level expression analysis of RNA-seq experiments with HISAT, StringTie and Ballgown. Nat Protoc. 2016;11(9):1650. [DOI] [PMC free article] [PubMed] [Google Scholar]
- [54].Pertea M, Pertea GM, Antonescu CM, et al. StringTie enables improved reconstruction of a transcriptome from RNA-seq reads. Nat Biotechnol. 2015;33(3):290. [DOI] [PMC free article] [PubMed] [Google Scholar]
- [55].Robinson MD, McCarthy DJ, Smyth GK. edgeR: a Bioconductor package for differential expression analysis of digital gene expression data. Bioinformatics. 2010;26(1):139–140. [DOI] [PMC free article] [PubMed] [Google Scholar]
- [56].McCarthy DJ, Chen Y, Smyth GK. Differential expression analysis of multifactor RNA-Seq experiments with respect to biological variation. Nucleic Acids Res. 2012;40(10):4288–4297. [DOI] [PMC free article] [PubMed] [Google Scholar]
- [57].R Core Team . R: a language and environment for statistical computing. R Foundation for Statistical Computing, Vienna, Austria; 2019. Available from: https://www.R-project.org/
- [58].Langmead B, Salzberg SL. Fast gapped-read alignment with Bowtie 2. Nat Methods. 2012;9(4):357. [DOI] [PMC free article] [PubMed] [Google Scholar]
- [59].Zhang Y, Liu T, Meyer CA, et al. Model-based analysis of ChIP-Seq (MACS) . Genome Biol. 2008;9(9):R137. [DOI] [PMC free article] [PubMed] [Google Scholar]
- [60].Liao Y, Smyth GK, Shi W. Featurecounts: an efficient general-purpose program for assigning sequence reads to genomic features. Bioinformatics. 2014;30(7):923–930. [DOI] [PubMed] [Google Scholar]
- [61].Zheng R, Wan C, Mei S, et al. Cistrome data browser: expanded datasets and new tools for gene regulatory analysis. Nucleic Acids Res. 2019. Jan 8;47(D1):D729–D735. [DOI] [PMC free article] [PubMed] [Google Scholar]
- [62].Mei S, Qin Q, Wu Q, et al. Cistrome data browser: a data portal for ChIP-Seq and chromatin accessibility data in human and mouse. Nucleic Acids Res. 2017. January 4;45(D1):D658–D662. [DOI] [PMC free article] [PubMed] [Google Scholar]
- [63].Kolde R. Pheatmap: pretty heatmaps. R package version 1.0.12. 2019. [Google Scholar]
- [64].Therneau T. A package for survival analysis in S. version 2.38. 2015. [Google Scholar]
- [65].Kassambara A, Kosinski M, Biecek P. survminer: drawing survival curves using’ggplot2ʹ. R package version 0.4.6. 2019. [Google Scholar]
- [66].Tasdemir N, Banito A, Roe JS, et al. BRD4 connects enhancer remodeling to senescence immune surveillance. Cancer Discov. 2016;6(6):612–629. [DOI] [PMC free article] [PubMed] [Google Scholar]
- [67].Marthandan S, Priebe S, Baumgart M, et al. Similarities in gene expression profiles during in vitro aging of primary human embryonic lung and foreskin fibroblasts. Biomed Res Int. 2015;2015:731938. [DOI] [PMC free article] [PubMed] [Google Scholar]
- [68].Marthandan S, Baumgart M, Priebe S, et al. Conserved senescence associated genes and pathways in primary human fibroblasts detected by RNA-Seq. PLoS One. 2016;11(5):e0154531. [DOI] [PMC free article] [PubMed] [Google Scholar]
- [69].Rai TS, Cole JJ, Nelson DM, et al. HIRA orchestrates a dynamic chromatin landscape in senescence and is required for suppression of neoplasia. Genes Dev. 2014. December 15;28(24):2712–2725. [DOI] [PMC free article] [PubMed] [Google Scholar]
- [70].Herranz N, Gallage S, Mellone M, et al. mTOR regulates MAPKAPK2 translation to control the senescence-associated secretory phenotype. Nat Cell Biol. 2015. September;17(9):1205–1217. [DOI] [PMC free article] [PubMed] [Google Scholar]
- [71].Kovatcheva M, Liao W, Klein ME, et al. ATRX is a regulator of therapy induced senescence in human cells. Nat Commun. 2017. August 30;8(1):386. [DOI] [PMC free article] [PubMed] [Google Scholar]
- [72].Purcell M, Kruger A, Tainsky MA. Gene expression profiling of replicative and induced senescence. Cell Cycle. 2014;13(24):3927–3937. [DOI] [PMC free article] [PubMed] [Google Scholar]
Associated Data
This section collects any data citations, data availability statements, or supplementary materials included in this article.
Data Citations
- R Core Team . R: a language and environment for statistical computing. R Foundation for Statistical Computing, Vienna, Austria; 2019. Available from: https://www.R-project.org/


