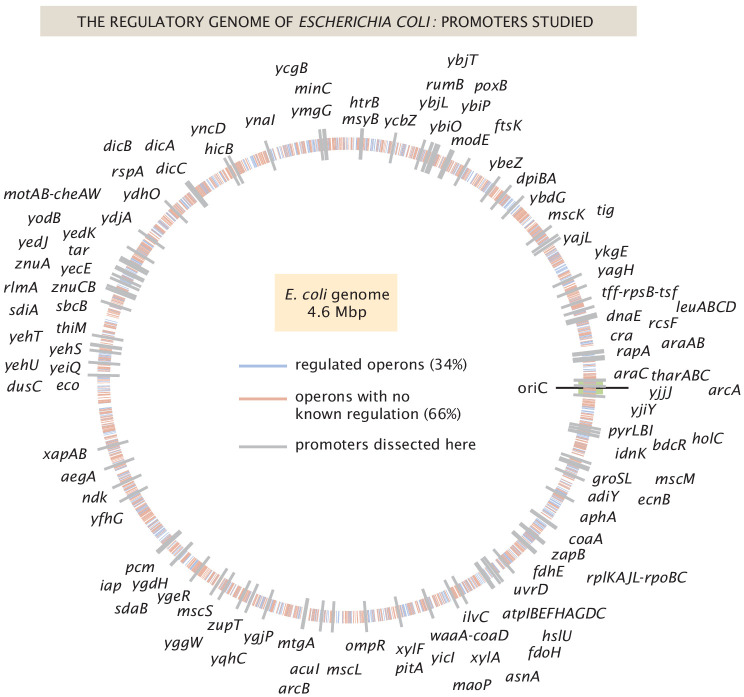
Figure 1. The E. coli regulatory genome.
Illustration of the current ignorance with respect to how genes are regulated in E. coli. Genes with previously annotated regulation (as reported on RegulonDB [Gama-Castro et al., 2016]) are denoted with blue ticks and genes with no previously annotated regulation denoted with red ticks. The 113 genes explored in this study are labeled in gray, and their precise genomic locations can be found in Figure 1—source data 1.

