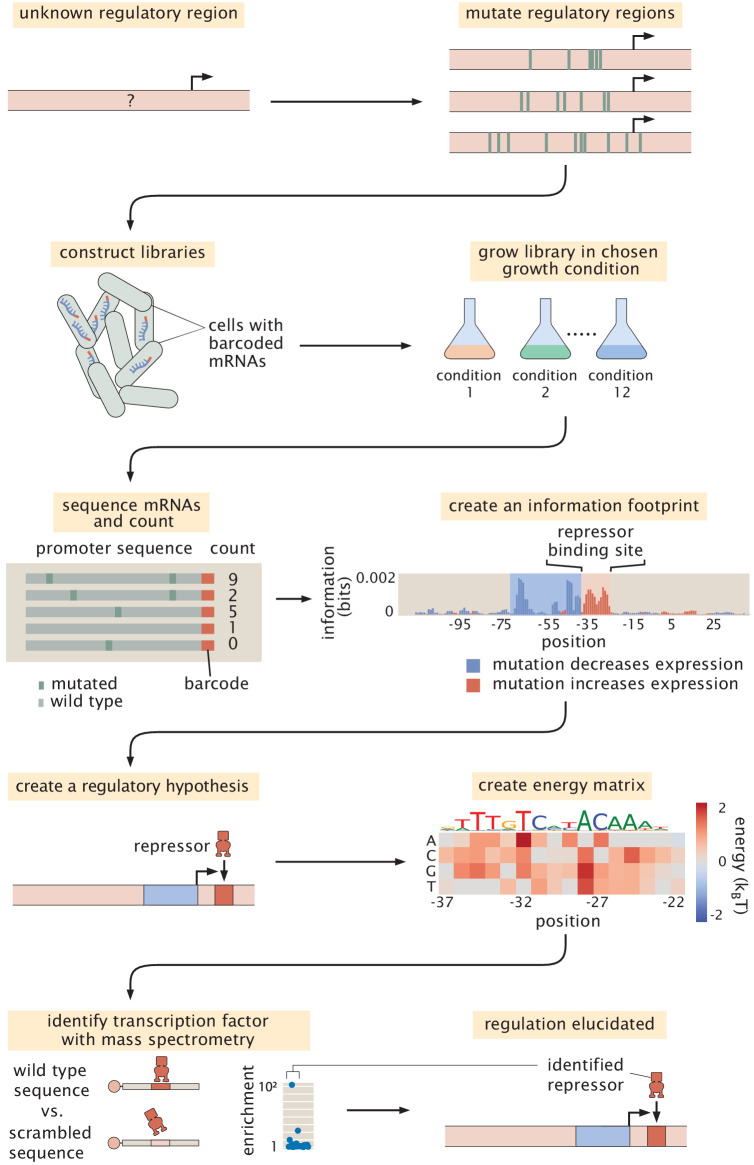
Figure 2. Schematic of the Reg-Seq procedure as used to recover a repressor-binding site.
The process is as follows: After constructing a promoter library driving expression of a randomized barcode (an average of five barcodes for each promoter), RNA-Seq is conducted to determine the frequency of these mRNA barcodes across different growth conditions (list included in Appendix 1 Section 'Growth conditions'). By computing the mutual information between DNA sequence and mRNA barcode counts for each base pair in the promoter region, an 'information footprint' is constructed that yields a regulatory hypothesis for the putative binding sites (with the RNAP-binding region highlighted in blue and the repressor-binding site highlighted in red). Energy matrices, which describe the effect that any given mutation has on DNA-binding energy, as well as sequence logos, are inferred for the putative transcription-factor-binding sites. Next, we identify which transcription factor preferentially binds to the putative binding site via DNA-affinity chromatography followed by mass spectrometry. This procedure culminates in a coarse-grained, cartoon-level view of our regulatory hypothesis for how a given promoter is regulated.

