

Abstract
Trimeric autotransporter adhesins (TAAs) comprise a group of virulence‐related proteins in Gram‐negative bacteria. Members of this family bind to extracellular matrix components such as collagen and fibronectin, but also they exhibit several other functions, such as conferring serum resistance and autoaggregation. Autoaggregation promoted by TAAs is homotypic and mediated by the sticky, globular head domains of these lollipop‐like molecules. However, whether TAAs mediate heterotypic interactions (i.e., coaggregation) has not been studied. To address this question, we investigated the coaggregation of two model TAA groups: YadA from the enteropathogenic Yersiniae and the immunoglobulin‐binding Eib proteins from Escherichia coli. To study TAA coaggregation, we coexpressed a fluorescent label together with a particular TAA and followed the aggregative interactions using fluorescence microscopy and quantified the interactions using a novel script implemented in Fiji. Our results show that there is coaggregation between some populations expressing different TAAs, which can be explained by relatively high sequence similarity between the interacting TAAs. Generally, the level of coaggregation correlated with the sequence similarity. However, some TAAs did not interact despite high sequence similarity, showing exclusion of bacteria producing a noncompatible TAA. These data demonstrate that TAAs can mediate bacterial coaggregation, but in some cases prevent coaggregation of bacteria with disparate TAAs. Our results have implications for the ecology of TAA‐producing bacteria, where coaggregation may promote co‐operation whereas exclusion might be an indication of competition.
Keywords: autoaggregation, biofilm, coaggregation, Eib, kin recognition, trimeric autotransporter adhesin, YadA
Bacteria expressing different trimeric autotransporter adhesins (TAAs) can coaggregate to form mixed clusters and mixed biofilms, and the degree of mixing correlates with the sequence similarity of the two different TAAs. However, in some cases, two similar TAAs excluded each other. These findings have implications for the ecology of TAA‐producing bacteria.
1. INTRODUCTION
Bacterial autoaggregation is a widespread phenomenon, in which closely related bacteria adhere to each other to form large, even macroscopic aggregates, which then precipitate out of suspension (Trunk, Khalil, & Leo, 2018). The function of autoaggregation is in most cases unknown, though several lines of evidence suggest that autoaggregation promotes bacterial survival under a variety of stress conditions (Blom, Zimmermann, Ammann, & Pernthaler, 2010; Fexby et al., 2007; Haaber, Cohn, Frees, Andersen, & Ingmer, 2012; Tree et al., 2007). Furthermore, autoaggregation can be a first step in forming a biofilm, a multicellular community of bacteria enmeshed within an extracellular polymer matrix (Hobley, Harkins, MacPhee, Stanley‐Wall, & Albers, 2015).
Autoaggregation is mediated by self‐recognizing surface structures or autoagglutinins (Trunk et al., 2018). The biochemical nature of autoagglutinins varies, but most characterized ones are proteins. A family of proteins that is particularly rich in autoagglutinins is the trimeric autotransporter adhesins (TAAs) or type 5c secretion systems of Gram‐negative bacteria (Linke, Riess, Autenrieth, Lupas, & Kempf, 2006; Lyskowski, Leo, & Goldman, 2011). These are generally large, fibrous surface‐associated proteins, many of which resemble a lollipop with a globular N‐terminal head domain, an extended coiled‐coil stalk and a C‐terminal membrane anchor (Figure 1a). However, other architectures are also possible, and there are examples of TAAs with more complex architectures where the fiber contains multiple head domains connected by short regions of a stalk (Hartmann et al., 2012). The stalk(s) and head(s) comprise the so‐called passenger, which is exported to the surface of the bacterial cell by an autotransport process (Chauhan et al., 2019; Sikdar, Peterson, Anderson, & Bernstein, 2017).
FIGURE 1.
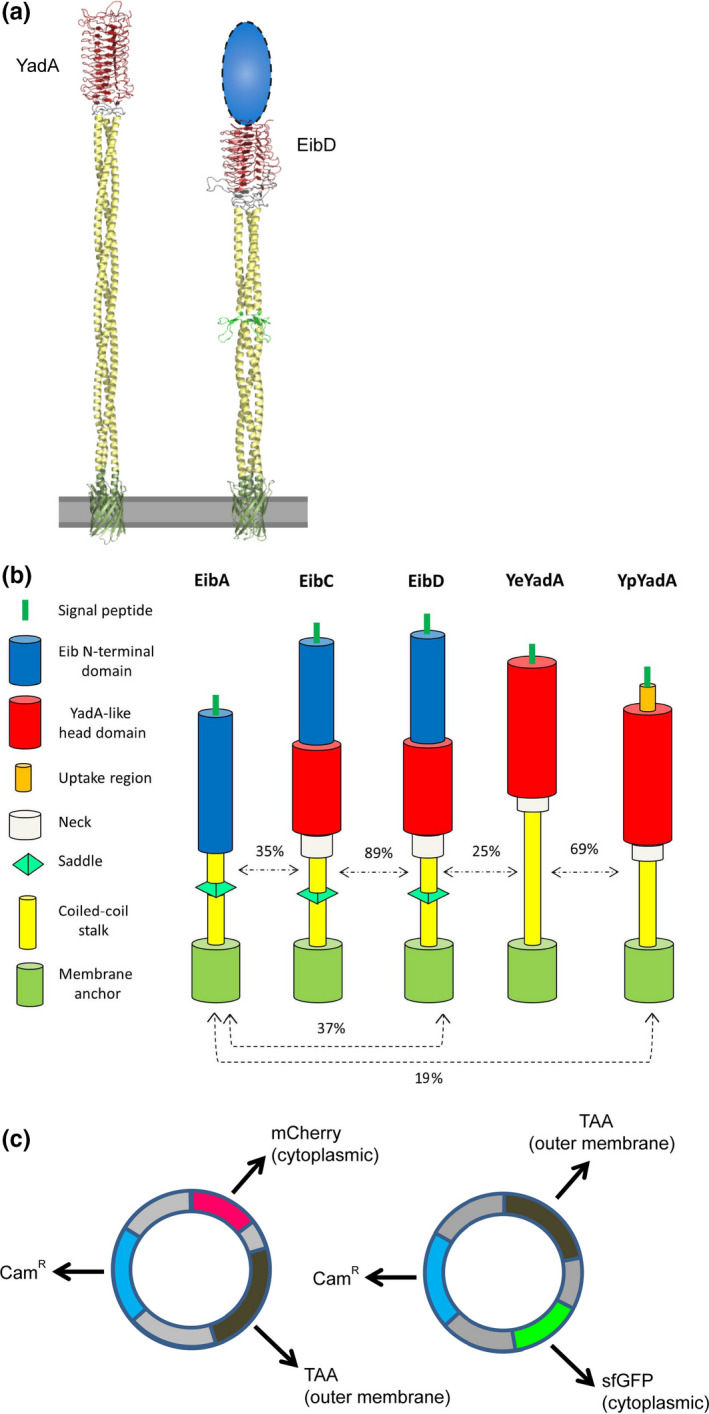
TAAs and constructs used in this study. (a) Model structures of full‐length YeYadA and EibD. Both proteins form extended, fibrous lollipop‐like structures on the bacterial surface; the outer membrane is modelled as a gray bar. EibD contains an N‐terminal region for which no structural data are available (shown as a blue oval). The YadA‐like head domain is in red, the coiled‐coil stalk in yellow and the membrane anchor in green. The saddle minidomain in EibD is colored in light green. The models are reproduced from previous publications (Koretke, Szczesny, Gruber, & Lupas, 2006; Leo et al., 2011). (b) Schematic of structures of model TAAs. Structural elements of the TAAs are indicated as shown in the key on the left. Sequence similarity between TAA passengers is shown as a percentage above dashed arrows (see Table A1 in the Appendix A for similarities in the head domains). The TAAs are drawn to scale. (c) Strategy for coexpressing TAAs and fluorescent markers. The dual‐expression vector pACYCDuet‐1 (carrying the gene for chloramphenicol resistance) was used as the backbone. In one set of plasmids, we cloned the gene encoding mCherry, and in the other sfGFP. A TAA‐encoding gene (including signal peptide) was cloned into the other multiple cloning site. The resulting plasmids produce a cytoplasmically located fluorescent protein and a TAA embedded in the outer membrane.
TAAs are generally multifunctional proteins (Meuskens, Saragliadis, Leo, & Linke, 2019). As their name implies, all characterized members of the family act as adhesins, either to eukaryotic cells, extracellular matrix components, abiotic surfaces, or to other bacteria (Heise & Dersch, 2006; Ishikawa, Nakatani, & Hori, 2012; Leo et al., 2010; Riess et al., 2004; Xiao et al., 2012). Besides, many TAAs confer protective functions such as serum resistance, immune evasion, and biofilm formation (e.gBiedzka‐Sarek, Venho, & Skurnik, 2005; Sandt & Hill, 2000; Valle et al., 2008). The autoaggregative function of TAAs is mediated by the globular head domains, and these can be seen interacting in a zipper‐like manner in electron micrographs (Hoiczyk, Roggenkamp, Reichenbecher, Lupas, & Heeseman, 2000; Kaiser, Linke, Schwarz, Leo, & Kempf, 2012; Leo et al., 2011). The interaction between TAAs is of low affinity but high adhesion strength (El‐Kirat‐Chatel, Mil‐Homens, Beaussart, Fialho, & Dufrêne, 2013); the co‐operative binding of densely spaced TAAs can provide sufficient forces to rip off outer membranes from aggregating cells (Chauhan et al., 2019; Leo et al., 2011).
The autoaggregation mediated by TAAs has been established a long time ago (Skurnik, Bölin, Heikkinen, Piha, & Wolf‐Watz, 1984). The interaction is homophilic, that is, a given TAA interacts with itself. However, until now, the ability of two different TAAs to interact in a heterophilic manner, that is, coaggregate, has not been studied. Here, we investigated the propensity for heterophilic interactions within and between two groups of model TAAs: Yersinia adhesin A (YadA) proteins from enteropathogenic Yersiniae (Mühlenkamp, Oberhettinger, Leo, Linke, & Schütz, 2015), and the Escherichia coli immunoglobulin‐binding (Eib) TAAs (Leo & Goldman, 2009; Lu et al., 2006; Sandt & Hill, 2000). Both groups of proteins have been used previously as models for TAA structure, function, and biogenesis (e.g., Chauhan et al., 2019; Leo et al., 2011; Mikula et al., 2012, 2012; Nummelin et al., 2004). The former are virulence factors of Y. enterocolitica and Y. pseudotuberculosis, whereas the latter are found in both commensal and pathogenic E. coli strains (Chauhan, Wrobel, Skurnik, & Leo, 2016; Merkel et al., 2010; Sandt, Wang, Wilson, & Hill, 1997). Both groups of proteins have a similar lollipop‐like structure (Figure 1a). Furthermore, both YadA and EibD have been shown to promote strong autoaggregation (Heise & Dersch, 2006; Leo et al., 2011).
YadA proteins from the two enteropathogenic Yersinia species are similar in size and structure (Figure 1b). The major difference between the two is that the protein from Y. pseudotuberculosis (YpYadA) contains a short N‐terminal extension, called the “uptake region,” as this stretch promotes invasion of mammalian cells as well as conferring the ability to bind fibronectin and vitronectin (Heise & Dersch, 2006; Mühlenkamp et al., 2017). This region is missing in most Y. enterocolitica YadA (YeYadA) variants, which bind preferentially to collagen (Leo et al., 2010; Mühlenkamp et al., 2015).
The Eib proteins largely resemble YadA in overall structure, but with some differences (Figure 1b). The crystal structure of a large fragment of the passenger (extracellular region) of EibD has been solved, which contains a YadA‐like head domain and the coiled‐coil stalk (Leo et al., 2011) (Figure 1a). However, EibD also contains an N‐terminal region for which no structural information is available. This is termed the “Eib region,” as it is present in other members of the family as well (Figure 1b). In addition to EibD, we included two other Eibs in this study, EibC and EibA. EibC is a close homolog of EibD with 89% sequence similarity in the passenger. In contrast, EibA is more divergent, the main difference being that EibA lacks a YadA‐like head domain as well as a neck region (Figure 1b).
Using differentially labelled bacteria, we demonstrate that different TAAs can mediate coaggregation and that the degree of coaggregation correlates well with the sequence similarity between the two interacting TAAs. In contrast, we were also able to show that in certain cases, the TAAs do not interact and that the bacteria form separated clusters, despite the relatively high sequence similarity of the TAAs. Our results have implications for the ecology of TAA‐expressing bacteria, where coaggregation may promote co‐operation between different strains, whereas exclusion of bacteria with different TAAs may be the hallmark of competition.
2. MATERIALS AND METHODS
2.1. Bacterial strains and growth conditions
E. coli TOP10 (Invitrogen) was used for cloning and plasmid DNA amplification and storage. The expression strain E. coli BL21(DE3) was used for protein expression (Novagen). Bacteria were grown in lysogeny broth (Bertani, 1951); to repress basal transcription of T7 polymerase, 0.2% (w/v) D‐glucose was added to the medium. For autoinduction, we used the medium ZYP‐5052 (Studier, 2005). For cultures with pACYCDuet‐1 and its derivatives, chloramphenicol was added to 25 µg/ml. Bacteria were cultured at 37 or 30°C for induction of protein production.
2.2. Molecular biology
For our experiments, we inserted the DNA encoding a TAA together with a fluorescent marker protein into a single plasmid (Figure 1c). The plasmid pACYCDuet‐1 (Novagen) used in this study for coexpression of TAAs and fluorescent markers. This plasmid contains two T7 promoters and two multiple cloning sites. As markers, we employed superfolder GFP (sfGFP) or mCherry. The TAA and fluorescent protein genes were introduced into separate multiple cloning sites of the dual‐promoter vector pACYCDuet‐1; thus, both genes are transcribed separately and do not represent a protein fusion. The TAA included a signal peptide for periplasmic targeting, leading to insertion in the outer membrane, whereas the fluorescent proteins were cytoplasmic. The list of plasmids constructed this way is given in Table 1. Hereafter, we use the notation TAA/fluorescent protein to denote constructs coexpressing a TAA and fluorescent marker from a single plasmid (e.g., EibA/sfGFP produces both EibA and sfGFP; ‐/sfGFP denotes a construct producing only sfGFP with no TAA).
TABLE 1.
Plasmids used in this study
| Plasmid | Inserts a | Comment |
|---|---|---|
| pACYCDuet‐1 | −/− | T7‐dependent expression vector with two promoters and multiple cloning sites for expressing two inserts |
| pACYCDuet‐EibA/sfGFP | sfGFP/EibA | Coproduction of EibA and cytoplasmic sfGFP |
| pACYCDuet‐EibC/sfGFP | sfGFP/EibC | Coproduction of EibC and cytoplasmic sfGFP |
| pACYCDuet‐EibD/mCherry | EibD/mCherry | Coproduction of EibD and cytoplasmic mCherry |
| pACYCDuet‐EibD/sfGFP | EibD/sfGFP | Coproduction of EibD and cytoplasmic sfGFP |
| pACYCDuet‐mCherry | mCherry/‐ | Production of cytoplasmic mCherry (no TAA) |
| pACYCDuet‐sfGFP | sfGFP/‐ | Production of cytoplasmic sfGFP (no TAA) |
| pACYCDuet‐YeYadA/mCherry | mCherry/YeYadA | Coproduction of Y. enterocolica YadA and cytoplasmic mCherry |
| pACYCDuet‐YeYadA/sfGFP | sfGFP/YeYadA | Coproduction of Y. enterocolica YadA and cytoplasmic sfGFP |
| pACYCDuet‐YpYadA/mCherry | YpYadA/mCherry | Coproduction of Y. pseudotuberculosis YadA and cytoplasmic mCherry |
Inserts separated by a slash denote DNA sequences cloned into the first or second multiple cloning site, respectively.
The DNA templates used in this study for amplification of TAA‐encoding genes were from Mikula et al. (2012, 2012). The exception was the gene encoding YpYadA, the coding sequence of which was amplified from genomic DNA of Y. pseudotuberculosis strain YPIII. The fluorescent markers were amplified from the plasmids pCXmCH‐cyto and pCX‐sfgfp, kindly provided by Friedrich Götz (University of Tübingen) (Yu & Götz, 2012). Primer sequences are given in Table A2 in the Appendix A.
DNA amplification was performed by PCR using Phusion polymerase (New England Biolabs). All the constructs were made using Gibson assembly (Gibson et al., 2009). The reaction mixes were transformed into chemically competent E. coli TOP10, and transformants were selected on plates supplemented with chloramphenicol. Correct insertions were screened for by colony PCR, and plasmid DNA was extracted from PCR‐positive clones using a miniprep kit (QIAGEN). The plasmids were verified by DNA sequencing. The verified plasmids were then transformed into E. coli BL21(DE3) for coexpression and aggregation studies.
2.3. Sedimentation assays
2.3.1. Autoaggregation
The assay was started first by growing an overnight culture (5 ml LB medium with 25 μg/ml Cm at 30°C) for each construct transformed into BL21(DE3). The next day, the overnight cultures were diluted 1:20 in fresh LB supplemented with 25 μg/ml chloramphenicol and 0.2% (w/v) glucose. The cultures were grown in Erlenmeyer flasks with shaking at 200 rpm at 37°C until the optical density at 600 nm (OD600) reached ~0.5. The samples were then moved to 30°C for 30 min with shaking at 150 rpm/min. Isopropylthiogalactoside (IPTG) was then added to a final concentration of 0.5 mM to induce protein production. After 2.5 hr of induction, 10 ml of the samples was transferred into narrow tubes and the tubes incubated statistically at room temperature.
Sedimentation assays were used as a proxy for autoaggregation. These were done by measuring the fluorescence of the cultures from the top of the tubes at given intervals. 200 μl samples were taken from the very top of each tube, transferred into 1.5 ml microcentrifuge tubes, and then centrifuged at 12,000 x g for 1 min. The pellet was resuspended in 200 μl of phosphate‐buffered saline (PBS; 150 mM NaCl, 20 mM sodium phosphate pH 7.4) and then put into a black 96‐well plate (Greiner Bio‐One) to measure the fluorescence in a Synergy TM H1 plate reader (BioTek). The fluorescence was measured every 10 min during an 80‐min incubation. For samples containing sfGFP, the excitation and emission wavelengths used were 483 and 510 nm, respectively. The gain was 110. For mCherry, the excitation and emission wavelengths used were 580 and 610 nm, respectively, with gain 60. For analysis, the reduction in fluorescence was plotted as a function of time. To estimate autoaggregation, the fluorescence measured at each time point was compared to the fluorescent intensity at time point zero and results expressed as a percentage: (Ft/F 0) * 100%, where Ft is the fluorescence at a given time point, and F 0 is the fluorescence intensity at time 0.
2.3.2. Coaggregation
Sedimentation assays to estimate coaggregation were performed largely as described above. After the bacterial cultures reached the mid‐log phase (OD600 of ~0.5), the OD600 of all samples was measured, and an equal amount of two bacteria expressing different TAAs and fluorescent proteins were mixed in a single flask (volume ~10 ml). The cultures were incubated at 30°C for 30 min and then induced by adding 0.5 mM IPTG. After 2.5 hr at 30°C, the mixed culture was moved to a narrow tube and sedimentation was measured as above. When measuring fluorescence, the emission of mCherry was read first to prevent bleedthrough from the sfGFP measurement.
2.4. Mixed biofilm formation
The assay was started by first growing overnight cultures. The next day, the cultures were diluted to an OD600 of 0.5. An equal amount of two bacterial cultures producing different TAAs and fluorescent proteins were mixed, and 3 μl of this mixed culture was added to 35 mm glass‐bottom culture plates coated with poly‐D‐lysine (MatTek) containing 3 ml of autoinduction medium. The cultures plates were incubated for 92 hr statically at 30°C. The cultures were then analyzed by spinning disk confocal microscopy.
2.5. Assessing biofilm formation by crystal violet staining
To quantify the ability of TAAs to promote biofilm formation on glass and polystyrene surfaces, cultures were grown in LB medium overnight and the following day diluted to an OD600 value of 0.5. 1 μl of each bacterial culture along with 500 μl autoinduction medium was added to 24‐well plates (untreated polystyrene plates from VWR). The plates were incubated at 30°C for 92 hr, either statically or with agitation at 40 rpm. Three biological replicates were made for each sample. At the end of the incubation, the wells were washed with PBS and then stained with 0.5% (w/v) crystal violet by adding 500 μl of the solution to each well and incubating for 2 min. The wells were washed several times with PBS until the wash solution remained clear. The stain from the biofilms was solubilized in 99% ethanol, and 200 μl of the solubilized dye for each sample was moved to a clear 96‐well plate (Sarstedt). The absorbance was read at 630 nm using a Synergy TM H1 plate reader (BioTek). The data were plotted as the mean with standard deviation for three biological replicates.
To measure biofilm formed on the glass, sterilized coverslips were first placed inside the wells of a 6‐well polystyrene plate (VWR), after which 3 ml of autoinduction medium along with 30 μl of diluted bacterial culture was added to the plates. The plates were then incubated as above, both with and without agitation. At the end of the incubation, the glass coverslips were moved to a new plate and washed once with 1 ml PBS. They were then stained with 0.5% (w/v) crystal violet by adding 1 ml of the solution to each well and incubating for 2 min. Then, the coverslips were again moved to a new plate and washed several times with PBS until the wash solution remained clear. Crystal violet was solubilized and absorbances measured as outlined above.
2.6. Microscopy
2.6.1. Phase‐contrast microscopy
To make sure that the bacteria did not aggregate before inducing the culture with IPTG, we examined the bacteria by phase‐contrast microscopy. The images of the bacteria were taken by using an Axioplan 2 microscope (Zeiss). Images were taken at 63× magnification using a halogen lamp. Then, images were further processed for display by using Fiji (Schindelin et al., 2012).
2.6.2. Confocal scanning laser microscopy
Directly after the sedimentation assays for both autoaggregation and coaggregation, some of the cell sediment was taken very carefully using a long transfer pipette and put on a glass slide and then covered with a coverslip. Microscopic observations and image acquisition were performed using an inverted confocal scanning laser microscope (Olympus Fluoview 1000) mounted with a PlanApo 60×/1.42 oil immersion objective (Olympus) and photomultiplier tube detectors. Bacterial cells were maintained in an incubator chamber while imaging that kept a stable environment with 37°C and 5% CO2 levels. Fluorochromes were excited with diode lasers (488 and 559 nm). Images were taken for each sample from six random fields representing at least two biological replicates. Images were further processed using Fiji (Schindelin et al., 2012).
2.6.3. Spinning disk confocal microscopy
Spinning disk confocal microscopy was used for analyzing biofilms. The 3D stacks were acquired on an Andor Dragonfly spinning disk confocal microscope equipped with an iXon 888 Ultra EMCCD camera and a Nikon Eclipse Ti inverted microscope. For this particular imaging, we used the Nikon PlanApo 60X 1.4 NA Oil immersion objective. Typically, a 3D stack would consist of 350 frames in two colors sampled according to the Nyquist criterion for optimal 3D reconstruction. 3D biofilm images were taken for each chosen sample with three biological replicates.
2.7. Image analysis
2.7.1. Quantification of coaggregation
The raw 2‐dimensional confocal microscopy images were fed into a custom‐designed workflow to perform the colocalization analysis. The image files were organized in a folder structure where each folder would contain replicates of a certain combination of two types of TAA‐overexpressing bacteria. A custom‐designed ImageJ Groovy script (see data availability statement) would then parse all the files in each of the folders to yield statistics and visualization of the different interaction metrics as specified in Figure 2. In brief, a Gaussian smoothing filter is applied and then the script performs some background level normalization by adjusting the intensity baseline to the most commonly found pixel value (the background). Further, we detect local maxima in the image by using the ImageJ method “Find Maxima…” Instead of normalizing the fluorescence intensity of the images directly, a fraction of the value estimated by the default thresholding function (a variation of the IsoData algorithm) was used as an indication as to how large tolerance (noise) the maxima function should apply to its detection. After having detected all local maxima (i.e., bacteria) in the image, the positions were fed into a table for easy lookup during analysis. The script then parses through all the coordinates, bacterium by bacterium, and computes metrics for the neighborhood within a preset range of radii. Also, it detects the closest bacteria from each of the two populations, by expanding the search range stepwise in case the closest neighbor is not found within the preset radius. In addition to outputting numeric values of the metrics both per file and per folder, a heat map is also generated which gives a quick and intuitive overview of the interaction dynamics for the different combinations of TAA‐expressing bacteria. Therefore, to properly capture the bacterial dynamics, an array of parameters is calculated (see also Figure 2).
α—Population ratio: Ratio of the size of bacterial population 2 (red channel) to the total size of both populations. This parameter provides information on population size‐driven effects on measurements.
Each of the measurements below was made from the perspective of both cell populations, that is, there are two measurements per cell culture:
β—Neighborhood density: The average number of detected bacteria within each measured radius. This gives an idea of the overall neighborhood density for each bacterium and the aggregation propensity.
δ—Opposition affinity: For all the bacteria, we measured what fraction of the cells had a cell from the opposite population as its closest neighbor (radius‐independent). This indicates how strongly a cell type favors the opposite population: a low value suggests weak coaggregation, whereas a high value suggests a strong interaction between the populations. Inspired by Glass and Riedel‐Kruse (2018).
γ—Association index: For all the bacteria, we measured what fraction that has a neighboring bacterium within a given radius from either the same or opposite population. The association index is then represented as the fraction of bacteria with at least one neighbor from the same population divided by the fraction of bacteria with a neighbor of either type. Thus, a value close to unity would indicate a strong preference to interact with only bacteria from the same population, a value of around 0.5 indicates a high degree of mixing, whereas a value close to 0 would mark a preference for the opposite population. The association index, therefore, represents the likelihood of a bacterium to interact with a bacterium of the same/opposite type. Inspired by Daims, Lücker, and Wagner (2006).
ε—Neighborhood composition: For all the bacteria, we measured the average fraction of the neighbors within a given radius of a cell being from the opposite population. A high value thus indicates strong interaction with the opposite population, whereas a low value suggests a weak interaction. This parameter gives similar information as γ, but ε additionally indicates the multiplicity of interaction, not only its presence. Inspired by Glass and Riedel‐Kruse (2018).
FIGURE 2.
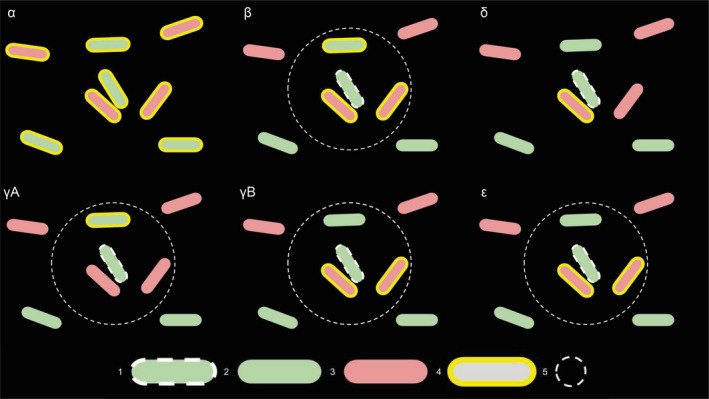
Interaction parameters measured by the script. α = population ratio, β = neighborhood density, δ = opposition affinity, γ = association index, ε = neighborhood composition. Legend: 1 = analyzed bacterium; 2 = bacterium in green channel, not included in analysis; 3 = bacterium in red channel, not included in analysis; 4 = bacteria with yellow border are included in the analysis; 5 = radius of detection.
A full guide to using the plugin is provided in the Appendix B.
2.7.2. Quantification of colocalization in biofilms
The 3D maximum projection was processed in Imaris Suite (Bitplane). Imaris XTension spot colocalization function was used to assess the number of colocalized bacteria. This software finds each fluorescent spot representing a single bacterium fluorescing in the green channel that is colocalized with a red spot (bacterium with red fluorescence) within a distance of 2.0 μm. The distance was based on the average width and length of the bacteria. The output is given as a percentage of colocalized bacteria of the total population of one color, calculated from three biological replicates.
2.8. Statistical analyses
Statistical analyses were performed using a one‐way ANOVA with a post hoc test (either Dunnett's or Tukey's) to test for statistical significance. To test for differences in the autoaggregation of control cultures between the beginning and end of the experiment, a paired, two‐tailed t test was used. Analyses were done using GraphPad Prism 8.4.2.
3. RESULTS
3.1. Model TAAs promote autoaggregation
To test the hypothesis that TAAs, in addition to homotypic interactions, can mediate heterotypic aggregation, we chose two groups of TAAs with similar structure: YadA proteins from the enteropathogenic Yersiniae, and the Eibs from E. coli (Figure 1b). The TAAs were coexpressed from a plasmid along with a separate, cytoplasmic fluorescent marker protein (Figure 1c).
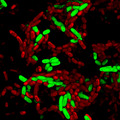
Autoaggregation has been demonstrated for cells expressing YeYadA, YpYadA, and EibD (Grosskinsky et al., 2007; Heise & Dersch, 2006; Leo et al., 2011). However, the promotion of autoaggregation has not been demonstrated for the other model proteins in our set when expressed recombinantly in E. coli. To test whether the model TAAs mediate autoaggregation, we performed a sedimentation assay (Figure 3a). The cultures were incubated statically, and the reduction in fluorescence at the surface of the medium was taken as a proxy for the settling of bacteria at the bottom of the tube. The fluorescence at the top of the suspensions of bacteria producing a TAA diminished rapidly (Figure 3a). When we examined the pellets at the bottom of the cultures microscopically, cultures producing a TAA showed aggregates of bacteria (Figure 3b). By contrast, control cultures not expressing a TAA (‐/mCherry and ‐/sfGFP) presented as single cells and the fluorescence at the top of cultures with just a marker protein was not significantly reduced throughout the experiment (Figure 3d,e). These data demonstrate that all our model TAAs promote autoaggregation when expressed from pACYCDuet‐1.
FIGURE 3.
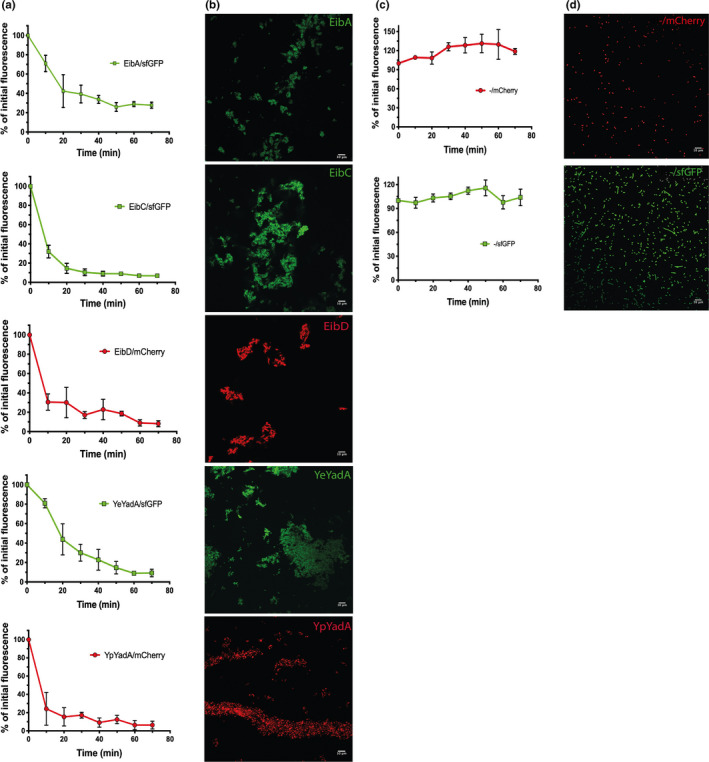
Model TAAs promote autoaggregation. (a) Sedimentation assays demonstrating autoaggregation mediated by model TAAs. Bacteria transformed with a plasmid coexpressing a TAA and a fluorescent marker protein were induced for 2.5 hr and then incubated statically. The curves show the reduction of fluorescence at the top of induced cultures over time, as a percentage of the fluorescence measured at time = 0. Data points are the mean values and error bars the standard deviations of three biological replicates. (b) Representative confocal micrographs of samples from the bottom of the tubes at the end of the experiments shown in panel a, demonstrating autoaggregation of the bacteria. The scale bars in the lower right corners correspond to 10 µm. (c) Control bacteria do not autoaggregate. Sedimentation assays with bacteria expressing only a fluorescent marker protein, performed as described for panel a. (d) Representative confocal fluorescence micrographs of samples from the bottom of the tubes at the end of experiments shown in panel a, demonstrating that control bacteria are present as single cells. The scale bar in the bottom right corner corresponds to 10 µm.
We were concerned that the leakiness of the promoter might lead to TAA production and autoaggregation even before induction. Therefore, glucose was included in the medium to repress basal transcription levels in all our experiments. Indeed, in the absence of inducer, no aggregation was observed (Figure A1 in the Appendix A). All the strains displayed similar growth characteristics after induction, and the TAAs were expressed and localized in the outer membrane at comparable levels (Figure A2 in the Appendix A).
3.2. TAAs can mediate heterotypic interactions
To investigate whether TAAs can mediate heterophilic interactions (i.e., coaggregation), we took advantage of the different fluorescent labels in our constructs. Before induction, we mixed a culture producing sfGFP at an equal ratio with a culture producing mCherry. After induction with IPTG, a sedimentation experiment was performed. As expected, the fluorescence at the top of cultures expressing TAAs diminished rapidly, whereas the fluorescence of cultures producing ‐/sfGFP or ‐/mCherry was not significantly reduced even when mixed with a TAA‐producing culture, suggesting that TAAs do not interact with other bacterial surface elements other than TAAs (Figure 4). In most cases, the kinetics of sedimentation were very similar for mixed TAA‐producing cultures, suggesting the different cultures might be coaggregating (Figure 4). However, some exceptions were observed, such as the cultures of EibA/sfGFP and EibD/mCherry or YeYadA/sfGFP and YpYadA/mCherry, where the rates of sedimentation were different (Figure 4).
FIGURE 4.
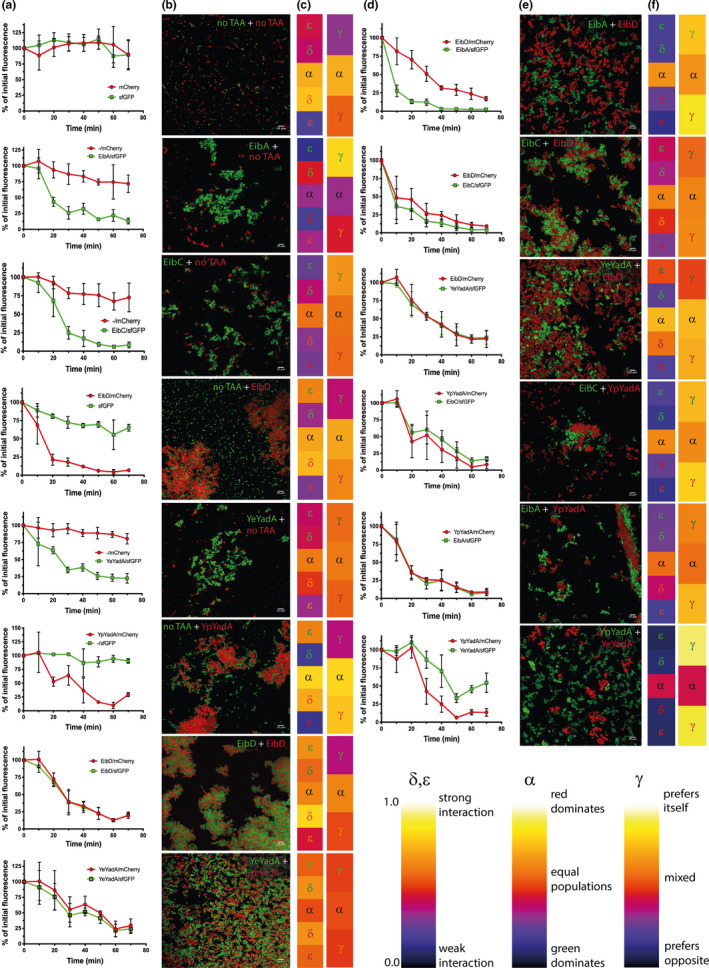
Coaggregation of model TAAs. To test for heterotypic aggregation, we mixed two cultures of bacteria, each expressing a different TAA and marker protein. Equal amounts of bacteria were mixed, and the culture was induced for 2.5 hr, after which the culture was incubated statically. (a) Sedimentation assays for controls for coaggregation. To control for coaggregation in the absence of a TAA, we mixed bacteria expressing only a marker protein with bacteria expressing the other marker protein and a TAA. We also tested whether bacteria with just marker proteins would coaggregate. We also tested whether bacteria expressing the same TAA (EibD or YeYadA) but different marker proteins would coaggregate. The curves show the reduction of fluorescence at the top of induced, statically incubated cultures over time as a percentage of the fluorescence measured at time = 0. Data points are the mean values and error bars the standard deviations of three biological replicates. (b) Representative confocal fluorescence micrographs of samples from the bottom of the tubes at the end of experiments shown in panel a. The scale bar in the bottom right corner corresponds to 10 µm. (c) Heat maps demonstrating the average values for the various parameters measured from the micrographs in panel b at a radius of 2 µm. α = population ratio (the number of green bacteria divided by the total number of bacteria); δ = opposition affinity (the fraction of bacteria with a bacterium of the opposite color as the closest neighbor); ε = neighborhood composition (fraction of bacterial neighbors of opposite color within radius); γ = association index (the fraction of bacteria with at least one neighbor of the same color of all bacteria with at least one neighbor within the radius). Due to the directional nature of these measurements, there are two values for each parameter except α, the topmost taking the perspective from population 1 (green) and the second from population 2 (red). α is shown in both bars; this is due to how the plugin exports the heat maps. The symbols are colored according to the channel from which the parameter was calculated (α is only calculated from the green channel). δ and ε will be high (go toward yellow) for interacting bacteria, while extreme values of γ (blue and yellow) indicates no coaggregation. For full statistics, see Table 2. The key to the heat maps is given in panel g. (d) Sedimentation assays for coaggregation of model TAAs. To test for heterotypic aggregation, we mixed two cultures of bacteria, each expressing a different TAA and marker protein. Equal amounts of bacteria were mixed and the culture was induced for 2.5 hr, after which the culture was incubated statically. The sedimentation assay was performed as in panel a. (e) Representative micrographs of the bacterial pellet at the end of the experiment shown in panel d. The scale bar corresponds to 10 µm. (f) Heat maps demonstrating the average values for the various parameters measured from the micrographs in panel e at a radius of 2 µm. See legend for panel c for full description. (g) Key for heat maps. The heat maps scale between zero and unity, low values being dark and high values light. For δ and ε, low values indicate weak interactions whereas higher values indicate strong interactions between the populations. For α, low values indicate that the total bacterial population has more green cells, whereas high values correspond to a population with mostly red cells. An intermediate value (0.5, orange) demonstrates an equal population. For γ, extreme values suggest either a preference for bacteria of the same type (high values) or the opposite type (low values), whereas intermediate values indicate mixing of the two populations.
To determine whether the two mixed cultures interact directly, we examined the pellets formed by the aggregating bacteria at the end of the sedimentation assay by confocal microscopy. In control cultures with only fluorescent proteins, no aggregation was observed (Figure 4b). In assays where we mixed a TAA‐producing culture with a control culture, most of the visible control bacteria were as individual cells and not associated with an aggregate. However, some control bacteria appeared to be trapped within aggregates formed mainly by TAA‐producing cells (Figure 4b). We also performed another control experiment, where we mixed a culture producing sfGFP and a given TAA with another culture producing mCherry and the same TAA, that is, both cultures produced the same adhesin but different fluorescent markers. In these experiments, EibD/sfGFP and EibD/mCherry, as well as YeYadA/sfGFP and YeYadA/mCherry, produced highly mixed aggregates (Figure 4b). By contrast, when we mixed cultures producing different TAAs, we observed a variety of effects (Figure 4e). For example, EibC and EibD, which are very similar in sequence, showed a preference for a homotypic interaction but still produced mixed aggregates. Cultures producing EibA/sfGFP and EibD/mCherry, however, appeared not to form mixed aggregates. Surprisingly, the same was true of YeYadA/sfGFP and YpYadA/mCherry, despite having very similar sequences. We also tested for coaggregation between groups: EibD/mCherry and YeYadA/sfGFP mediated the formation of aggregates that were mixed to a modest degree, as did EibA/sfGFP and YpYadA/mCherry and EibC/sfGFP and YpYadA/mCherry (Figure 4e).
These results are descriptive, and we wished to gain more quantitative data. To this end, we wrote a script implemented in Fiji (Schindelin et al., 2012) that identifies the centroids of fluorescence and calculates the number of neighboring bacteria of the same or the opposite color. We reasoned that a single number would not be sufficient to describe the variety of interactions we saw; we thus calculated five values from our data designated with Greek symbols (as described in Materials & Methods). Four values (β, γ, δ, ε) were calculated both ways, that is, from population 1 (green) to population 2 (red) and vice versa. The bases for these values are depicted graphically in Figure 2. These values are shown by heat maps in Figure 4 and numerically in Table 2. For analysis, we chose a radius of 2 µm, as this would cover the first layer of closely interacting bacteria but not bacteria located beyond this layer, therefore giving an overview of the interactions near the bacteria being analyzed.
TABLE 2.
Coaggregation parameters of TAA interactions
| Samples | Population ratio – α | Neighborhood density – β a (average number of neighboring cells within radius) | Opposition affinity – δ a (fraction of cells having a cell of the opposite color as the closest neighbor) | Association index – γ a (ratio of cells with a neighbor of the same color to those with a neighbor of either color) | Neighborhood composition – ε a (fraction of neighbors of opposite color) | ||||
|---|---|---|---|---|---|---|---|---|---|
| Channel | Green | Green | Red | Green | Red | Green | Red | Green | Red |
| ‐/mCherry + ‐/sfGFP | 0.69 ± 0.07 |
0.77 ± 0.27 *** c |
0.55 ± 0.21 * b **** c |
0.73 ± 0.07 | 0.36 ± 0.12 | 0.26 ± 0.14 | 0.50 ± 0.18 |
0.40 ± 0.09 * b |
0.19 ± 0.07 * c |
| EibA/sfGFP + ‐/mCherry |
0.31 ± 0.17 ** b *** d |
1.94 ± 0.21 |
1.08 ± 0.58 *** c |
0.18 ± 0.14 **** b **** c **** d |
0.43 ± 0.21 |
0.78 ± 0.14 **** b *** c **** d |
0.48 ± 0.16 |
0.13 ± 0.11 **** b **** c ** d |
0.31 ± 0.21 |
| EibA/sfGFP + EibD/mCherry | 0.63 ± 0.07 | 1.78 ± 0.39 |
2.10 ± 0.68 ** d |
0.24 ± 0.24 **** b *** c **** d |
0.18 ± 0.26 ** b *** c |
0.73 ± 0.20 **** b * c **** d |
0.80 ± 0.22 ** b ** c * d |
0.17 ± 0.16 **** b **** c * d |
0.13 ± 0.17 ** b **** c |
| EibA/sfGFP + YpYadA/mCherry | 0.55 ± 0.16 |
1.29 ± 0.37 ** c |
1.20 ± 0.11 *** c |
0.37 ± 0.22 **** b * c *** d |
0.26 ± 0.12 ** c |
0.63 ± 0.18 **** b **** d |
0.72 ± 0.12 * b * c |
0.25 ± 0.17 **** b ** c |
0.18 ± 0.09 * b *** c |
| EibC/sfGFP + EibD/mCherry | 0.59 ± 0.07 |
3.15 ± 1.58 * b **** d |
2.88 ± 1.42 * b **** d |
0.45 ± 0.05 ** b * d |
0.33 ± 0.11 | 0.54 ± 0.03 | 0.61 ± 0.09 |
0.38 ± 0.05 ** b *** c |
0.27 ± 0.08 |
| EibC/sfGFP + YpYadA/mCherry | 0.61 ± 0.12 |
2.48 ± 0.98 ** d |
3.23 ± 0.92 ** b **** d |
0.24 ± 0.13 **** b *** c **** d |
0.15 ± 0.16 ** b *** c |
0.73 ± 0.11 **** b * c **** d |
0.78 ± 0.13 ** b ** c * d |
0.19 ± 0.10 **** b *** c |
0.13 ± 0.15 ** b *** c |
| EibC/sfGFP + ‐/mCherry | 0.56 ± 0.19 | 2.23 ± 0.41 |
1.15 ± 0.45 *** c |
0.29 ± 0.09 **** b *** c **** d |
0.36 ± 0.20 |
0.65 ± 0.06 **** b **** d |
0.59 ± 0.19 |
0.24 ± 0.07 **** d |
0.27 ± 0.17 * b |
| EibD/mCherry + EibD/sfGFP | 0.60 ± 010 | 1.84 ± 0.71 |
1.72 ± 0.45 * d |
0.77 ± 0.07 | 0.53 ± 0.15 |
0.34 ± 0.04 ** d |
0.49 ± 0.09 |
0.62 ± 0.08 * d |
0.42 ± 0.11 |
| EibD/mCherry + YeYadA/sfGFP | 0.71 ± 0.05 |
3.07 ± 0.80 * b **** d |
2.77 ± 0.64 * b **** d |
0.56 ± 0.04 |
0.23 ± 0.06 * b ** c |
0.48 ± 0.01 * d |
0.69 ± 0.06 | 0.49 ± 0.04 |
0.21 ± 0.05 ** c |
| EibD/mCherry + ‐/sfGFP | 0.68 ± 0.07 | 2.09 ± 0.55 |
2.51 ± 0.56 *** d |
0.71 ± 0.13 | 0.31 ± 0.06 | 0.35 ± 0.07 | 0.61 ± 0.04 | 0.60 ± 0.10 | 0.27 ± 0.06 |
| YeYadA/sfGFP + ‐/mCherry | 0.57 ± 0.24 |
2.14 ± 0.54 * d |
1.34 ± 0.45 |
0.45 ± 0.18 ** b * d |
0.40 ± 0.25 |
0.54 ± 0.14 ** d |
0.55 ± 0.21 | 0.37 ± 0.16 | 0.31 ± 0.20 |
| YeYadA/sfGP + YeYadA/mCherry | 0.49 ± 0.06 |
2.70 ± 0.33 *** d |
2.77 ± 0.31 **** d |
0.62 ± 0.08 | 0.63 ± 0.10 | 0.47 ± 0.03 | 0.46 ± 0.5 | 0.52 ± 0.07 |
0.53 ± 0.08 ** d |
| YeYadA/sfGFP + YpYadA/mCherry | 0.40 ± 0.15 | 1.94 ± 0.16 | 2.6 ± 0.31 |
0.10 ± 0.05 **** b **** c **** d |
0.10 ± 0.02 *** b **** c |
0.88 ± 0.06 **** b **** c **** d |
0.84 ± 0.02 *** b *** c ** d |
0.07 ± 0.04 **** b **** c *** d |
0.08 ± 0.02 *** b **** c |
| YpYadA/mCherry + ‐/sfGFP |
0.77 ± 0.16 * d |
2.01 ± 0.30 | 2.95 ± 0.74 | 0.68 ± 0.19 | 0.16 ± 0.12 | 0.33 ± 0.18 | 0.76 ± 0.1 | 0.59 ± 0.18 |
0.14 ± 0.10 * b |
Statistics were calculated with one‐way ANOVA followed by Tukey's multiple comparison test. Significant differences to control samples are indicated: *p < 0.05, **p < 0.01, ***p < 0.001, ****p < 0.0001.
These values are radius‐dependent. The values shown were calculated at a radius of 2 µm.
In comparison with EibD/mCherry + EibD/sfGFP.
In comparison with YeYadA/mCherry + YeYadA/sfGFP.
In comparison with ‐/mCherry + ‐/sfGFP.
Control bacteria (‐/mCherry and ‐/sfGFP) presented as single cells and consequently have low values for the neighborhood density (<1.0) (Table 2). For controls where we mixed two populations producing the same TAAS (EibD/mCherry + EibD/sfGFP and YeYadA/mCherry + YeYadA/sfGFP), the neighborhood density is close to 2.0. This was significantly higher than the aggregation‐negative controls for YeYadA (p < 0.0001) and also for EibD/sfGFP + EibD/mCherry in the red channel (p < 0.05). The association indexes of these autoaggregation controls are around 0.5 or below, indicating a high degree of mixing. Similarly, the neighborhood compositions show ~50% cells of the opposite type and the opposition affinity is over 0.5, demonstrating the high mixing of the populations in these samples. For the controls where a TAA expressing culture was mixed with a culture lacking a TAA, the γ, δ, and ε values indicated mixing, though they tend to be very asymmetric for the different channels. For example, for EibD/mCherry + sfGFP, γ = 0.35 when measured in the green channel, but γ = 0.61 when measured in the red channel. The former suggests a preference for the opposite color, whereas the latter shows a small preference for self‐association, which is to be expected as the autoaggregating EibD‐expressing cells are red. Neither result was statistically significantly different from the EibD‐EibD or the autoaggregation‐negative control. These results are probably due to individual control bacteria not expressing a TAA being trapped in aggregates of the opposite type (Figure 4b). We consider this to be an unspecific interaction (see Section 4).
When we mixed two cultures producing different TAAs, the parameters show that the degree of mixing within the aggregates follows the sequence similarity of the two interacting TAAs (Table 2). EibC/sfGFP and EibD/mCherry, which share 89% similarity, have association indexes around 0.55, suggesting generally mixed aggregates but with a slight preference for homotypic interactions (no significant difference to EibD‐EibD). Similar conclusions can be drawn from the opposition affinities and neighborhood compositions, where any significant differences to the controls could only be seen for one of two channels. For EibD/mCherry and YeYadA/sfGFP, with 25% similarity, the parameters show asymmetry between the channels, but again statistically significant differences to the autoaggregation controls could only be seen in one channel. These findings support an intermediate level of mixing, as also seen in the micrographs (Figure 4e). The mix of EibA/sfGFP and YpYadA/mCherry has association indexes around 0.7 showing a preference for homotypic interaction, and there are significant differences for all the parameters compared to the autoaggregation controls, suggesting a weak interaction.
The quantification of the interactions bears out the exclusion seen for the EibA‐EibD and YeYadA‐YpYadA pairs (Table 2). This is particularly so for the latter pair, where the association indexes are above 0.8, showing a clear preference for homotypic interactions, and the neighborhood composition below 0.1 and the opposition affinities around 0.1, demonstrating the exclusion of heterotypic aggregation. These results were all statistically significant. For EibA‐EibD, δ and ε are slightly higher and γ slightly lower but still clearly indicative of exclusion, supported by the significant differences to the controls. Similar to EibA‐EibD, EibC‐YpYadA also has parameter values suggestive of exclusion. The interactions between the tested combinations are summarized in Table 3.
TABLE 3.
Summary of interactions between model TAAs
| TAA | EibA | EibC | EibD | YeYadA | YpYadA |
|---|---|---|---|---|---|
| EibA |
100% NT |
‐ | ‐ | ‐ | ‐ |
| EibC |
35% NT |
100% NT |
‐ | ‐ | ‐ |
| EibD |
37% Exclusion (γ = 0.8 a ) |
89% Intermediate coaggregation (γ = 0.61) |
100% Strong coaggregation (γ = 0.49) |
‐ | ‐ |
| YeYadA |
25% NT |
27% NT |
25% Intermediate coaggregation (γ = 0.69) |
100% Strong coaggregation (γ = 0.46) |
‐ |
| YpYadA |
19% Weak coaggregation (γ = 0.72 a ) |
30% Weak coaggregation (γ = 0.78 a ) |
32% NT |
69% Exclusion (γ = 0.84 a ) |
100% NT |
The top number (%) in each cell gives the similarity in the passenger. The next description (strong, intermediate, weak coaggregation or exclusion) is of the strength of the coaggregation. The association index γ (green channel) is given as an indication of this, but all the parameters in Table 2 and the micrographs in Figure 4 should be considered to gain a holistic view.
Statistically significant difference to the autoaggregation control (EibD/sfGFP + EibD/mCherry or YeYadA/sfGFP + YeYadA/mCherry). NT = not tested.
3.3. TAAs promote biofilm formation on different surfaces
Auto‐ or coaggregation is often a step on the developmental pathway leading to biofilm formation (Trunk et al., 2018). TAAs are known to mediate the formation of biofilm (Leo et al., 2011; Mil‐Homens & Fialho, 2012; Okaro, Green, Mohapatra, & Anderson, 2019). We, therefore, tested the ability of our model TAAs to promote biofilm formation when expressed from our dual‐expression constructs. We tested biofilm formation on two surfaces, glass (hydrophilic) and polystyrene (hydrophobic), both under static conditions and with mild agitation. We diluted noninduced bacterial cultures in autoinduction medium and allowed them to grow for 4 days. Biofilm deposition was measured by crystal violet staining. TAAs mediated poor biofilm formation on a glass surface in the absence of agitation (Figure 5). However, under mild agitation, the expression of TAAs except EibA led to a more robust biofilm on this substrate. Interestingly, EibA promoted the formation of the most biofilm on glass under static conditions, but with agitation, only a weak biofilm was formed. All TAAs promoted biofilm formation on polystyrene, though except for EibA/sfGFP more biomass was deposited under agitation. A control culture (‐/sfGFP) produced some biofilm on glass and polystyrene. Except for on glass without agitation, YpYadA promoted significant biomass deposition and mediated the formation of the strongest biofilm on polystyrene. This is consistent with previous reports showing YpYadA to be a stronger autoagglutinin and to promote more biofilm formation than YeYadA (Heise & Dersch, 2006). It is interesting to note that on glass, agitation promoted biofilm formation by TAAs except EibA, which suggests that shear forces promote adhesion mediated by TAAs on this surface. Similar catch bond‐type behavior has been observed for several bacterial adhesins before (Dufrêne & Viljoen, 2020; Hospenthal & Waksman, 2019) and also the TAA AtaA from Acinetobacter sp. Tol 5 mediates stronger binding to glass surfaces and more aggregation under moderate shear stress (Furuichi, Iwasaki, & Hori, 2018).
FIGURE 5.
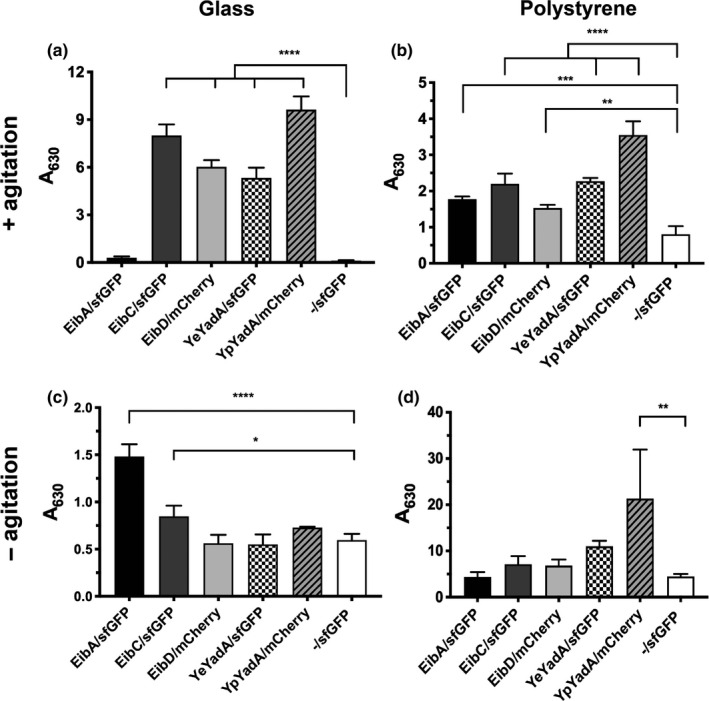
Model TAAs mediate the formation of biofilm on glass and polystyrene surfaces. Bacteria were grown under autoinducing conditions either under mild agitation (40 rpm; panels a and b) or statically (panels c and d) for 4 days and then stained with crystal violet to measure biomass deposition. The substrate was either a glass coverslip kept in wells of a 6‐well plate (a and c) or a well in a 24‐well polystyrene plate (b and d). The crystal violet was eluted with ethanol and the absorbance measured at 630 nm. The bars depict the mean and the error bars the standard deviation of three biological replicates. Statistical differences to the ‐/sfGFP control were estimated by one‐way ANOVA followed by Dunnett's multiple comparison test. Significant differences are shown (*p < 0.05, **p < 0.01, ***p < 0.001, ****p < 0.0001).
3.4. TAAs can promote the formation of mixed biofilm
We wished to find out whether two bacterial populations expressing different TAAs form mixed biofilms or whether the formed biofilm would be segregated into microdomains of bacteria expressing a certain TAA. To do this, we mixed inoculum of two different populations in a glass‐bottom culture plate and allowed expression of TAAs and fluorescent markers by autoinduction over 4 days. Though glass is not a very good substrate for TAA biofilm formation (Figure 5), we were obliged to use this as well as static culture conditions for imaging. We chose a subset of the pairs observed in the coaggregation experiments that would cover the various interactions observed.
When we cocultured cells expressing EibD/mCherry with EibD/sfGFP, highly mixed biofilms were produced, as expected (Figure 6). Similarly, YeYadA/mCherry and YeYadA/sfGFP also formed a mixed biofilm. Cocultures of EibD/mCherry with YeYadA/sfGFP also produced mixed biofilm (Figure 6). Strikingly, when EibD/mCherry was mixed with EibA/sfGFP, the biofilm was segregated, with patches of mCherry‐expressing cells interspersed within the biofilm formed predominantly by sfGFP‐producing bacteria. This is similar to the situation observed for the EibA‐EibD pair in coaggregation experiments. By contrast, YeYadA/sfGFP and YpYadA/mCherry did form a mixed biofilm (Figure 6). This was unexpected, as YpYadA and YeYadA excluded each other in the coaggregation experiments.
FIGURE 6.
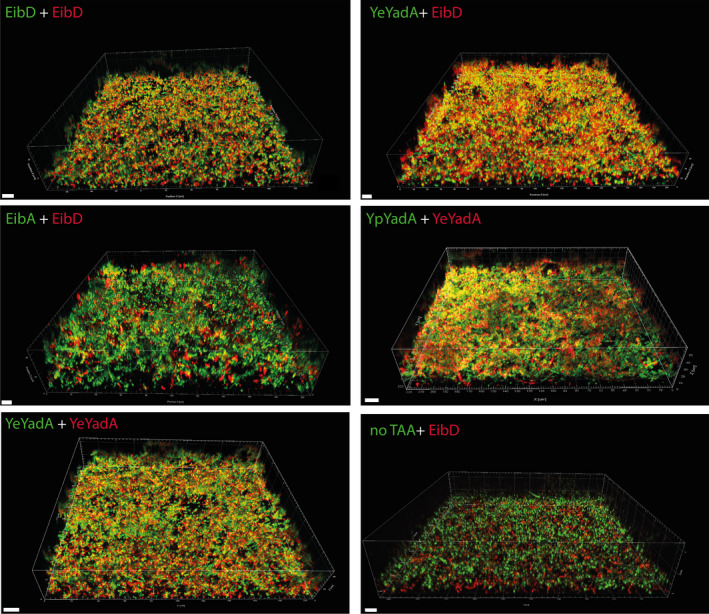
TAAs can mediate the formation of mixed biofilms. Representative 3‐dimensional reconstructions of image stacks obtained using spinning disk confocal microscopy. Bacterial were mixed with equal inocula and grown statistically on glass‐bottom plates form imaging under autoinducing conditions for 4 days and then imaged using an Andor Dragonfly microscope. The scale bar in the lower‐left corner corresponds to 10 µm.
In control experiments, we cocultured cells producing EibD/mCherry with ‐/sfGFP cells. In these, the TAA‐expressing cells produced the main part of the biofilm, with some non‐TAA‐expressing bacteria forming a layer on the top of the biofilm (Figure 6). We also checked that all the strains grew similarly throughout the experiment; while there was some variation, all strains grew comparably (Figure A3).
To quantify these results, we used the spot colocalization function of the Imaris software. Here, the cells are represented as a spot corresponding to the centroids of fluorescence intensity. As for the coaggregation analysis, we chose 2 µm as the radius for detecting colocalized spots. The results of the analysis are given in Table 4. EibD/mCherry and EibD/sfGFP had a very high degree of colocalization, with approximately 80% of spots within the vicinity of a spot of the opposite color. Biofilms with YeYadA/mCherry and YeYadA/sfGFP were similarly mixed, with roughly 70% of spots colocalized. This result was not significantly different from EibD/mCherry and EibD/sfGFP. The controls where bacteria expressing a TAA were mixed with bacteria producing just the fluorescent marker formed biofilms with very little colocalization, with ~10% of the spots within 2 µm of a spot of the opposite color, a significantly different result when compared with either control, EibD/mCherry + EibD/sfGFP or YeYadA/mCherry + YeYadA/sfGFP (p < 0.0001).
TABLE 4.
Colocalized cells in mixed biofilm experiments
| Samples | Colocalized spots (%) a | |
|---|---|---|
| Green to red | Red to green | |
| EibD/mCherry + ‐/sfGFP |
9.7 ± 5.2 **** b **** c |
13.8 ± 6.2 **** b *** c |
| EibD/mCherry + EibA/sfGFP |
41.5 ± 4.3 *** b * c |
55.7 ± 4.2 ** b |
| EibD/mCherry + EibD/sfGFP | 82.6 ± 15.1 | 78.5 ± 20.6 |
| EibD/mCherry + YeYadA/sfGFP |
59.9 ± 2.7 * b |
63.3 ± 1.2 |
| YeYadA/mCherry + YeYadA/sfGFP | 69.1 ± 3.8 | 75 ± 9.4 |
| YeYadA/sfGFP + YpYadA/mCherry |
54.7 ± 10.2 * b |
52.6 ± 2.9 |
Statistics were calculated with one‐way ANOVA followed by Tukey's multiple comparison test. Significant differences to coaggregation controls are indicated: *p < 0.05, **p < 0.01, ***p < 0.001, ****p < 0.0001.
Colocalization percentages are calculated as the proportion of bacteria of one color with a neighbor of the opposite color with a 2 μm radius. The values given are the means from three biological replicates along with standard deviations.
In comparison with EibD/mCherry + EibD/sfGFP.
In comparison with YeYadA/mCherry + YeYadA/sfGFP.
In biofilms formed by bacteria producing different TAAs, the level of mixing was lower. For the EibD‐YeYadA pair, ~60% of the spots were colocalized. This is consistent with the intermediate coaggregation seen for this pair (Figure 4), and the result was only significantly different from the EibD‐EibD control when measured in the green channel. Surprisingly, given the clear exclusion seen in autoaggregation experiments, YeYadA/sfGFP and YpYadA/mCherry produced relatively mixed biofilms, with ~50% of spots colocalized, but this was significantly different from the EibD‐EibD control (p < 0.05). Also, EibA/sfGFP + EibD/mCherry had an overall colocalization of ~50%, though the values were rather asymmetric, with only 40% colocalized when measured from the green channel. This might reflect the segregated structure of the biofilm, where the smaller groups of EibD/mCherry bacteria are more likely to be colocalized with an EibA/sfGFP bacterium, therefore giving a higher value. However, the results seen for EibD‐EibA were significantly different from EibD‐EibD in both channels (p < 0.01) and YeYadA‐YeYadA in the green channel (p < 0.05).
4. DISCUSSION
4.1. TAAs can mediate coaggregation
In this study, we investigated the ability of TAAs to mediate coaggregation. Our results demonstrate that TAAs can promote coaggregation and that the degree of coaggregation mostly correlates with the sequence similarity of the two interacting TAAs (Table 3). For example, EibD and EibC, which are 89% similar, showed a preference for homotypic interactions, but heterotypic interactions also led to moderately mixed coaggregates. The more distantly related EibD and YadA, or YpYadA and EibA, coaggregated to a lesser but still observable degree. Such heterotypic interactions were also observed when the mixed cultures formed biofilms. Cocultures of EibD‐ and YeYadA‐expressing bacteria formed mixed biofilms, though the degree of mixing was not as high as for cultures where bacteria expressed either EibD or YeYadA alone.
The aggregation function of TAAs is suggested to reside in the globular head domains. This has been demonstrated for YadA, where the YadA‐like head and neck are responsible for autoaggregation (Hoiczyk et al., 2000; Roggenkamp et al., 2003). The exact domains responsible for autoaggregation in Eibs have not been determined; however, as EibA, which lacks the YadA‐like head, also mediates autoaggregation, presumably the N‐terminal Eib domain contributes to the autoaggregative phenotype. If the sequence similarities in just the head domains of the model TAAs (Table A1) are compared, the trend is very similar to what is observed for the full passengers, though the level of similarity is generally somewhat lower. As the autoaggregative regions of the Eibs have not been determined, comparing the similarities of the entire passenger sequences is a reasonable approach.
In addition to TAAs, coaggregation has been reported between the SAATs or self‐associating autotransporters, a group of related, classical (type 5a) autotransporters (Klemm, Vejborg, & Sherlock, 2006; Sherlock, Schembri, Reisner, & Klemm, 2004). Recently, the aggregation properties of a subgroup of SAATs were described (Ageorges et al., 2019). In this study, the auto‐ and coaggregation of four different classes of the enterobacterial adhesin Antigen 43 (Ag43) were investigated. Only a subset (2/6) of heterotypic Ag43 combinations were found to interact appreciably; in our experiments, (3/6) combinations of TAAs formed mixed aggregates. Our model proteins are more diverse in structure and sequence than the Ag43 groups studied by Ageorges et al., and we also observed cross‐group coaggregation (EibD + YeYadA, EibA + YpYadA). This suggests that TAAs might be more promiscuous than the Ag43 group; however, further studies will be needed to examine the extent of coaggregation within and between different subgroups of TAAs to establish the extent of TAA‐mediated coaggregation.
In our coaggregation experiments, we observed a relatively high level of association between TAA‐expressing bacteria and control bacteria lacking a TAA. In the micrographs of these control experiments, many individual cells of the opposite color appear trapped within aggregates consisting mainly of TAA‐expressing bacteria. Although the association indexes of these interactions suggested mixing, we contend that this does not represent a specific interaction. First, in the sedimentation assays, the fluorescence at the top of the control cultures is not significantly reduced during the experiment, and certainly not to the extent of the fluorescence of the TAA‐expressing bacteria. If the TAAs were mediating binding to non‐TAA molecules on the surface of the control bacteria, we would expect to see a larger reduction in the fluorescence. Second, the micrographs show a large number of individual control bacteria outside the aggregates. If the TAA‐expressing bacteria were specifically binding to control bacteria, we would expect most if not all the control bacteria in these pellet samples to be associated with the aggregates, which is not the case. Third, if TAA‐expressing bacteria were to bind other bacteria indiscriminately, we would expect to see a higher degree of mixing for the pairs where two different TAAs interact, and exclusion should not be observed at all. Fourth, single bacteria trapped similarly inside aggregates have been observed before, when investigating the coaggregation mediated by the classical autotransporter Ag43 (Ageorges et al., 2019; Klemm et al., 2006). And finally, the stratified structure and low colocalization in the biofilm experiments suggest that control bacteria do not bind strongly to TAA‐expressing bacteria. Therefore, we maintain that the interaction parameters suggesting mixed aggregates seen for the control bacteria do not represent a specific interaction, but rather demonstrate that bacteria without TAAs become stochastically trapped within forming aggregates. As the trapped bacteria have a high number of neighbors of the opposite color, this leads to the interaction parameters suggesting coaggregation. However, it should be noted that some TAAs do make bacteria generally sticky, and this may play a role in recruiting control bacteria to the aggregates (Ishikawa et al., 2012).
4.2. Some TAAs exclude each other
In addition to coaggregation, we also observed some exclusion of bacteria of different types. This was a surprising result, as based purely on the level of sequence similarity we would have expected these TAAs to mediate coaggregation, at least to a low extent. In the case of EibA and EibD (37% similar), the two cultures excluded each other both in the coaggregation experiments and in the biofilm experiments. In the latter, EibA‐producing bacteria were dominant in the biofilm, with smaller patches of EibD‐expressing bacteria on the surface of the biofilm. EibA mediates better adhesion to glass surfaces under static conditions than EibD; this might explain why EibA‐producing bacteria outcompete EibD‐producing bacteria in the lower levels of the biofilm. EibA lacks the YadA‐like head of EibD (Figure 1b); this structural difference might account for exclusion between these two proteins.
Similarly, YeYadA and YpYadA excluded each other in the coaggregation experiments. These proteins are very similar (69% in the passenger), so one would expect these proteins to interact. The fact that they do not is most likely due to the uptake region, present in YpYadA but lacking in YeYadA. Presumably, the uptake region covers part of the head domain, because it prevents YpYadA from binding to collagen (Heise & Dersch, 2006). Therefore, it is reasonable to assume it would interfere with coaggregation with YeYadA as well, as the head domains are responsible for mediating autoaggregation (Hoiczyk et al., 2000; Roggenkamp et al., 2003). EibC and YpYadA also appeared to exclude each other, though in some micrographs a low level of coaggregation could be observed. EibC, like EibD, has a YadA‐like head; it is thus possible that the uptake region of YpYadA could interfere with this heterotypic interaction, as YeYadA does coaggregate with EibD at an intermediate level.
In contrast to the clear exclusion seen in the aggregation assays, YeYadA and YpYadA promoted the formation of relatively mixed biofilms. This might reflect the way the biofilms are formed; rather than co‐ or autoaggregating, bacteria might first adhere to the substrate and then build the biofilm through cell growth or further adhesion to existing cells from the planktonic population. If the original adherent cells bound stochastically, they might provide sufficient surface for bacteria of the same kind to bind to, even if some of their neighbors express the other YadA type. Thus, the affinity for homotypic interactions would overcome any (presumably weak) exclusionary forces imposed by the other TAA. This could lead to a moderately mixed biofilm, which is indeed what we observed.
4.3. Ecological implications
One possible advantage of autoaggregation is kin recognition, that is, the process by which organisms distinguish closely related organisms to engage in co‐operative social behaviors (Wall, 2016). Eukaryotic micro‐organisms such as amoebae, yeasts, and ciliates exhibit kin recognition and kin selection when forming multicellular structures (Chaine, Schtickzelle, Polard, Huet, & Clobert, 2010; Mehdiabadi et al., 2006; Queller, Ponte, Bozzaro, & Strassmann, 2003; Smukalla et al., 2008). Many bacteria also discriminate between related and nonrelated strains in multicellular settings such as when swarming, which require the bacteria to co‐operate (Stefanic, Kraigher, Lyons, Kolter, & Mandic‐Mulec, 2015; Tipping & Gibbs, 2019; Vos & Velicer, 2009). A recent example of co‐operation mediated by aggregation of related bacteria comes from Vibrio cholerae, where the major type IV pilus subunit PilA varies from strain to strain and the pili interact selectively to form kin‐selected co‐operative communities on chitinous surfaces (Adams, Stutzmann, Stoudmann, & Blokesch, 2019). However, even unrelated bacteria may coaggregate and co‐operate, for example, oral bacteria (Ochiai, Kurita‐Ochiai, Kamino, & Ikeda, 1993). Interestingly, a TAA of Veillonella atypica, Hag1, mediates coaggregation with several other species of oral bacteria, including even Gram‐positive organisms (Zhou, Liu, Merritt, & Qi, 2015). This allows V. atypica to act as a bridging species to produce multi‐species biofilms on oral surfaces.
Given all these examples of co‐operative aggregation, coaggregation mediated by similar TAAs may also promote co‐operation between related strains, that is, TAAs could act as a “greenbeard” trait (Brown & Buckling, 2008). Some commensal E. coli strains harbor multiple eib genes (Sandt & Hill, 2000). Thus, a single strain can interact with strains producing a variety of different TAAs. This might allow these strains to form beneficial co‐operative networks with several other closely or even more distantly related strains. Such co‐operative networks could work to increase the fitness of the bacteria by opening new niches, providing protection or allowing exploitation of novel nutrients through metabolically diverse neighbors (Freilich et al., 2011).
In contrast, the exclusion of bacteria with a different TAA could be a mechanism for competition. This is exemplified by the Y. enterocolitica–Y. pseudotuberculosis pair. Both organisms have a very similar lifestyle: They are enteropathogens with the same mode of transmission, the same pathway(s) of invasion, the same tissue tropism, and they elicit similar symptoms (Galindo, Rosenzweig, Kirtley, & Chopra, 2011). Therefore, in a coinfection setting, these two species would compete for the same resources. Indeed, mixed infections with both bacteria are comparatively rare, even in areas where both are prevalent (Arrausi‐Subiza, Gerrikagoitia, Alvarez, Ibabe, & Barral, 2016; Fredriksson‐Ahomaa, Wacheck, Koenig, Stolle, & Stephan, 2009; Okwori, Martínez, Fredriksson‐Ahomaa, Agina, & Korkeala, 2009). We speculate that the exclusion mediated by YadA of heterospecifics form bacterial aggregates could contribute to the low prevalence of coinfections by Y. enterocolitica and Y. pseudotuberculosis. Future work will address this issue in the enteropathogenic Yersiniae.
5. CONCLUSIONS
We demonstrate that TAAs can mediate coaggregation and that the level of this coaggregation mostly correlates with the sequence similarity of the two interacting TAAs. However, in some cases, certain TAAs seem to exclude each other despite relatively high sequence similarity. This is most likely due to structural differences. Our results have implications for the ecology of TAA‐expressing bacteria, where coaggregation may promote beneficial interactions and exclusion may be indicative of competition. We also provide a tool for measuring coaggregation of bacteria in the form of a script for the analysis of microscopy images, which we hope will prove to be useful to the community.
AUTHOR CONTRIBUTIONS
Hawzeen S. Khalil: Formal analysis (lead); investigation (lead); visualization (supporting); writing – review and editing (supporting). Jonas Øgaard: Software (lead); writing – original draft (supporting). Jack C. Leo: Conceptualization (lead); funding acquisition (lead); software (supporting); supervision(lead); visualization (lead); writing – original draft (lead); writing – review and editing (lead).
CONFLICT OF INTEREST
None declared.
ETHICS STATEMENT
None required.
ACKNOWLEDGMENTS
The microscopy presented in this study was performed at the Oslo NorMIC Imaging Platform at the Department of Biosciences, University of Oslo. We thank especially Frode Miltzow Skjeldal for assistance with microscopy. We also thank Dirk Linke (Department of Biosciences, University of Oslo) for discussions and support. This work was funded by a Research Council of Norway Young Investigator grant (249793) to JCL.
Appendix A.
TABLE A1.
Sequence similarities (%) of TAA head domains (Eib domain, YadA‐like head, neck)
| TAA | EibA | EibC | EibD | YeYadA | YpYadA |
|---|---|---|---|---|---|
| EibA | 100 | ‐ | ‐ | ‐ | ‐ |
| EibC | 28 | 100 | ‐ | ‐ | ‐ |
| EibD | 21 | 85 | 100 | ‐ | ‐ |
| YeYadA | 18 | 31 | 28 | 100 | ‐ |
| YpYadA | 21 | 33 | 34 | 78 | 100 |
TABLE A2.
Primers used for cloning
| Amplicon | Primer pair | Comment |
|---|---|---|
| pACYCDuet‐1 (MCS1) | TAAGGAGATATACCATATG TGTTCGACTTAAGCATTA | Amplify the vector for cloning into the first multiple cloning site |
| pACYCDuet‐1 (MCS2) | GAAGGAGATATACATATG AGCAGCCTAGGTTAATTA | Amplify the vector for cloning into the second multiple cloning site |
| EibA | GAAGGAGATATACATATGAGTAAAAAGTTTACAATGACACTCCT AGCAGCCTAGGTTAATTAAAACTCGAAGTTCACACCAAC | Amplify EibA for Gibson assembly with pACYCDuet‐1 MCS2 |
| EibC | GAAGGAGATATACATATGAGTAAAAAGTTTACAATGACACTCCT AGCAGCCTAGGTTAATTAAAACTCGAAGTTCACACCAAC | Amplify EibC for Gibson assembly with pACYCDuet‐1 MCS2 |
| EibD | TAAGGAGATATACCATATG AAA TAC CTG CTG CCG ACC TGTTCGACTTAAGCATTAAAACTCGAAGTTCACACCAAC | Amplify EibD for Gibson assembly with pACYCDuet‐ MCS1 |
| mCherry (MCS1) | TAAGGAGATATACCATGGTGAGCAAGGGCGAGGAGG TGTTCGACTTAAGCATTACTTGTACAGCTCGTCCATGCC | Amplify mCherry for Gibson assembly with pACYCDuet‐1 MCS1 |
| mCherry (MCS2) | GAAGGAGATATACATATGGTGAGCAAGGGCGAGGAGG AGCAGCCTAGGTTAATTACTTGTACAGCTCGTCCATGCC | Amplify mCherry for Gibson assembly with pACYCDuet‐1 MCS2 |
| sfGFP (MCS1) | TAAGGAGATATACCATATGTCAAAAGGTGAAGAATTATTTA TGTTCGACTTAAGCATTATTTATATAATTCATCCATACCATGTG | Amplify sfGFP for Gibson assembly with pACYCDuet‐1 MCS1 |
| sfGFP (MCS2) | GAAGGAGATATACATATGTCAAAAGGTGAAGAATTATTTA AGCAGCCTAGGTTAATTATTTATATAATTCATCCATACCATGTG | Amplify sfGFP for Gibson assembly with pACYCDuet‐1 MCS2 |
| YeYadA | GAAGGAGATATACATATGAAATACCTGCTGCCGACC AGCAGCCTAGGTTAATTACCACTCGATATTAAATGATGCATTG | Amplify YeYadA for Gibson assembly with pACYCDuet‐1 MCS2 |
| YpYadA | TAAGGAGATATACCATGACTAAAGATTTTAAGATCAGTGTCTCTG TGTTCGACTTAAGCATTACCACTCGATATTAAATGATGCGTT | Amplify YpYadA for Gibson assembly with pACYCDuet‐1 MCS2 |
FIGURE A1.
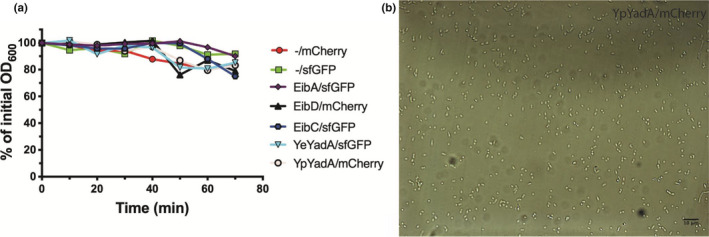
Uninduced bacteria do not autoaggregate. (a) Sedimentation assay performed on bacteria transformed with a plasmid encoding both a TAA and fluorescent protein but without induction with IPTG. The assays were performed essentially as described for Figure 2A, but rather than fluorescence the OD600 was measured. Representative curves are shown for each construct. (b) Representative light micrograph of a sample from the bottom of the tubes at the end of experiments shown in panel a demonstrating that uninduced bacteria do not autoaggregate but remain as single cells. The scale bar corresponds to 10 µm.
FIGURE A2.
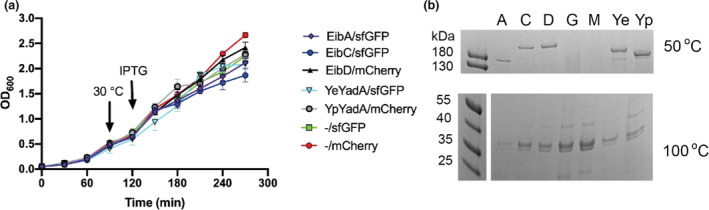
Growth and protein expression by TAA‐producing strains. (a) Growth curves for induced TAA‐producing bacteria. Strains carrying dual expression plasmids were diluted to an OD600 value of 0.05 in 20 ml LB containing chloramphenicol and 0.2% glucose and grown for 1.5 hr at 37°C. The bacteria were then moved to 30°C for 30 minutes before induction with 0.5 mM IPTG. Data points represent the mean of three biological replicates, and error bars denote standard deviations. (b) Expression of TAAs by BL21(DE3). After 2.5 hr of induction, an equal amount of bacteria were collected based on OD600 measurement and the outer membranes were extracted (Leo, Oberhettinger, & Linke, 2015). The outer membranes were solubilized in SDS‐PAGE sample buffer, and half the sample was heated at 50°C; at this temperature, the TAAs do not dissociate and run as trimers in the gel (Mikula et al., 2012, 2012). The other sample was heated at 100°C and acted as loading control; see the OmpC/OmpF band at ~35 kDa. The proteins were separated on a 4‐20% gradient gel and stained with Coomassie R‐250. Note that due to the aggregation of the bacteria, it is very difficult to obtain the same amount, which explains the small variation between the samples. A = EibA/sfGFP, C = EibC/sfGFP, D = EibD/mCherry, G = ‐/sfGFP, M = ‐/mCherry, Ye = YeYadA/sfGFP, Yp = YpYadA/mCherry. Expected sizes of the trimers are 121 kDa (EibA), 155 kDa (EibC), 157 kDa (EibA), 137 kDa (YeYadA), 127 kDa (YpYadA); the trimeric species migrate at a somewhat higher molecular weight than expected.
FIGURE A3.
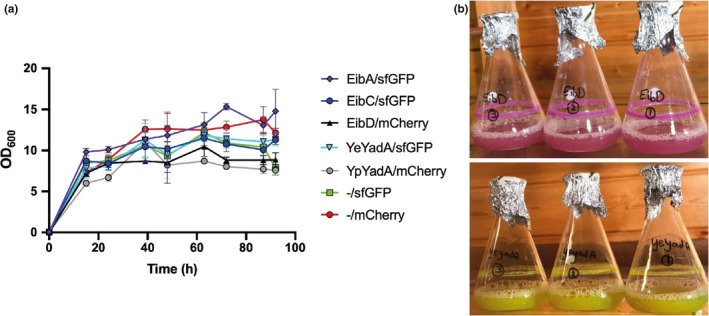
Growth of TAA‐producing strains in autoinduction medium. (a) Growth curves of TAA‐producing strains. Strains were diluted to OD600 value of 0.05 in ZYP‐5052 autoinduction medium and grown for 4 days at 30°C with shaking at 120 rpm. Growth was measured by taking the OD600 twice per day. Data points are the mean of three biological replicates; error bars denote standard deviations. (b) Image of representative bacterial cultures on day 3. Note the pellicle ring forming in the cultures even under shaking, demonstrating aggregation and adhesion to glass. These phenomena decrease the accuracy of OD600 measurements.
Appendix B.
Plugin guide
File organization
Before you begin the analysis, organize your images into experimental groups as below, where all image replicates from an experimental group belong to a subfolder of the root directory.

Options
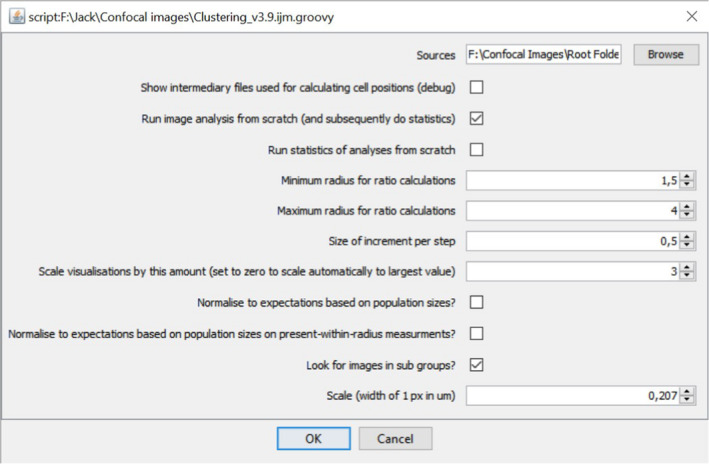
To run the plugin, load the script in the ImageJ/Fiji script editor and click run (Ctrl+R), and the options panel will appear:
«Sources are the image sources», and should be the root directory as described above
«Show intermediary files…» will display the analyzed files when they are being processed. This will generate a lot of images for a complete experimental setup but may come in handy for debugging.
«Run image analysis from scratch» will discard cached image analysis data and re‐analyze images. By default, the analyses are saved as structured files in the same directory as the images for repeated analysis which speeds up processing when experimenting with settings.
«Run statistics of analyses from scratch» will do the same for the data analysis portion of the processing.
«Minimum radius for ratio calculations» specifies lower boundary for a range of radii around every cell to be analyzed (µm).
«Maximum radius for ratio calculations» is the upper boundary of the radii (µm).
«Size of increment per step» is how much to increase the radius for each increment of the radius (µm).
«Scale visualizations by this amount» normalizes the heatmap colors to a specific amount, or set to 0 to make the heatmaps adapt to the maximum value found in the data.
«Normalize to expectations based on population sizes?» will make corrections to the statistical analysis to account for the probability of encountering bacteria if the populations are skewed. For parameters δ and ε.
«Normalize to expectations based on population sizes on population sizes…» is as above, but for parameter γ.
«Look for images in sub group» makes the script traverse the directory structure as described above. Unchecking this box makes the script only analyze images found directly under top level of the root folder.
«Scale» specifies the µm to pixel ratio of the images, that is, how wide each pixel is in µm.
Output
After the script is finished, five heatmaps are generated, with the increasing radius in the x‐direction.
«Individual illustrations» are the ε1, δ1, α, δ2, and ε2 parameters, respectively, for every individual file that was analyzed.
«avgIllustrations» is as above, but listed groupwise.
«avgIllustrations_simplified» is again δ and ε (and α), but this time the average of both directions is listed (i.e., ε1 + ε2/2). This can work splendidly under some normalization settings. The radius independent α and δ are illustrated at the far left, while ε is listed for all measured radii from left to right. Groupwise.
«Individual Illustrations Binary» illustrates the γ‐parameter (and α) for individual files.
«avgIllustrations Binary» is as above, but listed groupwise.
The images are not saved to disk automatically but must be done so by the user.
Lastly, byFile_detections.csv is saved in the root folder, containing all individual measurements, and byFolder_detections.csv contains groupwise aggregated data.
Khalil H, Øgaard J, Leo J. Coaggregation properties of trimeric autotransporter adhesins. MicrobiologyOpen. 2020;9:e1109 10.1002/mbo3.1109
DATA AVAILABILITY STATEMENT
The microscopy images and the script used to quantify coaggregation have been deposited at figshare: https://doi.org/10.6084/m9.figshare.12115347.
References
REFERENCES
- Adams, D. W. , Stutzmann, S. , Stoudmann, C. , & Blokesch, M. (2019). DNA‐uptake pili of Vibrio cholerae are required for chitin colonization and capable of kin recognition via sequence‐specific self‐interaction. Nature Microbiology, 4(9), 1545–1557. [DOI] [PMC free article] [PubMed] [Google Scholar]
- Ageorges, V. , Schiavone, M. , Jubelin, G. , Caccia, N. , Ruiz, P. , Chafsey, I. , … Desvaux, M. (2019). Differential homotypic and heterotypic interactions of antigen 43 (Ag43) variants in autotransporter‐mediated bacterial autoaggregation. Scientific Reports, 9(1), 1–19. [DOI] [PMC free article] [PubMed] [Google Scholar]
- Arrausi‐Subiza, M. , Gerrikagoitia, X. , Alvarez, V. , Ibabe, J. C. , & Barral, M. (2016). Prevalence of Yersinia enterocolitica and Yersinia pseudotuberculosis in wild boars in the Basque Country, northern Spain. Acta Veterinaria Scandinavica, 58(1), 4. [DOI] [PMC free article] [PubMed] [Google Scholar]
- Bertani, G. (1951). Studies on lysogenesis. I. The mode of phage liberation by lysogenic Escherichia coli . Journal of Bacteriology, 62(3), 293–300. [DOI] [PMC free article] [PubMed] [Google Scholar]
- Biedzka‐Sarek, M. , Venho, R. , & Skurnik, M. (2005). Role of YadA, Ail, and lipopolysaccharide in serum resistance of Yersinia enterocolitica serotype O:3. Infection and Immunity, 73(4), 2232–2244. [DOI] [PMC free article] [PubMed] [Google Scholar]
- Blom, J. F. , Zimmermann, Y. S. , Ammann, T. , & Pernthaler, J. (2010). Scent of danger: Floc formation by a freshwater bacterium Is induced by supernatants from a predator‐prey coculture. Applied and Environmental Microbiology, 76(18), 6156–6163. [DOI] [PMC free article] [PubMed] [Google Scholar]
- Brown, S. P. , & Buckling, A. (2008). A social life for discerning microbes. Cell, 135(4), 600–603. [DOI] [PubMed] [Google Scholar]
- Chaine, A. S. , Schtickzelle, N. , Polard, T. , Huet, M. , & Clobert, J. (2010). Kin‐based recognition and social aggregation in a ciliate. Evolution, 64(5), 1290–1300. [DOI] [PubMed] [Google Scholar]
- Chauhan, N. , Hatlem, D. , Orwick‐Rydmark, M. , Schneider, K. , Floetenmeyer, M. , van Rossum, B. , … Linke, D. (2019). Insights into the autotransport process of a trimeric autotransporter, Yersinia Adhesin A (YadA). Molecular Microbiology, 111(3), 844–862. [DOI] [PubMed] [Google Scholar]
- Chauhan, N. , Wrobel, A. , Skurnik, M. , & Leo, J. C. (2016). Yersinia adhesins: An arsenal for infection. Proteomics. Clinical Applications, 10(9–10), 949–963. [DOI] [PubMed] [Google Scholar]
- Daims, H. , Lücker, S. , & Wagner, M. (2006). daime, a novel image analysis program for microbial ecology and biofilm research. Environmental Microbiology, 8(2), 200–213. [DOI] [PubMed] [Google Scholar]
- Dufrêne, Y. F. , & Viljoen, A. (2020). Binding strength of Gram‐positive bacterial adhesins. Frontiers in Microbiology, 11, 1457. [DOI] [PMC free article] [PubMed] [Google Scholar]
- El‐Kirat‐Chatel, S. , Mil‐Homens, D. , Beaussart, A. , Fialho, A. M. , & Dufrêne, Y. F. (2013). Single‐molecule atomic force microscopy unravels the binding mechanism of a Burkholderia cenocepacia trimeric autotransporter adhesin. Molecular Microbiology, 89(4), 649–659. [DOI] [PubMed] [Google Scholar]
- Fexby, S. , Bjarnsholt, T. , Østrup Jensen, P. , Roos, V. , Høiby, N. , Givskov, M. , & Klemm, P. (2007). Biological Trojan Horse: Antigen 43 provides specific bacterial uptake and survival in human neutrophils. Infection and Immunity, 75(1), 30–34. [DOI] [PMC free article] [PubMed] [Google Scholar]
- Fredriksson‐Ahomaa, M. , Wacheck, S. , Koenig, M. , Stolle, A. , & Stephan, R. (2009). Prevalence of pathogenic Yersinia enterocolitica and Yersinia pseudotuberculosis in wild boars in Switzerland. International Journal of Food Microbiology, 135(3), 199–202. [DOI] [PubMed] [Google Scholar]
- Freilich, S. , Zarecki, R. , Eilam, O. , Segal, E. S. , Henry, C. S. , Kupiec, M. , … Ruppin, E. (2011). Competitive and cooperative metabolic interactions in bacterial communities. Nature Communications, 2(1), 589. [DOI] [PubMed] [Google Scholar]
- Furuichi, Y. , Iwasaki, K. , & Hori, K. (2018). Cell behavior of the highly sticky bacterium Acinetobacter sp. Tol 5 during adhesion in laminar flows. Scientific Reports, 8(1), 8285–8310. [DOI] [PMC free article] [PubMed] [Google Scholar]
- Galindo, C. L. , Rosenzweig, J. A. , Kirtley, M. L. , & Chopra, A. K. (2011). Pathogenesis of Y. enterocolitica and Y. pseudotuberculosis in human yersiniosis. Journal of Pathogens, 2011, 182051. [DOI] [PMC free article] [PubMed] [Google Scholar]
- Gibson, D. G. , Chuang, R. , Hutchison, C. A. , Venter, J. C. , Smith, H. O. , & Young, L. (2009). Enzymatic assembly of DNA molecules up to several hundred kilobases. Nature Methods, 6(5), 343–345. [DOI] [PubMed] [Google Scholar]
- Glass, D. S. , & Riedel‐Kruse, I. H. (2018). A synthetic bacterial cell‐cell adhesion toolbox for programming multicellular morphologies and patterns. Cell, 174(3), 649–658.e16. [DOI] [PubMed] [Google Scholar]
- Grosskinsky, U. , Schütz, M. , Fritz, M. , Schmid, Y. , Lamparter, M. C. , Szczesny, P. , … Linke, D. (2007). A conserved glycine residue of trimeric autotransporter domains plays a key role in Yersinia adhesin A autotransport. Journal of Bacteriology, 189(24), 9011–9019. [DOI] [PMC free article] [PubMed] [Google Scholar]
- Haaber, J. , Cohn, M. T. , Frees, D. , Andersen, T. J. , & Ingmer, H. (2012). Planktonic aggregates of Staphylococcus aureus protect against common antibiotics. PLoS One, 7(7), e41075. [DOI] [PMC free article] [PubMed] [Google Scholar]
- Hartmann, M. D. , Grin, I. , Dunin‐Horkawicz, S. , Deiss, S. , Linke, D. , Lupas, A. N. , & Hernandez Alvarez, B. (2012). Complete fiber structures of complex trimeric autotransporter adhesins conserved in enterobacteria. Proceedings of the National Academy of Sciences of the United States of America, 109(51), 20907–20912. [DOI] [PMC free article] [PubMed] [Google Scholar]
- Heise, T. , & Dersch, P. (2006). Identification of a domain in Yersinia virulence factor YadA that is crucial for extracellular matrix‐specific cell adhesion and uptake. Proceedings of the National Academy of Sciences of the United States of America, 103(9), 3375–3380. [DOI] [PMC free article] [PubMed] [Google Scholar]
- Hobley, L. , Harkins, C. , MacPhee, C. E. , Stanley‐Wall, N. R. , & Albers, S. (2015). Giving structure to the biofilm matrix: an overview of individual strategies and emerging common themes. FEMS Microbiology Reviews, 39(5), 649–669. [DOI] [PMC free article] [PubMed] [Google Scholar]
- Hoiczyk, E. , Roggenkamp, A. , Reichenbecher, M. , Lupas, A. , & Heeseman, J. (2000). Structure and sequence analysis of Yersinia YadA and Moraxella UspAs reveal a novel class of adhesins. The EMBO Journal, 19(22), 5989–5999. [DOI] [PMC free article] [PubMed] [Google Scholar]
- Hospenthal, M. K. , & Waksman, G. (2019). The remarkable biomechanical properties of the type 1 chaperone‐usher pilus: A structural and molecular perspective. Microbiology Spectrum, 7(1), PSIB‐2018. [DOI] [PMC free article] [PubMed] [Google Scholar]
- Ishikawa, M. , Nakatani, H. , & Hori, K. (2012). AtaA, a new member of the trimeric autotransporter adhesins from Acinetobacter sp. Tol 5 mediating high adhesiveness to various abiotic surfaces. PLoS One, 7(11), e48830. [DOI] [PMC free article] [PubMed] [Google Scholar]
- Kaiser, P. O. , Linke, D. , Schwarz, H. , Leo, J. C. , & Kempf, V. A. (2012). Analysis of the BadA stalk from Bartonella henselae reveals domain‐specific and domain‐overlapping functions in the host cell infection process. Cellular Microbiology, 14(2), 198–209. [DOI] [PubMed] [Google Scholar]
- Klemm, P. , Vejborg, R. M. , & Sherlock, O. (2006). Self‐associating autotransporters, SAATs: Functional and structural similarities. International Journal of Medical Microbiology, 296(4), 187–195. [DOI] [PubMed] [Google Scholar]
- Koretke, K. K. , Szczesny, P. , Gruber, M. , & Lupas, A. N. (2006). Model structure of the prototypical non‐fimbrial adhesin YadA of Yersinia enterocolitica . Journal of Structural Biology, 155(2), 154–161. [DOI] [PubMed] [Google Scholar]
- Leo, J. C. , Elovaara, H. , Bihan, D. , Pugh, N. , Kilpinen, S. K. , Raynal, N. , … Goldman, A. (2010). First analysis of a bacterial collagen‐binding protein with Collagen Toolkits: Promiscuous binding of YadA to collagens may explain how YadA interferes with host processes. Infection and Immunity, 78(7), 3226–3236. [DOI] [PMC free article] [PubMed] [Google Scholar]
- Leo, J. C. , & Goldman, A. (2009). The immunoglobulin‐binding Eib proteins from Escherichia coli are receptors for IgG Fc. Molecular Immunology, 46(8), 1860–1866. [DOI] [PubMed] [Google Scholar]
- Leo, J. C. , Lyskowski, A. , Hattula, K. , Hartmann, M. D. , Schwarz, H. , Butcher, S. J. , … Goldman, A. (2011). The structure of E. coli IgG‐binding protein D suggests a general model for bending and binding in trimeric autotransporter adhesins. Structure, 19(7), 1021–1030. [DOI] [PubMed] [Google Scholar]
- Linke, D. , Riess, T. , Autenrieth, I. B. , Lupas, A. , & Kempf, V. A. J. (2006). Trimeric autotransporter adhesins: variable structure, common function. Trends in Microbiology, 14(6), 264–270. [DOI] [PubMed] [Google Scholar]
- Lu, Y. , Iyoda, S. , Satou, H. , Satou, H. , Itoh, K. , Saitoh, T. , & Watanabe, H. (2006). A new immunoglobulin‐binding protein, EibG, is responsible for the chain‐like adhesion phenotype of Locus of Enterocyte Effacement‐negative, Shiga toxin‐producing Escherichia coli . Infection and Immunity, 74(10), 5747–5755. [DOI] [PMC free article] [PubMed] [Google Scholar]
- Lyskowski, A. , Leo, J. C. , & Goldman, A. (2011). Structure and biology of trimeric autotransporter adhesins. Advances in Experimental Medicine and Biology, 715, 143–158. [DOI] [PubMed] [Google Scholar]
- Mehdiabadi, N. J. , Jack, C. N. , Farnham, T. T. , Platt, T. G. , Kalla, S. E. , Shaulsky, G. , … Strassmann, J. E. (2006). Kin preference in a social microbe. Nature, 442(7105), 881–882. [DOI] [PubMed] [Google Scholar]
- Merkel, V. , Ohder, B. , Bielaszewska, M. , Zhang, W. , Fruth, A. , Menge, C. , … Mellmann, A. (2010). Distribution and phylogeny of immunoglobulin‐binding protein G in Shiga toxin‐producing Escherichia coli and its association with adherence phenotypes. Infection and Immunity, 78(8), 3625–3636. [DOI] [PMC free article] [PubMed] [Google Scholar]
- Meuskens, I. , Saragliadis, A. , Leo, J. C. , & Linke, D. (2019). Type V secretion systems: An overview of passenger domain functions. Frontiers in Microbiology, 10, 1163. [DOI] [PMC free article] [PubMed] [Google Scholar]
- Mikula, K. M. , Leo, J. C. , Lyskowski, A. , Kedracka‐Krok, S. , Pirog, A. , & Goldman, A. (2012). The translocation domain in trimeric autotransporter adhesins is necessary and sufficient for trimerization and autotransportation. Journal of Bacteriology, 194(4), 827–838. [DOI] [PMC free article] [PubMed] [Google Scholar]
- Mil‐Homens, D. , & Fialho, A. M. (2012). A BCAM0223 mutant of Burkholderia cenocepacia is deficient in hemagglutination, serum resistance, adhesion to epithelial cells and virulence. PLoS One, 7(7), e41747. [DOI] [PMC free article] [PubMed] [Google Scholar]
- Mühlenkamp, M. C. , Hallstrom, T. , Autenrieth, I. B. , Bohn, E. , Linke, D. , Rinker, J. , … Schütz, M. S. (2017). Vitronectin binds to a specific stretch within the head region of Yersinia adhesin A and thereby modulates Yersinia enterocolitica host interaction. Journal of Innate Immunity, 9(1), 33–51. [DOI] [PMC free article] [PubMed] [Google Scholar]
- Mühlenkamp, M. , Oberhettinger, P. , Leo, J. C. , Linke, D. , & Schütz, M. S. (2015). Yersinia adhesin A (YadA)–beauty & beast. International Journal of Medical Microbiology, 305(2), 252–258. [DOI] [PubMed] [Google Scholar]
- Nummelin, H. , Merckel, M. C. , Leo, J. C. , Lankinen, H. , Skurnik, M. , & Goldman, A. (2004). The Yersinia adhesin YadA collagen‐binding domain structure is a novel left‐handed parallel β‐roll. The EMBO Journal, 23(4), 701–711. [DOI] [PMC free article] [PubMed] [Google Scholar]
- Ochiai, K. , Kurita‐Ochiai, T. , Kamino, Y. , & Ikeda, T. (1993). Effect of co‐aggregation on the pathogenicity of oral bacteria. Journal of Medical Microbiology, 39(3), 183–190. [DOI] [PubMed] [Google Scholar]
- Okaro, U. , Green, R. , Mohapatra, S. , & Anderson, B. (2019). The trimeric autotransporter adhesin BadA is required for in vitro biofilm formation by Bartonella henselae . NPJ Biofilms and Microbiomes, 5(1), 1–9. [DOI] [PMC free article] [PubMed] [Google Scholar]
- Okwori, A. E. J. , Martínez, P. O. , Fredriksson‐Ahomaa, M. , Agina, S. E. , & Korkeala, H. (2009). Pathogenic Yersinia enterocolitica 2/O:9 and Yersinia pseudotuberculosis 1/O:1 strains isolated from human and non‐human sources in the Plateau State of Nigeria. Food Microbiology, 26(8), 872–875. [DOI] [PubMed] [Google Scholar]
- Queller, D. C. , Ponte, E. , Bozzaro, S. , & Strassmann, J. E. (2003). Single‐gene greenbeard effects in the social amoeba Dictyostelium discoideum . Science (New York, N.Y.), 299(5603), 105–106. [DOI] [PubMed] [Google Scholar]
- Riess, T. , Andersson, S. G. , Lupas, A. , Schaller, M. , Schaefer, A. , Kyme, P. , … Kempf, V. A. (2004). Bartonella adhesin A mediates a proangiogenic host cell response. Journal of Experimental Medicine, 200(10), 1267–1278. [DOI] [PMC free article] [PubMed] [Google Scholar]
- Roggenkamp, A. , Ackermann, N. , Jacobi, C. A. , Truelzsch, K. , Hoffmann, H. , & Heesemann, J. (2003). Molecular analysis of transport and oligomerization of the Yersinia enterocolitica Adhesin YadA. Journal of Bacteriology, 185(13), 3735–3744. [DOI] [PMC free article] [PubMed] [Google Scholar]
- Sandt, C. H. , & Hill, C. W. (2000). Four different genes responsible for nonimmune immunoglobulin‐binding activities within a single strain of Escherichia coli . Infection and Immunity, 68(4), 2205–2214. [DOI] [PMC free article] [PubMed] [Google Scholar]
- Sandt, C. H. , Wang, Y. D. , Wilson, R. A. , & Hill, C. W. (1997). Escherichia coli strains with nonimmune immunoglobulin‐binding activity. Infection and Immunity, 65(11), 4572–4579. [DOI] [PMC free article] [PubMed] [Google Scholar]
- Schindelin, J. , Arganda‐Carreras, I. , Frise, E. , Kaynig, V. , Longair, M. , Pietzsch, T. , … Cardona, A. (2012). Fiji: an open‐source platform for biological‐image analysis. Nature Methods, 9(7), 676–682. [DOI] [PMC free article] [PubMed] [Google Scholar]
- Sherlock, O. , Schembri, M. A. , Reisner, A. , & Klemm, P. (2004). Novel roles for the AIDA adhesin from diarrheagenic Escherichia coli: cell aggregation and biofilm formation. Journal of Bacteriology, 186(23), 8058–8065. [DOI] [PMC free article] [PubMed] [Google Scholar]
- Sikdar, R. , Peterson, J. H. , Anderson, D. E. , & Bernstein, H. D. (2017). Folding of a bacterial integral outer membrane protein is initiated in the periplasm. Nature Communications, 8(1), 1–12. [DOI] [PMC free article] [PubMed] [Google Scholar]
- Skurnik, M. , Bölin, I. , Heikkinen, H. , Piha, S. , & Wolf‐Watz, H. (1984). Virulence plasmid‐associated autoagglutination in Yersinia spp. Journal of Bacteriology, 158(3), 1033–1036. [DOI] [PMC free article] [PubMed] [Google Scholar]
- Smukalla, S. , Caldara, M. , Pochet, N. , Beauvais, A. , Guadagnini, S. , Yan, C. , … Verstrepen, K. J. (2008). FLO1 Is a variable green beard gene that drives biofilm‐like cooperation in budding yeast. Cell, 135(4), 726–737. [DOI] [PMC free article] [PubMed] [Google Scholar]
- Stefanic, P. , Kraigher, B. , Lyons, N. A. , Kolter, R. , & Mandic‐Mulec, I. (2015). Kin discrimination between sympatric Bacillus subtilis isolates. Proceedings of the National Academy of Sciences of the United States of America, 112(45), 14042–14047. [DOI] [PMC free article] [PubMed] [Google Scholar]
- Studier, F. W. (2005). Protein production by auto‐induction in high‐density shaking cultures. Protein Expression and Purification, 41(1), 207–234. [DOI] [PubMed] [Google Scholar]
- Tipping, M. J. , & Gibbs, K. A. (2019). Peer pressure from a Proteus mirabilis self‐recognition system controls participation in cooperative swarm motility. PLoS Path, 15(7), e1007885. [DOI] [PMC free article] [PubMed] [Google Scholar]
- Tree, J. J. , Ulett, G. C. , Hobman, J. L. , Constantinidou, C. , Brown, N. L. , Kershaw, C. , … McEwan, A. G. (2007). The multicopper oxidase (CueO) and cell aggregation in Escherichia coli . Environmental Microbiology, 9(8), 2110–2116. [DOI] [PubMed] [Google Scholar]
- Trunk, T. , Khalil, H. S. , & Leo, J. (2018). Bacterial autoaggregation. AIMS Microbiology, 4(1), 140–164. [DOI] [PMC free article] [PubMed] [Google Scholar]
- Valle, J. , Mabbett, A. N. , Ulett, G. C. , Toledo‐Arana, A. , Wecker, K. , Totsika, M. , … Beloin, C. (2008). UpaG, a new member of the trimeric autotransporter family of adhesins in uropathogenic Escherichia coli . Journal of Bacteriology, 190(12), 4147–4161. [DOI] [PMC free article] [PubMed] [Google Scholar]
- Vos, M. , & Velicer, G. J. (2009). Social conflict in centimeter‐ and global‐scale populations of the bacterium Myxococcus xanthus . Current Biology, 19(20), 1763–1767. [DOI] [PMC free article] [PubMed] [Google Scholar]
- Wall, D. (2016). Kin recognition in bacteria. Annual Review of Microbiology, 70(1), 143–160. [DOI] [PMC free article] [PubMed] [Google Scholar]
- Xiao, L. , Zhou, L. , Sun, C. , Feng, X. , Du, C. , Gao, Y. , … Lei, L. (2012). Apa is a trimeric autotransporter adhesin of Actinobacillus pleuropneumoniae responsible for autoagglutination and host cell adherence. Journal of Basic Microbiology, 52(5), 598. [DOI] [PubMed] [Google Scholar]
- Yu, W. , & Götz, F. (2012). Cell wall antibiotics provoke accumulation of anchored mCherry in the cross wall of Staphylococcus aureus . PLoS One, 7(1), e30076. [DOI] [PMC free article] [PubMed] [Google Scholar]
- Zhou, P. , Liu, J. , Merritt, J. , & Qi, F. (2015). A YadA‐like autotransporter, Hag1 in Veillonella atypica is a multivalent hemagglutinin involved in adherence to oral streptococci, Porphyromonas gingivalis, and human oral buccal cells. Molecular Oral Microbiology, 30(4), 269–279. [DOI] [PMC free article] [PubMed] [Google Scholar]
APPENDIX REFERENCES
- Leo, J. C. , Oberhettinger, P. , & Linke, D. (2015). Assessing the outer membrane insertion and folding of multimeric transmembrane beta‐barrel proteins. Methods in Molecular Biology (Clifton, N.J.), 1329, 157–167. [DOI] [PubMed] [Google Scholar]
- Mikula, K. M. , Leo, J. C. , Lyskowski, A. , Kedracka‐Krok, S. , Pirog, A. , & Goldman, A. (2012). The translocation domain in trimeric autotransporter adhesins is necessary and sufficient for trimerization and autotransportation. Journal of Bacteriology, 194(4), 827–838. [DOI] [PMC free article] [PubMed] [Google Scholar]
Associated Data
This section collects any data citations, data availability statements, or supplementary materials included in this article.
Data Availability Statement
The microscopy images and the script used to quantify coaggregation have been deposited at figshare: https://doi.org/10.6084/m9.figshare.12115347.