ENVIRONMENTAL SCIENCES, EARTH, ATMOSPHERIC, AND PLANETARY SCIENCES Correction for “Identifying airborne transmission as the dominant route for the spread of COVID-19,” by Renyi Zhang, Yixin Li, Annie L. Zhang, Yuan Wang, and Mario J. Molina, which was first published June 11, 2020; 10.1073/pnas.2009637117 (Proc. Natl. Acad. Sci. U.S.A. 117, 14857–14863).
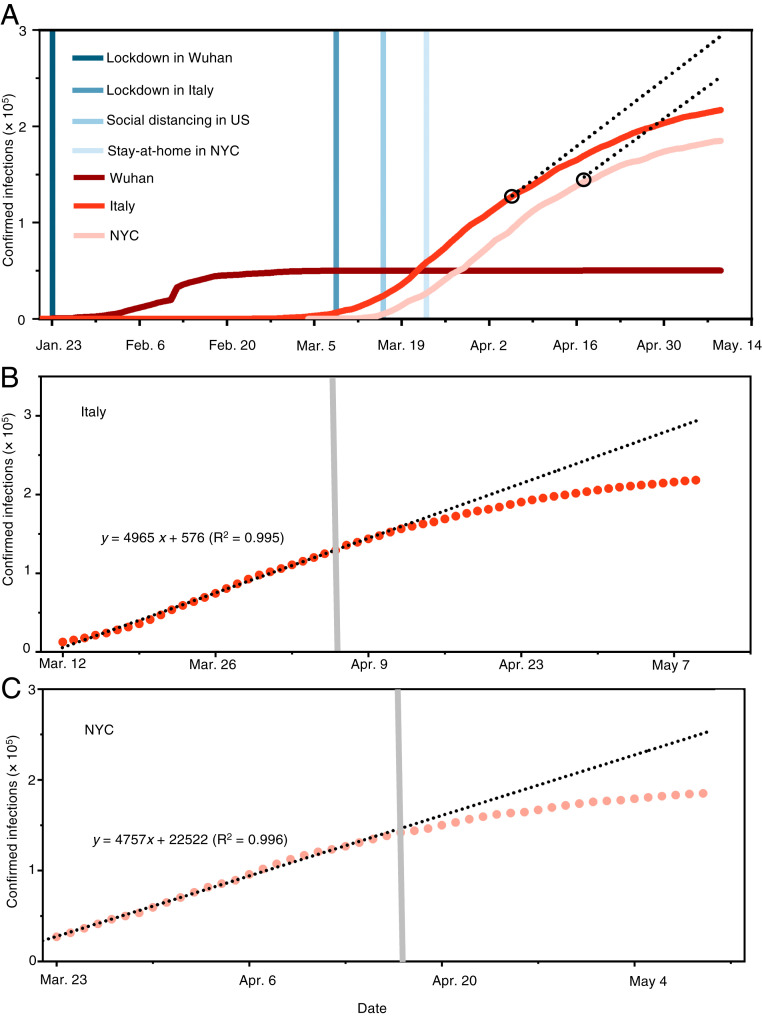
The editors note that, due to an oversight in the proofing process, the authors’ second round of edits were not incorporated into the article before publication. We apologize for the oversight and have updated the article online. In addition, the authors wish to note, “In our article the data for COVID-19 confirmed cases in Italy were retrieved from OurWorldinData.org (1), which were compiled using data from European Center for Disease Prevention and Control (ECDC) (2). However, we identified that there was a difference by one day for the total confirmed cases for Italy between the data from (1) and those reported by (2). Accordingly, the following changes have been made: (i) in the abstract, line 15, “78,000” has been changed to “75,000”; (ii) on page 14859, left column, third full paragraph, line 12, “78,000” has been changed to “75,000”; and (iii) Fig. 2B has been corrected.” The article has been updated online to reflect these changes. The corrected Fig. 2 and its corresponding legend also appear below. The corrected Fig. S1 has been updated online.
Fig. 2.
The evolving epicenter from Wuhan, to Italy, to NYC. (A) Comparison of the trends and mitigation measures between Wuhan, Italy, and NYC in 2020. The vertical lines mark the date for implementing mitigation measures. The two black circles label the dates when face covering was implemented: April 6 in northern Italy and April 17 in NYC. The black dashed lines represent the projection without face covering based on linear regression of 26-d data prior to implementing this measure. (B) Linear regression of the number of confirmed infections for 26-d data prior to implementing face covering in Italy. The shaded vertical line denotes the date when face covering was implemented on April 6 in northern Italy. (C) Linear regression of the number of confirmed infections for 26-d data prior to implementing face covering in NYC. The shaded vertical line denotes the date when face covering was implemented on April 17 in NYC. In B and C, the circles are reported values, and the dotted line represents fitting and projection of the confirmed infections before and after face-covering, respectively.
Additionally, in SI Appendix, Fig. S2B, the relative humidity was misplotted. The SI has been updated accordingly.
1. M. Roser, H. Ritchie, E. Ortiz-Ospina, J. Hasell, Coronavirus Pandemic (COVID-19). https://ourworldindata.org/coronavirus. Accessed 9 May 2020.
2. European Centre for Disease Prevention and Control, Download data on the national 14-day notification rate of new COVID-19 cases and deaths. https://www.ecdc.europa.eu/en/publications-data/data-national-14-day-notification-rate-covid-19. Accessed 14 June 2020.


