Abstract
The paper discusses a Smoothed Particle Hydrodynamics (SPH) model for the analysis of the multiphase flow occurring in an experimental microfluidic device for conformal coating of pancreatic islets with a biocompatible and permeable polymer. The proposed numerical model, based on a weakly-compressible SPH approach, accurately mimics the encapsulation process while assuring phase conservation, thus overcoming potential limitations of grid-based models. The proposed SPH model is a triphasic multi-phase model that allows one: (i) to reproduce the physics of islet conformal coating, including the effects of surface tension at the interface of the involved fluids and of the islet diameter; and (ii) to evaluate how modulation of process parameters influences the fluid dynamics within the microfluidic device and the resulting coating characteristics. This model can represent a valuable, time- and cost-effective tool for the definition of optimized encapsulation conditions through in silico screening of novel combinations of conformal coating parameters, including polymeric coating blends, size range of insulin-secreting cell clusters, utilized chemical reagents, device geometry and scale.
Keywords: Smoothed Particle Hydrodynamics, Biphasic fluid, Surface Tension, Encapsulation, Cell clusters
1. Introduction
Type-1 diabetes mellitus is an autoimmune disease leading to irreversible destruction of insulin-producing beta cells [1]. Transplantation of isolated human pancreatic cell clusters (i.e. islets of Langerhans) into patients has the potential to restore endogenous insulin secretion and ameliorate metabolic control and quality of life of patients with type-1 diabetes while eliminating the risk of hypoglycaemia and other secondary complications [2]. However, islet transplantation requires systemic lifelong immunosuppression to prevent by the host immune system response and associated immune rejection and recurrence of autoimmunity [3, 4].
Islet immunoisolation through cell encapsulation has emerged as a promising therapeutic strategy, because it may allow transplantation of pancreatic islets in patients with type-1 diabetes without chronic immunosuppression [5–7]. Cell encapsulation is achieved through a biocompatible and permeable polymeric coating, acting as a selective physical barrier between the islets and the recipient’s immune system. Encapsulation provides immunoisolation whilst allowing diffusion of oxygen, nutrients, waste products, glucose and hormones (i.e., insulin) [8].
Unfortunately, the integrity and long-term functional efficiency and biocompatibility of encapsulated islets is affected by immune activity of the host, inadequate oxygenation – which is one of the leading causes of graft failure - and/or inflammatory reactions [9]. Indeed, transport phenomena across the polymeric capsule are regulated by diffusion only. Such passive transport is limited by diffusional gradients to a distance of ~150 μm, which is significantly smaller (~10–50%) than the half-length/radial distance of polymeric films achievable through traditional encapsulation techniques [10–11]. Standard microencapsulation methods are characterized by a fixed capsule size (500–1500 μm) that is irrespective of the size of the encapsulated cell clusters. This can lead to core hypoxia, necrosis, and blunted secretion of trophic factors in response to host stimulation (e.g., delayed insulin in response to elevations in glucose) [12].
To address these issues, conformal coating (CC) techniques have been developed to reduce capsule thickness [6]. One, proposed by Tomei et al. [13], is based on a microfluidic device and leads to the formation of a uniform and thin (10–30 μm) polyethylene glycol-based hydrogel layer around the islets, regardless of islet diameter.
This CC technique [14–15] is based on injecting a fluid coaxially to an immiscible one within a 3D flow-focusing geometry, where the multiphase flow of the two fluids, characterized by high viscosity difference, leads to generation of droplets of the inner fluid; previous microfluidic applications for cell and tissue encapsulation were based on a similar technique [16]. Within the encapsulation device, the inner water phase consists of dispersed islets and hydrogel polymer precursor, while the outer phase is a high-viscosity oil (polypropylene glycol with an oil soluble surfactant to reduce surface tension). Islet encapsulation is achieved through a sequence of two distinctive fluid dynamic phenomena: (i) the dripping-to-jetting transition of the water phase [17] and (ii) the Rayleigh-Plateau instability, which results in the jet break-up into droplets containing the cell clusters. Both phenomena depend on: (i) the geometry of the device; (ii) the rheological properties of the two fluid phases; (iii) the operating parameters (e.g. water and oil flow rates, surface tension at the fluid interface). A pH-driven cross-linking reaction allows gelation of the polymer precursor and formation of a stable hydrogel coating around each islet, downstream droplet generations. Thus, the final product is islet-containing droplets whose diameter depends on the fluid dynamic phenomena occurring in the encapsulation device and should not depend on the islet diameter.
A numerical Finite Element (FEM) model of this CC encapsulation device was previously developed [13] and implemented within a fluid dynamic commercial software (Comsol® Multiphysics). However, this model only accounted for the optimization of the geometry of the device, allowing to simulate two flowing phases (i.e., the water phase, modelling the polymer precursor, and the oil phase) and the water jet formation, while neglecting the presence of a third granular phase - i.e., the islets, and, consequently the stages of jet break-up, droplets formation and coating of the cell aggregates. Importantly, this model did not allow predicting the quality of the final product – the encapsulated islet or CC product – as a function of the operating parameters. Herein, we aimed at developing a numerical model able to simulate the whole CC process and to evaluate how variation of specific working parameters influences the CC outcome.
Despite previous works successfully applied grid-based Eulerian models to the analysis of multiphase flows in microfluidic devices [18–19], in some cases where interface fragmentation or coalescence occur these models may suffer from limitations related to mesh adaptability and connectivity [20].
To overcome these limitations typical of grid-based models, an alternative numerical approach can be based on meshless methods such as Smoothed Particle Hydrodynamics (SPH). SPH models have been previously applied to the analysis of fluid dynamic phenomena involving non-Newtonian fluids and interaction between water and a granular phase [21–26], as well as to the simulation of jets interacting with an external environment [27–31] and to flows dominated by surface tension [32].
The aim of this study is the development of a SPH, triphasic model to simulate the whole microencapsulation process for the CC of pancreatic islets. The proposed model allows one: (i) to guarantee exactly mass conservation for each phase; (ii) to reproduce the relevant aspects that influence the coating process, i.e. surface tension; (iii) to evaluate the effects played on the coating process by the different process parameters. Despite the simplifications introduced (2D modelling, resolution limits), the obtained results were consistent with theoretical and experimental evidence. This work represents a first step toward the set-up of a reliable investigation tool to support the improvement of the encapsulation device and overall process to fine tune the properties of the CC product. Further studies will aim at code optimization in order to simulate 3D high-resolution configurations.
2. Materials and methods
2.1. Experimental Device and Conformal Coating Experiments
The microencapsulation device developed by [13] consists of: (i) a focusing chamber, where the water phase is injected within the oil phase and the CC process takes place within a convergent region, (ii) an inlet port connected to a syringe pump for injection of the water phase (polymer precursor and crosslinker) containing the islets, (iii) a lateral port connected to a peristaltic pump providing the oil phase (polypropylene glycol supplemented with an oil soluble surfactant) flow rate, and (iv) an outlet capillary used to drive the coated islets toward a collection vessel, downstream of the encapsulation device (Fig. 1A).
Fig. 1.
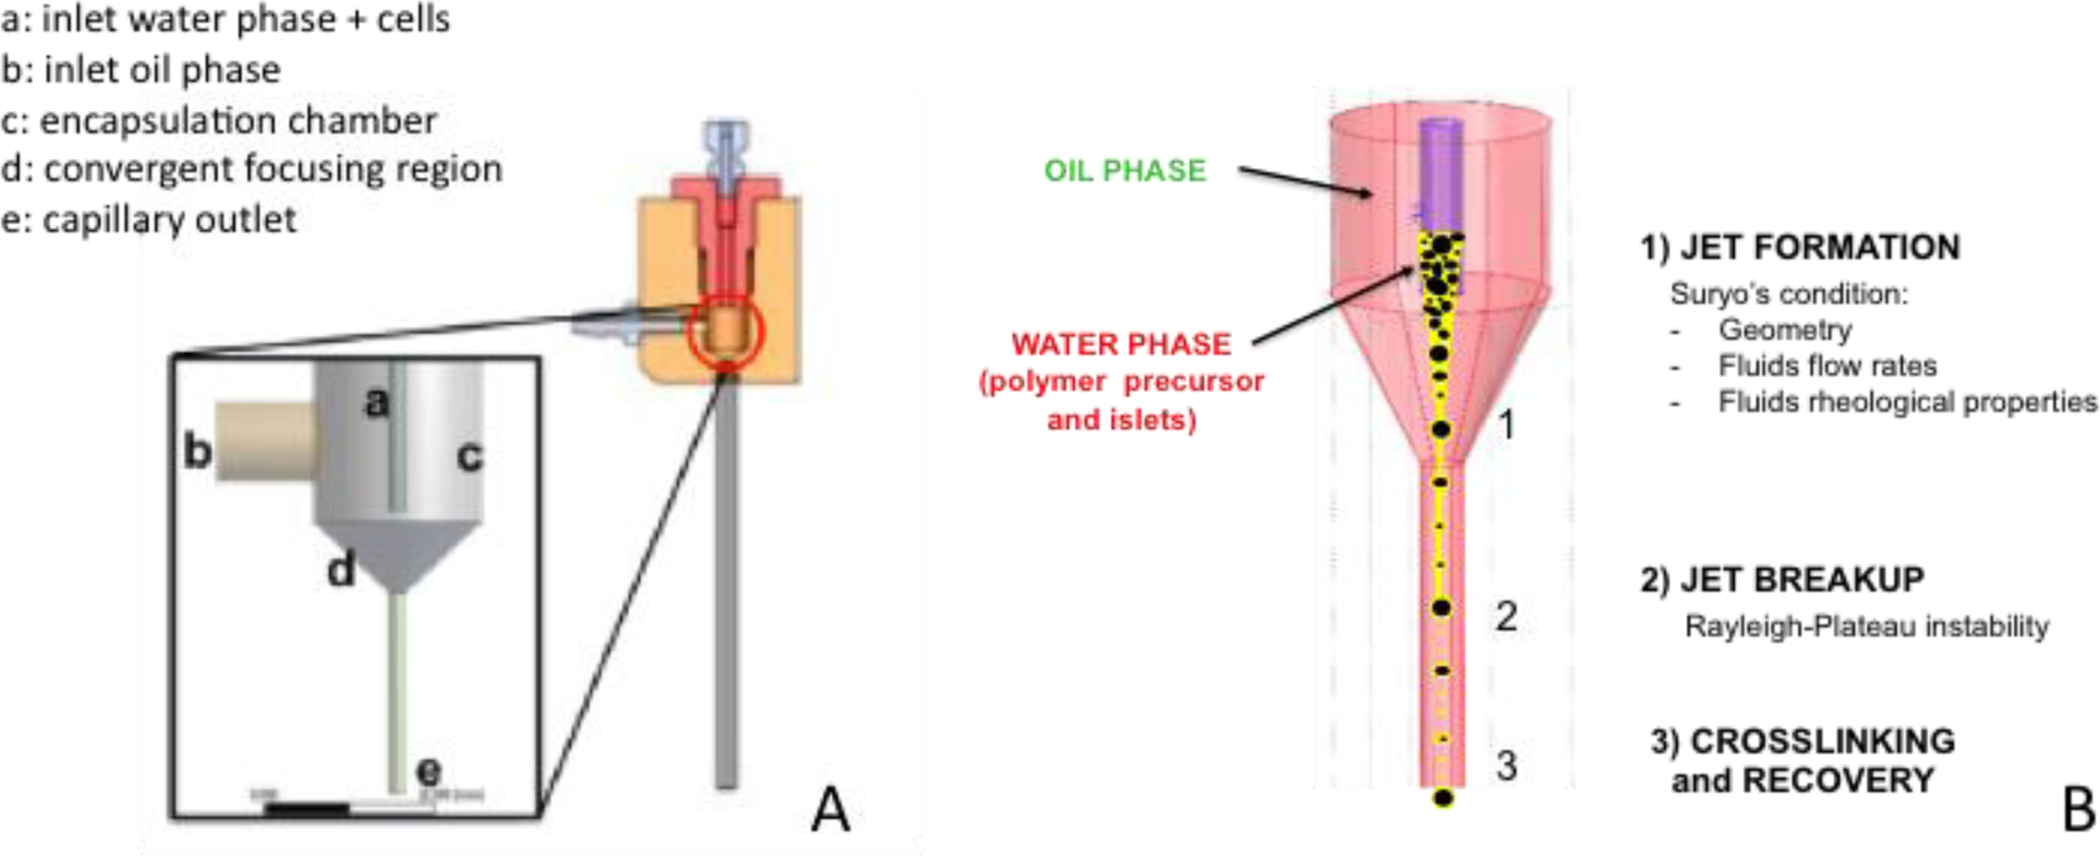
Schematics of the experimental microencapsulation device (A) and of the CC process (B), consisting of 1) jet formation, 2) jet break-up and 3) crosslinking of the encapsulating thin film polymer and recovery of the encapsulated islets.
The experimental value of the interfacial tension between the two immiscible phases is 0.005 N/m. The conical convergent region acts as an external physical constraint which focuses the oil phase and induces the dripping-to-jetting transition of the water phase. Consequently, a jet of water solution generates into the oil phase and eventually breaks up into droplets. Following droplet formation, the microfluidic pattern within the downstream capillary allows the formation of a thin polymeric coating around the cells (Fig. 1B), which eventually undergoes a pH-driven cross-linking thanks to the presence, in the collection vessel, of a pH-adjusting agent, as described in [13]. Even in case of high cell density, the islets align at the centre of the jet and maintain their separation, thus allowing individual islet CC.
Validation of in silico results have been performed by applying the conformal coating procedure to MIN6 insulinoma cells aggregated into 50–200μm diameter clusters using spinner flasks and polystyrene beads (ChromoSphere, ThermoFisher, with nominal diameters: 50, 100, 150, 200, 300, 400 μm) with islet-like diameter distribution [33] as previously reported [7]. For these experiments, optimal conformal coating conditions used were: surface tension γ = 0.005 N/m; water flow rate Qwater = 0.01 ml/min; oil flow rate Qoil = 3.5 ml/min. Both diameter of conformal coated clusters/beads and thickness of polymer coatings have been measured using the image processing software ImageJ.
2.2. Numerical Model
Owing to the problem complexity, a two-dimensional (2D) analysis is performed, in order to simulate the peculiar features and governing phenomena of the CC process while keeping the computational effort low.
By following the system approach [34], the study is carried out by decomposing the phenomena into two sub-phenomena of different complexity and resolution, for which two distinct models are set up:
-
W.
Whole chamber: a low-resolution biphasic model, where the whole longitudinal cross section of the focusing chamber is represented (Fig. 2A); model W explores the capability of SPH to model the dripping-to-jetting transition of the water phase and the jet break-up, without simulating the cellular aggregates; through this model, the sensitivity to the relevant parameters involved in the fluid dynamic process and their effect on droplet formation and characteristics can be analysed;
-
R.
Reduced chamber: a more refined triphasic model of a reduced portion of the device geometry, corresponding to the flow region where jet instability and droplet formation occur (Fig. 2B); here the cellular aggregates are also modelled, focusing the analysis on the CC and cell encapsulation processes.
Fig. 2.
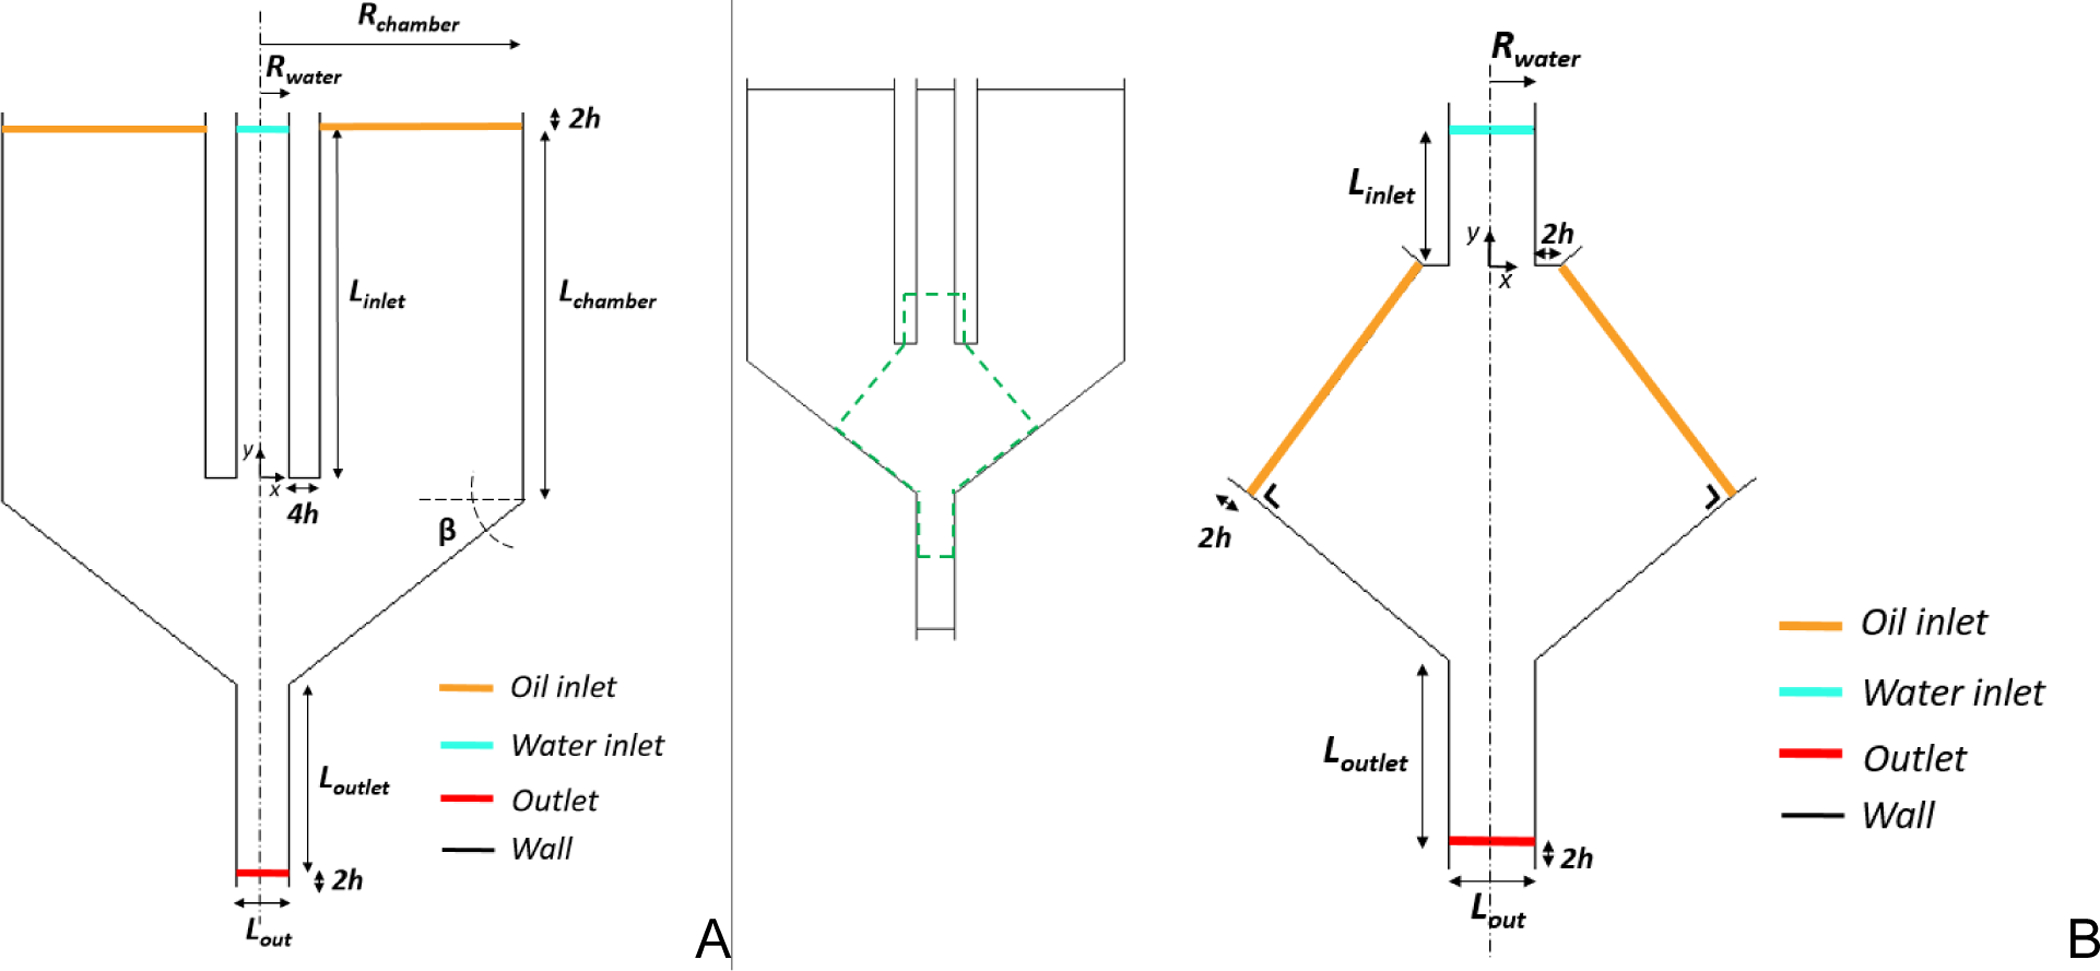
The 2D computational domain of: A) the whole chamber (Model W); B) the reduced domain (Model R). In Model W, the oil inlets were set orthogonal to the chamber convergent cone walls; Model R was cut out from the whole chamber model (green dashed line on top left). Rwater=0.5mm; Rchamber=5mm; Linlet=7.5mm; Lchamber=8mm; β=38.2°; Loutlet=4mm; Lout=1mm.
The different simulations performed with each model have been denoted by the letter corresponding to the considered model followed by the number denoting the significant digit corresponding to the adopted value of viscosity.
2.2.1. Model W: Whole chamber
To define the geometrical model, two main assumptions are introduced: (i) the outlet capillary is shortened from 10 to 4 mm to reduce computational costs; (ii) the oil phase is injected from the upper boundary aligned with the water inflow (Fig. 2A), differently from the experimental device, where the oil phase is injected from a lateral inlet, normal to the longitudinal axis of the chamber (Fig. 1A).
The first assumption seems a reasonable choice because the influence of the capillary length on the droplet formation and islet coating is expected to be negligible. The second assumption is introduced to simplify the description of the inlet flow in the 2D model and is motivated by the observation that, in the physical device, the oil velocity is almost parallel to the water one in the zone of droplet formation.
The water and oil phases are modelled as Newtonian fluids with assigned density and viscosity (ρw = 1080 kg/m3 and μw = 0.00485 Pa·s for the water phase, ρo = 1004 kg/m3 and μo = 1.3 Pa·s for the oil phase, respectively, consistently with those of the fluids employed in the experimental device).
No-slip wall boundary conditions are applied at the chamber walls. It has been observed in the literature that pressure-driven and flow-rate driven two-phase flows behave in a different manner, especially in the context of droplet generation [35]. In accordance with the actual functioning of the experimental device, the simulated two-phase flow is controlled by the assigned flow rate. The inflow and outflow boundary conditions are assigned to the oil and water inlet and outlet by imposing the values reported in Table 1 to the fluid particles entering and exiting the computational domain. The inflow velocity values are set according to the experimental volumetric flow rates used for CC. A constant pressure at the outlet, higher than the ambient pressure, is imposed to avoid negative pressures in the computational domain, which can give rise to a numerical instability of the SPH scheme (tensile instability). The boundary values of the piezometric head at the inlet and of velocity at the outlet are redundant but are nevertheless assigned to the particles in the external buffer layers to ensure unidirectional flow.
Tab. 1.
Boundary conditions for water and oil phases in Model W.
| Boundary condition | x-velocity [m/s] | y-velocity [m/s] | Piezometric head [m] | Pressure [Pa] |
|---|---|---|---|---|
| Water inflow | 0.0 | −2.12· 10−4 | 22.75· 10−3 | - |
| Oil inflow | 0.0 | −7.50· 10−4 | 22.60· 10−3 | - |
| Outflow | 0.0 | −8.75· 10−3 | - | 140 |
The initial velocity magnitude for water is set equal to the inflow water velocity vy,w = −2.12·10−3 m/s, while the initial velocity of the oil phase is set to vy,o = −10·10−3 m/s, slightly higher than the oil outflow velocity, to avoid fluid particle accumulation in the initial steps of the time-dependent transient simulation. The pressure field is initialized by assuming a piezometric head equal to q = 8.5·10−3 m with respect to the reference system.
The first set of simulations with Model W are performed to identify optimal values of the relevant model parameters, as well as to evaluate the effect of surface tension in terms of jet formation and breaking. Indeed, surface tension effects at the interface between the two fluid phases play a major role in determining jet break-up into droplets. A proper simulation of surface tension effects is therefore crucial for a reliable representation of the physics of the investigated process.
2.2.2. Model R: Reduced domain
The suitable values of numerical parameters and input boundary conditions identified through Model W are applied to the simulations on the reduced computational domain of Model R. The reduction of the computational domain allows particle resolution to be increased while maintaining an acceptable computational effort, thus enhancing the development of a triphasic model (water phase, oil phase and islets) and the simulation of the small cellular aggregates carried by the water phase. The inflow velocity and pressure distributions along the oil inlet boundaries are set according to the flow and pressure fields calculated in Model W.
The third solid phase reproducing the islets of Langerhans is also introduced in Model R. The cellular clusters are initially suspended inside the water phase to flow through the inlet capillary of the microencapsulation device. Density and viscosity of the islet phase are set to 1100 kg/m3 and 0.00485 Pa·s, respectively, based on experimental data
2.3. Governing Equations of the SPH Model
The Smoothed Particle Hydrodynamics (SPH) method was originally developed as a probabilistic model for simulating astrophysical problems [36–37] and was then applied to fluid [38] and continuum solid mechanics.
SPH belongs to the numerical meshless particle methods [39], which are suitable to deal with free-surface flows, moving interfaces, large displacements and material fragmentation [40]. In SPH, the liquid volume is discretized by a set of particles of constant mass, while the partial differential equations of motion are discretized through an interpolating kernel W function, which is an even, central function defined over a circular compact support. The radius of the compact support is proportional to the so-called smoothing length h, thus defining the length scale of the interaction between each particle and its closest neighbours; here h was always chosen to be 1.5 times the initial particle spacing dSPH. The approximation of the Navier-Stokes equations of motion for each particle i is therefore obtained by using the information from its N neighbours through a particle approximation [41]:
| (1) |
where m, p and ρ denote the particle mass, pressure and density, respectively; g is the gravitational acceleration, τ the viscous stress tensor and u the particle velocity. The artificial viscosity term Πij proposed by Monaghan [38] is added for numerical stabilization.
In (1), is the gradient of the adopted C2 Wendland kernel function [42], centered on particle i, evaluated at the relative distance rij and renormalized in order to enforce consistency on the first derivatives for the computation of velocity divergence and viscous stress terms [43].
Eqs. (1) are valid in the hypothesis of a weakly compressible fluid and are completed by the following linear equation of state, based on the assumption of small density oscillations:
| (5) |
where p0 and ρ0 are the reference pressure and density, respectively, and cs is an artificial speed of sound. The hypothesis of a weakly compressible fluid implies that the local Mach number for every fluid particle in the domain remains sufficiently small (of the order 0.1, i.e. cs must be at least ten times the maximum local liquid velocity), in order to bound the relative density variation in the liquid to 1% [38].
Several formulations may be applied to obtain the SPH discretization of the second order viscosity force term leading to different levels of accuracy and efficiency in viscosity dominated flows [44]. In this work, the viscous force term is computed directly as the divergence of the stress tensor, which in turn is derived from an accurate estimate of the rate-of strain tensor obtained from the above-cited renormalized SPH approximation.
The term Fis in (1) represents the surface tension force acting on the fluid particle i. This force is computed according to the approach proposed by Adami et al. [45], who introduced a colour function cij equal to 0 when particles i and j belong to the same phase and equal to 1 otherwise. The normal unit vector at the interface can be obtained from the gradient of the colour function at particle i:
| (2) |
The curvature ki of the interface at the position occupied by the particle i can be thus evaluated as:
| (3) |
Finally, the surface tension term in the momentum equation (1) can be calculated after the introduction of the surface tension coefficient γ:
| (4) |
A pressure smoothing procedure is applied at every time step to the difference between the computed local pressure pcomp and hydrostatic pressure [46]:
| (6) |
A periodical procedure for density re-normalization is also adopted to reduce numerical noise and obtain a more regular pressure field [47]. The corrected density is computed for each fluid particle, according to:
| (7) |
where φρ denotes a density smoothing coefficient, whose value is here assumed to be φρ = 0.3.
The semi-discretized system (1) is integrated in time by a 2nd-order two-stage XSPH explicit algorithm [48]. Stability is ensured by the classical Courant condition for convective effects, integrated with the proper stability conditions to consider viscous and surface tension effects, which are predominant in the microfluidic flow here analysed. The time step must therefore satisfy the following inequality:
| (8) |
where CFL is the Courant number, whose value ranged between 0.4 and 0.6 in the different simulations here discussed.
Wall boundary conditions are imposed through the ghost particle technique [49], whose implementation is straightforward when straight boundary sides occur [50–51]: at each time step, the fluid particles within a 2h-distance from the solid boundary are mirrored outside, and proper velocity and pressure values are assigned to obtain the desired Dirichlet or Neumann conditions.
Islets are modelled through an aggregate of SPH fluid particles (with proper density) which have internal rigid constraints to preserve the relative position between particles and the islet shape, and hence move through a rigid translation with a mass-weighted velocity. The following strategy is adopted: eqs. (1) are solved at each iteration for all the SPH particles, including those forming the islet-phase, then mass-weighted position xG isl and velocity vG isl of the centre of mass are computed for each aggregate, to move it consistently with the surrounding flow field:
| (9) |
In (9) misl is the mass of the considered cellular aggregate, rj and vj are respectively the position vector and velocity of each of the M particles in the aggregate. Rotation of the aggregates is neglected.
Since the particle aggregate representing the islet phase is non-deformable, the surface tension between each liquid phase and the islet phase is not considered: the value of the surface tension coefficient γ adopted in the simulations is referred to the water-oil interface only.
3. Results and Discussion
In the following section, the relevant results pertaining to both models are discussed. We chose to perform analysis of the effects of surface tension on the CC product to demonstrate sensitivity of the model to the modification of such a relevant parameter driving the microencapsulation process. The influence of the surface tension coefficient γ is first verified in Model W, which provides also the correct boundary conditions for the detailed Model R.
It must be noted that the high viscosity values and the small smoothing lengths h here adopted (in the range of 75–150 μm) led to small values of the explicit time step, according to the stability condition (8), eventually resulting in long computational times, which limited the achievable refinement of the particle resolution.
3.1. Numerical results of jet formation and breaking (Model W)
Two-phase simulations of the whole chamber geometry are run with different values of the surface tension coefficient between oil and water (Table 2), in order to investigate the effect of surface tension on the formation and breaking of the jet within the microencapsulation device. The presence of the cellular aggregates (solid phase) is neglected at this stage. The cone length is defined as the distance from the end of the inlet port and the position of the jet break-up evaluated along the longitudinal direction of the stream; the cone width is conventionally defined here as the width of the coherent water jet at 2/3 of its length.
Tab. 2.
Summary of the relevant results for Model W simulations with different values of surface tension (γ).
| Test Case | γ [N/m] | tbreak [s] | Cone length [mm] | Cone width [μm] | Average droplet diameter [μm] |
|---|---|---|---|---|---|
| W0 | 0.000 | 2.45 | 0.98 | 216 | - |
| W1 | 0.001 | 3.00 | 1.22 | 221 | 122 |
| W5 | 0.005 | 4.00 | 2.26 | 322 | 226 |
The domain of Model W is discretized by 9600 SPH particles (12000 considering also the boundary particles) and is shown in Figure 3A.
Fig. 3.
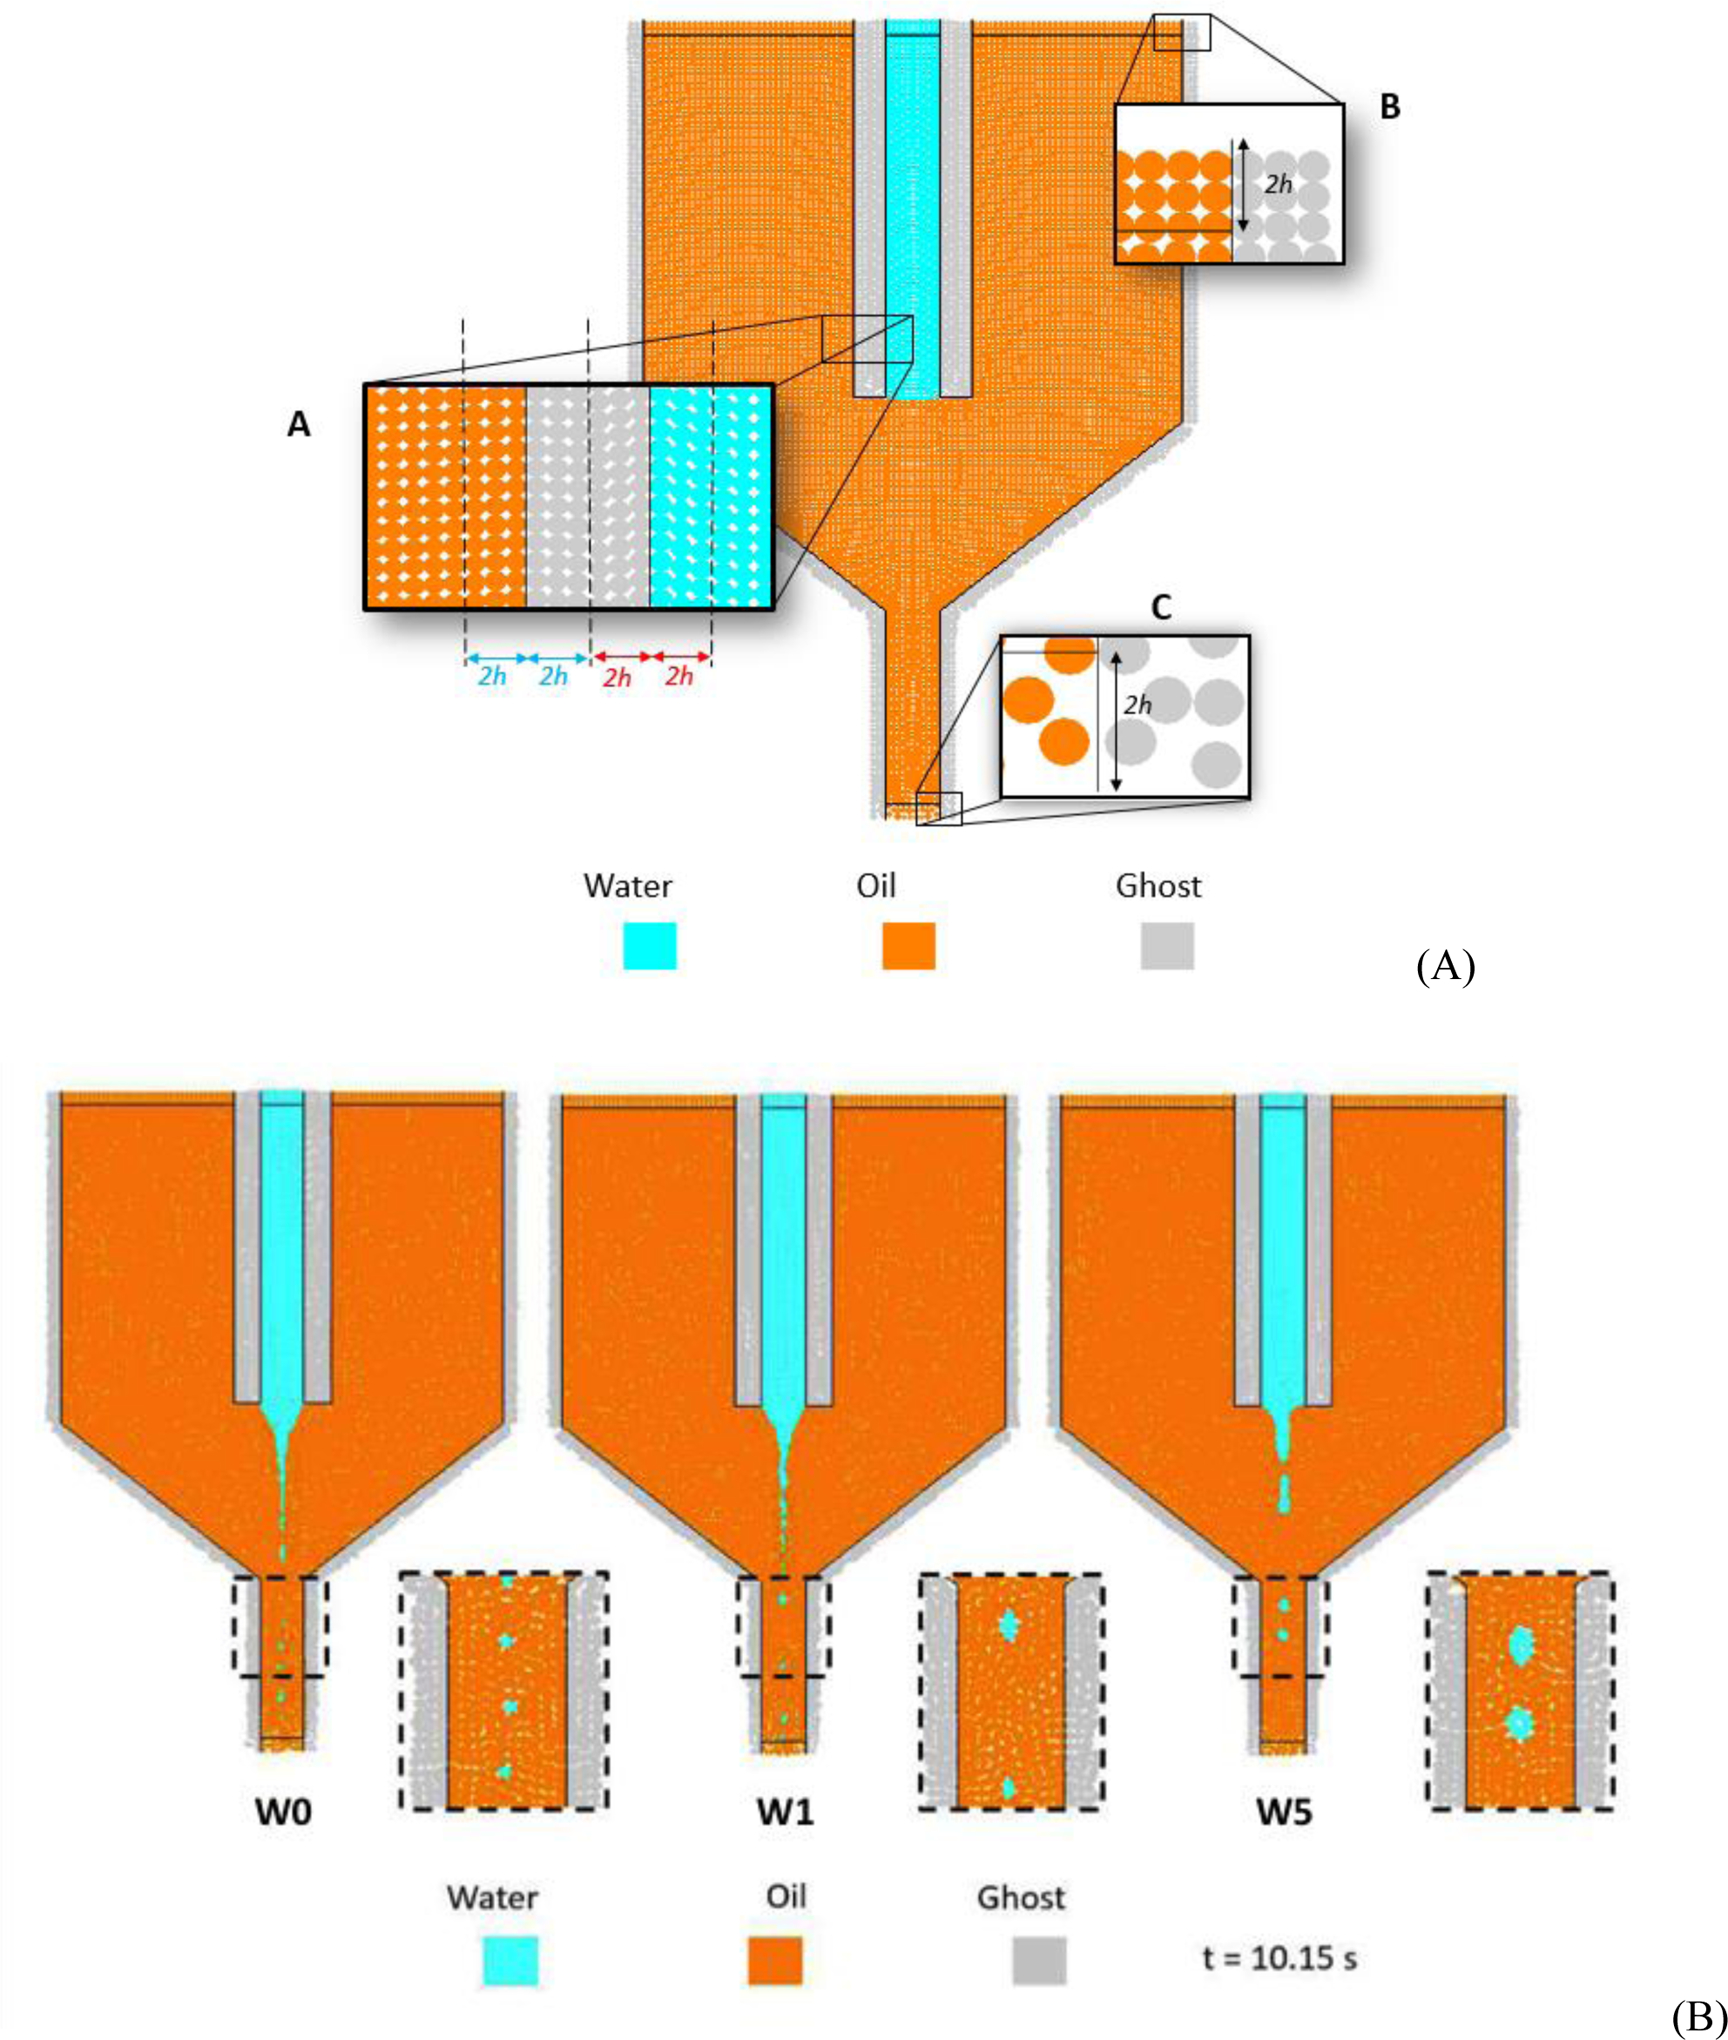
(A) Disctretized 2D computational domain of Model W; (B) Numerical results of Model W after a simulated time t = 10.15 s. W0: γ = 0 N/m, W1: γ = 0.001 N/m, W5: γ = 0.005 N/m.
According to the obtained results, varying γ mainly affects four fluid dynamics-related aspects: (i) the water jet breaks at different simulated times tbreak and, in particular, the higher the value of γ, the later the jet breaks; (ii) interfacial tension influences the length of the jet before it breaks up: specifically, the higher the value of γ, the longer the jet at the instant of first rupture; (iii) surface tension influences the width and shape of the jet, being responsible for a thicker instability cone; (iv) surface tension has an effect on droplets dimension: the higher γ, the higher the average droplet diameter. These qualitative considerations are supported by data reported in Table 2. A visual comparison of the different simulated jets conditions at the same time is shown in Figure 3B.
The highest tested value (γ = 0.005 N/m) corresponds to the experimental value assumed for the CC encapsulation process. Remarkably, numerical simulations performed with γ = 0.005 N/m best match the experimental results in terms of droplet dimensions, which are indeed comparable to the size of the experimentally coated aggregates. In particular, the droplets simulated in the model have a diameter in the range 100–300 μm vs. the 50–350 μm experimental range for islets.
In the test case W0 each droplet is a single-particle domain and, in the immiscible limit (γ = 0.005 N/m), this discontinuity in the lower part of the jet may be reasonably interpreted as a jet thinner than the particle size. For this reason, it can be concluded that the jet beak-up is in fact a numerical artefact due to the poor resolution of the thin jet. In some cases, jets formed in miscible core-annular flow may destabilize into shapes of variable thickness [52], but this phenomenon is not related with surface tension. It is worth nothing that standard SPH formulation of the momentum balance equation in the second of Eqs. (1) produces fictitious surface tension effects [53]. Anyway, a higher particle resolution would be required to investigate possible effects of such a numerical surface tension contribution to the jet break-up in the immiscible limit.
The flow fields obtained from simulation W5, i.e. with γ = 0.005 N/m, (Fig. 4) yield the velocity and pressure profiles along the boundary lines of Model R; these profiles do not vary significantly throughout the whole simulation, justifying the use of their final values as steady inflow boundary conditions for Model R.
Fig. 4.
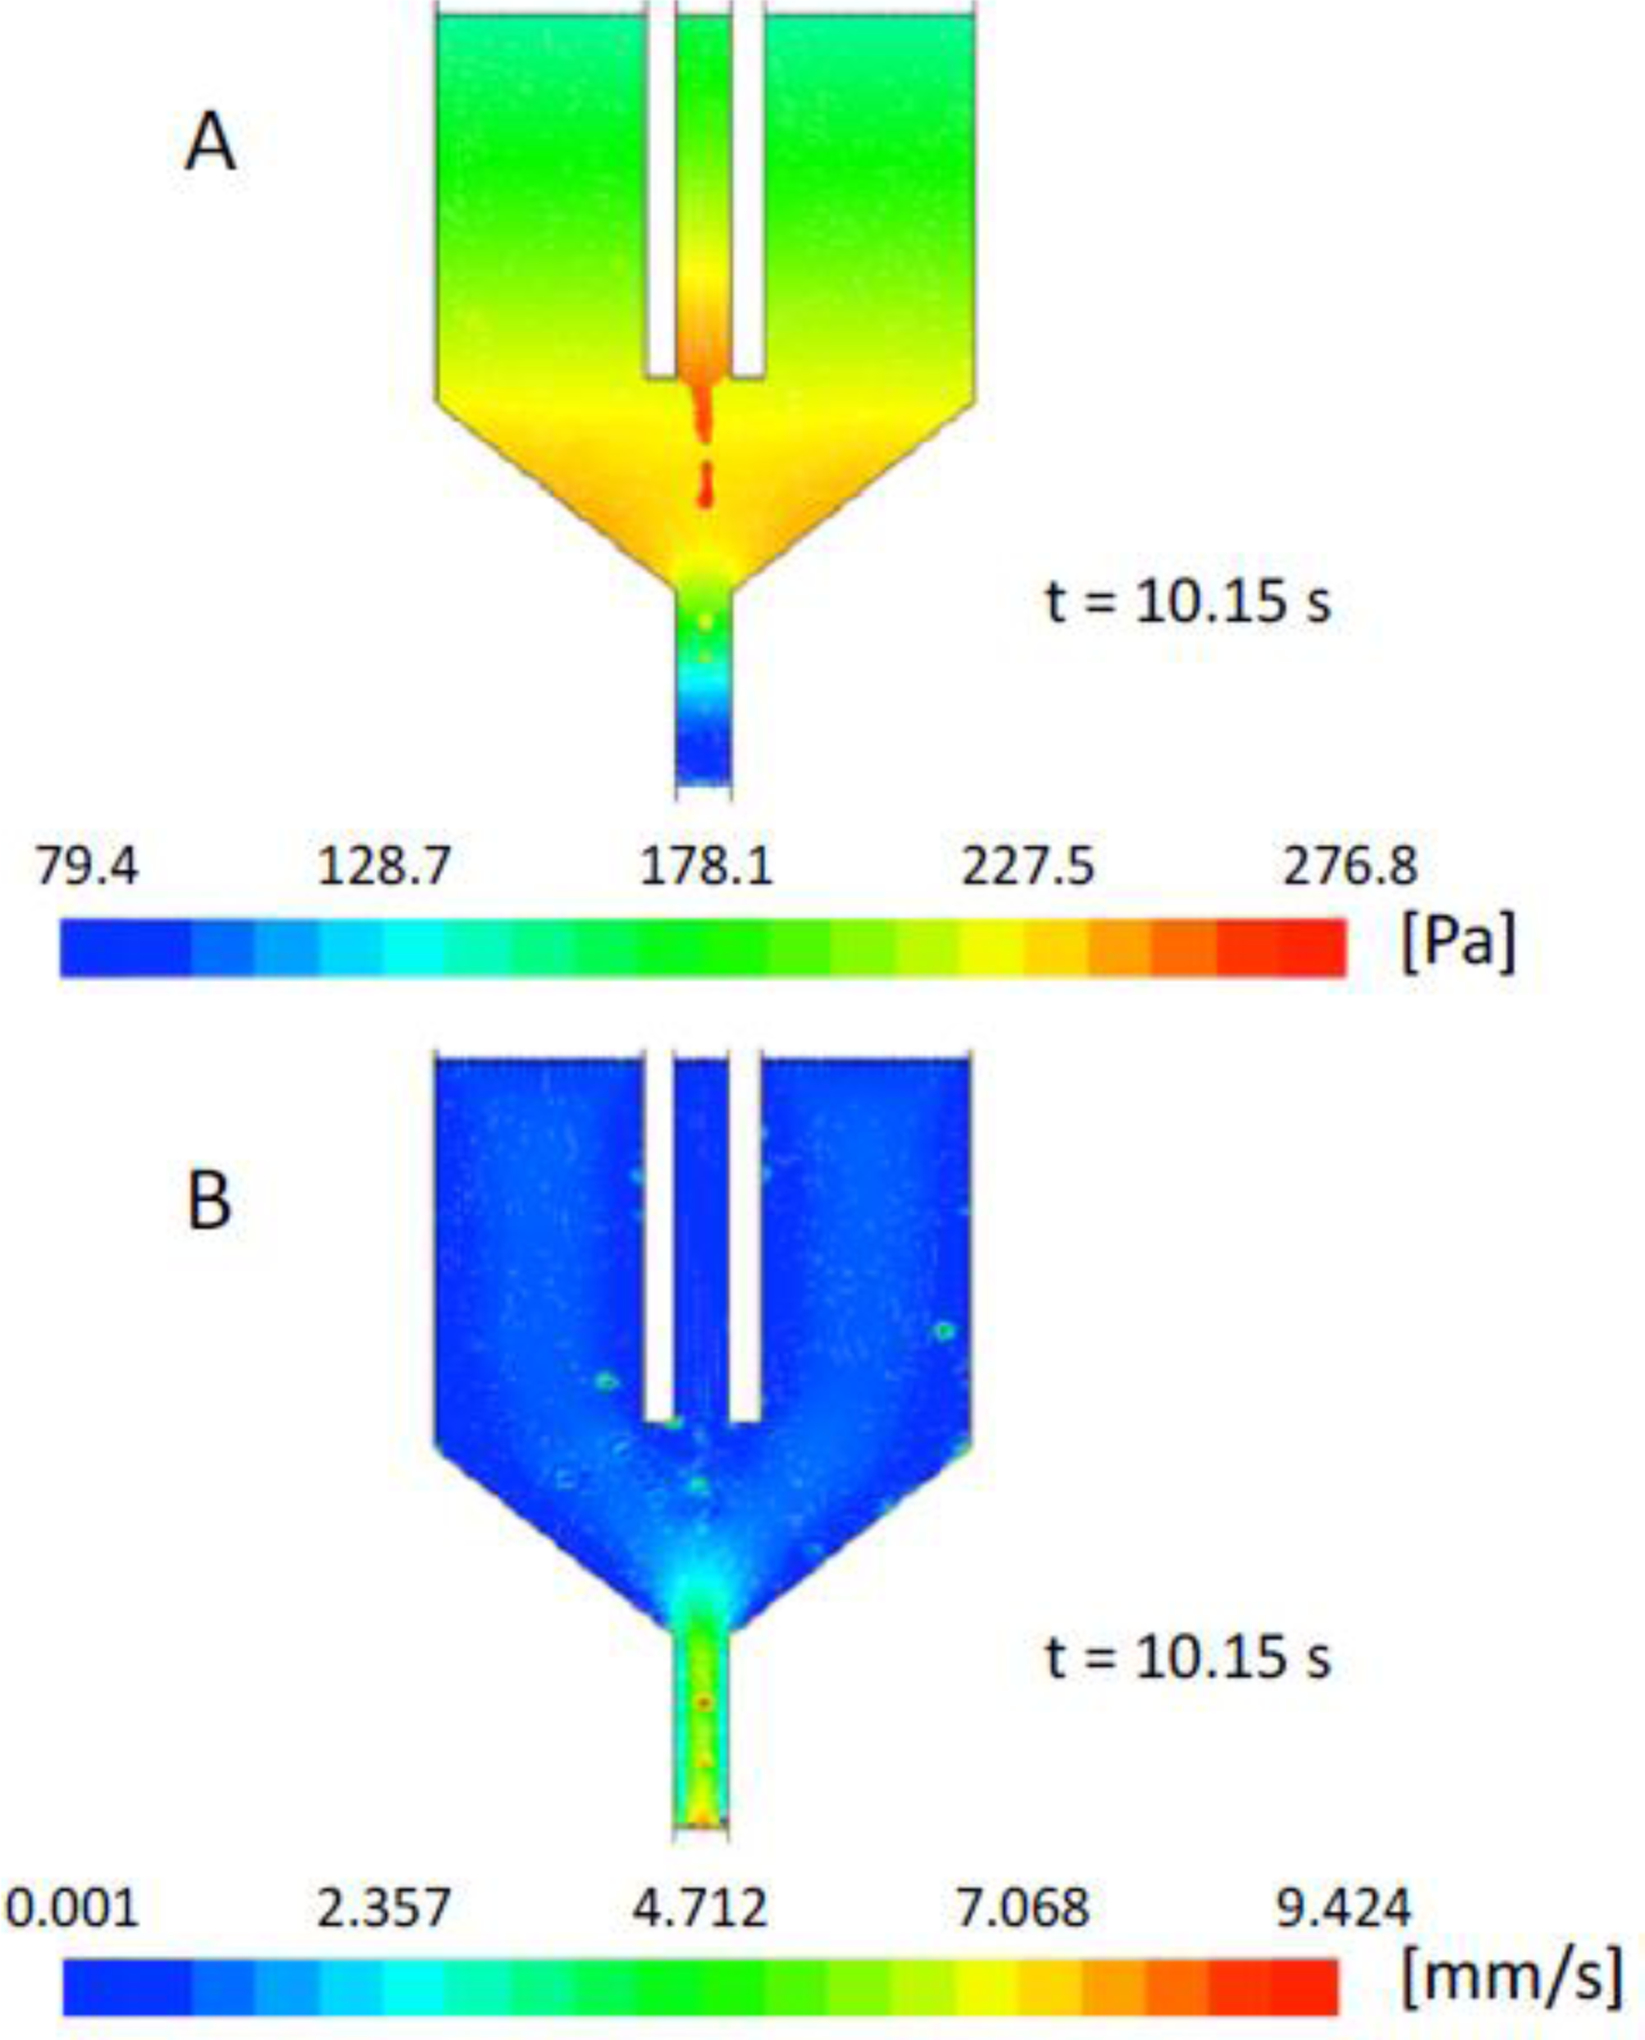
Color maps of (A) pressure and (B) velocity of both phases in the whole chamber simulation with γ = 0.005 N/m at t = 10.15 s.
As expected from theoretical considerations, surface tension determines a pressure increase in the water jet and in the derived droplets. As far as the velocity map is concerned, the velocity of both phases assumes higher values in the outlet capillary, where the channel diameter is smaller.
3.2. Numerical results of islet microencapsulation (Model R)
Owing to the smaller size of the computational domain in Model R, the number of SPH particles is reduced by a factor 5, while the total CPU time is reduced by 6 times.
Goals of the biphasic simulations with Model R are: (i) to test the feasibility of modelling the formation of the instability cone, the break-up of the water jet and the droplet formation with this geometrical configuration, and (ii) to verify the coherence of the numerical results with those obtained with Model W, thus checking that the surface tension effects are independent from the numerical resolution. Two values of γ are considered: γ = 0.001 N/m (simulation R1) and γ = 0.005 N/m (simulation R5).
The results of the numerical simulations obtained with Model R are shown in Figure 5.
Fig. 5.
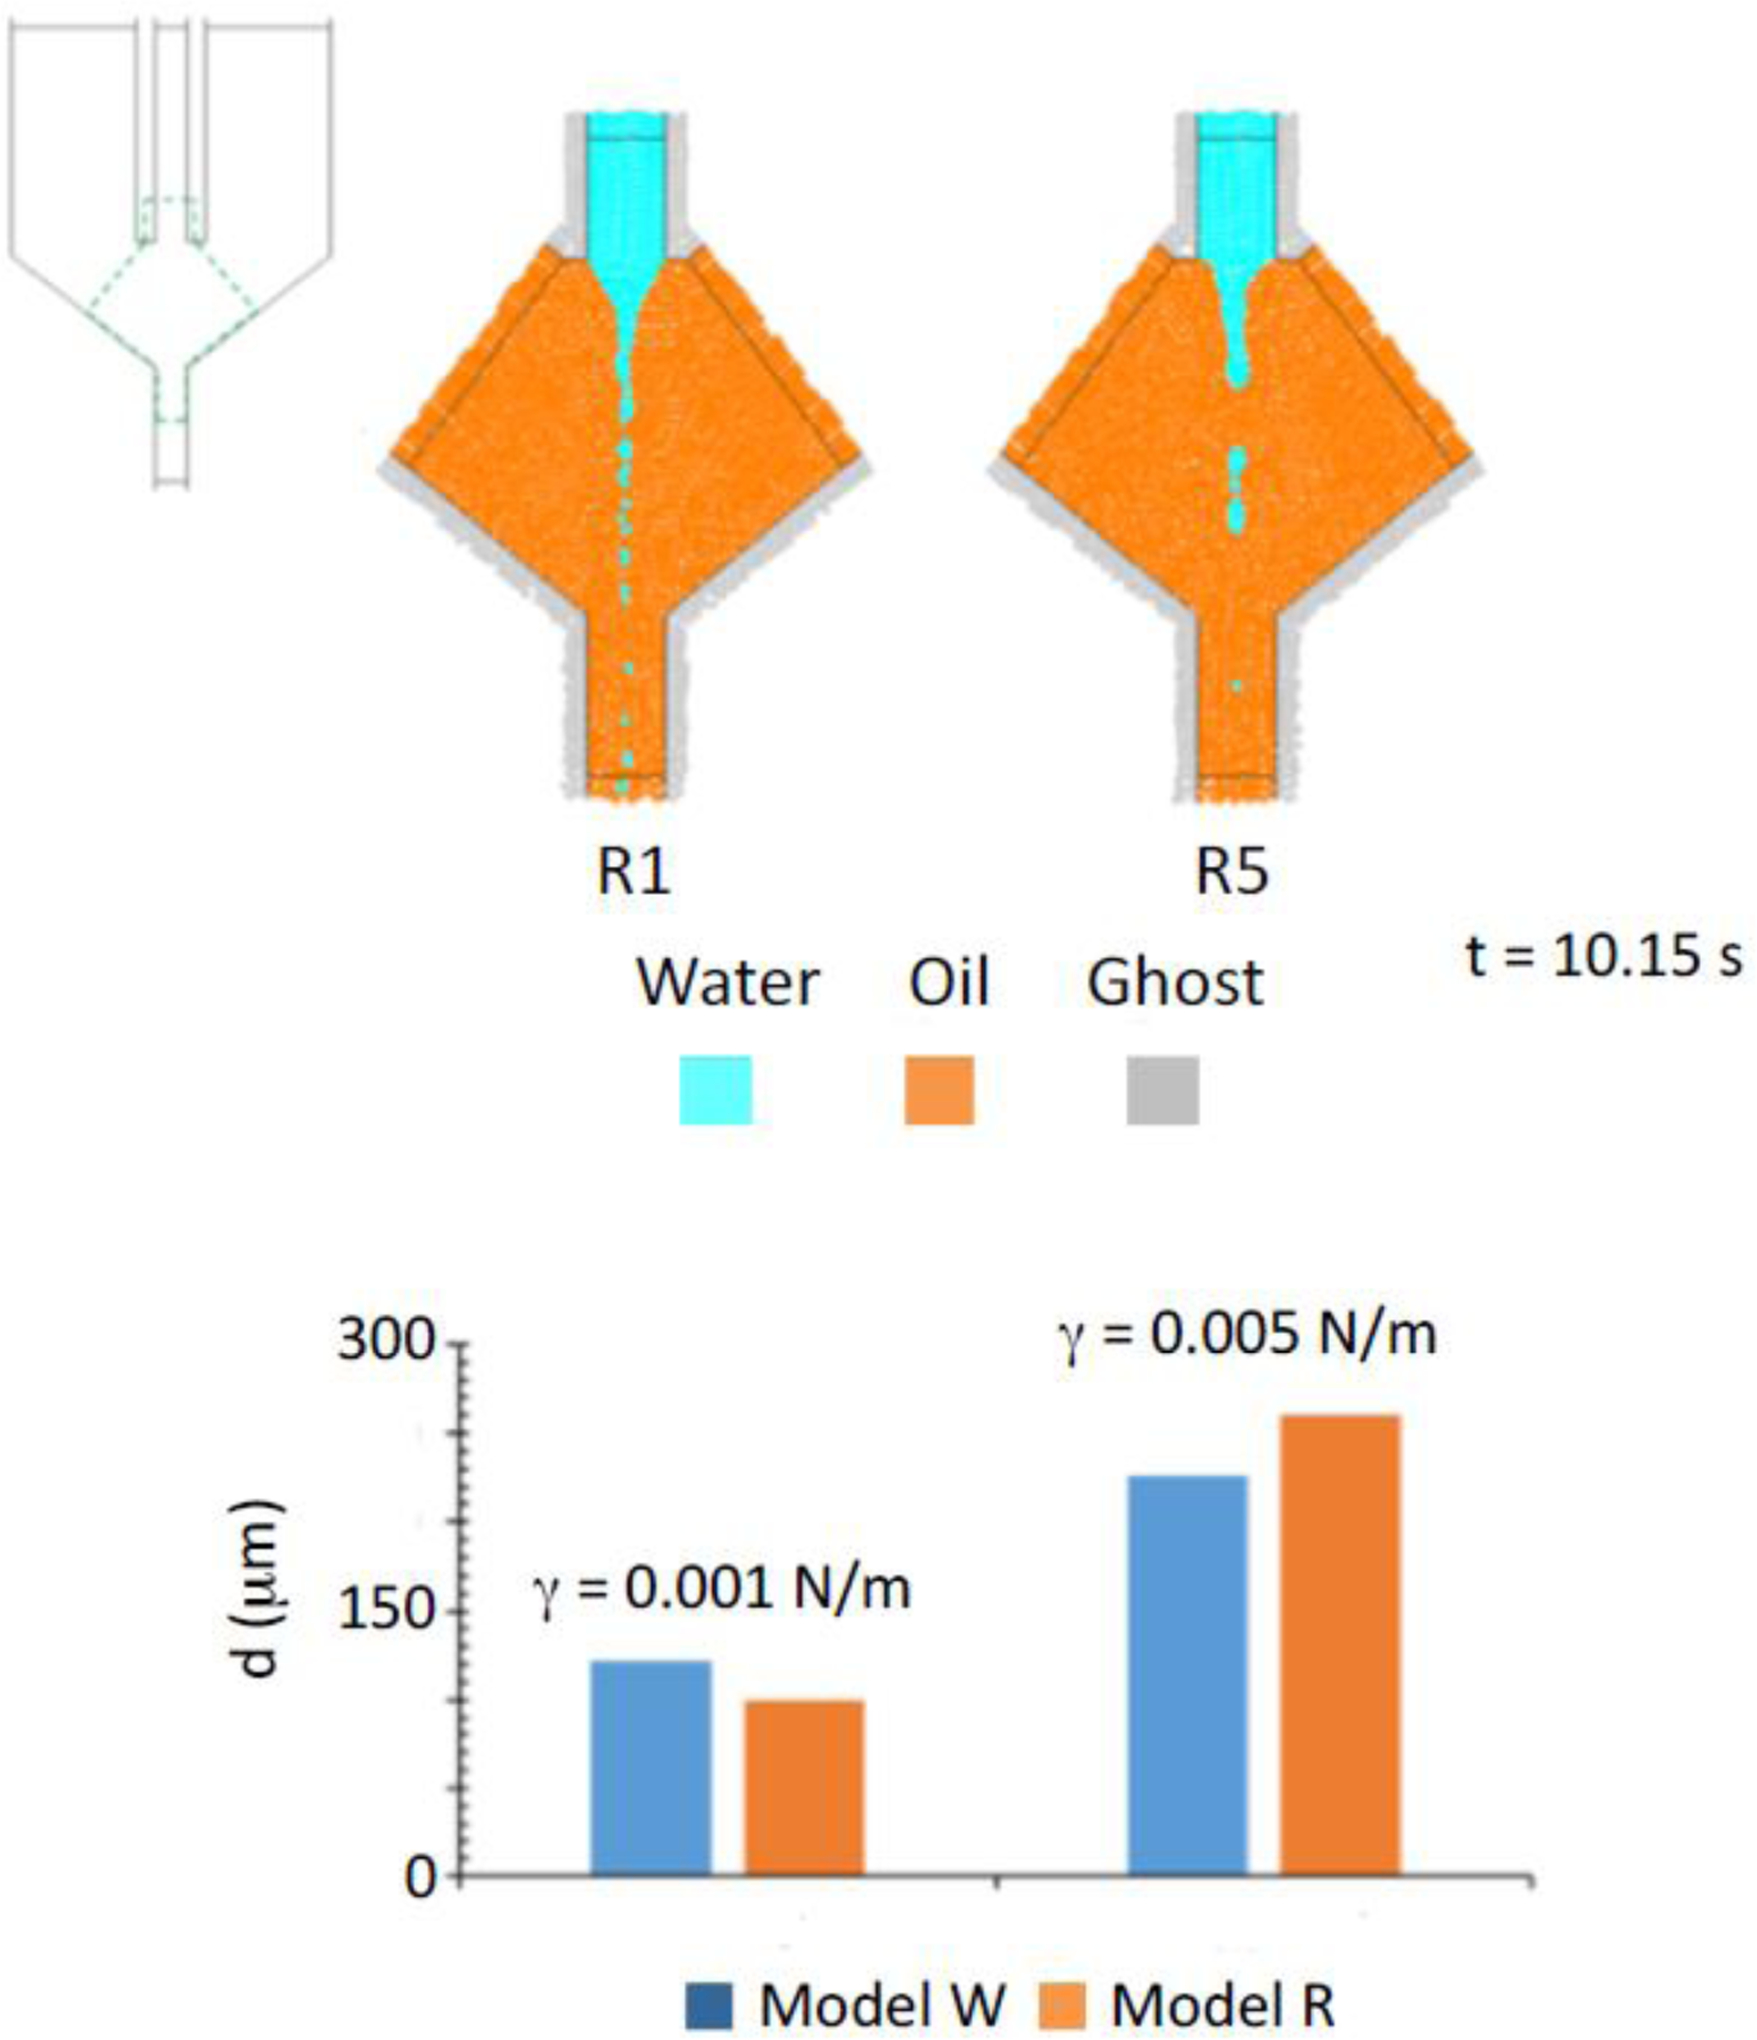
Water and oil particles distribution in the biphasic simulations of Model R at t=10.15 s and γ = 0.001 N/m (R1) or γ = 0.005 N/m (R5). Panel below: comparison between Model W and Model R for droplet size as a function of surface tension.
According to our results, Model R allowed to properly account for the phenomena of cone instability, formation and breaking of the jet, as well as droplet formation. Due to insufficient resolution, we were able to only quantitatively characterize droplet size: in detail, the average droplet diameters are 100 μm and 260 μm for simulations R1 and R5, respectively, resulting in a 22% and 16% difference with the corresponding simulations in Model W. Similarly, the relevant physical features of the process are preserved in Model R, showing that the different SPH particle size does not influence the surface tension effect.
Figure 6 shows the results of two preliminary three-phase simulations run with a SPH-particle resolution dSPH = 100 μm: the simulations are run setting the islet diameter (dislet) equal to 200 μm or 100 μm, respectively.
Fig. 6.
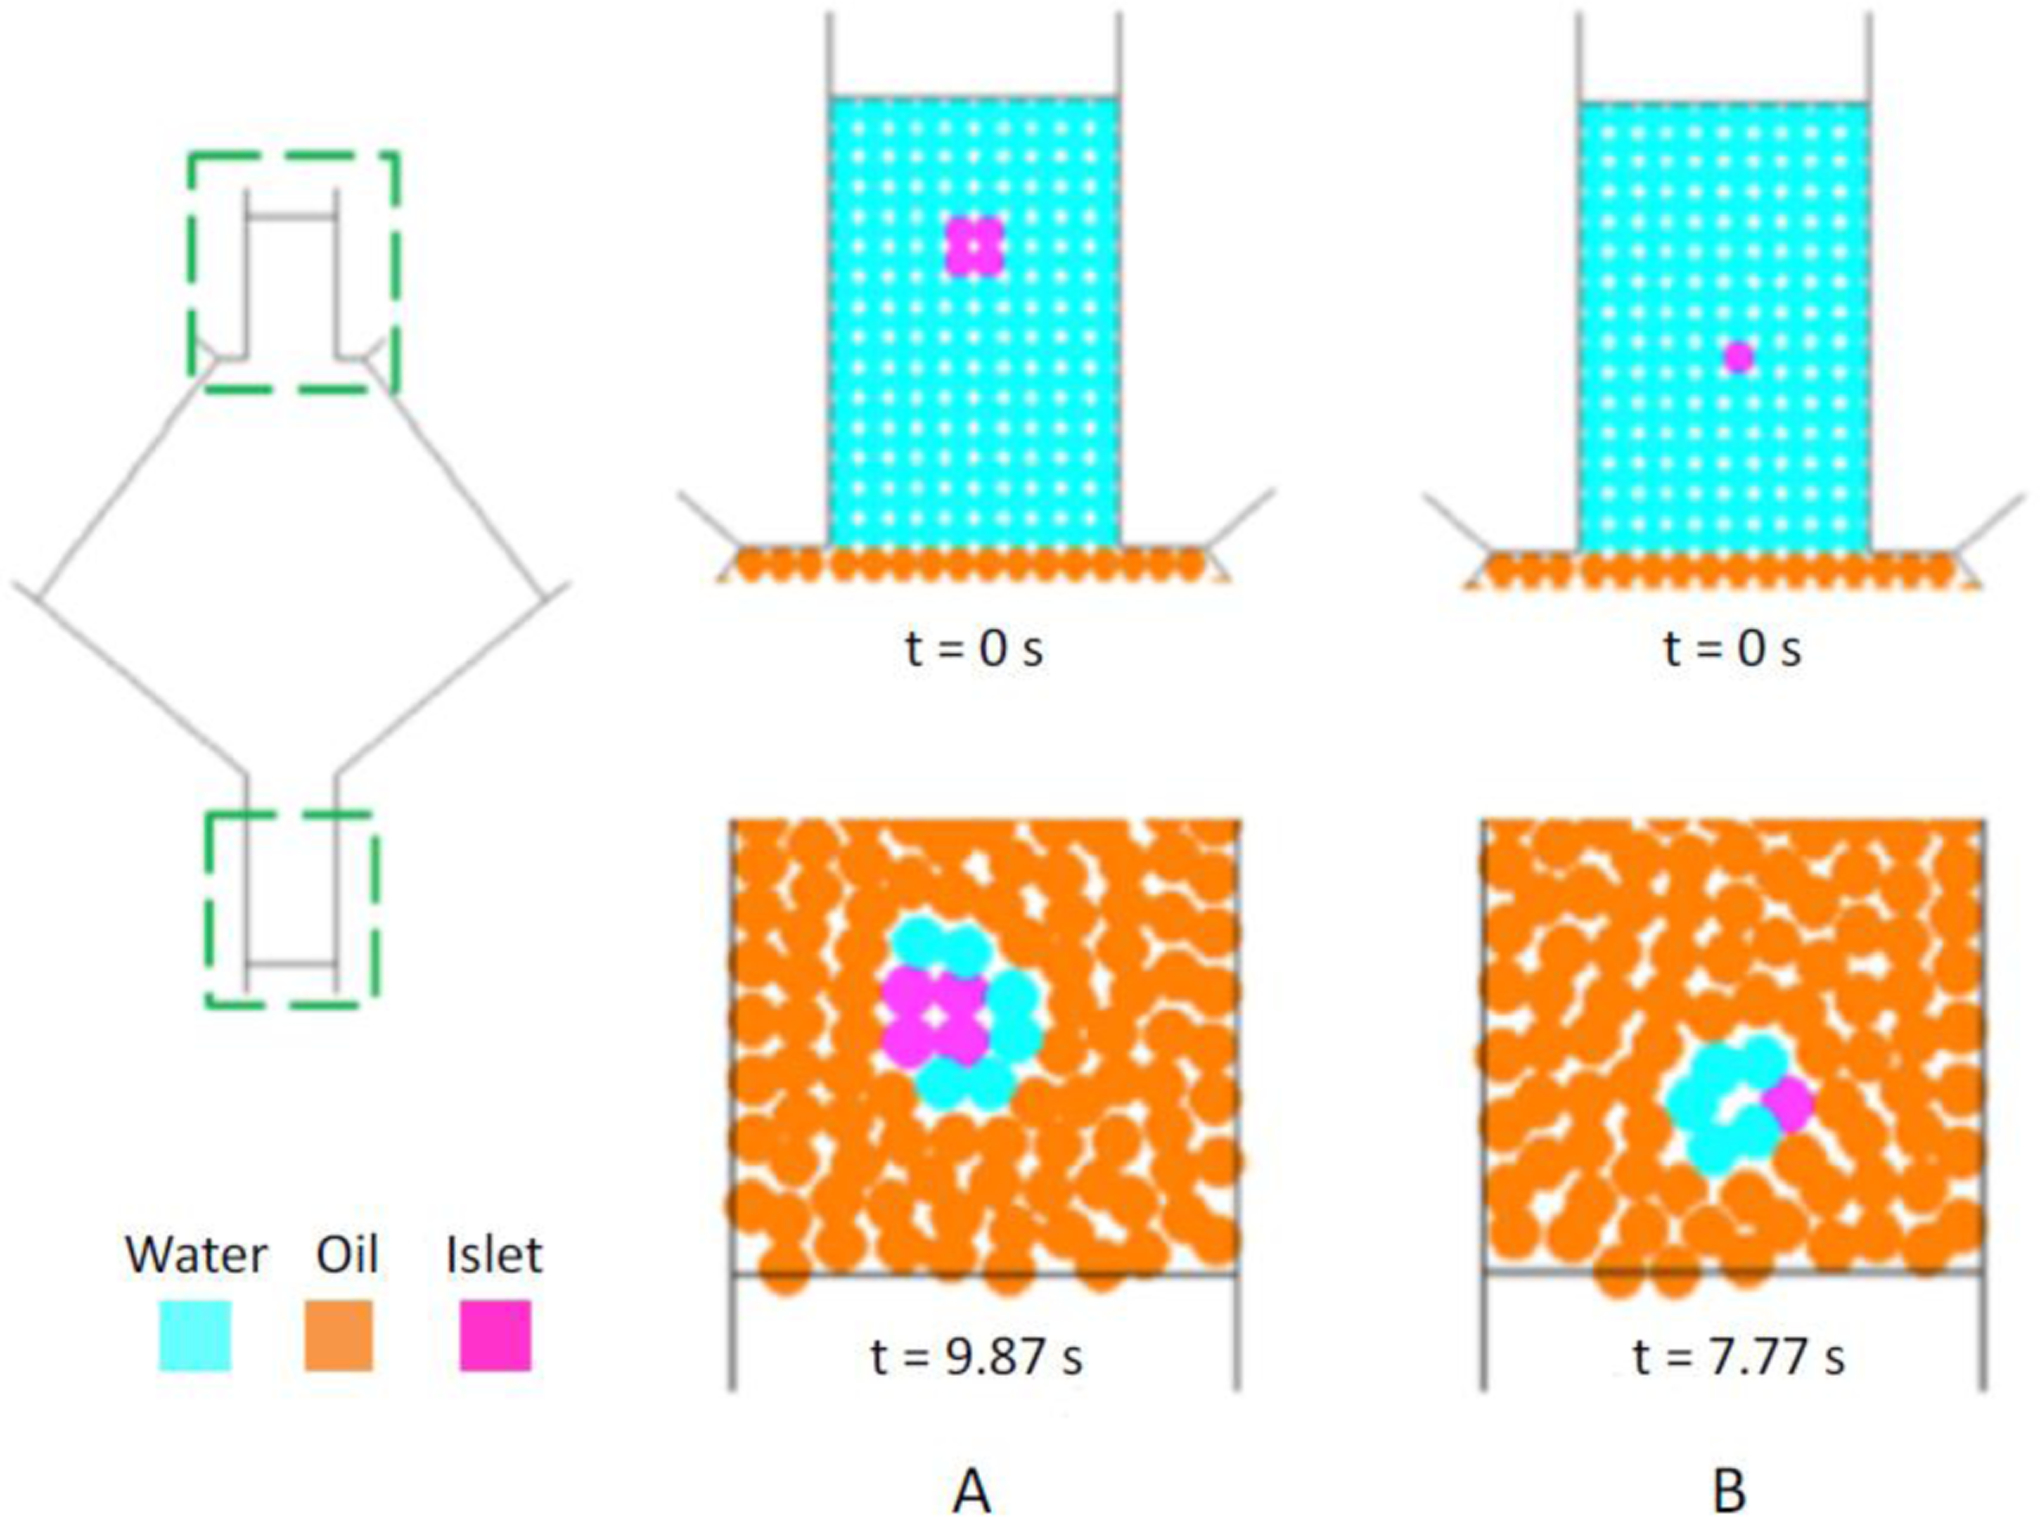
Initial condition and particle distribution at the bottom of the capillary outlet with dSPH=100 μm. A: dislet=200 μm, B: dislet=100 μm.
The results in the outlet capillary pertain to different simulation times, since the initial location of islets in the inlet conduit is different in the two simulations and the aggregates do not exit the channel simultaneously. It is possible to notice that in none of the cases a complete and continuous coating surrounding the islet has been obtained, likely due to insufficient particle resolution. For this reason, qualitative analysis of the results related to the obtained coating can be provided. In fact, the experimental coating thickness ranges between 10–30 μm, i.e., approximately 10-to-3-fold lower than the simulated dSPH (100 μm), meaning that a thinner coating thickness cannot be adequately resolved by the numerical method. In other words, the choice of dSPH = 100 μm results in an under-resolved aggregate (islet with coating), although it has initially been selected as a first attempt to match a proper trade-off between an adequate numerical resolution and an acceptable computational cost.
Simulations with a higher resolution (dSPH = 50 μm) require 7200 SPH particles and an increased computational time (approximately 7 times higher), yielding the same results in terms of water jet break-up and droplet formation. With this finer resolution, a wider range of islet diameters and corresponding geometries can be simulated, as shown in Figure 7. The diameters of the simulated cellular aggregates span a range of 50–200 μm, corresponding approximately to the lower part of the experimentally observed size distribution (dislet = 50–350 μm) [13]. A single islet, initially located at y = 0.75 mm along the axis of the inlet capillary, is considered in each simulation.
Fig. 7.
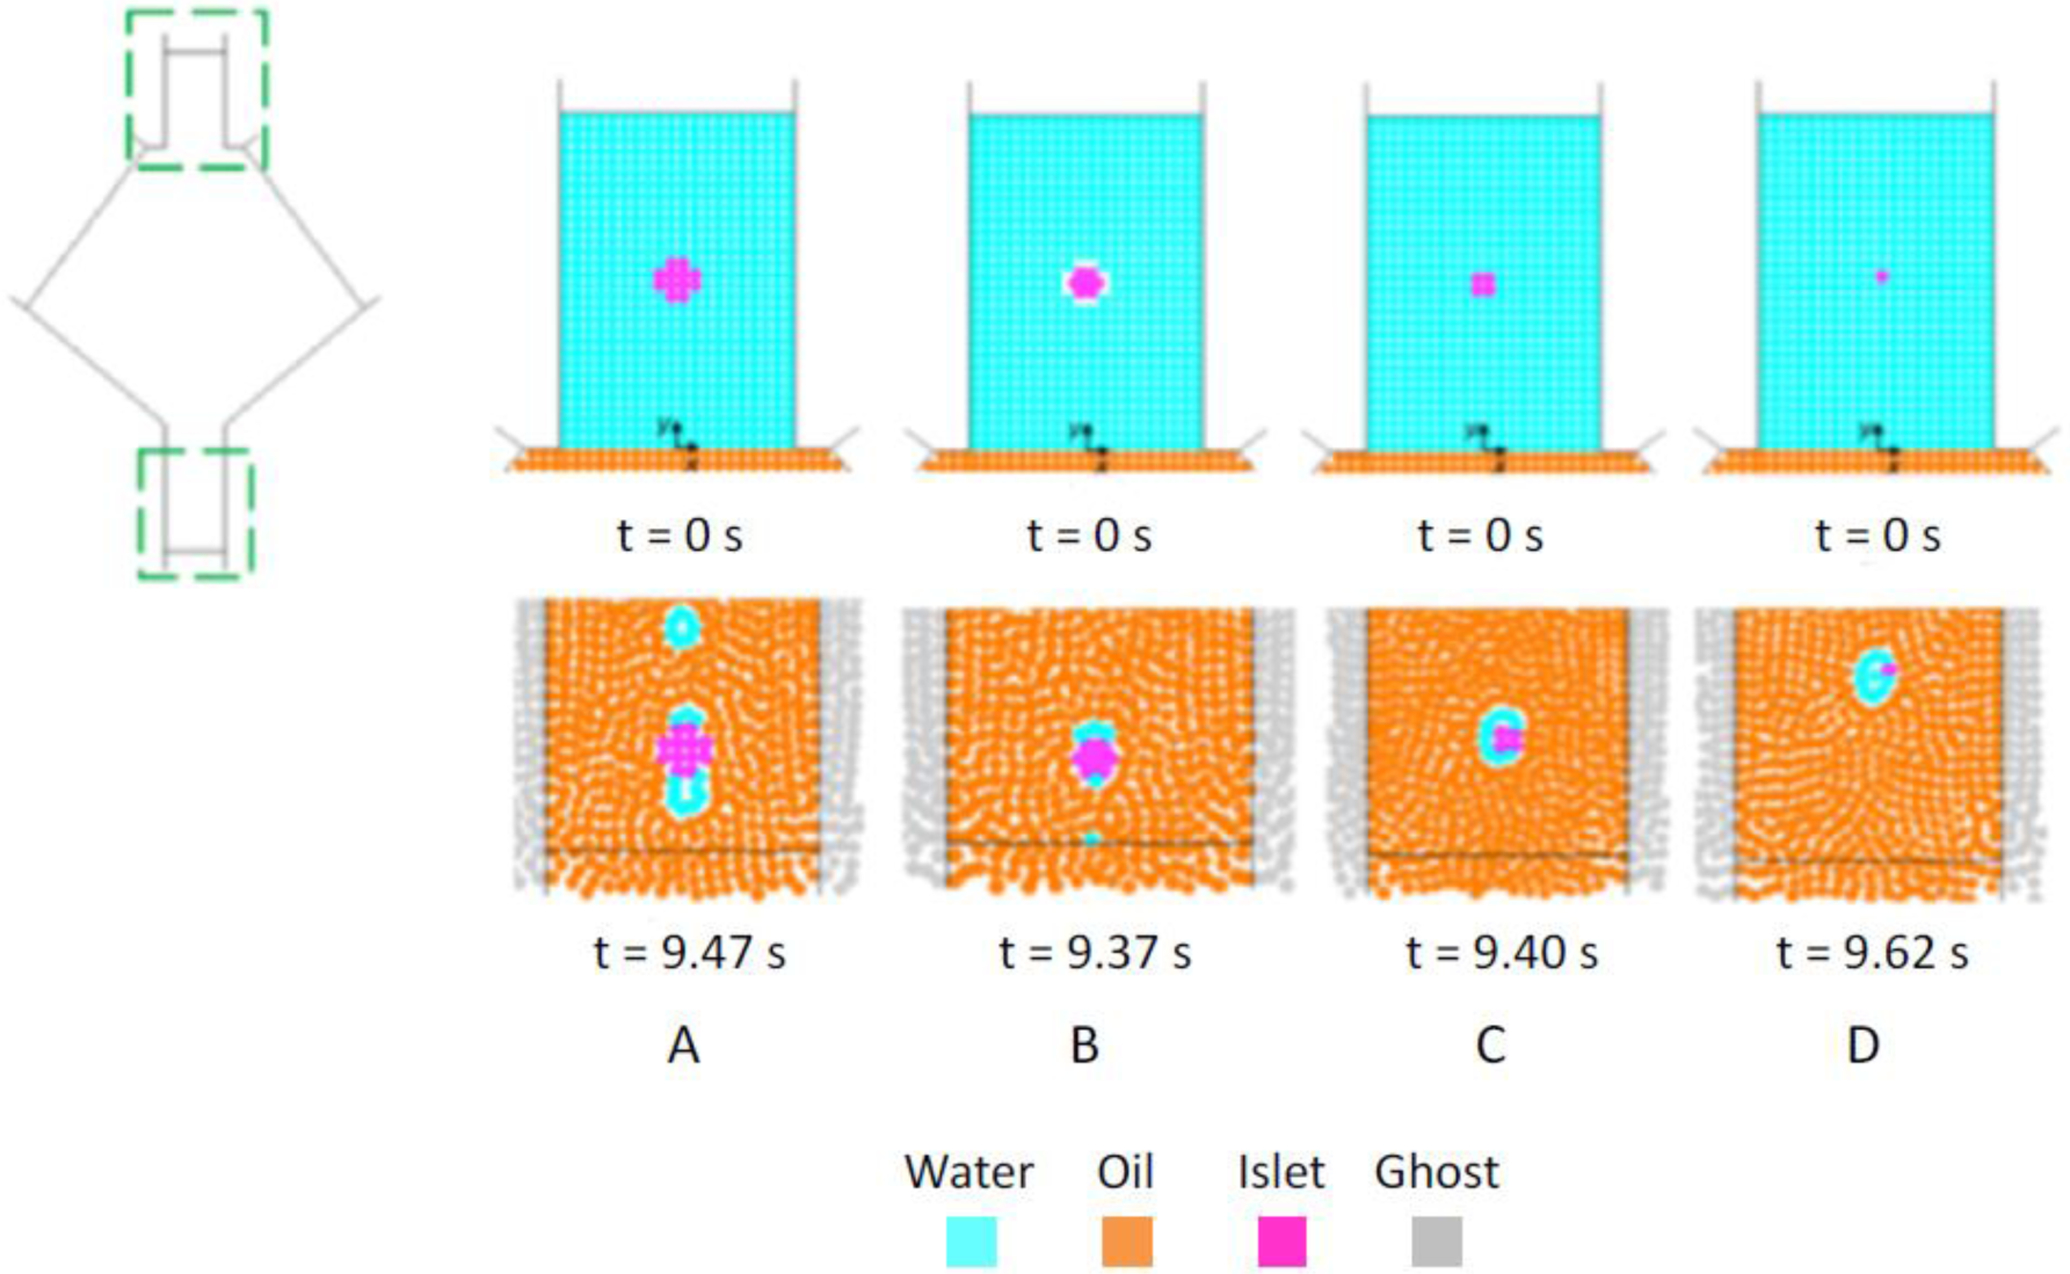
Initial condition (top) and output (bottom) of triphasic simulations with dSPH=50 μm. A: dislet=200 μm, B: dislet=150 μm, C: dislet=100 μm, D: dislet=50 μm.
Figure 7 shows a snapshot of the flow including the coated cell cluster at −6.2 mm < y < −5.4 mm, i.e. far enough from the outlet to avoid numerical boundary effects such as a coating deformation due to the influence of the imposed constant outflow velocity.
All the simulations showed effective coating formation around the travelling islets. Moreover, decreasing the islet diameter (d) positively impact the formation of an islet-surrounding coating. On the other hand, quantitative analysis of the coating thickness is prevented, and can only be noticed from a qualitative point of view.
The trajectory of the islets in the chamber is comparable for the four different tested diameters: Figure 8 shows as example the coaxial flow obtained with a resolution dSPH = 50 μm and a cellular aggregate diameter dislet = 100 μm. The four frames collected in Fig. 8 refer to the same simulation and represent 4 subsequent positions of the same islet in the simulation performed.
Fig. 8.
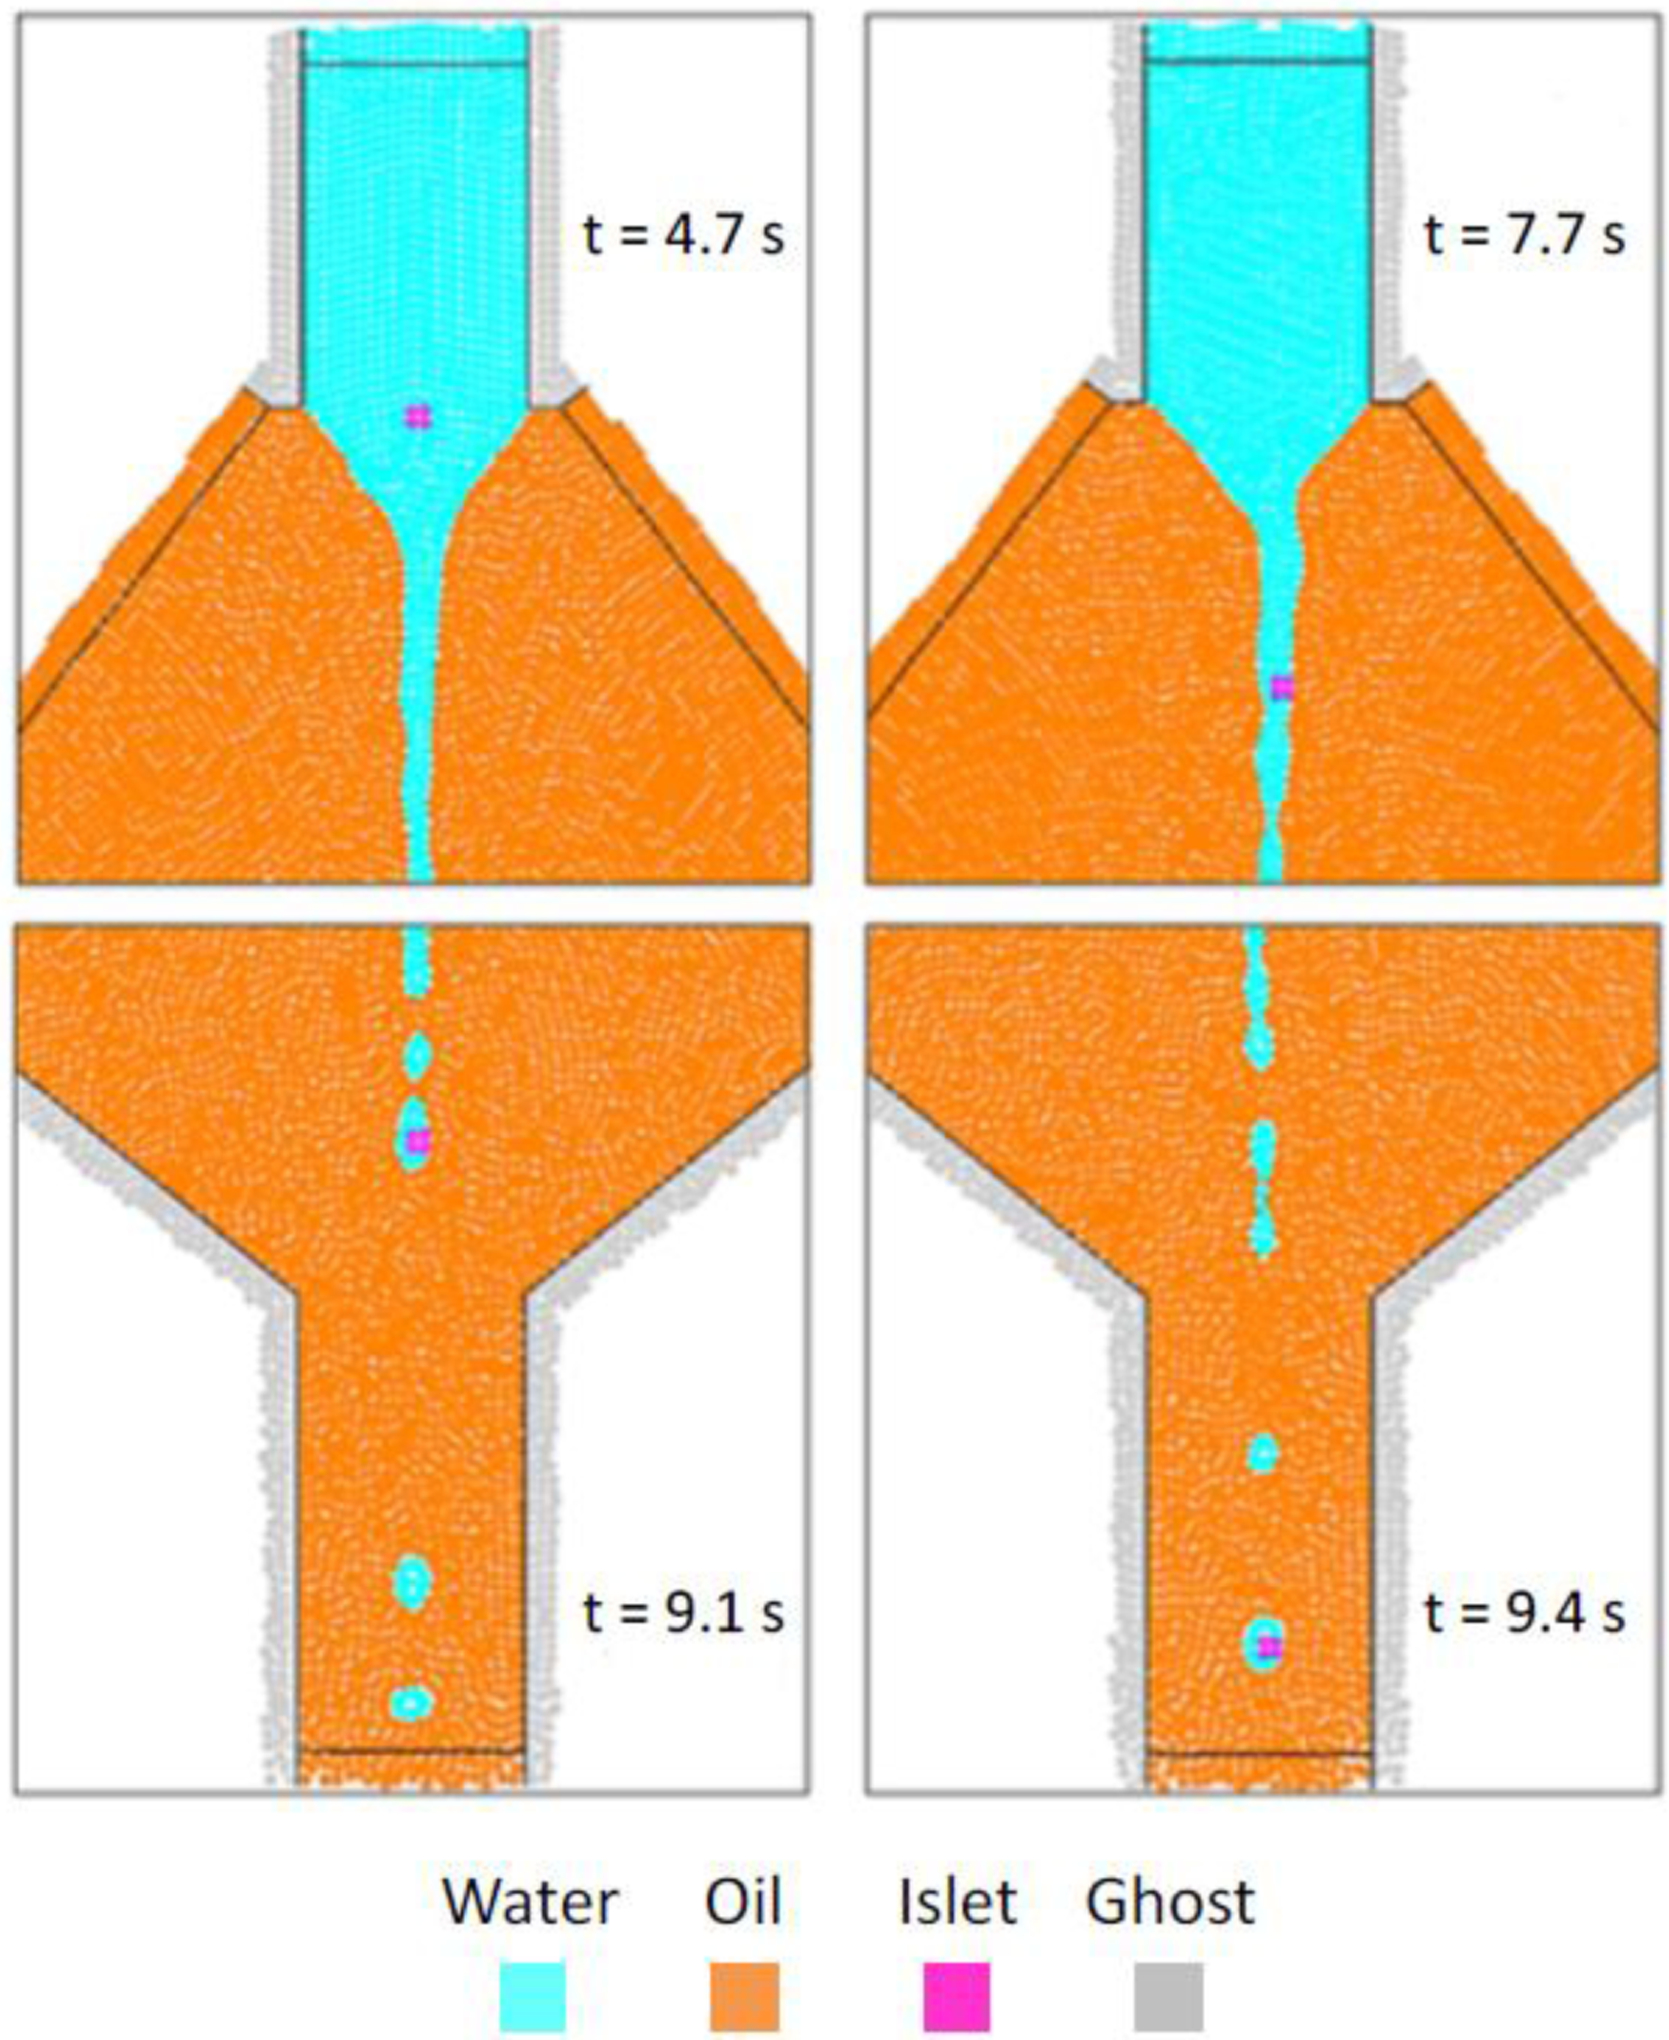
Numerical results for dSPH=50 μm and dislet=100 μm, showing the encapsulation and the transport of the islet phase.
The influence of the cellular aggregate on the overall fluid dynamics is negligible, because convective effects prevail, and the islet is rigidly transported by the flow.
These results also show that an appropriate setting of interfacial tension between the different phases, similarly to what observed with Model W, leads to a proper simulation of the adhesion between water and islet, i.e. the microencapsulation phenomenon. Nevertheless, a complete coating around the islets is not achieved in any of the four test cases: the current level of particles resolution (dSPH = 50 μm) should be further increased in order to properly simulate physical entities such as the islet coating layer (10–30 μm in thickness).
At this level of resolution, the two phases composing the final aggregate, i.e. water and islet, should not be regarded as completely separate entities. Indeed, SPH yields a smoothed space distribution of the flow variables pertaining to a given fluid mass, rather than a physical representation of a given fluid particle: the final aggregate should be then interpreted, more consistently, as a circular-like compound of water and islet phase, without a clear distinction between the two. In this frame, reliable information can be obtained about the global diameter of the water-islet droplet, as well as about its trajectory, but not about its internal structure.
An additional simulation with Model R, including a larger number of islets (n = 12) in the inlet capillary, analyses the influence of the position and size of the islets on the features of the final coated aggregates (Fig. 9). The simulated size distribution is not representative either of a naturally occurring islet population, or of the islet concentration adopted experimentally. The goal of this simulation is rather to model the coating process of islets of multiple sizes and starting from different positions in the water inlet, rather than one size only starting from the center. The initial positions of the islets are randomly chosen with the constraint of a suitable inter-spacing to avoid physical interactions between neighbour islets; dislet assumed the values of 50, 100, 150 and 200 μm, and three different islets were modelled for each chosen diameter in order to assess reproducibility of the coating process.
Fig. 9.
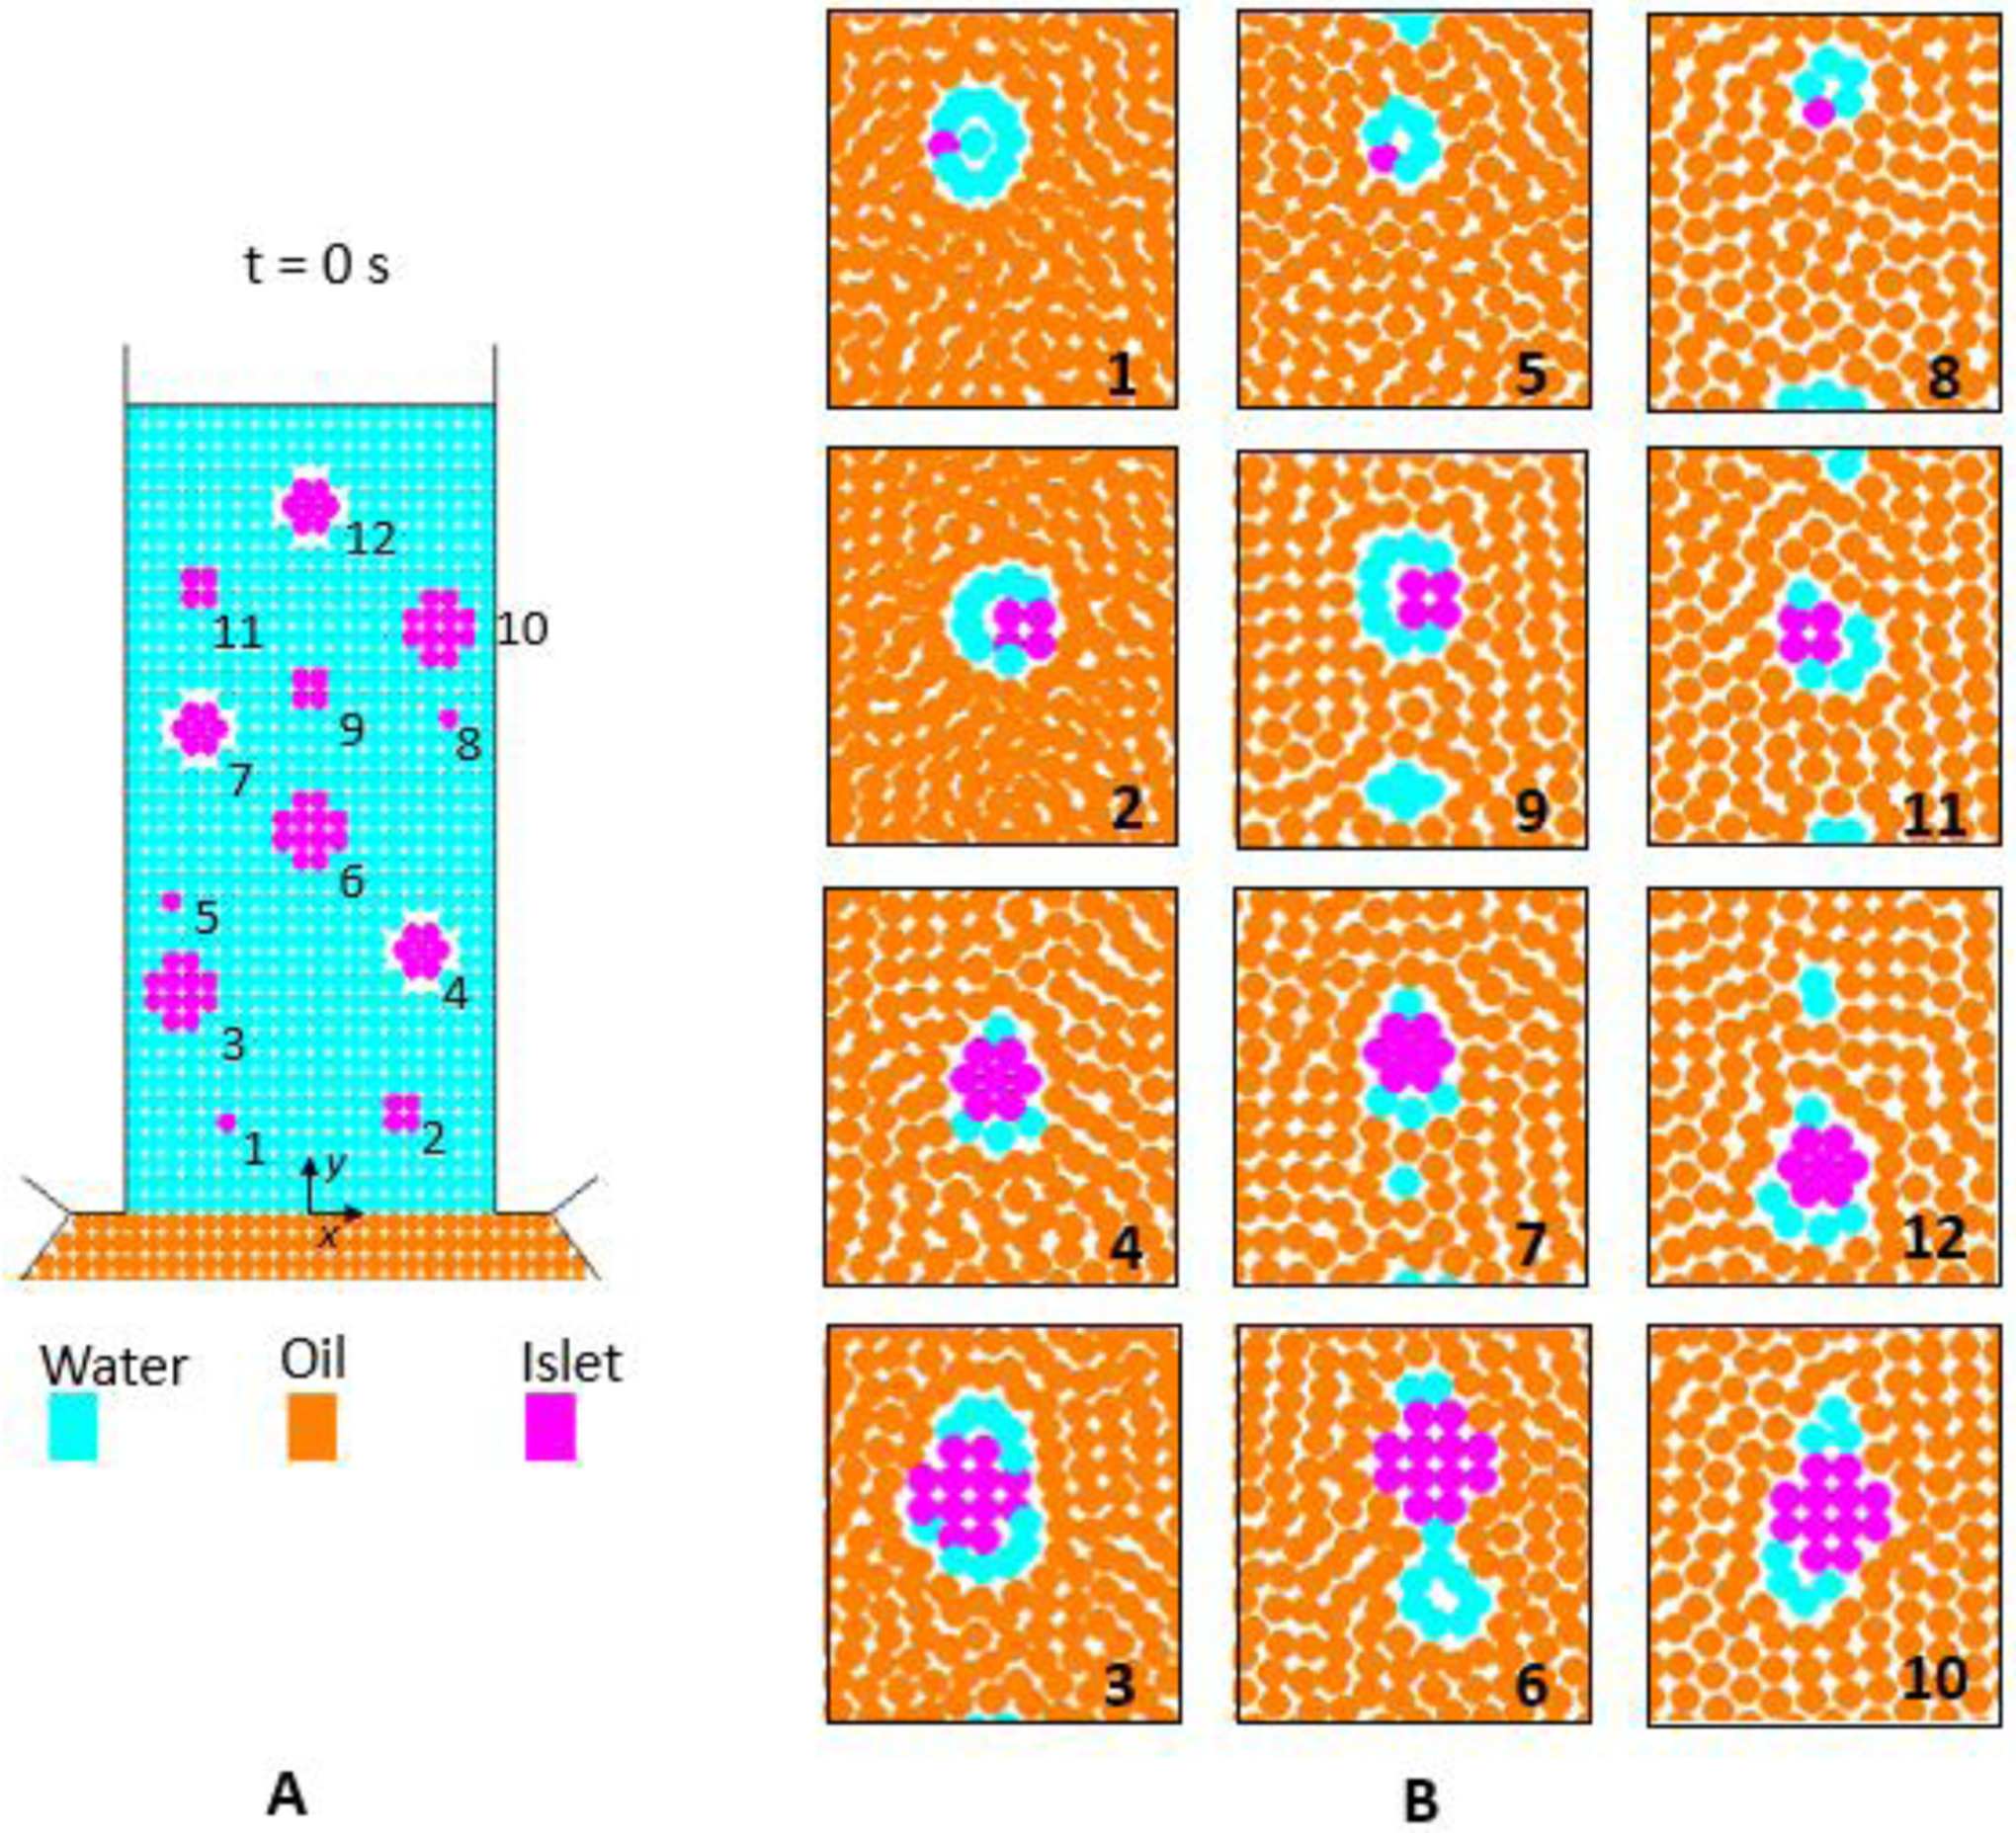
Multi-islet simulation: (A) initial random arrangement of the islets in the inlet channel, (B) final aggregates in the outlet capillary (panels 1-to-10 are provided according to increasing islet size).
The bias introduced by the constraints imposed to the initial islet positions and sizes does not allow one to obtain reliable information on the occupation rate of islets in the droplets: general studies on monodisperse suspensions show that this distribution should tend towards a Poisson distribution (see, e.g., [54]).
According to our results, an almost complete coating of the islets by SPH water particles occurs for all the tested islets but one (Fig. 9); the number of water particles surrounding the final aggregates, which can be considered a first approximation of the coating thickness, does not depend significantly on the initial position of the islet in the inlet channel, demonstrating the overall effectiveness of the encapsulation method based on the Rayleigh-Plateau jet instability. Moreover, a certain repeatability of the encapsulation process (again macroscopically evaluated as the number of water particles constituting the water-islet aggregate) can be appreciated among coated islets of the same dimension.
Although the sub-optimal spatial resolution of these simulations cannot allow drawing data on the actual coating characteristics, details of the numerical results appear as a first evidence of the conformal nature of the modelled encapsulation process where islet diameter does not affect the thickness of the islet polymeric coatings.
As experimentally observed, not all the droplets contain an islet, but some empty polymeric beads also form in the microencapsulation device. This behaviour occurs also in the numerical simulations, where empty droplets of various size and shape are noticeable in the outlet channel (Fig. 9, panels 9, 7 and 12). Moreover, because of the viscous shear stresses induced by the transversal velocity gradient within the oil phase in the capillary outlet, the droplets usually have a slightly elliptical shape with a vertical main axis.
To investigate the dimension of the droplets, both the major and the minor axes of each droplet are measured using the software Image J (https://imagej.net). The diameter of a circular droplet equivalent to the computed one is then assumed as a measure of the droplet size. The histogram in Figure 10 shows the percentage size distribution of the computed droplets, both containing and non-containing islets. The histogram was built by considering the size of 100 droplets, evaluated at mid-length of the outlet capillary. This distribution exhibits a peak centered on the small-size aggregates (101–150 μm). The percentage of droplets in the range of the larger aggregates (i.e. with an average diameter greater than 200 μm) is very small: the droplets whose size spans between 50 and 200 μm represent 94% of the total. Notably, the obtained droplet size distribution is comparable to the one reported in literature for a human islet population [33].
Fig. 10.
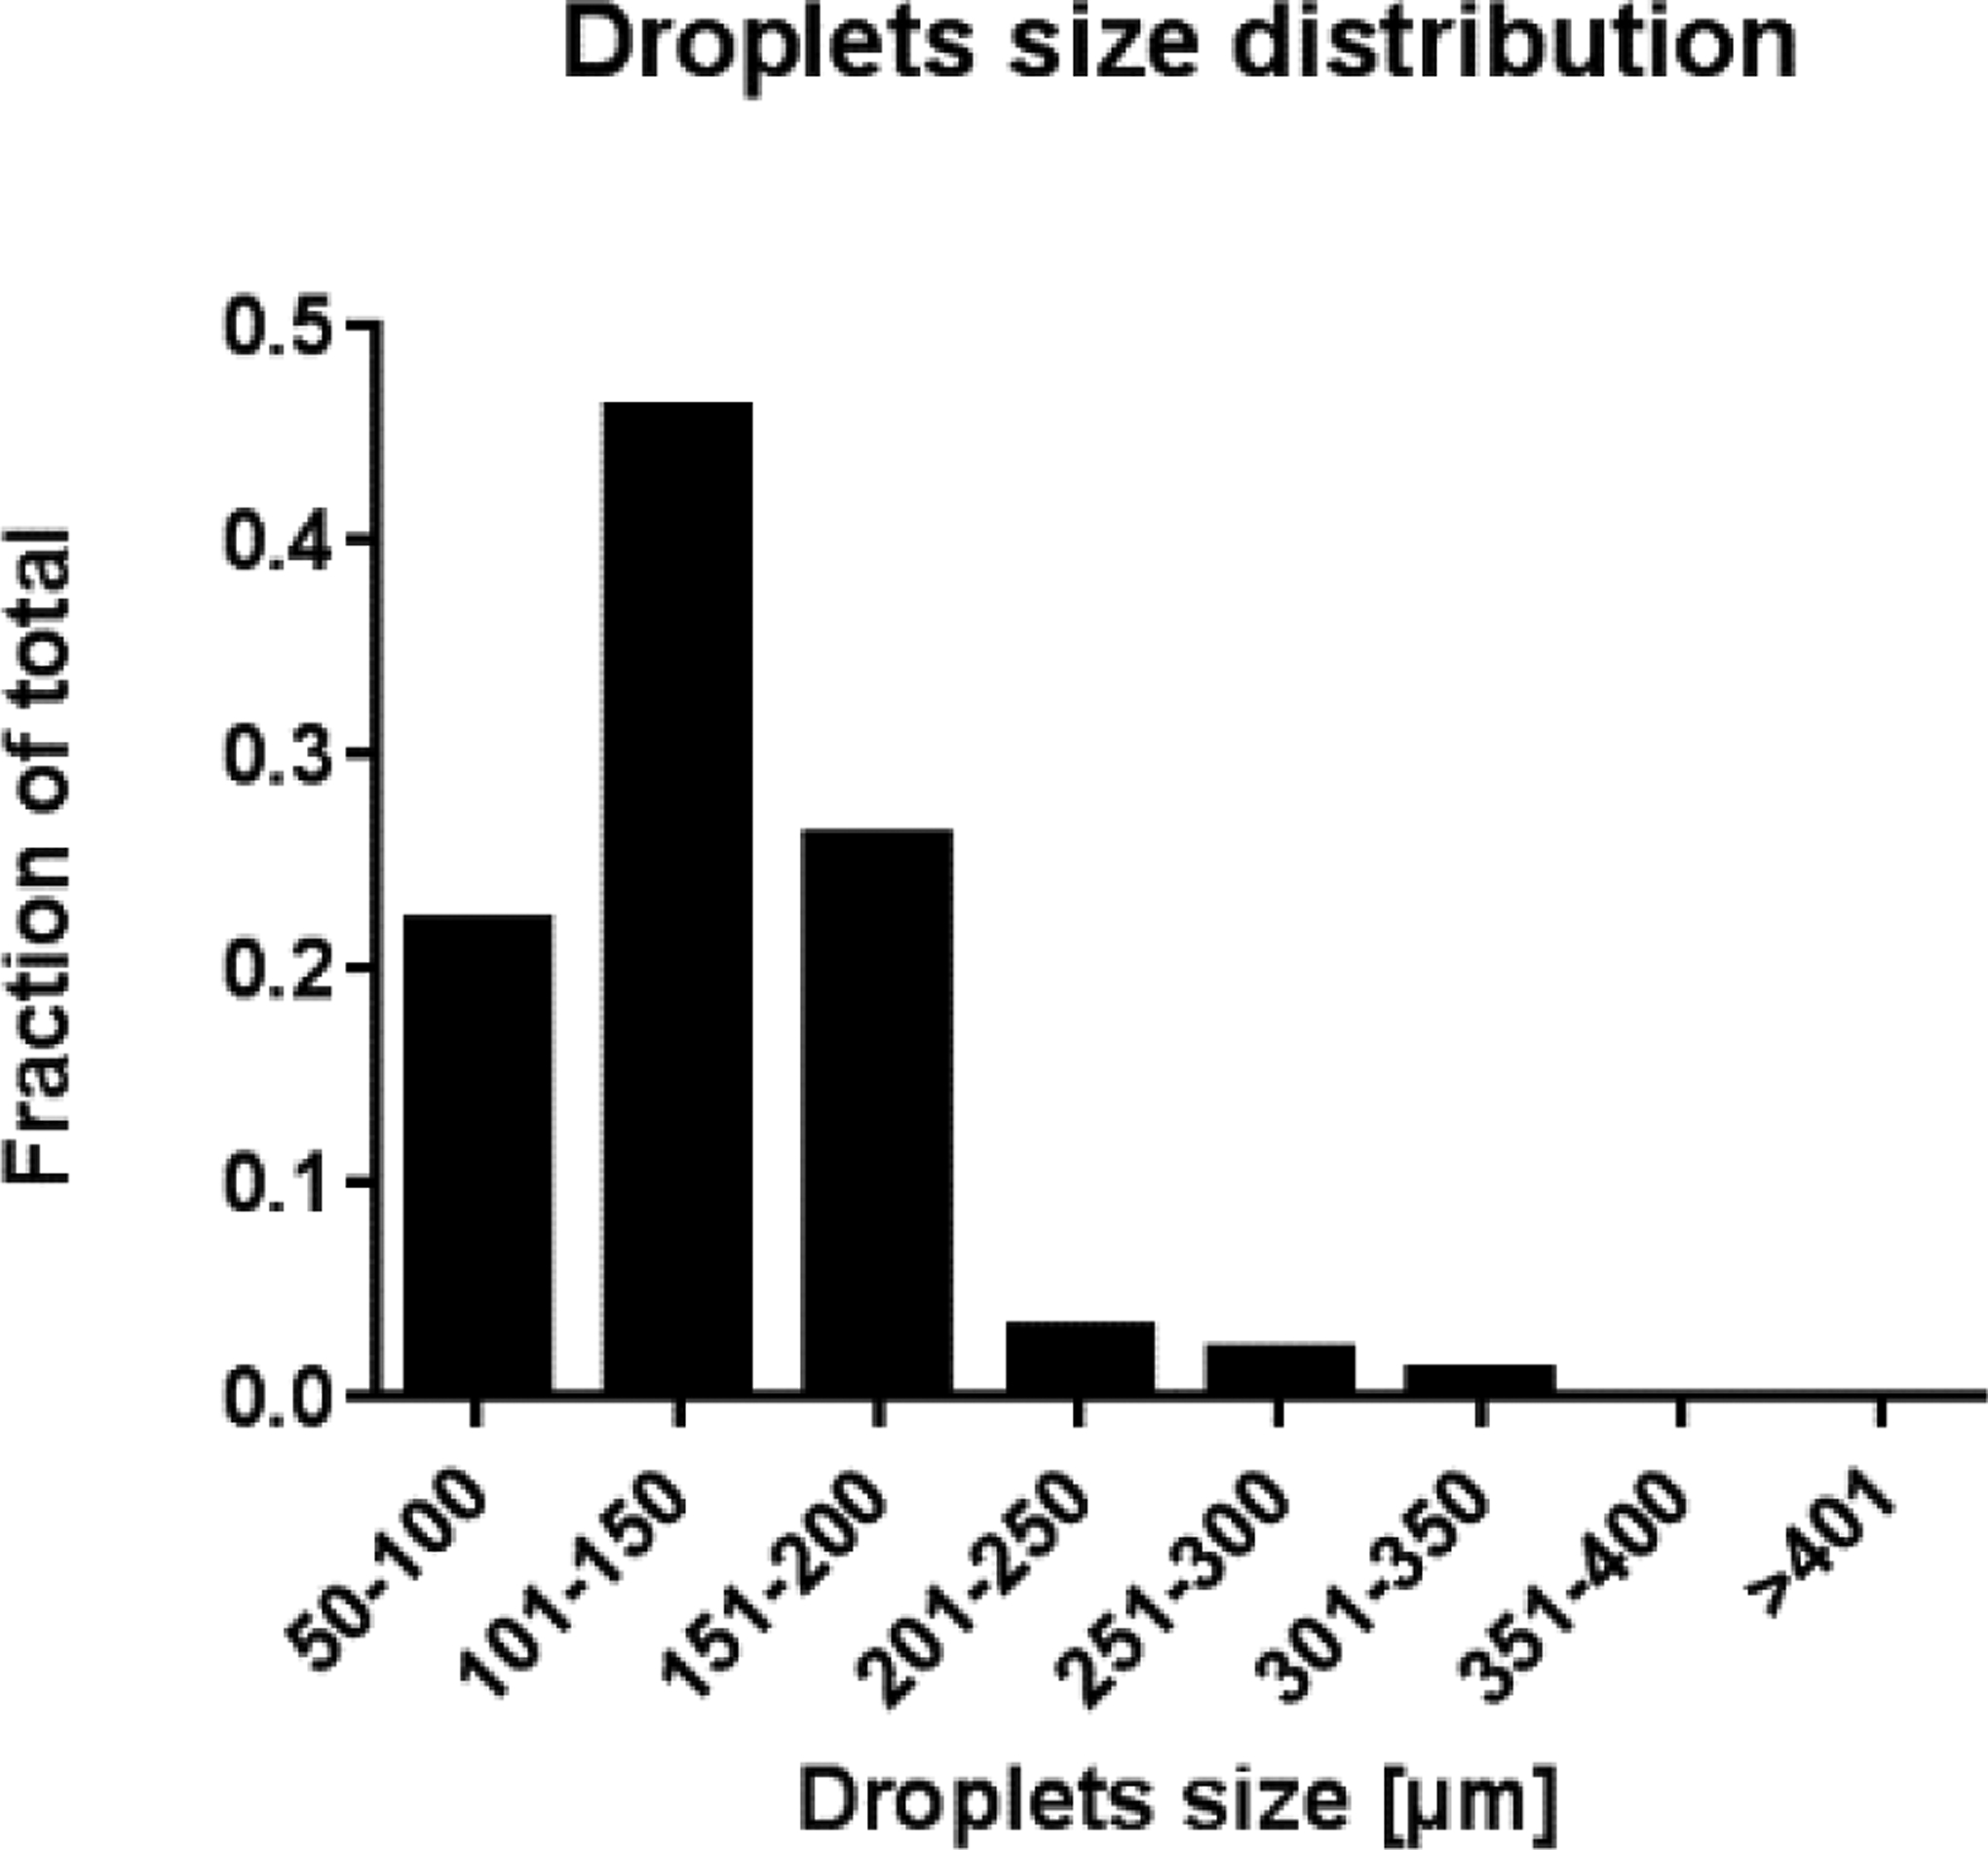
Histogram showing the average diameter distribution of the droplets in the multi-islet simulation.
Due to the chosen SPH resolution (dSPH = 50 μm), it is not possible to model aggregates smaller than 50 μm; similarly, aggregates larger than 350 μm are not obtained because of the assumed flow rates of the fluids.
Due to insufficient particle resolution, thinner coatings cannot be adequately resolved by the numerical model (as specified in Paragraph 3.2), but droplet size distribution was still considered worth reporting. While the majority of microencapsulation techniques use a “one size fits all” type of approach, conformal coating aims at creating a thin polymer layer around each islet, regardless of its size and of naturally occurring shape irregularities. Conformal coating thickness around primary islets has been evaluated by Manzoli et al. [7], ranging in average between ~20 and ~40μm, depending on the material used for the coating, but regardless of islet size. Experimental measures of the diameter distribution of MIN6 (insulinoma cells) coated islet-like clusters and of the coating thickness around MIN6 clusters and polystyrene beads with islet-like diameter distribution [33] confirm that the coating thickness is independent from the cluster/bead diameter resulting in diameter distribution of coated islets that resemble that of non-encapsulated primary islets (Fig. 11).
Fig. 11.
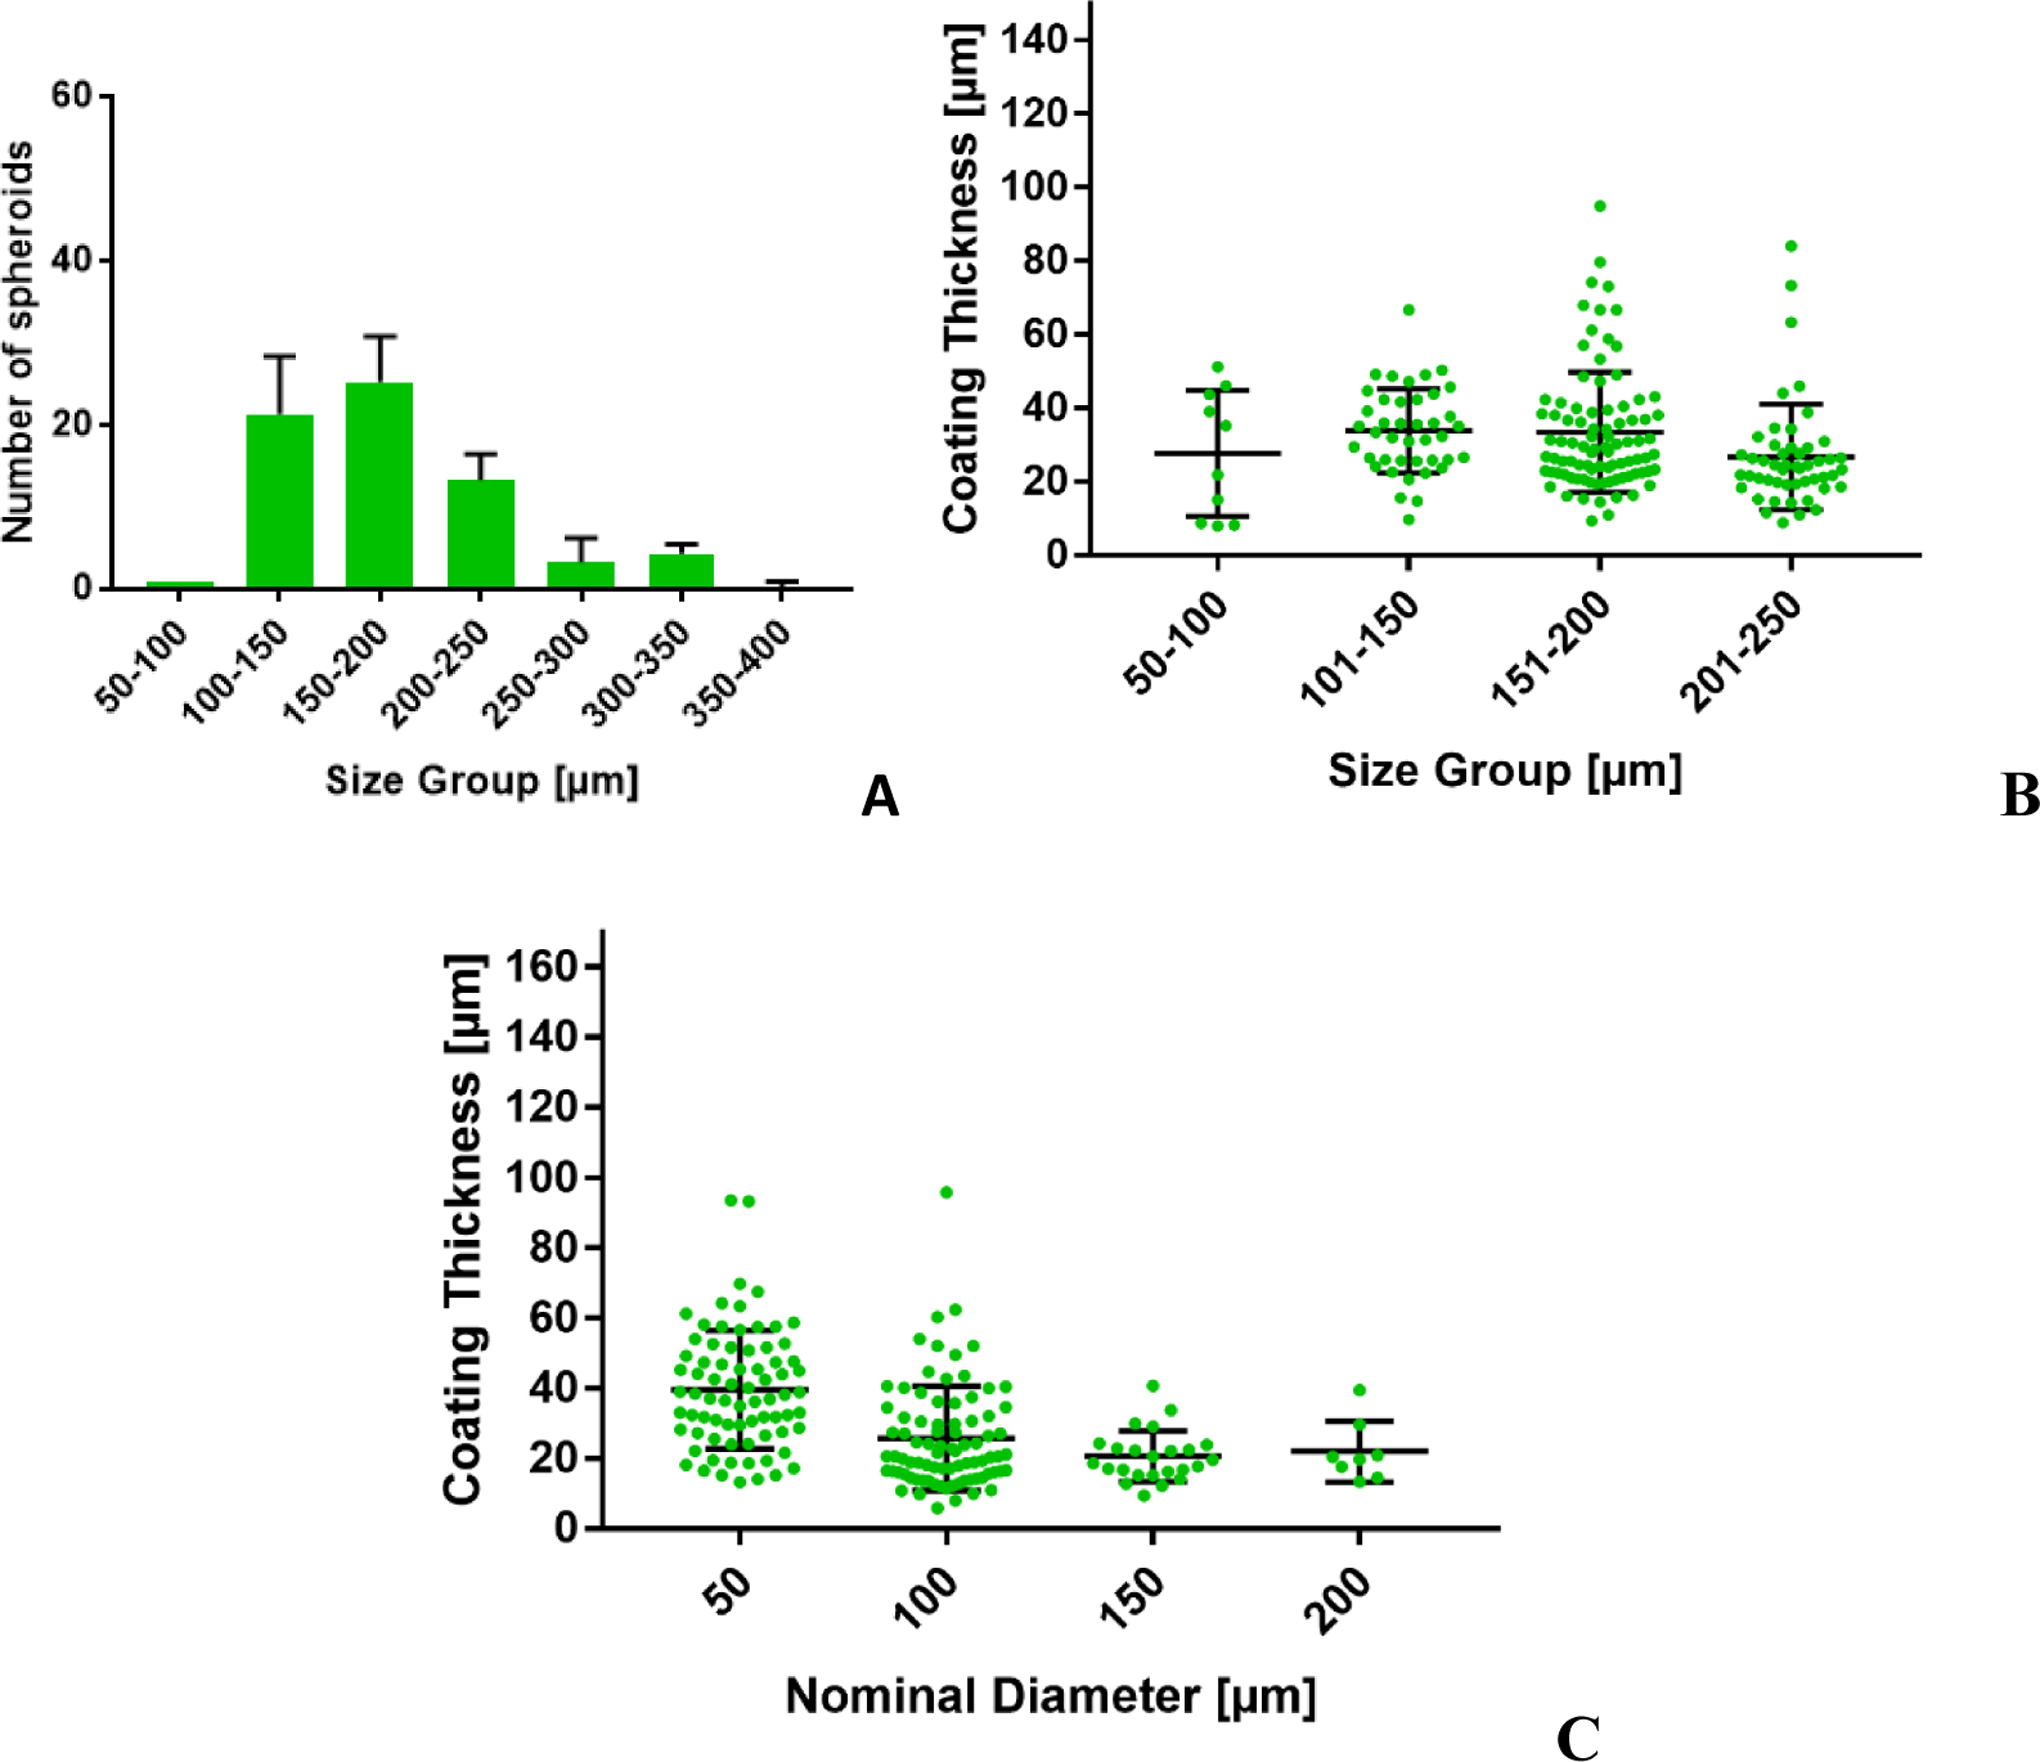
Experimental distribution of diameter (A) and coating thickness (B) of CC product using MIN6 (insulinoma cell) cluster, and of thickness of coatings around islet-like beads as a function of bead diameter (C).
4. Conclusions
Despite the simplifications introduced at this stage of the investigation to reduce the computational effort, such as the adoption of a 2D geometry and a relatively coarse resolution of the particles, the proposed SPH model satisfactorily simulates most of the main relevant fluid dynamic phenomena driving the conformal coating of pancreatic islets within the analysed microfluidic device, including the jet formation, its instability and eventual break-up into droplets containing the microencapsulated islets.
Furthermore, although it was not possible to capture all the physics of the dripping-to-jetting transition owing to the numerical limits, the model allows the evaluation of the influence of surface tension on the jet break-up and of size distribution of water droplets, including islet-containing CC products, consistently with theoretical and experimental evidences. As such, this model can represent a useful tool for the definition of optimized experimental conditions for screening of novel combinations of conformal coating parameters, including polymeric coating blends, size range of insulin-secreting cell clusters, utilized chemical reagents, device geometry and scale, thus providing a reliable in silico platform that might support the setting of the experimental protocol.
In fact, despite the current experimental protocol for conformal coating in the microencapsulation device used at the DRI does not require significant further optimization, as it allows the achievement of an efficient conformal coating [13], the work by Manzoli et al. [7] discussed the possible introduction of a different material for islet coating to further elevate in vivo functional efficacy of the transplanted cells. In this frame, the SPH numerical model might significantly speed up the identification of optimized operating conditions, limiting time and costs associated with in vitro experiments. In particular, being the numerical tool capable of accounting for geometrical parameters of the chamber, physical properties of the materials (viscosity, surface tension), device geometry and scale, and operating conditions of the two pumps (flow rate), all those parameters can be varied (first individually and then simultaneously) and the CC product outcome comprehensively evaluated. In addition, despite the resolution limitations of the current model do not allow us to quantify, for instance, the dimension of the coating surrounding the islet, other crucial parameters that influence the process can be studied, such as the formation and breaking of the jet, and non-suitable solutions can be excluded a priori without the need for in vitro tests.
Noticeably, the 2D SPH model of the encapsulation device presents novel features compared to the previous FEM models in literature. In particular, when compared with previous simulations of the microfluidic chamber [13], the SPH model adds an additional level of complexity, enhancing comprehensive evaluation of the main fluid dynamic phenomena at the basis of the encapsulation process; specifically, the whole CC process is simulated by introducing the third phase modelling the pancreatic islets as peculiar fluid volumes with an internal rigid constraint. The obtained results reveal that a repeatable coating thickness (i.e. a one-particle water layer which adheres on a cellular cluster) is obtained for islets of different size, reflecting the conformal nature of this microencapsulation strategy. However, as the sub-optimal SPH particle resolution limits the degree of approximation related to the coating around the simulated islets, no quantitative conclusion can be drawn about the coating thickness. Indeed, the trade-off between numerical resolution and computational costs, related to the very small time-steps permitted by the stability of the numerical scheme, prevented from refining the resolution to higher levels and to properly discretize the capsule layer. Nevertheless, if the obtained droplets are analysed from a macroscopic point of view, i.e. by considering them as a uniform volume made up of both water and islet phases, the proposed SPH model proves to be a reliable tool to reproduce in silico the CC microencapsulation process, yielding the same droplet size distribution as the one obtained experimentally.
Acknowledgements
This work was partially funded by Cariplo Foundation (grants 2011-2241 and 2015-1044). Funding for work performed in Dr. Tomei’s lab was provided by philanthropic funds from the Diabetes Research Institute Foundation, grants from the Juvenile Diabetes Research Foundation (grant # 5-CDA-2016-171-S-B and JDRF 3-SRA-2017-347-M), the National Institute of Health (grant # DK109929).
Footnotes
Conflicts of Interest: None
Ethical Approval: Not required
Disclosure
A.A.T. is a co-inventor of intellectual property used in the study and may gain royalties from future commercialization of the technology licensed to Converge Biotech Inc. A.A.T., and V.M. are stock option holders in Converge Biotech, licensee of some of the intellectual property used in this study.
References
- [1].Saberzadeh-Ardestani B, Karamzadeh R, Basiri M, Hajizadeh-Saffar E, Farhadi A, Shapiro AMJ, Tahamtani Y, Baharvand H. Type 1 Diabetes Mellitus: cellular and molecular pathophysiology at a glance. Cell J. 2018; 20:294–301. [DOI] [PMC free article] [PubMed] [Google Scholar]
- [2].Ludwig B, Reichel A, Steffen A, Zimerman B, Schally AV, Block NL, Colton CK, Ludwig S, Kersting S, Bonifacio E, Solimena M, Gendler Z, Rotem A, Barkai U, Bornstein SR. Transplantation of human islets without immunosuppression. PNAS 2013; 110:19054–19058. [DOI] [PMC free article] [PubMed] [Google Scholar]
- [3].Gibly RF, Graham JG, Luo X, Lowe WL, Hering BJ, Shea LD. Advancing islet transplantation: from engraftment to the immune response. Diabetologia 2011; 54:2494–2505. [DOI] [PMC free article] [PubMed] [Google Scholar]
- [4].Pepper AR, Bruni A, Shapiro AMJ. Clinical islet transplantation: is the future finally now? Curr Opin Organ Transplant 2018. 10.1097/MOT.0000000000000546 [DOI] [PubMed] [Google Scholar]
- [5].Scharp DW, Norbert SM, Sparks RE. Islet immuno-isolation: the use of hybrid artificial organs to prevent islet tissue rejection. World J Surg 1984; 8: 221–229. [DOI] [PubMed] [Google Scholar]
- [6].Teramura Y, Iwata H. Bioartificial pancreas microencapsulation and conformal coating of islet of Langerhans. Adv Drug Deliv Rev 2010; 62:827–840. [DOI] [PubMed] [Google Scholar]
- [7].Manzoli V, Villa C, Bayer AL, Morales LC, Molano RD, Torrente Y, Ricordi C, Hubbell JA, Tomei AA. Immunoisolation of murine islet allografts in vascularized sites through conformal coating with polyethylene glycol. Am J Transplant 2018; 18:590–603. [DOI] [PMC free article] [PubMed] [Google Scholar]
- [8].Desai T, Shea LD. Advances in islet encapsulation technologies. Nat Rev Drug Discov 2017; 16:367. [DOI] [PubMed] [Google Scholar]
- [9].Scharp DW, Marchetti P. Encapsulated islets for diabetes therapy: History, current progress, and critical issues requiring solution. Adv Drug Deliv Rev 2014; 67–68:35–73. [DOI] [PubMed] [Google Scholar]
- [10].Williams SJ, Huang HH, Kover K, Moore W, Berkland C, Singh M, Smirnova IV, MacGregor R, Stehno-Bittel L. Reduction of diffusion barriers in isolated rat islets improves survival, but not insulin secretion or transplantation outcome. Organogenesis 2010; 6:115–124. [DOI] [PMC free article] [PubMed] [Google Scholar]
- [11].Buchwald P A local glucose-and oxygen concentration-based insulin secretion model for pancreatic islets. Theor Biol Med Model 2011; 8:20. [DOI] [PMC free article] [PubMed] [Google Scholar]
- [12].Buchwald P, Tamayo-Garcia A, Manzoli V, Tomei A, Stabler CL; Glucose-stimulated insulin release: Parallel perifusion studies of free and hydrogel encapsulated human pancreatic islets. Biotechnol Bioeng 2018; 115:232–245. [DOI] [PMC free article] [PubMed] [Google Scholar]
- [13].Tomei AA, Manzoli V, Fraker CA, Giraldo J, Velluto D, Najjar M, Pileggi A, Damaris Molano R, Ricordi C, Stabler CL, Hubbel JA. Device design and materials optimization of conformal coating for islets of Langerhans. Proc Natl Acad Sci USA 2014; 111:10514–10519. [DOI] [PMC free article] [PubMed] [Google Scholar]
- [14].Cohen I, Li H, Hougland JL, Mrksich M, Nagel SR. Using selective withdrawal to coat microparticles. Science 2001; 292:265–267. [DOI] [PubMed] [Google Scholar]
- [15].Wyman JL, Kizilel S, Skarbek R, Zhao X, Connors M, Dillmore WS, Murphy WL, Mrksich M, Nagel SR, Garfinkel MR. Immunoisolating pancreatic islets by encapsulation with selective withdrawal. Small 2007; 3:683–690. [DOI] [PubMed] [Google Scholar]
- [16].Anna SL, Bontoux N, Stone HA. Formation of dispersions using flow focusing in microchannels. Appl Phys Lett 2003; 82:364–366. [Google Scholar]
- [17].Suryo R, Basaran OA. Tip streaming from a liquid drop form- ing from a tube in a co-flowing outer fluid. Phys Fluids 2006; 18:082102. [Google Scholar]
- [18].Mukherjee A, Kandlikar SG. Numerical simulation of growth of a vapor bubble during flow boiling of water in a microchannel. Microfluid Nanofluid 2005; 1:137–145. [Google Scholar]
- [19].Zhang J Lattice Boltzmann method for microfluidics: models and applications. Microfluid Nanofluid 2011; 10:1–28. [Google Scholar]
- [20].Zhou G, Ge W, Li B, Li X, Wang P, Wang J, Li J. SPH simulation of selective withdrawal from microcavity. Microfluid Nanofluid 2013; 15:481–490. 10.1007/s10404-013-1165-1. [DOI] [Google Scholar]
- [21].Shao S, Lo EYM. Incompressible SPH method for simulating Newtonian and non-Newtonian flows with a free surface. Adv Water Resour 2003; 26:787–800. [Google Scholar]
- [22].Shahriari S, Kadem L, Rogers BD, Hassan I. Smoothed particle hydrodynamics method applied to pulsatile flow inside a rigid two-dimensional model of left heart cavity. Int J Numer Meth Biomed Engng 2012; 28:1121–1143. [DOI] [PubMed] [Google Scholar]
- [23].Vázquez-Quesada A, Ellero M, Español P A SPH-based particle model for computational microrheology. Microfluid Nanofluid 2012; 13:249–260. 10.1007/s10404-012-0954-2. [DOI] [Google Scholar]
- [24].Manenti S, Sibilla S, Gallati M, Agate G, Guandalini R. SPH simulation of sediment flushing induced by a rapid water flow. J Hydraul Eng 2012; 138:272–284. [Google Scholar]
- [25].Amicarelli A, Kocak B, Sibilla S, Grabe J. A 3D Smoothed Particle Hydrodynamics model for erosional dam-break floods. Int J Comp Fluid Dyn 2017; 31:413–434. [Google Scholar]
- [26].Manenti S, Amicarelli A, Todeschini S. WCSPH with limiting viscosity for modeling landslide hazard at the slopes of artificial reservoir. Water 2018; 10:515 10.3390/w10040515. [DOI] [Google Scholar]
- [27].Espa P, Gallati M, Sibilla S. SPH simulations of a vertical 2D liquid jet introduced from the bottom of a free-surface rectangular tank. Adv Appl Fluid Mech 2008; 3:105–140. [Google Scholar]
- [28].Aristodemo F, Marrone S, Federico I. SPH modeling of plane jets into water bodies through an inflow/outflow algorithm. Ocean Eng 2015; 105:160–175. [Google Scholar]
- [29].Pourabdian M, Omidvar P, Morad MR. Multiphase simulation of liquid jet breakup using Smoothed Particle Hydrodynamics. Int J Modern Physics C 2017; 28:1750054. [Google Scholar]
- [30].De Padova D, Mossa M, Sibilla S. Numerical investigation of the behaviour of jets in a wave environment. J Hydraul Res 2019; in press. 10.1080/00221686.2019.1647886. [DOI] [Google Scholar]
- [31].De Padova D, Mossa M, Sibilla S. Characteristics of nonbuoyant jets in a wave environment investigated numerically by SPH. Environm Fluid Mech 2019; in press. 10.1007/s10652-019-09712-x. [DOI] [Google Scholar]
- [32].Tartakovsky AM, Meakin P. Modeling of surface tension and contact angles with smoothed particle hydrodynamics. Phys Rev E 2005; 72:26301–26309. [DOI] [PubMed] [Google Scholar]
- [33].Buchwald P, Wang X, Khan A, Bernal A, Fraker C, Inverardi L, Ricordi C. Quantitative assessment of islet cell products: estimating the accuracy of the existing protocol and accounting for islet size distribution. Cell Transplant 2009; 18:1223–1235. [DOI] [PubMed] [Google Scholar]
- [34].Petrini F, Manenti S, Gkoumas K, Bontempi F. Structural design and analysis of offshore wind turbines from a system point of view. Wind Eng 2010; 34:85–108. 10.1260/0309-524X.34.1.85 [DOI] [Google Scholar]
- [35].Ward T, Faivre M, Abkarian M and Stone HA. Microfluidic flow focusing: drop size and scaling in pressure versus flow-rate-driven pumping. Electrophoresis, 2005, 26(19): 3716–3724. [DOI] [PubMed] [Google Scholar]
- [36].Gingold RA, Monaghan JJ. Smoothed particle hydrodynamics: theory and application to non-spherical stars. Mon Not R Astron Soc 1977; 181:375–389. [Google Scholar]
- [37].Lucy LB. A numerical approach to the testing of the fission hypothesis. Astron J 1977; 82:1013–1024. [Google Scholar]
- [38].Monaghan JJ. Simulating free surface flows with SPH. J Comp Phys 1994; 110:399–406. [Google Scholar]
- [39].Li S, Liu WK. Meshfree particle methods. Berlin: Springer Science & Business Media; 2007. [Google Scholar]
- [40].Liu GR, Liu MB. Smoothed particle hydrodynamics: a meshfree particle method. Singapore: World Scientific; 2003. [Google Scholar]
- [41].Violeau D Fluid Mechanics and the SPH Method: Theory and Applications. Oxford: Oxford University Press; 2012. [Google Scholar]
- [42].Wendland H Piecewise polynomial, positive definite and compactly supported radial functions of minimal degree. Adv Comp Mathematics 1995; 4:389–396. [Google Scholar]
- [43].Sibilla S An algorithm to improve consistency in Smoothed Particle Hydrodynamics. Comput Fluids 2015; 118:148–158. [Google Scholar]
- [44].Zheng X, Ma Q, Shao S. Study on SPH Viscosity Term Formulations. Appl Sci 2018; 8: 249–265. [Google Scholar]
- [45].Adami S, Hu XY, Adams NA. A new surface-tension formulation for multi-phase SPH using a reproducing divergence approximation. J Comp Phys 2010; 229:5011–5021. [Google Scholar]
- [46].De Padova D, Mossa M, Sibilla S, Torti E. 3D SPH modelling of hydraulic jump in a very large channel. J Hydraulic Res 2013; 51:158–173. [Google Scholar]
- [47].Manenti S, Pierobon E, Gallati M, Sibilla S, D’Alpaos L, Macchi E, Todeschini S. Vajont disaster: Smoothed Particle Hydrodynamics modeling of the postevent 2D experiments. J Hydraul Eng 2016; 142:05015007. [Google Scholar]
- [48].Monaghan JJ. Smoothed particle hydrodynamics. Ann Rev Astron Astrophysics 1992; 30:543–574. [Google Scholar]
- [49].Randles PW, Libersky LD. Smoothed particle hydrodynamics: some recent improvements and applications. Comput Methods Appl Mech Eng 1996; 139:375–408. [Google Scholar]
- [50].Di Monaco A, Manenti S, Gallati M, Sibilla S, Agate G, Guandalini R. SPH modeling of solid boundaries through a semi-analytic approach. Eng Appl Comput Fluid Mech 2011; 5:1–15. [Google Scholar]
- [51].Amicarelli A, Agate G, Guandalini R. A 3D fully Lagrangian smoothed particle hydrodynamics model with both volume and surface discrete elements. Int J Num Meth Eng 2013; 95:419–450. [Google Scholar]
- [52].D’Olce M, Martin J, Rakotomalala N, Salin D, Talon L. Pearl and mushroom instability patterns in two miscible fluids’ core annular flows. Phys Fluids 2008; 20:024104; 10.1063/1.2838582. [DOI] [Google Scholar]
- [53].Manenti S Standard WCSPH for Free-Surface Multi-Phase Flows with a Large Density Ratio. Int J Ocean Coastal Eng 2018; in press. 10.1142/S2529807018400018. [DOI] [Google Scholar]
- [54].Najah M, Griffiths AD, Ryckelynck M Teaching single-cell digital analysis using droplet-based microfluidics. Analytical Chem 2012; 84:1202–1209. [DOI] [PubMed] [Google Scholar]


