

SUMMARY
In mammals, olfactory sensory neurons (OSNs) are born throughout life, ostensibly solely to replace damaged OSNs. During differentiation, each OSN precursor “chooses,” out of hundreds of possibilities, a single odorant receptor (OR) gene, which defines the identity of the mature OSN. The relative neurogenesis rates of the hundreds of distinct OSN “subtypes” are thought to be constant, as they are determined by a stochastic process in which each OR is chosen with a fixed probability. Here, using histological, single-cell, and targeted affinity purification approaches, we show that closing one nostril in mice selectively reduces the number of newly generated OSNs of specific subtypes. Moreover, these reductions depend on an animal’s age and/or environment. Stimulation-dependent changes in the number of new OSNs are not attributable to altered rates of cell survival but rather production. Our findings indicate that the relative birth rates of distinct OSN subtypes depend on olfactory experience.
Graphical Abstract

In Brief
In mammals, the odorant receptor identities of newly generated olfactory sensory neurons are thought to be determined by each progenitor cell’s random choice of a single receptor. Here, van der Linden et al. show that, in mice, the birth rates of neurons expressing a subset of receptors depend on olfactory stimulation.
INTRODUCTION
In mammals, neurogenesis occurs throughout life prominently in three areas of the nervous system: the hippocampus, the olfactory bulb (OB), and the olfactory epithelium (OE). In the hippocampus and OB, postnatal neurogenesis is an experience-dependent process that enables the functional tuning of circuitry and thereby plays a critical role in adapting the nervous system to changing environments and internal brain states (Lledo and Valley, 2016; Ming and Song, 2011; Opendak and Gould, 2015). By contrast, neurogenesis within the OE is thought to serve the relatively mundane function of replacing olfactory sensory neurons (OSNs) that are damaged through exposure to the environment (Yu and Wu, 2017).
During OSN differentiation in mice, each OSN progenitor chooses, from among ~1,200 possibilities, a single odorant receptor (OR) gene (McClintock, 2015; Monahan and Lomvardas, 2015) that determines the functional identity of the mature OSN. Thus, the mouse OE contains 1,200 distinct OSN “subtypes,” each of which is defined by the single OR gene that it expresses.
It is well established that the relative abundance of each of the ~1,200 distinct subtypes of OSNs in the mouse OE can be affected by olfactory experience. For example, the association of a foot shock with a specific odorant results in a significant increase in the number of OSNs that express ORs responsive to the odorant (Dias and Ressler, 2014; Jones et al., 2008; Morrison et al., 2015). Moreover, bidirectional and selective changes in the relative abundance of specific subtypes of OSNs result from the simple deprivation of olfactory stimulation via unilateral naris occlusion (UNO) (Cavallin et al., 2010; Coppola and Waggener, 2012; Fischl et al., 2014; Santoro and Dulac, 2012; Zhao et al., 2013) or the isolation of mice from odors of the opposite sex (van der Linden et al., 2018), as well as the simple exposure of mice to specific odorants (Cadiou et al., 2014; Cavallin et al., 2010; Ibarra-Soria et al., 2017; Watt et al., 2004).
Observed changes in the relative abundance of specific OSN subtypes have been attributed to the selective lengthening or shortening of neuronal lifespan (Cadiou et al., 2014; Cavallin et al., 2010; Jones et al., 2008; Morrison et al., 2015; Ross and Fletcher, 2019; Santoro and Dulac, 2012; van der Linden et al., 2018; Watt et al., 2004; Zhao and Reed, 2001; Zhao et al., 2013), which is predicted to cause the enrichment or depletion, respectively, of specific OSN subtypes. In theory, changes in the relative abundance of specific OSN subtypes could also occur via selective changes in their rates of neurogenesis. However, such a mechanism appears to be inconsistent with the current and widely accepted model of OSN neurogenesis. According to this model, the relative rates of neurogenesis of distinct OSN subtypes are determined by the fixed probabilities with which their OR genes are stochastically chosen for expression (Khan et al., 2011; Serizawa et al., 2003; Vassalli et al., 2011). This model predicts that the relative rates of neurogenesis of distinct OSN subtypes should not be affected by changes in olfactory experience.
Here, we sought to investigate whether olfactory stimulation plays a role in selectively regulating the neurogenesis rates of distinct OSN subtypes. To do so, we used UNO, a procedure that provides a simple method for reproducibly reducing olfactory stimulation (broadly defined here as both odor- and mechanically derived; Grosmaitre et al., 2007) on the closed side of the OE, as well as a within-animal control (the open side of the OE). Previous studies have found that UNO causes both selective changes in the transcript levels of specific ORs (Cavallin et al., 2010; Coppola and Waggener, 2012; Fischl et al., 2014; Santoro and Dulac, 2012; Zhao et al., 2013) and the abundance of OSNs of corresponding subtypes (Cavallin et al., 2010; Santoro and Dulac, 2012; Zhao et al., 2013) on the closed side of the OE relative to the open side. After defining a set of OSN subtypes with altered representation following UNO, we investigated whether selective changes in neurogenesis contribute to the observed changes in OSN abundance. Here, we describe findings that the neurogenesis rates for a fraction of OSN subtypes are selectively regulated by olfactory stimulation. Our findings suggest that, in addition to its established role in replacing damaged OSNs, persistent OSN neurogenesis may have an unknown adaptive function.
RESULTS
Identification of OSN Subtypes with Elevated, Reduced, and Unchanged Representation following Olfactory Deprivation
In order to test the hypothesis that olfactory deprivation selectively affects the neurogenesis rates of specific OSN subtypes, we first sought to identify subtypes whose representations are altered following olfactory deprivation. To this end, we used data from a previous study in which gene expression was profiled on the open and closed sides of the OE of mice that were UNO treated at postnatal day 14 (P14) and dissected at P35 (Santoro and Dulac, 2012) (GEO: GSE39516). This study found that ~4% of the OR genes interrogated had significantly (false discovery rate [FDR] < 0.05) reduced transcript levels on the closed side of the OE relative to the open side, while ~8% had significantly elevated transcript levels (Figure 1A; Table S1). The study also found that at least some of these differences reflected changes in the abundance of OSNs of specific subtypes (Santoro and Dulac, 2012). To confirm these results and to identify additional OSN subtypes that are altered in abundance following olfactory deprivation, as well as any that may instead or may additionally be altered in their level of cellular OR mRNA (von der Weid et al., 2015), we used RNA-fluorescence in situ hybridization (FISH) to quantify both the abundance (Figures 1B–1D, S1, and S2) and the cellular OR mRNA levels of specific OSN subtypes (Figures S3A–S3C). We examined each of 15 different ORs on the open and closed sides of the OE, including 7 representative ORs with significantly reduced tissue transcript levels, 5 with significantly elevated levels (Figure 1A), and 3 with unchanged levels on the closed side of the OE relative to the open side (not shown). We found that all 7 of the 7 ORs with reduced transcript levels on the closed side of the OE also exhibited significantly (p < 0.001) reduced OSN abundance on the closed side (Figures 1B, S1A–S1C, and S2C), 4 of the 5 ORs with elevated transcript levels on the closed side exhibited significantly (p < 0.001) elevated OSN abundance (Figures 1C, S1D–S1F, and S2C), and each of the 3 ORs with unchanged transcript levels on the closed side of the OE showed no significant difference (p > 0.1) in OSN abundance on the 2 sides (Figures S2A–S2C). For the single OR with an elevated transcript level on the closed side but no observed difference in OSN abundance (Olfr1336), the elevation appears to be attributable to a significant increase in cellular OR mRNA (Figures S3A–S3C). Overall, however, differences in OR transcript levels on the 2 sides of the OE correlated much more strongly with differences in OSN abundance (r = 0.96; p = 2 × 10⁻⁸) than with cellular OR mRNA levels (r = 0.65; p = 0.013) (Figures 1D and S3B). Moreover, these histology-based comparisons of cellular OR mRNA levels are consistent with comparisons based on single-cell RNA sequencing (scRNA-seq) (Figure S3D). To control for potential experimental artifacts associated with increased airflow through the open nostril following UNO (Coppola, 2012) or inherent differences between the 2 sides of the OE, we prepared samples from mice that did not receive UNO treatment and analyzed the abundance of 5 subtypes of OSNs that had exhibited altered abundance following olfactory deprivation. This analysis revealed no significant differences (p > 0.1) in the abundance of these OSNs between the OE of untreated mice and the open-side OE of UNO-treated mice (Figure S3E) or between the left and right sides of the OE of untreated mice (Figure S3F). These findings confirm previous observations that olfactory deprivation can alter the abundance of specific subtypes of OSNs and define distinct sets of OSN subtypes with elevated, reduced, and unchanged abundance following olfactory deprivation.
Figure 1. Identification of OSN Subtypes with Elevated, Reduced, and Unchanged Abundance following Olfactory Deprivation.
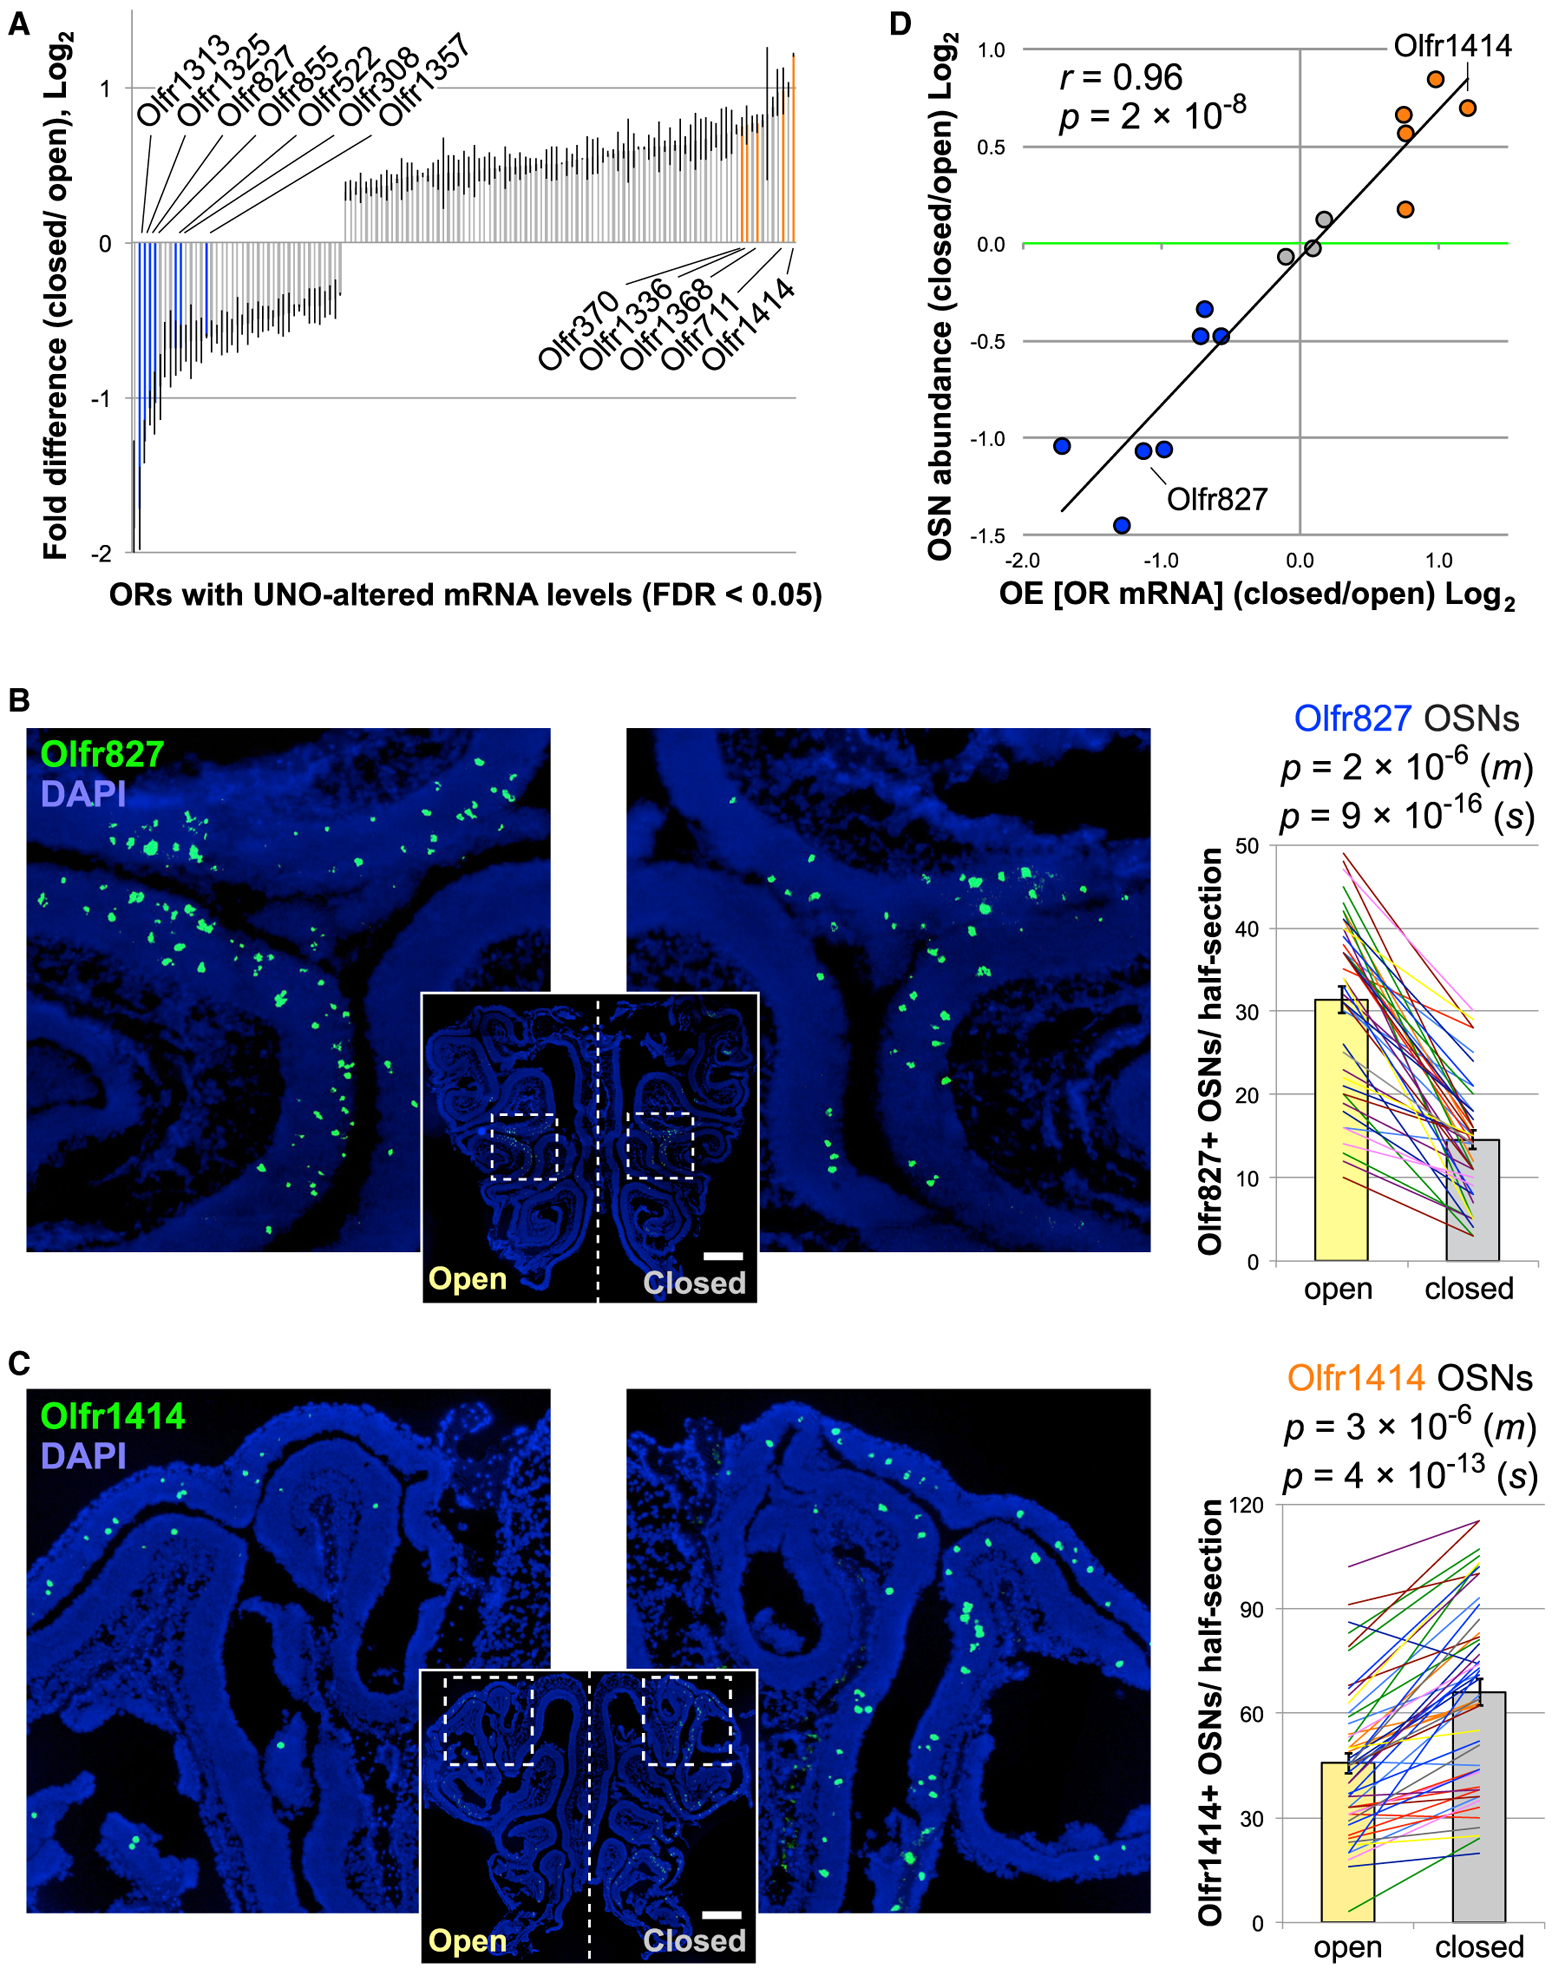
(A) ORs significantly differentially expressed (FDR < 0.05) between the open and closed sides of the OE of mice UNO treated at P14 and dissected at P35 (Santoro and Dulac, 2012) (Table S1). Blue and orange bars: ORs analyzed that have reduced and elevated transcript levels, respectively, on the closed side of the OE relative to the open side. Error bars: SEMs.
(B and C) Representative images (left) and quantifications (right) of differences in the abundance of Olfr827- and Olfr1414-expressing OSNs between the open and closed sides of the OE following UNO. The lines and colors represent distinct sections (s) and mice (m), respectively. n (m) = 11; n (s) = 44 (B) or 50 (C). p values: 2-tailed paired t tests; pairs, individual mice or sections. Scale bars: 500 μm. Error bars: SEMs.
(D) Plot of log2 fold differences between the closed and open sides of the OE in the abundance of OSNs of specific subtypes versus tissue OR transcript levels. Blue, orange, and gray circles: ORs with reduced, elevated, and unchanged tissue OR transcript levels, respectively, on the closed side relative to the open.
Green line: equal abundance on the 2 sides of the OE.
See also Figures S1–S3 and Table S1.
A Histological Approach to Quantify the Abundance of Newly Generated OSNs of Specific Subtypes
Having identified OSN subtypes with elevated and reduced abundance following olfactory deprivation, we sought to investigate whether neurogenesis plays a role in either (or both) of these categories of changes. For this purpose, we developed a histological approach to quantify the abundance of newly generated OSNs of any specific subtype of interest. The approach involves identifying cells that have incorporated the nucleotide analog EdU (5-ethynyl-2′-deoxyuridine) into their DNA during cell division (detected via click-chemical conjugation of a fluorophore) and subsequently express an OR of interest (detected via FISH) (Figure 2A). For the initial experiments, OE samples to be analyzed were generated according to the timeline in Figure 2B, in which mice were UNO treated at P14, EdU injected at P28, and sacrificed between P30 and P56. OE sections were double stained for EdU and mRNAs encoding each of the 15 ORs and then quantified to determine the number of cells positive for both (as well as the total number expressing each OR) on both the open and closed sides of the OE. In order to investigate changes in the abundance of new OSNs of specific subtypes, we first sought to establish the time period following EdU labeling when new OSNs could be accurately quantified. We defined this period as beginning after OR mRNA is detectable in a near-maximal fraction of EdU-labeled OSNs and ending before the elimination of EdU+ immature OSNs that fail to survive to maturity (Kondo et al., 2010). To determine these time points, we calculated for each of the 15 OSN subtypes analyzed in this study the open-side fraction of OR+ cells that are also EdU+, normalized for the maximal overlap frequency for each OSN subtype, and plotted the averages of these values across 10 time points ranging from 2 to 28 days post-EdU labeling (Figure 2C). This analysis revealed that the frequency of cells positive for both EdU and an OR reaches a maximum between 4 and 12 days post-EdU labeling and falls off rapidly thereafter. These results are consistent with previous findings that OR expression is detectable in immature OSNs ~4 days after labeling with a nucleotide analog (Coleman et al., 2017; Rodriguez-Gil et al., 2015) and that a large fraction of OSNs undergoes apoptosis after ~14 days (Kondo et al., 2010; Mackay-Sim and Kittel, 1991). Thus, new OSNs were quantified on the basis of both EdU labeling and OR expression in mice sacrificed 4–12 days post-EdU labeling (P32–P40).
Figure 2. Histological Approach to Quantify the Abundance of Newly Generated OSNs of Specific Subtypes.
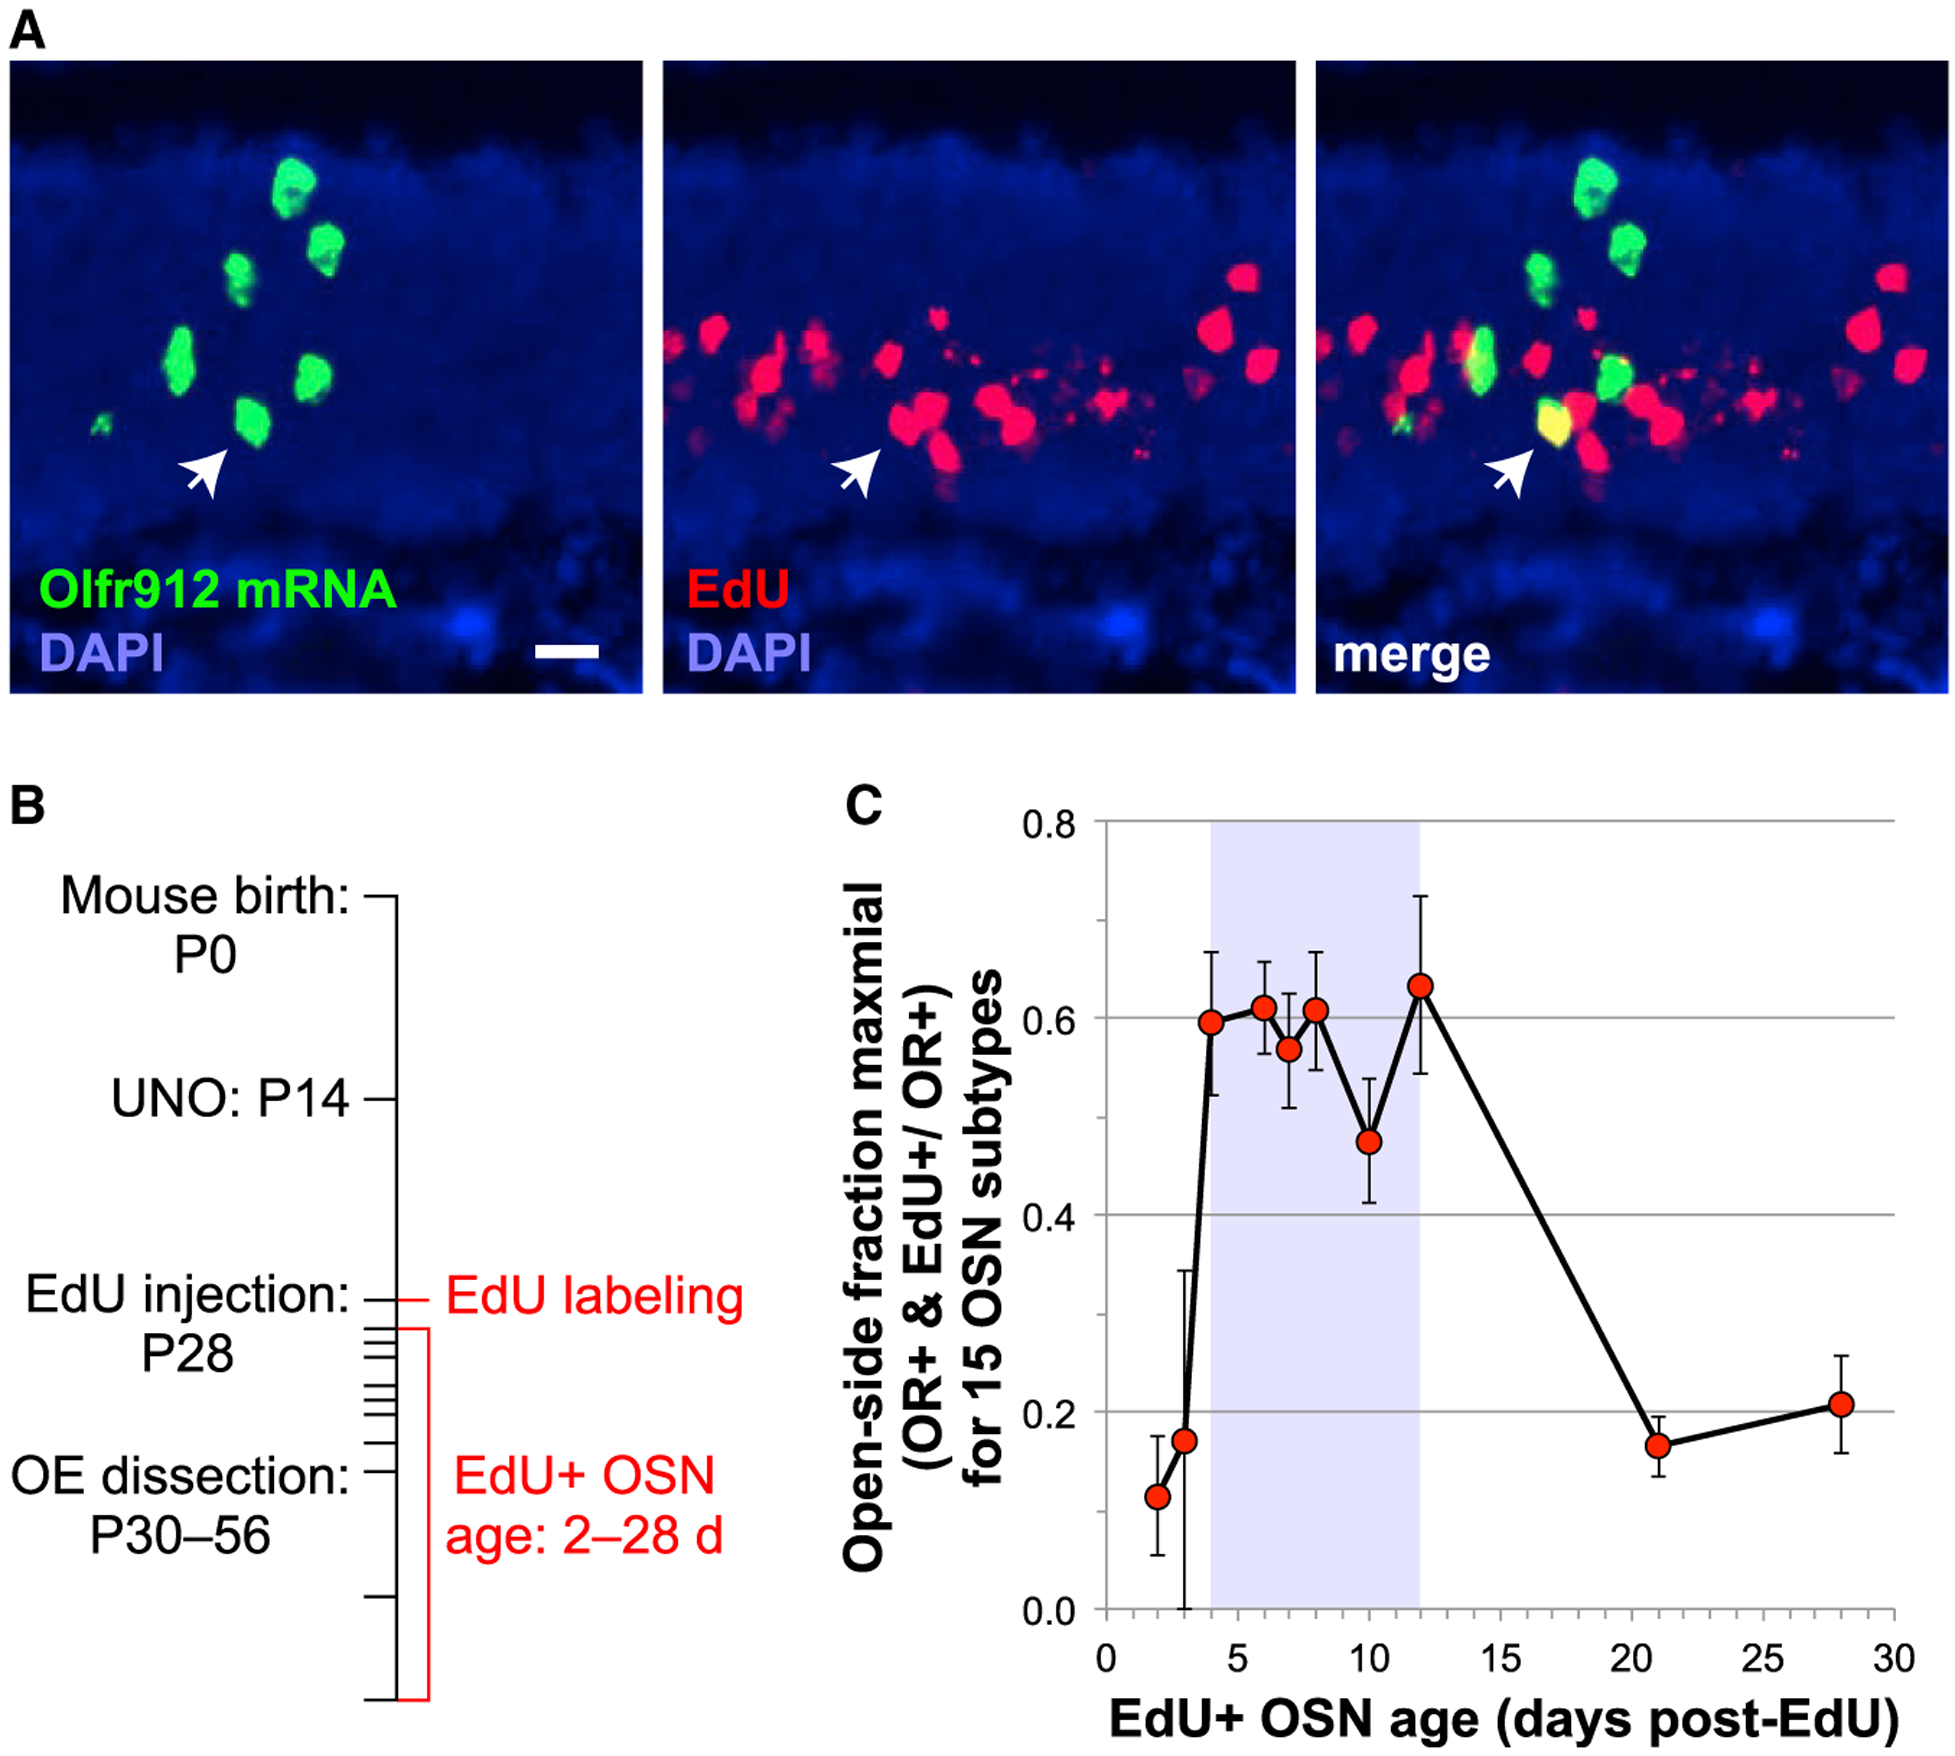
(A) Identification, within sections of OE from mice injected with the nucleotide analog EdU, of OSNs that contain both nuclear EdU (red; detected via click chemistry) and mRNA encoding an OR (green; detected via FISH). The yellow cell (white arrow) is a new Olfr912-expressing OSN. Scale bar: 20 μm.
(B) Initial experimental timeline for the generation of OE samples used to quantify the abundance of new OSNs that express specific ORs. OE samples were from mice UNO treated at P14, EdU injected at P28, and sacrificed between P30 and P56.
(C) Plot of the average open-side fraction of OR+ cells that are also EdU+, normalized for the maximal overlap frequency for each of the 15 OSN subtypes analyzed in this study, as a function of EdU-labeled OSN age. Shaded region: time window used for new OSN quantification. Error bars: SEMs.
Olfactory Deprivation Selectively Reduces the Abundance of Newly Generated OSNs of Specific Subtypes
Using tissue generated according to the timeline in Figure 2B and the time course established in Figure 2C, we quantified the relative abundance of new OSNs of each of the 15 subtypes on the open and closed sides of the OE. Strikingly, 5 of the 7 OSN subtypes that had shown reduced overall representation on the closed side of the OE following UNO also exhibited a significantly (p < 0.05) reduced abundance of new OSNs on the closed side compared to the open side (Figures 3A–3C, S4A, and S4B). For example, the abundance of new Olfr827-expressing OSNs was reduced 5-fold following olfactory deprivation (p < 0.01; Figures 3A and 3B, left). By contrast, all 8 of the 8 OSN subtypes that had shown either elevated OSN abundance or no difference in abundance on the closed side exhibited no significant difference (p > 0.05) in the abundance of newly generated OSNs on the 2 sides of the OE (Figures 3B, right, 3C, S4D, and S4E). No significant (p > 0.05) subtype-specific differences in the abundance of new OSNs were observed between the untreated OE and the open OE of UNO-treated mice (Figure S5A) or between the left and right sides of the OE of untreated mice (Figure S5B), indicating that the observed differences in the abundance of new OSNs of specific subtypes are not a result of increased airflow through the open nostrils of UNO-treated mice or to inherent differences on the 2 sides of the OE. These results indicate that olfactory deprivation selectively reduces the abundance of new OSNs corresponding to a fraction of OSN subtypes.
Figure 3. Olfactory Deprivation Selectively Reduces the Abundance of Newly Generated OSNs of Specific Subtypes.

(A) Representative image of an OE section from a UNO-treated and EdU-labeled mouse stained for Olfr827 mRNA and EdU. The yellow cells (white arrows) are new OSNs that are EdU+ and Olfr827 expressing. EdU: P28. Scale bar: 500 μm.
(B) Quantification of differences in the abundance of new Olfr827- (left) and Olfr1414-expressing OSNs (right) between the open and closed side of the OE. EdU: P28. The lines and colors represent distinct sections (s) and mice (m), respectively. n (m) = 9 (left) or 8 (right); n (s) = 38 (left) or 41 (right). p values: 2-tailed paired t tests; pairs, individual mice or sections.
(C) Volcano plot of p value (2-tailed paired t test, OE sections) versus log2 fold difference between the closed and open sides of the OE in the abundance of EdU+ OSNs of the indicated subtypes. Green line: p < 0.05. Blue, orange, and gray circles: OSN subtypes with reduced, elevated, and unchanged tissue OR transcript levels, respectively, on the closed side relative to the open. EdU: P28.
(D) Comparison of differences in the abundance of EdU+ OSNs of specific subtypes on the open and closed sides of the OE at P14 and P28. Blue, orange, and gray circles: OSN subtypes with reduced, elevated, and unchanged tissue OR transcript levels, respectively, on the closed side relative to the open. Light colors: UNO treated at P1, EdU labeled at P14, and sacrificed at P21. Dark colors: UNO treated at P14, EdU labeled at P28, and sacrificed at P32–P40. Green line: equal abundance on the 2 sides of the OE. *p < 0.05 (2-tailed paired t test, OE sections).
(E) Comparison of average OR-specific EdU+ OSN frequencies between the open and closed sides of the OE for 5 subtypes that undergo stimulation-dependent changes in EdU+ OSN abundance (Olfr827, Olfr1325, Olfr855, Olfr1357, and Olfr308; left) and 3 control subtypes that do not (Olfr867, Olfr1463, and Olfr958; right). EdU: P28. Error bars: SEMs. p values: 2-tailed t tests.
See also Figures S4 and S5.
The Extent to which Olfactory Deprivation Reduces the Abundance of New OSNs of Specific Subtypes Varies with Age and/or Environment
Curiously, 2 of the 7 OSN subtypes that had shown a reduced overall abundance on the closed side (Olfr1313 and Olfr522) exhibited no significant reduction in the abundance of newly generated OSNs (Figures 3C and S4A). Because the observed differences in OSN abundance could have arisen at any time from the start of UNO (P14) until OE dissection (P35), whereas any observed differences in newly generated OSNs reflect the time point of EdU labeling (P28), we considered the possibility that the reduced overall abundance of Olfr1313- and Olfr522-expressing OSNs may reflect differences in OSN production that occurred after UNO (P14) but before EdU labeling (P28). If so, then this would indicate that the degree to which a specific OSN subtype undergoes stimulation-dependent changes in the abundance of new OSNs varies depending on an animal’s age and/or environment. To investigate this possibility, we generated OE tissue from mice that had undergone UNO treatment, EdU labeling, and sacrifice ~2 weeks earlier (at P1, P14, and P21, respectively) and quantified new OSNs of 8 subtypes, including Olfr1313 and Olfr522. These analyses revealed a significant (p < 0.01) reduction in the abundance of new OSNs expressing Olfr1313 and Olfr522 on the closed side of the OE compared to the open side (Figures 3D, S4A, and S4C), indicating that these subtypes undergo stimulation-dependent changes in the abundance of new OSNs at P14, but not at P28. By contrast, the Olfr1325 subtype, which showed a 5-fold reduction in the abundance of new OSNs on the closed side at P28 (p < 0.01), showed no significant difference at P14 (Figures 3D and S4A). Moreover, 2 OSN subtypes (Olfr827 and Olfr855) showed stimulation-dependent changes in the abundance of new OSNs at both P28 and P14, while 3 subtypes (Olfr1414, Olfr711, and Olfr1463) showed no stimulation-dependent changes in the abundance of new OSNs at either time point (Figures 3D, S4A, S4D, and S4E). Thus, the degree to which specific OSN subtypes undergo stimulation-dependent changes in the abundance of new OSNs depends on an animal’s age and/or environment.
Subtype-Specific Changes in the Abundance of New OSNs Are Positively Regulated by Olfactory Stimulation
In considering the mechanism by which subtype-specific changes in the abundance of new OSNs occur, a key question is whether these changes are positively regulated via olfactory stimulation, negatively regulated via the absence of olfactory stimulation, or both. If positive regulation plays a role, then OSN subtypes that exhibit stimulation-dependent changes in new OSN abundance should show an above-average abundance of new OSNs on the open side, relative to total open-side OSNs of the same subtype. If negative regulation plays a role, then these subtypes should show a below-average relative abundance of new OSNs on the closed side. To investigate these scenarios, we compared the relative abundance of new OSNs of subtypes that undergo stimulation-dependent changes in new OSN abundance to that of controls on the 2 sides of the OE. These analyses revealed a significantly (p = 0.038) higher relative abundance of new OSNs on the open side for subtypes that undergo stimulation-dependent changes in new OSN abundance compared to controls, but no significant difference (p = 0.11) on the closed side (Figures 3E and S5C). These findings suggest that subtype-specific changes in the abundance of new OSNs are positively regulated by olfactory stimulation and not inhibited by a lack thereof.
scRNA-Seq and Translating Ribosome Affinity Purification Sequencing (TRAP-Seq) Analyses Support Findings That Olfactory Deprivation Selectively Reduces the Abundance of New OSNs of Specific Subtypes
To corroborate histological findings that olfactory deprivation selectively reduces the abundance of new OSNs of specific subtypes, we used two additional approaches. In the first, we used whole-tissue scRNA-seq to quantify new OSNs of specific subtypes from the open and closed sides of the OE of a mouse that was UNO treated at P14 and sacrificed at P28. Following the identification of cell clusters comprising OSNs using known genetic markers, new OSNs of specific subtypes were identified within these clusters based on their co-expression of Gap43, an established marker of immature OSNs (McIntyre et al., 2010; Verhaagen et al., 1989), and specific ORs (Figure 4A). We then categorized new OSNs according to whether they were of subtypes that had been found via histology to undergo stimulation-dependent changes in new OSN abundance (“stimulation-dependent”) or, rather, to not undergo such changes (“stimulation-independent”) (Figure 4A, bottom). Consistent with the histological findings, the scRNA-seq analyses found that new OSNs of stimulation-dependent subtypes exhibited a 3.2-fold lower abundance (normalized to the number of cells in each library) on the closed side of the OE relative to the open side (Figure 4B, left), while new OSNs of stimulation-independent subtypes showed nearly-unaltered abundance (1.1-fold higher on the closed side) (Figure 4B, right). Considering that all of the OSN subtypes that had been found via histology to undergo stimulation-dependent changes in new OSN abundance corresponded to ORs with reduced transcript levels on the closed side of the OE (Table S1), we used the scRNA-seq data to examine whether this latter category of subtypes showed stimulation-dependent changes in OSN abundance (Figure 4C). Consistent with this prediction, new OSNs of subtypes corresponding to ORs with reduced transcript levels on the closed side exhibited 1.7-fold lower abundance on the closed side of the OE compared to the open side (Figure 4C, left), while those corresponding to subtypes with elevated transcript levels showed unaltered abundance (Figure 4C, right).
Figure 4. scRNA-Seq and TRAP-Seq Analyses Support Findings That Olfactory Deprivation Selectively Reduces the Abundance of New OSNs of Specific Subtypes.

(A) scRNA-seq analysis of OE cells from mice UNO treated at P14 and dissected at P28. Top: aggregated k-means clusters of sequenced cells from the open (left) and closed (right) sides of the OE. Based on known markers, clusters 4 (red) and 5 (purple) contain the majority of OSNs in the dataset. Center: analysis of Omp (mature OSNs) and Gap43 (immature OSNs) expression in cells from the open and closed sides. Bottom: magnified view of clusters 4 and 5, showing Gap43+ OSNs of represented subtypes that were found via histology to undergo stimulation-dependent changes in new OSN abundance at P28: Olfr827, Olfr1325, Olfr855, and Olfr1357 (red circles); and control subtypes that were found not to do so: Olfr1414, Olfr711, Olfr1368, Olfr370, Olfr1336, Olfr1463, and Olfr867 (black circles).
(B) Quantification of Gap43+ OSNs of represented subtypes found via histology to undergo (left) or not undergo (right) stimulation-dependent changes in new OSN abundance at P28. (C) Quantification of Gap43+ OSNs of subtypes expressing ORs with reduced (log2 fold change < −0.5; left) or elevated (log2 fold change > 0.5; right) tissue OR transcript levels on the closed side of the OE relative to the open side (Table S1).
(D and E) Schematic (D) and experimental timeline (E) of TRAP-seq approach for profiling OR expression within new OSNs on the open and closed sides of the OE.
(F) Anti-HA-stained OE section from a P35 Ascl1-CreERT2(+/−)/Ribotag(+/+) mouse tamoxifen injected at P28/P29. Scale bar: 500 μm.
(G) Quantification of TRAP-seq transcript counts for ORs expressed in OSN subtypes found via histology to undergo (left) or to not undergo (right) stimulation-dependent changes in new OSN abundance at P28.
(H) Quantification of TRAP-seq transcript counts for ORs with reduced (log2 fold change < −0.5; left) or elevated (log2 fold change > 0.5; right) tissue OR transcript levels on the closed side of the OE relative to the open side (Table S1).
Each line represents a specific OSN subtype (B and C) or OR (G and H). p values: 2-tailed paired t test; pairs, OSN subtypes (B and C) or ORs (G and H). Error bars: SEMs.
In a second additional approach, we used TRAP-seq to profile OR expression within new OSNs following tamoxifen-induced activation of a “RiboTag” allele (Sanz et al., 2009) within Ascl1-expressing OSN progenitors (Cau et al., 1997; Kim et al., 2011; Rodriguez-Gil et al., 2015) (Figures 4D–4F). Using this approach, we sought to analyze the transcript levels of ORs corresponding to the OSN-subtype categories defined in the scRNA-seq analyses. Consistent with findings via both histology and scRNA-seq, TRAP-seq revealed that ORs corresponding to stimulation-dependent subtypes exhibited a 2.3-fold reduction in new-OSN transcript levels on the closed side of the OE (Figure 4G, left), while ORs corresponding to stimulation-independent subtypes showed nearly unaltered new OSN levels (1.1-fold lower on the closed side; Figure 4G, right). Moreover, in line with findings from scRNA-seq, the TRAP-seq analyses found that ORs with reduced whole-tissue transcript levels on the closed side of the OE exhibited a 1.9-fold reduction in new OSN transcript levels on the closed side (Figure 4H, left), while ORs with elevated whole-tissue transcript levels on the closed side showed nearly unaltered new OSN levels (1.2-fold higher on the closed side; Figure 4H, right). Although limited in their statistical power by the small number of OSNs of each subtype represented in the datasets, the results of comparisons based on both scRNA-seq and TRAP-seq support the histological findings that olfactory deprivation selectively reduces the abundance of new OSNs of a fraction of subtypes.
Olfactory Deprivation Does Not Increase the Overall Rate of Cell Death among OSNs or OSN Precursors
In principle, olfactory deprivation-induced reductions in the abundance of newly generated OSNs of specific subtypes could be due to subtype-specific reductions in either the birth rates of new OSNs or the survival of new OSNs or their precursors. In the latter case, we may expect to observe an overall higher frequency of apoptosis on the closed side of the OE compared to the open side among new OSNs or their precursors. To investigate this possibility, we compared the frequency of active-CASP3+ (Figures 5A and 5B) or TUNEL+ cells (Figures 5C and 5D) on the open and closed sides of the OE among mature OSNs, which were identified by OMP expression (Figures 5A, 5B, 5C, yellow arrows, and 5D, left), and among OSN precursors (OSN stem cells, OSN progenitors, and immature OSNs), which were identified by their basal location within the epithelium and a lack of OMP expression (Figures 5A, 5B, 5C, white arrows, and 5D, right). These analyses revealed that the frequency of apoptosis is not elevated on the closed side among mature OSNs or OSN precursors, but rather is significantly reduced within both populations (Figures 5B and 5D). These results suggest that reductions in the abundance of new OSNs of specific subtypes following olfactory deprivation are not mediated by selective apoptosis.
Figure 5. Deprivation-Induced Reductions in the Abundance of Newly Generated OSNs of Specific Subtypes Are Not Attributable to Cell Death.

(A–D) Representative images (A and C) and quantification (B and D) of OE sections from UNO-treated mice stained for OMP and either active-CASP3+ (A and B) or TUNEL+ (C and D). OSN precursors were identified by their basal location within the OE and the lack of OMP expression (white arrows; B and D, left). Mature OSNs were identified by OMP expression (yellow arrows; B and D, right). The lines and colors represent distinct sections (s) and mice (m), respectively. n (s) = 11 (B) or 14 (D); n (m) = 2. p values: 2-tailed paired t tests; pairs, individual sections. Mice were UNO treated at P14 and dissected at P35. Scale bars: 50 mm. Error bars: SEMs. (E) Plot of the average ratio of OR+/EdU+ OSNs to total open-side OR+ OSNs on the open and closed sides for the 5 OSN subtypes found to undergo stimulation-dependent changes in new OSN abundance at P28 (Olfr827, Olfr1325, Olfr855, Olfr1357, and Olfr308) as a function of OSN age (days post-EdU). Data for each subtype are normalized by the maximal frequency of OR+/EdU+ labeling for that subtype. Mice were UNO treated at P14, EdU injected at P28, and dissected at P32–P40. Error bars: SEMs.
Deprivation-Induced Changes in the Abundance of New OSNs of Specific Subtypes Are Observed Immediately following OR Expression Onset
If observed reductions in the abundance of new OSNs of specific subtypes are caused by their selective elimination, we may expect to see a gradual decrease in their relative abundance on the closed side of the OE compared to the open side. By contrast, if these reductions reflect reduced rates of production, then we would expect to observe that differences are present immediately following OSN birth and are stable over time. To investigate these alternatives, we compared the relative abundance of new OSNs of subtypes that show stimulation-dependent changes in new OSN abundance on the closed and open sides of the OE over time following EdU injection (Figure 5E). This analysis revealed that subtype-specific differences in new OSN abundance are observed immediately following OR expression (4 days post-EdU) and are stable (mean, 4.3-fold over the time points analyzed), with no significant correlation between the closed:open ratio and time (r = −0.46; p = 0.36). These findings provide additional evidence that olfactory deprivation-induced reductions in the abundance of new OSNs of specific subtypes are not mediated by their selective elimination.
Olfactory Stimulation Increases the Overall Abundance of New OSNs, Predominantly within Zones 2 and 3
In theory, stimulation-dependent increases in the production of OSNs of specific subtypes could reflect either increases in the production of these subtypes at the expense of others or, rather, independent increases in the production of these subtypes. In the former case, a similar overall abundance of new OSNs would be expected on the 2 sides of the OE following UNO, while in the latter case, a greater overall abundance of new OSNs would be expected on the open side. To investigate these alternatives, we quantified the density of total EdU+ cells within 4 broad OE zones, as defined previously (Miyamichi et al., 2005; Norlin et al., 2001; Ressler et al., 1993; Vassar et al., 1993), and found significantly (p < 0.05) higher densities on the open side compared to the closed side within zones 2 and 3 (Figures 6A–6C). In principle, the higher density of EdU+ cells on the open side within zones 2 and 3 could reflect an increased abundance of either new OSNs or label-retaining OSN precursors. To distinguish between these possibilities, we quantified the zone-specific densities of cells positive for both EdU and Omp, a marker of OSNs, and the densities of basally located cells positive for EdU and negative for Omp within the OEs of mice UNO-treated at P14, EdU injected at P28, and sacrificed at P35 (Figures 6D and 6E). Within zone 2, in which we had observed a higher overall density of EdU+ cells on the open side, we found a significantly higher density of cells positive for both Omp and EdU (p < 0.01; Figure 6D, bottom left) and a significantly greater fraction of EdU+ cells within the neuroepithelium and basal layer that were also Omp+ (p < 0.01; Figure 6D, bottom right). By contrast, we observed no significant difference in the density of basally located cells positive for EdU and negative for Omp in zone 2 (Figure 6D, bottom center). Within zone 1, in which we had observed a small but statistically insignificant difference in the overall density of EdU+ cells on the 2 sides, we found similarly small and insignificant differences in the density of cells positive for both Omp and EdU (Figure 6E, bottom left) and the fraction of EdU+ cells that were also Omp+ (Figure 6E, bottom right). As in zone 2, within zone 1 we observed no significant difference in the density of basally located cells positive for EdU and negative for Omp (Figure 6E, bottom center). These findings indicate that olfactory stimulation increases the overall abundance of new OSNs and that these changes occur predominantly within zones 2 and 3.
Figure 6. Olfactory Stimulation Increases the Overall Abundance of New OSNs, Predominantly within Zones 2 and 3.

(A–C) Representative images (A and B) and quantification (C) of EdU-stained OE sections from UNO-treated and EdU-injected mice. OSNs were quantified within paired sub-regions of the 4 OE zones (dashed boxes). The lines and colors represent distinct sections (s) and mice (m), respectively. n (s) = 9; n (m) = 3. (D and E) Representative images (top) and quantification of the density (bottom) of cells within paired sub-regions of zone 2 (D) or zone 1 (E) of OE sections stained for EdU and Omp mRNA. New OSNs (yellow arrows; bottom left) were defined as positive for both EdU and Omp. OSN precursors were defined as basally located, EdU+ and Omp−. Bottom right: fraction of EdU+ cells within the neuroepithelium and basal layer that are Omp+. The lines represent distinct sections (s); the colors represent identical sections within adjacent graphs. *p < 0. 05 (s); **p < 0. 01 (s); n.s., p > 0. 05 (s). n = 10 (D) or 6 (E) sections from 3 mice. Scale bars: 40 μm.
(F) Representative image of an OE section from a UNO-treated mouse stained for Olfr827 mRNA (red) and Olfr1463 mRNA (green).
Scale bars (A and F): 500 μm. Mice were UNO treated at P14, EdU injected at P28, and dissected at P35. p values: 2-tailed paired t tests; pairs, individual mice or sections. Error bars: SEMs.
See also Figure S6A.
The 7 OSN subtypes that we found undergo stimulation-dependent changes in new OSN abundance are distributed throughout the OE, with 2 subtypes located in zone 1 (Olfr1357 and Olfr522), 1 in zone 2 (Olfr855), 3 in zone 3 (Olfr1325, Olfr827, and Olfr308), and 1 in zone 4 (Olfr1313) (Table S1). By contrast, all 5 of the 5 OSN subtypes that exhibited elevated tissue OR transcript levels following olfactory deprivation (Olfr1414, Olfr711, Olfr1368, Olfr1336, and Olfr370, none of which undergoes stimulation-dependent changes in new OSN abundance) are located in zone 4. These results are broadly consistent with the higher concentration of stimulation-dependent changes in new OSN abundance observed within zones 2 and 3 (Figures 6A–6E), as well as with a mechanism in which olfactory stimulation increases the production of the OSNs of some subtypes that are not reciprocated by decreases in others.
Subtypes That Undergo Stimulation-Dependent Changes in New OSN Abundance Are Not Specified by Zonal Location
Considering that OSN subtypes that undergo stimulation-dependent changes in new OSN abundance appear concentrated in zones 2 and 3, we wondered whether subtypes that undergo these changes are spatially distinguished from subtypes that do not. To investigate this, we used 2-color RNA-FISH to analyze the relative locations of pairs of OSN subtypes. These analyses revealed that subtypes that undergo stimulation-dependent changes in new OSN abundance, such as those that express Olfr827 and Olfr1325, are intermingled with subtypes that do not, such as those that express Olfr1463 (Figures 6F and S6A). Thus, stimulation-dependent changes in new OSN abundance do not appear to be specified by zonal location.
Subtypes That Undergo Stimulation-Dependent Changes in New OSN Abundance Are Not Distinguished by Neuronal Activity Level
What distinguishes the fraction (~4%) of OSN subtypes that undergo stimulation-dependent changes in new OSN abundance from those that do not? We considered whether these subtypes may receive either substantially above- or below-average levels of olfactory stimulation in an unblocked OE. To address this, we used 2-color RNA-FISH to semiquantitatively measure (Huber et al., 2018) S100a5 transcript abundance, which increases with neuronal activity (Bennett et al., 2010; Fischl et al., 2014; McClintock et al., 2014; Serizawa et al., 2006) (Figure 7A), within specific OSN subtypes on the 2 sides of the OE of UNO-treated mice, normalized to the average for open-side OSNs (Figure 7B). As expected, all of the subtypes analyzed exhibited significantly (p < 0.001) reduced S100a5 mRNA levels on the closed side of the OE relative to the open side. However, the degree to which naris closure reduces S100a5 transcript levels was found to vary among OSN subtypes, perhaps reflecting the incomplete elimination of odors (Coppola et al., 1994) and the diversity of odorant affinities and odor-independent activity levels (Imai et al., 2006) among ORs. Interestingly, subtypes found to undergo stimulation-dependent changes in new OSN abundance at P28 (e.g., Olfr1325, Olfr827, and Olfr855) have open-side S100a5 levels at P35 that are close to average compared to open-side OSNs as a whole (Figures 7B, left, and 7C), indicating that activity levels are likely not a distinguishing feature of these subtypes. Notably, OSNs of the Olfr1313 subtype, which shows stimulation-dependent changes in new OSN abundance at P14 but not P28, exhibit below-average open-side levels of S100a5 mRNA at P35 (Figure 7B, center), suggesting that a specific odor required to stimulate the neurogenesis of these OSNs at P14 may be absent at P28 and P35. By contrast, OSNs of subtypes that are elevated in abundance on the closed side (e.g., Olfr1368, Olfr711, and Olfr1414), which do not undergo stimulation-dependent changes in new OSN abundance, exhibit open-side S100a5 mRNA levels that are well above average (Figures 7B, right, and 7D). These results indicate that these subtypes receive above-average levels of olfactory stimulation on the open side and that olfactory deprivation may increase their abundance by protecting them from overstimulation and thereby lengthening their lifespan (Cavallin et al., 2010; Ibarra-Soria et al., 2017; van der Linden et al., 2018). Similar results were obtained using the Kirrel2 transcript as a reporter of OSN activity (Figure S6B) (Fischl et al., 2014; Serizawa et al., 2006) (not shown).
Figure 7. OSN Subtypes That Undergo Stimulation-Dependent Changes in New OSN Abundance Are Not Distinguished by Neuronal Activity Level.

(A) An OE section from a UNO-treated mouse stained for S100a5 mRNA. Scale bar: 500 μm. (B) Quantification of 2-color RNA-FISH images of cellular S100a5 mRNA levels within specific OSN subtypes located on the 2 sides of the OE, normalized to average open-side OSNs, from mice that were UNO treated at P14 and dissected at P35. Blue, orange, and black labels: subtypes with reduced, elevated, and unchanged tissue OR transcript levels, respectively, on the closed side of the OE relative to the open. The lines and colors represent distinct sections and mice, respectively. n = 6 sections from 2 mice. Error bars: SEMs.
(C and D) Representative images of the open side of an OE section from a UNO-treated mouse stained via 2-color RNA-FISH for S100a5 mRNA (red) and Olfr1325-OSNs (C) or Olfr711-OSNs (D) (green). Arrows: OSNs of specific subtypes. Scale bar: 40 μm.
(E) Whole-tissue scRNA-seq analysis of the OE of a mouse UNO treated at P14 and dissected at P28. Top: aggregated k-means clusters of cells from the open (left) and closed (right) sides of the OE. Cluster 4 (red, boxed): mature OSNs. Center bottom: magnified views of cluster 4 showing S100a5 expression (center) and OSNs of represented subtypes found to undergo stimulation-dependent changes in new OSN abundance at P28: Olfr827, Olfr1325, and Olfr855 (stimulation dependent; red circles) and subtypes found to not undergo changes in new OSN abundance and have elevated overall abundance on the closed side of the OE at P35: Olfr1414, Olfr711, Olfr1368, and Olfr370 (stimulation independent, closed elevated; black circles) (bottom). (F) Quantification of S100a5 expression within single mature OSNs (circles) of the subtypes defined in (E) relative to the average for all mature OSNs on the open side (green line). p value: 2-tailed t test. Error bars: SEMs.
See also Figure S6B.
To corroborate the RNA-FISH-based findings, we used whole-tissue scRNA-seq to analyze S100a5 expression within individual OSNs from the open and closed sides of the OE of a mouse that was UNO treated at P14 and sacrificed at P28 (Figure 7E, top center). To enhance statistical power, we grouped OSN subtypes according to whether they undergo stimulation-dependent changes in their new OSN abundance at P28 (Figure 7E, bottom). Consistent with RNA-FISH, scRNA-seq showed that stimulation-dependent subtypes exhibit only moderate open-side levels of S100a5 (Figure 7F). Moreover, stimulation-independent subtypes that are elevated in their total OSN abundance on the closed side of the OE, exhibit S100a5 transcript levels that are, on average, ~5-fold higher than the population. These findings indicate that the ability of specific OSN subtypes to undergo stimulation-dependent changes in new OSN abundance is not determined by their normal level of neuronal activity.
DISCUSSION
Findings from a combination of histological, scRNA-seq, and TRAP-seq approaches reveal that olfactory deprivation selectively reduces the abundance of new OSNs of specific subtypes. These findings raise several mechanistic questions, the answers to which are anticipated to provide important insights into how the olfactory epithelium develops and changes based on experience.
Do Stimulation-Dependent Changes in the Abundance of Newly Generated OSNs of Specific Subtypes Reflect Altered Production or Altered Survival?
Subtype-specific reductions in the abundance of new OSNs following olfactory deprivation could reflect that either fewer OSNs of these subtypes are produced or that fewer survive following production. Two lines of evidence from our results disfavor a mechanism involving reduced survival. First, such a mechanism may be expected to increase the rate of apoptosis among new OSNs or their precursors following olfactory deprivation. In fact, however, the rates of apoptosis among both OMP− cells (OSN stem cells, OSN progenitors, and immature OSNs) and OMP+ cells (mature OSNs) are not increased, but rather reduced following deprivation (Figures 5A–5D). Second, a mechanism involving reduced survival may be expected to cause olfactory deprivation-induced reductions in new OSN abundance to become more pronounced over time as cell death proceeds. In fact, however, maximal deprivation-induced reductions are observed at the earliest time points of OSN development following OR expression onset and are stable over time (Figure 5E). Although these analyses do not completely rule out the possibility of subtype-specific reductions in the survival of new OSNs or their precursors (see Limitations of Study), they appear to favor a mechanism in which olfactory stimulation promotes the selective production of OSNs of specific subtypes.
How Might Olfactory Stimulation Promote the Production of Specific Subtypes of OSNs?
Evidence that olfactory stimulation can selectively promote the production of OSNs of specific subtypes is unexpected based on the current model of OSN neurogenesis, which predicts that the relative birth rates of distinct OSN subtypes are determined by stochastic OR choices (Khan et al., 2011; McClintock, 2015; Monahan and Lomvardas, 2015; Serizawa et al., 2003; Vassalli et al., 2011). How might our findings be explained?
One hypothesis is that olfactory stimulation can increase the neurogenesis of specific subtypes of OSNs by somehow biasing OR choice or stabilization. In this scenario, stimulation-derived signals may alter the probabilities with which OSN progenitors choose ORs, such that specific OR genes are preferentially chosen or stabilized for expression at the expense of others. In addition to its apparent incompatibility with the stochastic model of OR choice, this hypothesis is also inconsistent with 2 lines of evidence. First, olfactory stimulation significantly increases the overall rate of OSN production (Figures 6A–6E) (Cummings and Brunjes, 1994; Farbman et al., 1988; Mirich and Brunjes, 2001; Suh et al., 2006), which appears incongruous with a mechanism involving altered OR choice. Second, we have found no evidence that stimulation-dependent increases in the production of OSNs of some subtypes are reciprocated by decreases in the production of others. While all (7/7) of the OSN subtypes analyzed based on their reduced representation on the closed side of the OE were found to undergo deprivation-induced reductions in birth rate, none (0/5) of the subtypes analyzed based on elevated representation on the closed side showed corresponding increases in birth rate (Figures 3 and S4D).
A second hypothesis is that olfactory stimulation can increase the birth rates of specific OSN subtypes independently of others. In this scenario, stimulation-derived signals may promote the proliferation of mitotic OSN progenitors that are predisposed to specific OR fates. This hypothesis is consistent with the observation that olfactory stimulation increases the overall rate of OSN neurogenesis and the lack of evidence that stimulation-dependent increases in the birth rates of specific subtypes are reciprocated by decreases in others. However, OR choice is assumed to begin within postmitotic OSN precursors based on the time point at which OR expression is first detectable (Coleman et al., 2017; Fletcher et al., 2017; Rodriguez-Gil et al., 2015). Whether OR choice may precede OR expression and begin before terminal mitosis is an open question. In this regard, it is notable that LSD1, which plays a key role in OR choice (Lyons et al., 2013), is highly expressed within mitotic globose basal cells (GBCs) (Coleman et al., 2017). It is also notable that the number of GBC divisions preceding OSN neurogenesis is variable (Chen et al., 2014; Fletcher et al., 2017; Schwob et al., 2017), but how olfactory stimulation may selectively affect the proliferation of specific GBCs is unclear. Also uncertain is whether this hypothesis is compatible with the apparent expression of multiple ORs within individual OSN precursors (Fletcher et al., 2017; Hanchate et al., 2015; Saraiva et al., 2015; Scholz et al., 2016; Tan et al., 2015).
How Is the Fraction of OSN Subtypes That Undergo Stimulation-Dependent Neurogenesis Specified?
Analyses of S100a5 mRNA levels indicate that OSN subtypes that undergo stimulation-dependent neurogenesis are not distinguished by their normal levels of neuronal activity, which are close to the population average (Figure 6). Moreover, these subtypes do not appear to be distinguished by their location in the OE, as they are distributed throughout all 4 zones and are intermingled with OSN subtypes that do not undergo these changes. What, then, specifies which subtypes will undergo stimulation-dependent neurogenesis? One hypothesis is that these subtypes are specified via a hardwired developmental program. If so, then this would imply that these subtypes have physiological roles that involve a special type of adaptation. A second hypothesis is that specific OSN subtypes acquire the ability to undergo stimulation-dependent neurogenesis through experience. In this regard, it is notable that conditioning mice to associate specific odors with either aversive or appetitive stimuli has been found to cause rapid and robust increases in the abundance of OSNs that are responsive to the conditioned odors (Jones et al., 2008; Morrison et al., 2015). Although these changes have been attributed to the selective lengthening of the lifespan of specific OSNs (Jones et al., 2008; Morrison et al., 2015; Ross and Fletcher, 2019), the precise mechanism has yet to be determined.
Are Stimulation-Dependent Changes in OSN Production Mediated by Specific Odors?
To understand the mechanism and physiological function of the stimulation-dependent neurogenesis of specific OSN subtypes, it will be critical to identify the nature and sources of causative olfactory stimuli. In principle, stimulation-dependent neurogenesis could be initiated via either the activation of specific OSNs by particular odors or the global activation of the OSN population as a whole by odor and/or mechanical stimulation (Grosmaitre et al., 2007). In support of the former possibility, we have found that the degree to which different OSN subtypes undergo stimulation-dependent neurogenesis varies between P14 and P28 (Figure 3D). Specifically, we identified 2 OSN subtypes (Olfr1313 and Olfr522) that undergo stimulation-dependent neurogenesis at P14 but not P28, 1 (Olfr1325) that does so at P28 but not P14, and 2 (Olfr827 and Olfr855) that do so at both time points. The basis for the dynamics observed for Olfr1313- Olfr522-, and Olfr1325-expressing OSNs is unknown, but it is conceivable that they reflect differences in the odor environment and/or the physiology of mice at P14 and P28, which correspond to nursing and postweaning periods, respectively. Odors that promote suckling, the attraction to which is critical for neonatal survival (Brunet et al., 1996; Teicher and Blass, 1977) and requires olfactory learning (Logan et al., 2012), are expected to be among the odors differentially represented at these 2 time points. Interestingly, conditioning neonatal mice to associate an artificial odor with milk consumption has been found to increase the size of glomeruli that are innervated by OSNs responsive to the conditioned odor (Liu et al., 2016; Todrank et al., 2011; Woo et al., 1987), possibly reflecting increases in the number of responsive OSNs (Bressel et al., 2016).
Physiological Function of Stimulation-Dependent Neurogenesis of Specific OSN Subtypes
Collectively, our findings indicate that the relative neurogenesis rates of the ~1,200 OSN subtypes within the mouse OE are not fixed, but can change with altered olfactory experience. Moreover, the magnitude of these changes can be large, with some OSN subtypes exhibiting a 5-fold lower rate of production following olfactory deprivation. These differences are correlated with changes in the overall representations of the same OSN subtypes on the 2 sides of the OE, strongly suggesting a causal relationship. Thus, changes in OSN neurogenesis may be a second mechanism, in addition to altered OSN lifespan, by which the relative abundance of the ~1,200 mouse OSN subtypes can be modified by olfactory experience. Although the physiological significance of the resulting changes in OSN representation is unknown, it is conceivable that the changes reflect an adaptive mechanism that serves to adjust the sensitivity or discriminability of the OE for specific odors via alterations in the abundance of specific OSN subtypes (D’Hulst et al., 2016). It is also conceivable that they function in concert with OB neurogenesis (Lledo and Valley, 2016; Ming and Song, 2011) or altered mitral cell odor representations (Yamada et al., 2017) to establish or strengthen circuits that subserve learned olfactory associations. Thus, the findings of this study reveal that postnatal OSN neurogenesis may play a role beyond simple OSN replacement.
Limitations of Study
The results presented here indicate that olfactory stimulation promotes the neurogenesis of a fraction of OSN subtypes. In evaluating these findings, however, it is important to note the study’s limitations. First, the evidence presented that stimulation-dependent and subtype-specific changes in new OSN abundance are mediated by selective OSN production rather than cell death cannot completely exclude the latter possibility. Specifically, although observations that olfactory deprivation does not increase apoptosis among new OSNs or OSN precursors (Figures 5A–5D) appear to disfavor a mechanism involving selective cell elimination, it is formally possible that deprivation causes selective apoptosis for only a minority of subtypes, which may preclude their detection in this assay. Relatedly, although the observation that maximal deprivation-induced reductions in the abundance of new OSNs of specific subtypes are found immediately following the onset of OR expression and do not become more pronounced over time (Figure 5E) appears to disfavor a mechanism involving the selective elimination of new OSNs, this analysis cannot exclude the possibility that selective elimination occurs at a time point of OSN development before the onset of OR expression. Finally, although observations that olfactory deprivation causes zonally concentrated reductions in the overall rate of OSN neurogenesis (Figure 6) are consistent with a mechanism involving selective OSN birth, it is formally possible that observed overall reductions in neurogenesis are unrelated to observed subtype-specific reductions in new OSN abundance.
A second limitation is that although the findings via histology that a fraction of OSN subtypes undergo stimulation-dependent changes in new OSN abundance (Figure 3) are corroborated by findings via scRNA-seq and TRAP-seq (Figure 4), analyses based on the latter approaches were limited in their statistical power by the small number of new OSNs of each subtype represented within the datasets examined.
A complete mechanistic understanding of the phenomenon identified in this study is anticipated to provide additional evidence related to the hypotheses presented. Although the data presented elucidate some details of how olfactory stimulation promotes the selective production of specific OSN subtypes, critical mechanistic questions remain. Answering these is expected to contribute to our understanding of how the olfactory system develops and changes based on experience.
STAR★METHODS
RESOURCE AVAILABILITY
Lead Contact
Further information and requests for resources and reagents should be directed to and will be fulfilled by the Lead Contact, Stephen Santoro (stephen.santoro@cuanschutz.edu).
Materials Availability
All unique/stable reagents generated in this study are available upon request with a completed Materials Transfer Agreement.
Data and Code Availability
Raw and processed data from the scRNA-seq and TRAP-seq experiments described in this paper have been deposited in NCBI’s Gene Expression Omnibus (Edgar et al., 2002). The GEO SuperSeries accession number corresponding to these data is GEO: GSE157120 (https://www.ncbi.nlm.nih.gov/geo/query/acc.cgi?acc=GSE157120).
EXPERIMENTAL MODEL AND SUBJECT DETAILS
All procedures involving mice were carried out in accordance with NIH standards and approved by the University of Wyoming Institutional Animal Care and Use Committee (IACUC). For all experiments other than RiboTag, tissue samples were obtained from an equal mix of male and female C57BL/6J mice ranging in age from P21 to P56. For RiboTag experiments, tissue samples were obtained from an equal mix of male and female Ascl1-CreERT2(+/−)/Ribotag(+/+) mice, which were generated by crossing mice containing the Ascl1-CreERT2 (Ascl1tm1.1(Cre/ERT2)Jejo/J; Jackson Laboratories, stock # 012882) (Kim et al., 2011) and Ribotag (B6J.129(Cg)-Rpl22tm1.1Psam/SjJ; Jackson Laboratories, stock # 029977) (Sanz et al., 2009) alleles. Mice were weaned at P21, sex-separated, and group-housed in standard cages at a density of no more than 5 adult mice/cage. Male and female mice from the each litter were distributed randomly among experimental and control groups.
METHOD DETAILS
Unilateral naris occlusion (UNO)
For experiments in which UNO was performed at P14, pups were anesthetized using isoflurane (completeness of anesthesia confirmed through a tail pinch), and then immediately subjected to electrocautery for ~5 s on the right nostril under a dissecting microscope. For experiments in which UNO was performed at P1, pups were anesthetized by hypothermia for ~5 minutes and then immediately subjected to electrocautery for ~2 s on the right nostril under a dissecting microscope. During electocautery care was taken to avoid contact of the electrocautery unit with any non-superficial tissues. Pups were examined on a daily basis following the procedure to ensure complete blockage of the right nostril through scar formation (typically ~3–5 days after the procedure) and normal mouse development and activity.
2-Deoxy-5-ethynyluridine (EdU) injections
EdU (Carbosynth; NE08701) was administered to C57BL/6J mice (age P14 or P28) in a series of two IP injections (10 mg/mL EdU in sterile PBS; 50 mg/kg mouse body weight/injection) spaced three hours apart.
Tamoxifen injections
Tamoxifen (Alfa Aesar) was administered to Ascl1-CreERT2(+/−)/Ribotag(+/+) mice according to a modified version of a published procedure (Kim et al., 2011). Briefly, each treated mouse received a series of four IP injections (20 mg/mL in corn oil; 100 mg/kg mouse body weight/injection) over two consecutive days beginning at age P28. This procedure was found to label new OSNs throughout the OE (Figure 4F) while permitting ~90% of treated mice to survive tamoxifen administration.
In situ hybridization (ISH) probe design and production
ISH probes were designed to span 500–1000 base pairs and were targeted to CDS and/or UTR regions of each mRNA (see Table S2). Probes were designed to minimize cross-hybridization with off-target mRNAs, which was assessed using BLAST. For the detection of specific ORs, probes targeting multiple gene regions were typically generated and tested. Probe sequences were amplified by PCR using specific primers (Table S2), inserted into the pCRII-TOPO vector (ThermoFisher), and confirmed by restriction analysis and sequencing. DIG- and FITC-labeled antisense RNA probes were generated from 1 μg of linearized plasmid template using T7 or Sp6 RNA polymerases (NEB) and DIG-11-UTP (Roche) or FITC-11-UTP (Roche), treated with DNaseI (Promega), ethanol precipitated, and dissolved in a 30 μL volume of water.
One-color RNA fluorescent in situ hybridization (RNA-FISH)
OEs were dissected, placed in a cryomold containing OCT, flash-frozen, and stored at −80°C until sectioning. Tissue blocks were cut into 12-μm thick cryo-sections, placed onto slides, and stored at −80°C until staining. Slide-mounted sections were warmed (37°C, 10 min), equilibrated in phosphate-buffered saline (PBS; pH 7.2; 5 min, room temperature [RT]), fixed in paraformaldehyde (PFA; 4% in PBS; 10 min, RT), washed in PBS (3 min, RT), permeabilized with Triton X-100 (0.5% in PBS; 10 min, RT) followed by sodium dodecyl sulfate (1% in PBS; 3 min, RT), washed in PBS (3 × 3 min, RT), incubated in acetylation solution (triethanolamine [0.1 M; pH 7.5], acetic anhydride [0.25%]; 10 min, RT), washed in PBS (3 × 3 min, RT), incubated in hybridization solution (formamide [50%], SSC [5 × ], Denhardts [5 × ], yeast tRNA [250 μg/mL], herring sperm DNA [500 μg/mL], heparin [50 μg/mL], EDTA [2.5 mM], Tween-20 [0.1%], CHAPS [0.25%]; 30 min, RT), hybridized with a DIG-labeled antisense RNA probe (1:750 in hybridization solution; 16 hr, 65°C), washed with SSC (5 × ; 1 × 5 min, 65°C), washed with SSC (0.2 × ; 4 × 20 min, 65°C), incubated in H2O2 (3% in TN [Tris-HCl (0.1 M; pH 7.5), 0.15 M NaCl]; 30 min, RT), washed in TNT (Tween-20 [0.05%] in TN; 5 × 3 min, RT), incubated in TNB (Blocking Reagent [Perkin Elmer; 0.05% in TN]; 30 min, RT), incubated with anti-DIG-POD antibody (Roche; 1:1000 in TNB; 12 hr, 4°C), and washed in TNT (3 × 20 min, RT). Fluorescent signals were generated using the Tyramide Signal Amplification (TSA) Plus Fluorescein Kit (Perkin Elmer) according to the manufacturer’s instructions. Slides were washed in TNT (2 × 3 min, RT), incubated in DAPI (2 μM in TN; 3 min, RT), washed in TNT (1 × 3 min, RT), and mounted using Vectashield (Vector Laboratories).
Two-color RNA-FISH
Two-color RNA-FISH was performed as described for one-color RNA FISH, with the following modifications: Tissue sections were simultaneously hybridized with both DIG- and FITC-labeled ISH probes (1:750 each in hybridization solution). To avoid cross-hybridization of vector sequences contained within the two ISH probes, care was taken to generate both probes using clones in which the gene fragments were inserted into the vector in the same orientation. Following incubation in TNB (30 min, RT), sections were incubated with anti-FITC-POD antibody (Roche; 1:1000 in TNB; 12 hr at 4°C) and washed in TNT (3 × 20 min, RT). Fluorescent signals corresponding to the FITC-labeled probe were generated using the TSA Plus Fluorescein Kit, after which sections were washed in TNT (2 × 3 min, RT), incubated in H2O2 (3% in TN; 1 hr, RT), washed in TNT (5 × 3 min, RT), incubated with anti-DIG-POD antibody (1:1000 in TNB; 12 hr, 4°C), and washed in TNT (3 × 20 min, RT). Fluorescent signals corresponding to the DIG-labeled probe were generated using the TSA Plus Cyanine5 Kit (Perkin Elmer) according to the manufacturer’s instructions. Slides were washed in TNT (2 × 3 min, RT), incubated in DAPI (2 μM in TN; 3 min, RT), washed in TNT (1 × 3 min, RT), and mounted using Vectashield (Vector Laboratories).
One- or two-color RNA-FISH combined with EdU staining via click chemistry
Following the final TNT wash steps of either one- or two-color RNA-FISH, slides were washed in 3% BSA in PBS (2 × 5 min, RT, with gentle rocking), incubated with EdU reaction solution (4 mM CuSO4, 4μM Sulfo-Cyanine 3 Azide [Lumiprobe], 100 mM sodium ascorbate [prepared fresh], in PBS; 30 min, RT, in darkness), and washed with 3% BSA in PBS (2 × 3 min, RT). Slides were washed in TNT (2 × 3 min, RT), incubated in DAPI (2 μM in TN; 3 min, RT), washed in TNT (1 × 3 min, RT), and mounted using Vectashield (Vector Laboratories).
Immunofluorescence (HA-Rpl22)
OEs were carefully dissected from P35 Ascl1-CreERT2(+/−)/Ribotag(+/+) mice that had been tamoxifen-injected at P28/P29, immersed in ice-cold PFA (4% in PBS; overnight), decalcified in EDTA (250 mM in PBS, pH 8.5; 2 days, 4°C), and cryoprotected in sucrose (10, 20, and 30% in PBS; 2 hr, 2 hr, and overnight, respectively). Tissues were frozen in OCT on dry ice and stored at −80°C until sectioning. Tissue blocks were cut into 12-μm thick cryo-sections, placed onto slides, and stored at −80°C until staining. Slide-mounted sections were warmed (37°C, 10 min), equilibrated in PBS (5 min, RT), fixed in PFA (4% in PBS; 10 min, RT), washed in PBS (3 min, RT), subjected to epitope retrieval by submersion in 0.01M citrate (pH 6; 90°C, 20 min), washed with PBS (2 × 3 min, RT), permeabilized with Triton X-100 (0.5% in PBS; 20 min, RT), washed with PBS (3 min, RT), washed with TNT (3 × 3 min, RT), blocked in TN + 10% FBS (30 min, RT), incubated with Alexa647-conjugated anti-HA antibodies (mouse monoclonal; Biolegend; 16B12) (1:500 in TN + 10% FBS; 12 hr, 4°C), washed with TNT (3 × 15 min, RT), incubated in DAPI (2 μM in TN; 3 min, RT), washed in TNT (1 × 3 min, RT), and mounted using Vectashield (Vector Laboratories).
Combined immunohistochemistry (active-CASP3) and immunofluorescence (OMP)
Whole OEs were carefully dissected and immersed in ice-cold PFA (4% in PBS; overnight), decalcified in EDTA (250 mM in PBS, pH 8.5; 2 days, 4°C), and cryoprotected in sucrose (10, 20, and 30% in PBS; 2 hr, 2 hr, and overnight, respectively). Tissues were frozen in OCT on dry ice and stored at −80°C until sectioning. Tissue blocks were cut into 12-mm thick cryo-sections, placed onto slides, and stored at −80°C until staining. Slide-mounted sections were warmed (37°C, 10 min), equilibrated in PBS (5 min, RT), fixed in PFA (4% in PBS; 10 min, RT), washed in PBS (3 min, RT), permeabilized with Triton X-100 (0.5% in PBS; 30 min, RT), washed with PBS (3 × 3 min, RT), incubated in H2O2 (3% in TN buffer; 30 min, RT), washed with TNT (3 × 3 min, RT), blocked in TNB (30 min, RT), incubated with a mixture of anti-active-CASP3 (rabbit polyclonal; Promega; G7481) and anti-OMP (goat polyclonal; Wako) antibodies (each 1:300 in TNB; 12 hr, 4°C), washed with TNT (3 × 3 min, RT), and incubated with anti-rabbit-HRP (Jackson; 1:500 in TNB; 12 hr, 4°C). Fluorescent signals corresponding to active-CASP3 were generated using the TSA Plus Fluorescein Kit, after which sections were washed in TNT (3 × 5 min, RT), incubated with anti-goat-Cy5 (Jackson; 1:500 in TNB; 12 hr, 4°C), washed in TNT (3 × 15 min, RT), incubated in DAPI (2 μM in TN; 3 min, RT), washed in TNT (1 × 3 min, RT), and mounted using Vectashield (Vector Laboratories).
Combined TUNEL staining and immunofluorescence (OMP)
Whole OEs were carefully dissected and immersed in ice-cold PFA (4% in PBS; overnight), decalcified in EDTA (250 mM in PBS, pH 8.5; 2 days, 4°C), and cryoprotected in sucrose (10, 20, and 30% in PBS; 2 hr, 2 hr, and overnight, respectively). Tissues were frozen in OCT on dry ice and stored at −80°C until sectioning. Tissue blocks were cut into 12-mm thick cryo-sections, placed onto slides, and stored at −80°C until staining. Slide-mounted sections were warmed (37°C, 10 min), equilibrated in PBS (5 min, RT), fixed in PFA (4% in PBS; 10 min, RT), washed in PBS (3 min, RT), permeabilized with SDS (1% in PBS; 5 min, RT), washed with PBS (4 × 5 min, RT), incubated with TUNEL reaction mixture (75 μL/slide) consisting of 7.5 μL Enzyme solution and 67.5 μL Label solution (In Situ Cell Death Detection Kit; Roche; under coverslip, 37°C, 1 hr), washed with TNT (3 × 5 min, RT), incubated in H2O2 (3% in TN buffer; 30 min, RT), washed with TNT (3 × 3 min, RT), blocked in TNB (30 min, RT), incubated with a mixture of anti-FITC-POD (Roche; 1:1000) and anti-OMP (goat polyclonal; Wako; 1:500) antibodies (in TNB; 12 hr, 4°C), and washed with TNT (3 × 20 min, RT). Fluorescent signals corresponding to TUNEL labeling were amplified using the TSA Plus Fluorescein Kit, after which sections were washed in TNT (3 × 5 min, RT), incubated with anti-goat-Cy5 (Jackson; 1:500 in TNB; 12 hr, 4°C), washed in TNT (3 × 15 min, RT), incubated in DAPI (2 μM in TN; 3 min, RT), washed in TNT (1 × 3 min, RT), and mounted using Vectashield (Vector Laboratories).
Image acquisition and processing
Images were acquired using an Axio Imager M2 microscope with an automated stage and Zen Blue software (Zeiss). Mosaic images were stitched and each fluorescence channel was adjusted individually to enhance contrast and reduce background using Zen Blue software. Images were rotated and cropped using Adobe Photoshop and labeled using Adobe Illustrator (Adobe Systems).
Quality criteria for sectioned OEs
For each OE, the efficiency of UNO was determined by staining OE sections for Kirrel2 mRNA via one-color RNA-FISH and quantifying Kirrel2 mRNA intensity within three representative OE sections using Zen Blue software (Zeiss). For each section analyzed, Kirrel2 mRNA intensities were quantified within four paired regions on each side of the OE. OEs from UNO-treated mice were excluded from further analysis if the mean Kirrel2 mRNA staining intensity on the open side of the OE was not at least 3-fold greater than that on the closed side. All sections were also assessed for left-right symmetry and for intactness. Individual OE sections were excluded if they were not visually symmetrical or were less than 90% intact. No data were otherwise excluded.
Preparation of cells for single-cell RNA sequencing (scRNA-seq) analysis
OEs were carefully dissected from P28 mice that had been UNO-treated at P14 and divided in half using a clean scalpel. Each OE half was dissociated into single cells using a slightly modified version of a protocol recommended by 10X Genomics. Briefly, OEs were carefully minced using a clean razor blade, suspended in Hibernate AB Complete medium (HAB; BrainBits; HAB100) using a 1000 μL wide-bore pipette tip, transferred to a 15-mL conical tube, and allowed to settle for 1 min, after which excess HAB media was removed. Tissue was dissociated by incubation in papain solution (2 mL; 2 mg/mL papain [BrainBits; PAP] in Hibernate A-minus Calcium medium [HA-Ca; BrainBits; HACA100]; 20 min, 37°C) with periodic gentle swirling. Following careful removal of the papain solution, the dissociated tissue was re-suspended in HAB medium (2 mL), triturated 10–15 times using a fire-polished Pasteur pipette, and allowed to settle for 20 s. The supernatant containing dispersed cells was transferred to a new 15-mL conical tube, avoiding large debris, pelleted (200 RCF; 2 min, RT), re-suspended in pre-warmed NbActiv1 neuronal culturing medium (1 mL; BrainBits; NbActiv1–100), and filtered into a 1.5 mL microcentrifuge tube using a 40-μm Flowmi cell strainer (Bel-Art). Following removal of a 300-μL sample of cells for subsequent analyses, the remaining cells were cryo-preserved by addition of FBS (200 μL) and DMSO (100 μL) and stored at −80°C until submission for scRNA-seq analysis. Cell samples were evaluated for quality using a trypan blue exclusion count assay with a hemocytometer and for UNO efficiency using qPCR analysis (see below).
Single-cell 3′ RNA library preparation and sequencing
Frozen dissociated OE cell samples were submitted to Genewiz for library preparation and sequencing. Single-cell RNA libraries were generated using the Chromium Single Cell 3′ v3 Kit (10X Genomics) following Dead Cell Removal (Miltenyi). Cells were counted using a trypan blue exclusion count assay with a hemocytometer and diluted for loading onto the Chromium Controller. Loading was performed to target capture of ~10,000 Gel Beads in Emulsion (GEMs) per sample for downstream analysis, and samples were processed through the Chromium Controller following the manufacturer’s specifications. Sequencing libraries were evaluated for quality on the Agilent TapeStation (Agilent Technologies), and quantified using a Qubit 2.0 Fluorometer (ThermoFisher Scientific) and qPCR (Applied Biosystems) prior to loading onto an Illumina sequencing platform. From each sample, ~10,000 cells were sequenced to a depth of 15,000 reads/cell using a configuration compatible with the recommended guidelines as outlined by 10X Genomics. Raw sequence data (.bcl files) generated from Illumina NovaSeq 6000 were converted into FASTQ files and de-multiplexed using the 10X Genomics’ Cell Ranger mkfastq command. Subsequent UMI and cell barcode de-convolution and mapping to the genome were performed using 10X Genomics’ Cell Ranger software package (3.0.2) to generate the final digital gene expression matrices and .cloupe files. Files containing raw and processed data are accessible through GEO SubSeries accession number GEO: GSE157119 (https://www.ncbi.nlm.nih.gov/geo/query/acc.cgi?acc=GSE157119). Gene expression data corresponding to cells expressing specific ORs and Omp or Gap43 were obtained using the Loupe Cell Browser (10X Genomics). Data were filtered to eliminate barcodes associated with multiple OR genes.
Quantitative PCR (qPCR) analysis of S100a5 and Omp expression in dissociated OE cells
cDNA samples for qPCR analysis were prepared using the QuantiTect Reverse Transcription Kit (QIAGEN) starting from RNA prepared from dissociated single OE cells (150 μL) using the RNeasy Plus Micro Kit (QIAGEN). qPCR experiments were performed using the QuantiTect SYBR Green PCR Kit (QIAGEN) with a MiniOpticon instrument (Bio-Rad). Primer pairs for S100a5 and Omp (Table S2) were designed using the Primer-BLAST tool (NCBI), synthesized by Integrated DNA Technologies, and used to quantify S100a5 and Omp levels within cDNA pairs corresponding to the open and closed sides of an OE. For each sample, the ratio of S100a5 (activity-dependent expression) to Omp (activity-independent expression) was calculated. UNO was considered successful for OE sample pairs exhibiting an S100a5/Omp ratio at least 5-fold higher in the open sample compared to the closed sample.
Isolation of transcripts specific to new OSNs by translating ribosome affinity purification (TRAP)
OEs were carefully dissected from P35 Ascl1-CreERT2(+/−)/Ribotag(+/+) mice that had been UNO-treated at P14 and tamoxifen-injected at P28/P29. Dissected OEs were divided in half using a clean scalpel. Each OE half was placed in a 1.5-mL microcentrifuge tube and stored at −80°C until use in TRAP. TRAP was performed using a modified version of published protocols (Sanz et al., 2009, 2019; Shigeoka et al., 2016, 2018). Briefly, following the addition of 600 μL of ice-cold homogenization buffer (HB; 50 mM Tris [pH 7.4], 100 mM KCl, 12 mM MgCl2, 1% NP-40, 100 μg/mL cyclohexamide, 1 × protease inhibitor mixture [Sigma; P8340–5 mL], 1 mg/mL heparin, 200 U/mL RNAsin [Promega; N2115], 1 mM DTT) to each frozen half-OE sample, samples were immediately homogenized with a mechanical homogenizer (3 min, on ice). Homogenates were incubated (10 min, on ice), gently inverted ~10 times, centrifuged (5 min, 4°C, 10,000 g), transferred to a new 1.5-mL microcentrifuge tube, centrifuged (10 min, 4°C, 16,000 g), transferred to a new 1.5-mL microcentrifuge tube containing 16.7 μL of HB-washed protein A/G magnetic beads (ThermoFisher; 88803), incubated with gentle rotation (1 h, 4°C), placed on a magnetic rack on ice to collect beads, transferred to a new 1.5-mL microcentrifuge tube containing 5 μg of anti-HA antibody (Abcam; ab9110), incubated with gentle rotation (overnight, 4°C), transferred to a new 1.5-mL microcentrifuge tube containing 33.4 μL of HB-washed protein A/G magnetic beads, and incubated with gentle rotation (4 h, 4°C). Lysate-bead mixtures were placed on a magnetic rack (on ice) to collect beads, and supernatants were removed and discarded. Beads were washed 2 × 5 min with HB (200 μL/wash, 4°C, gentle rotation) and 4 × 5 min with high salt buffer (50 mM Tris [pH 7.4], 300 mM KCl, 12 mM MgCl2, 1% NP-40, 100 μg/mL cyclohexamide, 1 mM DTT; 750 μL/wash, 4°C, gentle rotation). Ribosome-bound transcripts were eluted from beads by addition of 350 μL of lysis buffer (RLT buffer from QIAGEN RNeasy kit + β-ME [10 μl/mL]), vortexing (30 s, RT), incubation (10 min, RT), vortexing (30 s, RT), and incubation (5 min, RT). Tubes were placed on a magnetic rack (RT) to remove beads, and eluates were transferred to new 1.5-mL microcentrifuge tubes. TRAP-isolated transcripts were purified from eluates using the RNeasy Plus Micro kit (QIAGEN; 74034).
RNA-seq of TRAP-isolated transcript samples
TRAP-isolated transcript samples corresponding to the open and closed sides of the OE (two replicates of each) were submitted to Genewiz for library preparation and sequencing. Libraries were prepared using the Ovation RNA-Seq System V2 kit (NuGEN) following rRNA depletion. Libraries were paired-end sequenced (2 × 150 bases) on an Illumina HiSeq instrument to a depth of ~60 million fragments/sample. FASTQ files are accessible through GEO SubSeries accession number GEO: GSE157101 (https://www.ncbi.nlm.nih.gov/geo/query/acc.cgi?acc=GSE157101). FASTQ files were analyzed using the Galaxy platform (https://usegalaxy.org) (Afgan et al., 2018). FASTQ files were processed using FASTQ groomer (Blankenberg et al., 2010), and trimmed using Trim Galore (http://www.bioinformatics.babraham.ac.uk/projects/trim_galore/) to remove adapters and Trimmomatic (Bolger et al., 2014) to remove low-quality sequences. Trimmed FASTQ files were aligned to the mouse genome using HISAT2 (Kim et al., 2015).
QUANTIFICATION AND STATISTICAL ANALYSIS
Quantification of OR+, EdU+, active-CASP3+, TUNEL+, and OMP+ cellular abundance
Cell counts corresponding to each individual mouse were determined from images of a series of 5–6 stained coronal sections located ~400 μm apart and spanning the anterior-posterior length of the OE. Counting was performed separately on the right and left side of each OE section. Counting was performed manually with the experimenter blinded to sample groups and section orientations. The open and closed sides of OEs from UNO-treated mice were determined after counting was complete using fluorescent signals corresponding to either Kirrel2 or S100a5 mRNA (on the same sections or on adjacent sections). Cells containing EdU+ nuclei (Cy3-stained) that were at least 50% overlapping with OR mRNA signals (FITC- or Cy5-stained) were considered EdU+/OR+ OSNs. TUNEL+ cells that were surrounded by OMP+ cells were considered TUNEL+/OMP+.
Quantification of TRAP-isolated transcript levels from RNA-seq data
Quantification of RNA-seq data was performed using the Galaxy platform. HISAT2-produced alignment files were quantified using featureCounts (Liao et al., 2014) and normalized using Remove Unwanted Variation (RUV) (Risso et al., 2014) based on control genes. Gene-specific transcript levels were determined from variance-stabilizing transformation (VST)-normalized count files produced by Deseq2 (Love et al., 2014) using RUV-produced batch factors. Processed TRAP-seq data are accessible through GEO SubSeries accession number GEO: GSE157101 (https://www.ncbi.nlm.nih.gov/geo/query/acc.cgi?acc=GSE157101).
Quantification of cellular OR, S100a5, and Kirrel2 mRNA levels via RNA-FISH
Cellular mRNA levels corresponding to ORs, S100a5, and Kirrel2 within specific OSN subtypes were quantified from background-corrected staining intensities obtained from images of OEs stained via RNA-FISH. For each OSN subtype, intensities were quantified (using Zen Blue software; Zeiss) within representative regions of ~20 OSNs from each of three representative paired half-sections from each of three different mice (total of ~360 OSNs/OR). Background fluorescence levels were determined from an average of three regions located outside of the olfactory epithelial tissue on each side of each section. OSN subtype-specific S100a5 and Kirrel2 intensities were normalized to the average OSN level on the open side for each section, based on intensity measurements within ~10 rectangular regions located throughout the open side of the OE.
Statistics
For all statistical analyses, a significance threshold of p < 0.05 was used. Statistical analyses of comparisons between the open and closed sides of OSN counts, OSN-type specific mRNA levels, and OR transcript levels from TRAP-seq were performed using a two-tailed paired t test, in which the two sides of each single section or OE was paired. This enabled statistical analyses of differences between the two sides independent of OSN number and staining variance between sections. For comparisons of samples between different animals, we used a two-tailed unpaired t test. Correlations were analyzed using Pearson’s correlation coefficient. Data presented in figures represent mean ± SEM.
Sample-size estimation
Results from a previous study (van der Linden et al., 2018) were used to determine an appropriate sample size for comparing the number of OR-specific OSNs on the open and closed sides of the OE. Previously, we had found that for an OR with a typical expression frequency (~0.1%) and an effect size of ~2-fold, statistically 12 OE sections taken from four different animals were sufficient to find a highly significant difference (p < 0.001; two-tailed paired t test). In the current study, the sample sizes used were typically ~3-fold larger than this. To determine total numbers of new (EdU+) OSNs in specific zones and S100a5 levels in OR-specific OSNs, we assumed that a similar sample number would be sufficient, assuming that a sufficiently large number of OSNs could be sampled per section. To determine an appropriate sample size for comparing the number of OR-specific new (EdU+ & OR+) OSNs, our preliminary studies found that injection of EdU at P28 (2 doses spaced 2 hours apart) labeled ~3% of OSNs. Due to the smaller number of cells available to be quantified, we expected that a larger sample size would be needed compared to that needed for simple OR+ analyses. For comparisons between OE sections from different animals, results from previous analyses (van der Linden et al., 2018) were again used to determine an appropriate sample size. Previously, we had found that for an OR with a typical expression frequency (~0.1%) and an effect size of ~2-fold, 20 OE sections taken from four different animals was sufficient to find a highly statistically significant difference between different animals (p < 0.01; two-tailed unpaired t test).
Supplementary Material
KEY RESOURCES TABLE
| REAGENT or RESOURCE | SOURCE | IDENTIFIER |
|---|---|---|
| Antibodies | ||
| Anti-Digoxigenin-POD, Fab fragments | Roche | Cat# 11207733910; RRID: AB_514500 |
| Anti-Fluorescein-POD, Fab fragments | Roche | Cat# 11426346910; RRID: AB_840257 |
| Anti-active-CASP3 (rabbit polyclonal | Promega | Cat# G7481; RRID: AB_430875 |
| Anti-rabbit-HRP (goat polyclonal) | Jackson Immuno | Cat# 111-035-144; RRID: AB_2307391 |
| Anti-OMP (goat polyclonal) | Wako | Cat# 544–10001; RRID: AB_664696 |
| Anti-goat-Cy5 (donkey polyclonal) | Jackson Immuno | Cat# 705-175-147; RRID: AB_2340415 |
| Anti-HA antibody (rabbit polyclonal) | Abcam | Cat# ab9110; RRID: AB_307019 |
| Alexa647-anti-HA antibodies (mouse monoclonal) | Biolegend | Cat# 682404; RRID: AB_2566616 |
| Chemicals, Peptides, and Recombinant Proteins | ||
| DIG RNA Labeling Mix, 10 × conc. | Roche | Cat# 11277073910 |
| Fluorescein RNA Labeling Mix | Roche | Cat# 11685619910 |
| 2-Deoxy-5-ethynyluridine | Carbosynth | Cat# NE08701 |
| Sulfo-Cyanine3 azide | Lumiprobe | Cat# A1330 |
| Protein A/G magnetic beads | ThermoFisher | Cat# 88803 |
| Tamoxifen | Alfa Aesar | Cat# J63509 |
| T7 RNA Polymerase | NEB | Cat# M0251L |
| Sp6 RNA Polymerase | NEB | Cat# M0207S |
| RQ1 RNase-Free DNase | Promega | Cat# M6101 |
| Vectashield | Vector Laboratories | Cat# H1000 |
| Hibernate AB Complete medium | BrainBits | Cat# HAB100 |
| Papain | BrainBits | Cat# PAP |
| Hibernate A-minus Calcium medium | BrainBits | Cat# HACA100 |
| NbActiv1 neuronal culturing medium | BrainBits | Cat# NbActiv1–100 |
| Critical Commercial Assays | ||
| Tyramide Signal Amplification Plus Fluorescein Kit | Perkin Elmer | Cat# NEL745B001KT |
| Tyramide Signal Amplification Plus Cyanine 5 Kit | Perkin Elmer | Cat# NEL741B001KT |
| In Situ Cell Death Detection Kit, Fluorescein | Roche | Cat# 11684795910 |
| TOPO TA Cloning Kit, Dual Promoter | ThermoFisher | Cat# K460040 |
| RNeasy Plus Micro Kit | QIAGEN | Cat# 74034 |
| Chromium Single Cell 3′ v3 Kit | 10X Genomics | Cat# PN-1000075 |
| Deposited Data | ||
| Effects of H2be loss of function on gene expression changes in the main olfactory epithelium (MOE) as a result of activity deprivation through unilateral naris occlusion (UNO) | (Santoro and Dulac, 2012) | GEO: GSE39516; https://www.ncbi.nlm.nih.gov/geo/query/acc.cgi?acc=GSE39516 |
| Olfactory stimulation regulates the birth of neurons that express specific odorant receptors (SuperSeries of GSE157119 and GSE157101) | Present study | GEO: GSE157120; https://www.ncbi.nlm.nih.gov/geo/query/acc.cgi?acc=GSE157120 |
| scRNA-seq of the open and closed sides of the mouse olfactory epithelium following unilateral naris occlusion (SubSeries of GSE157120) | Present study | GEO: GSE157119; https://www.ncbi.nlm.nih.gov/geo/query/acc.cgi?acc=GSE157119 |
| TRAP-seq of newly generated olfactory sensory neurons from the open and closed sides of the mouse olfactory epithelium following unilateral naris occlusion (SubSeries of GSE157120) | Present study | GEO: GSE157101; https://www.ncbi.nlm.nih.gov/geo/query/acc.cgi?acc=GSE157101 |
| Experimental Models: Organisms/Strains | ||
| Mouse: C57BL/6J | Jackson Labs | 000664 |
| Mouse: Ascl1-CreERT2 (Ascl1tm1.1(Cre/ERT2)Jejo/J) | Jackson Labs | 012882 |
| Mouse: Ribotag (B6J.129(Cg)-Rpl22tm1.1Psam/SjJ) | Jackson Labs | 029977 |
| Oligonucleotides | ||
| DNA oligonucleotide primers for cloning antisense fluorescent in situ hybridization (FISH) probes | This study | See Table S2 |
| Software and Algorithms | ||
| Zen Blue software | Zeiss | https://www.zeiss.com |
| Adobe Photoshop | Adobe | https://www.adobe.com |
| Adobe Illustrator | Adobe | https://www.adobe.com |
| Cell Ranger | 10X Genomics | https://www.10xgenomics.com |
| Loupe Cell Browser | 10X Genomics | https://www.10xgenomics.com |
| FASTQ groomer | (Blankenberg et al., 2010) | https://academic.oup.com/bioinformatics/article-lookup/doi/10.1093/bioinformatics/btq281 |
| Trim Galore | Babraham Institute | http://www.bioinformatics.babraham.ac.uk/projects/trim_galore/ |
| Trimmomatic | (Bolger et al., 2014) | http://www.usadellab.org/cms/?page=trimmomatic |
| HISAT2 | (Kim et al., 2015) | https://daehwankimlab.github.io/hisat2/ |
| featureCounts | (Liao et al., 2014) | http://bioinf.wehi.edu.au/featureCounts/ |
| Remove Unwanted Variation | (Risso et al., 2014) | https://bioconductor.org/packages/RUVSeq |
| Deseq2 | (Love et al., 2014) | https://bioconductor.org/packages/DESeq2 |
| Other | ||
| RNA FISH probes for specific ORs, S100a5, and Kirrel2 | This paper | See Table S2 |
Highlights.
Olfactory stimulation governs the numbers of new neurons bearing specific receptors
Stimulation-dependent, subtype-specific changes in new neuron numbers vary with age
Changes in new neuron numbers are attributable to altered production, not survival
Subtypes exhibiting stimulation-driven birth are not specified by zone or activity
ACKNOWLEDGMENTS
We are extremely grateful to Dr. Zach Hall for helpful discussions and for comments and suggestions on this manuscript. This article is based upon work supported by the National Institutes of Health-National Institute of General Medical Sciences (NIH-NIGMS) under grant no. 5P20GM121310 and the National Science Foundation under grant no. 1943528.
Footnotes
SUPPLEMENTAL INFORMATION
Supplemental Information can be found online at https://doi.org/10.1016/j.celrep.2020.108210.
DECLARATION OF INTERESTS
The authors declare no competing interests.
REFERENCES
- Afgan E, Baker D, Batut B, van den Beek M, Bouvier D, Cech M, Chilton J, Clements D, Coraor N, Grüning BA, et al. (2018). The Galaxy platform for accessible, reproducible and collaborative biomedical analyses: 2018 update. Nucleic Acids Res. 46 (W1), W537–W544. [DOI] [PMC free article] [PubMed] [Google Scholar]
- Bennett MK, Kulaga HM, and Reed RR (2010). Odor-evoked gene regulation and visualization in olfactory receptor neurons. Mol. Cell. Neurosci 43, 353–362. [DOI] [PMC free article] [PubMed] [Google Scholar]
- Blankenberg D, Gordon A, Von Kuster G, Coraor N, Taylor J, and Nek-rutenko A; Galaxy Team (2010). Manipulation of FASTQ data with Galaxy. Bioinformatics 26, 1783–1785. [DOI] [PMC free article] [PubMed] [Google Scholar]
- Bolger AM, Lohse M, and Usadel B (2014). Trimmomatic: a flexible trimmer for Illumina sequence data. Bioinformatics 30, 2114–2120. [DOI] [PMC free article] [PubMed] [Google Scholar]
- Bressel OC, Khan M, and Mombaerts P (2016). Linear correlation between the number of olfactory sensory neurons expressing a given mouse odorant receptor gene and the total volume of the corresponding glomeruli in the olfactory bulb. J. Comp. Neurol 524, 199–209. [DOI] [PMC free article] [PubMed] [Google Scholar]
- Brunet LJ, Gold GH, and Ngai J (1996). General anosmia caused by a targeted disruption of the mouse olfactory cyclic nucleotide-gated cation channel. Neuron 17, 681–693. [DOI] [PubMed] [Google Scholar]
- Cadiou H, Aoudé I, Tazir B, Molinas A, Fenech C, Meunier N, and Grosmaitre X (2014). Postnatal odorant exposure induces peripheral olfactory plasticity at the cellular level. J. Neurosci 34, 4857–4870. [DOI] [PMC free article] [PubMed] [Google Scholar]
- Cau E, Gradwohl G, Fode C, and Guillemot F (1997). Mash1 activates a cascade of bHLH regulators in olfactory neuron progenitors. Development 124, 1611–1621. [DOI] [PubMed] [Google Scholar]
- Cavallin MA, Powell K, Biju KC, and Fadool DA (2010). State-dependent sculpting of olfactory sensory neurons is attributed to sensory enrichment, odor deprivation, and aging. Neurosci. Lett 483, 90–95. [DOI] [PMC free article] [PubMed] [Google Scholar]
- Chen M, Tian S, Yang X, Lane AP, Reed RR, and Liu H (2014). Wnt-responsive Lgr5+ globose basal cells function as multipotent olfactory epithelium progenitor cells. J. Neurosci 34, 8268–8276. [DOI] [PMC free article] [PubMed] [Google Scholar]
- Coleman JH, Lin B, and Schwob JE (2017). Dissecting LSD1-Dependent Neuronal Maturation in the Olfactory Epithelium. J. Comp. Neurol 525, 3391–3413. [DOI] [PMC free article] [PubMed] [Google Scholar]
- Coppola DM (2012). Studies of olfactory system neural plasticity: the contribution of the unilateral naris occlusion technique. Neural Plast. 2012, 351752. [DOI] [PMC free article] [PubMed] [Google Scholar]
- Coppola DM, and Waggener CT (2012). The effects of unilateral naris occlusion on gene expression profiles in mouse olfactory mucosa. J. Mol. Neurosci 47, 604–618. [DOI] [PubMed] [Google Scholar]
- Coppola DM, Coltrane JA, and Arsov I (1994). Retronasal or internasal olfaction can mediate odor-guided behaviors in newborn mice. Physiol. Behav 56, 729–736. [DOI] [PubMed] [Google Scholar]
- Cummings DM, and Brunjes PC (1994). Changes in cell proliferation in the developing olfactory epithelium following neonatal unilateral naris occlusion. Exp. Neurol 128, 124–128. [DOI] [PubMed] [Google Scholar]
- D’Hulst C, Mina RB, Gershon Z, Jamet S, Cerullo A, Tomoiaga D, Bai L, Belluscio L, Rogers ME, Sirotin Y, and Feinstein P (2016). MouSensor: A Versatile Genetic Platform to Create Super Sniffer Mice for Studying Human Odor Coding. Cell Rep. 16, 1115–1125. [DOI] [PubMed] [Google Scholar]
- Dias BG, and Ressler KJ (2014). Parental olfactory experience influences behavior and neural structure in subsequent generations. Nat. Neurosci 17, 89–96. [DOI] [PMC free article] [PubMed] [Google Scholar]
- Edgar R, Domrachev M, and Lash AE (2002). Gene Expression Omnibus: NCBI gene expression and hybridization array data repository. Nucleic Acids Res. 30, 207–210. [DOI] [PMC free article] [PubMed] [Google Scholar]
- Farbman AI, Brunjes PC, Rentfro L, Michas J, and Ritz S (1988). The effect of unilateral naris occlusion on cell dynamics in the developing rat olfactory epithelium. J. Neurosci 8, 3290–3295. [DOI] [PMC free article] [PubMed] [Google Scholar]
- Fischl AM, Heron PM, Stromberg AJ, and McClintock TS (2014). Activity-dependent genes in mouse olfactory sensory neurons. Chem. Senses 39, 439–449. [DOI] [PMC free article] [PubMed] [Google Scholar]
- Fletcher RB, Das D, Gadye L, Street KN, Baudhuin A, Wagner A, Cole MB, Flores Q, Choi YG, Yosef N, et al. (2017). Deconstructing Olfactory Stem Cell Trajectories at Single-Cell Resolution. Cell Stem Cell 20, 817–830.e8. [DOI] [PMC free article] [PubMed] [Google Scholar]
- Grosmaitre X, Santarelli LC, Tan J, Luo M, and Ma M (2007). Dual functions of mammalian olfactory sensory neurons as odor detectors and mechanical sensors. Nat. Neurosci 10, 348–354. [DOI] [PMC free article] [PubMed] [Google Scholar]
- Hanchate NK, Kondoh K, Lu Z, Kuang D, Ye X, Qiu X, Pachter L, Trapnell C, and Buck LB (2015). Single-cell transcriptomics reveals receptor transformations during olfactory neurogenesis. Science 350, 1251–1255. [DOI] [PMC free article] [PubMed] [Google Scholar]
- Huber D, Voith von Voithenberg L, and Kaigala GV (2018). Fluorescence in situ hybridization (FISH): history, limitations and what to expect from micro-scale FISH? Micro Nano Eng. 1, 15–24. [Google Scholar]
- Ibarra-Soria X, Nakahara TS, Lilue J, Jiang Y, Trimmer C, Souza MA, Netto PH, Ikegami K, Murphy NR, Kusma M, et al. (2017). Variation in olfactory neuron repertoires is genetically controlled and environmentally modulated. eLife 6, e21476. [DOI] [PMC free article] [PubMed] [Google Scholar]
- Imai T, Suzuki M, and Sakano H (2006). Odorant receptor-derived cAMP signals direct axonal targeting. Science 314, 657–661. [DOI] [PubMed] [Google Scholar]
- Jones SV, Choi DC, Davis M, and Ressler KJ (2008). Learning-dependent structural plasticity in the adult olfactory pathway. J. Neurosci 28, 13106–13111. [DOI] [PMC free article] [PubMed] [Google Scholar]
- Khan M, Vaes E, and Mombaerts P (2011). Regulation of the probability of mouse odorant receptor gene choice. Cell 147, 907–921. [DOI] [PubMed] [Google Scholar]
- Kim EJ, Ables JL, Dickel LK, Eisch AJ, and Johnson JE (2011). Ascl1 (Mash1) defines cells with long-term neurogenic potential in subgranular and subventricular zones in adult mouse brain. PLOS ONE 6, e18472. [DOI] [PMC free article] [PubMed] [Google Scholar]
- Kim D, Langmead B, and Salzberg SL (2015). HISAT: a fast spliced aligner with low memory requirements. Nat. Methods 12, 357–360. [DOI] [PMC free article] [PubMed] [Google Scholar]
- Kondo K, Suzukawa K, Sakamoto T, Watanabe K, Kanaya K, Ushio M, Yamaguchi T, Nibu K, Kaga K, and Yamasoba T (2010). Age-related changes in cell dynamics of the postnatal mouse olfactory neuroepithelium: cell proliferation, neuronal differentiation, and cell death. J. Comp. Neurol 518, 1962–1975. [DOI] [PubMed] [Google Scholar]
- Liao Y, Smyth GK, and Shi W (2014). featureCounts: an efficient general purpose program for assigning sequence reads to genomic features. Bioinformatics 30, 923–930. [DOI] [PubMed] [Google Scholar]
- Liu A, Savya S, and Urban NN (2016). Early Odorant Exposure Increases the Number of Mitral and Tufted Cells Associated with a Single Glomerulus. J. Neurosci 36, 11646–11653. [DOI] [PMC free article] [PubMed] [Google Scholar]
- Lledo P-M, and Valley M (2016). Adult Olfactory Bulb Neurogenesis. Cold Spring Harb. Perspect. Biol 8, a018945. [DOI] [PMC free article] [PubMed] [Google Scholar]
- Logan DW, Brunet LJ, Webb WR, Cutforth T, Ngai J, and Stowers L (2012). Learned recognition of maternal signature odors mediates the first suckling episode in mice. Curr. Biol 22, 1998–2007. [DOI] [PMC free article] [PubMed] [Google Scholar]
- Love MI, Huber W, and Anders S (2014). Moderated estimation of fold change and dispersion for RNA-seq data with DESeq2. Genome Biol. 15, 550. [DOI] [PMC free article] [PubMed] [Google Scholar]
- Lyons DB, Allen WE, Goh T, Tsai L, Barnea G, and Lomvardas S (2013). An epigenetic trap stabilizes singular olfactory receptor expression. Cell 154, 325–336. [DOI] [PMC free article] [PubMed] [Google Scholar]
- Mackay-Sim A, and Kittel P (1991). Cell dynamics in the adult mouse olfactory epithelium: a quantitative autoradiographic study. J. Neurosci 11, 979–984. [DOI] [PMC free article] [PubMed] [Google Scholar]
- McClintock TS (2015). Odorant Receptor Gene Choice. ChemoSense 16, 3–13. [PMC free article] [PubMed] [Google Scholar]
- McClintock TS, Adipietro K, Titlow WB, Breheny P, Walz A, Mombaerts P, and Matsunami H (2014). In vivo identification of eugenol-responsive and muscone-responsive mouse odorant receptors. J. Neurosci 34, 15669–15678. [DOI] [PMC free article] [PubMed] [Google Scholar]
- McIntyre JC, Titlow WB, and McClintock TS (2010). Axon growth and guidance genes identify nascent, immature, and mature olfactory sensory neurons. J. Neurosci. Res 88, 3243–3256. [DOI] [PMC free article] [PubMed] [Google Scholar]
- Ming G-L, and Song H (2011). Adult neurogenesis in the mammalian brain: significant answers and significant questions. Neuron 70, 687–702. [DOI] [PMC free article] [PubMed] [Google Scholar]
- Mirich JM, and Brunjes PC (2001). Activity modulates neuronal proliferation in the developing olfactory epithelium. Brain Res. Dev. Brain Res 127, 77–80. [DOI] [PubMed] [Google Scholar]
- Miyamichi K, Serizawa S, Kimura HM, and Sakano H (2005). Continuous and overlapping expression domains of odorant receptor genes in the olfactory epithelium determine the dorsal/ventral positioning of glomeruli in the olfactory bulb. J. Neurosci 25, 3586–3592. [DOI] [PMC free article] [PubMed] [Google Scholar]
- Monahan K, and Lomvardas S (2015). Monoallelic expression of olfactory receptors. Annu. Rev. Cell Dev. Biol 31, 721–740. [DOI] [PMC free article] [PubMed] [Google Scholar]
- Morrison FG, Dias BG, and Ressler KJ (2015). Extinction reverses olfactory fear-conditioned increases in neuron number and glomerular size. Proc. Natl. Acad. Sci. USA 112, 12846–12851. [DOI] [PMC free article] [PubMed] [Google Scholar]
- Norlin EM, Alenius M, Gussing F, Hägglund M, Vedin V, and Bohm S (2001). Evidence for gradients of gene expression correlating with zonal topography of the olfactory sensory map. Mol. Cell. Neurosci 18, 283–295. [DOI] [PubMed] [Google Scholar]
- Opendak M, and Gould E (2015). Adult neurogenesis: a substrate for experience-dependent change. Trends Cogn. Sci 19, 151–161. [DOI] [PubMed] [Google Scholar]
- Ressler KJ, Sullivan SL, and Buck LB (1993). A zonal organization of odorant receptor gene expression in the olfactory epithelium. Cell 73, 597–609. [DOI] [PubMed] [Google Scholar]
- Risso D, Ngai J, Speed TP, and Dudoit S (2014). Normalization of RNA-seq data using factor analysis of control genes or samples. Nat. Biotechnol 32, 896–902. [DOI] [PMC free article] [PubMed] [Google Scholar]
- Rodriguez-Gil DJ, Bartel DL, Jaspers AW, Mobley AS, Imamura F, and Greer CA (2015). Odorant receptors regulate the final glomerular coalescence of olfactory sensory neuron axons. Proc. Natl. Acad. Sci. USA 112, 5821–5826. [DOI] [PMC free article] [PubMed] [Google Scholar]
- Ross JM, and Fletcher ML (2019). Aversive learning-induced plasticity throughout the adult mammalian olfactory system: insights across development. J. Bioenerg. Biomembr 51, 15–27. [DOI] [PMC free article] [PubMed] [Google Scholar]
- Santoro SW, and Dulac C (2012). The activity-dependent histone variant H2BE modulates the life span of olfactory neurons. eLife 1, e00070. [DOI] [PMC free article] [PubMed] [Google Scholar]
- Sanz E, Yang L, Su T, Morris DR, McKnight GS, and Amieux PS (2009). Cell-type-specific isolation of ribosome-associated mRNA from complex tissues. Proc. Natl. Acad. Sci. USA 106, 13939–13944. [DOI] [PMC free article] [PubMed] [Google Scholar]
- Sanz E, Bean JC, Carey DP, Quintana A, and McKnight GS (2019). RiboTag: Ribosomal Tagging Strategy to Analyze Cell-Type-Specific mRNA Expression In Vivo. Curr. Protoc. Neurosci 88, e77. [DOI] [PMC free article] [PubMed] [Google Scholar]
- Saraiva LR, Ibarra-Soria X, Khan M, Omura M, Scialdone A, Mombaerts P, Marioni JC, and Logan DW (2015). Hierarchical deconstruction of mouse olfactory sensory neurons: from whole mucosa to single-cell RNA-seq. Sci. Rep 5, 18178. [DOI] [PMC free article] [PubMed] [Google Scholar]
- Scholz P, Kalbe B, Jansen F, Altmueller J, Becker C, Mohrhardt J, Schreiner B, Gisselmann G, Hatt H, and Osterloh S (2016). Transcriptome Analysis of Murine Olfactory Sensory Neurons during Development Using Single Cell RNA-Seq. Chem. Senses 41, 313–323. [DOI] [PubMed] [Google Scholar]
- Schwob JE, Jang W, Holbrook EH, Lin B, Herrick DB, Peterson JN, and Hewitt Coleman J (2017). Stem and progenitor cells of the mammalian olfactory epithelium: taking poietic license. J. Comp. Neurol 525, 1034–1054. [DOI] [PMC free article] [PubMed] [Google Scholar]
- Serizawa S, Miyamichi K, Nakatani H, Suzuki M, Saito M, Yoshihara Y, and Sakano H (2003). Negative feedback regulation ensures the one receptor-one olfactory neuron rule in mouse. Science 302, 2088–2094. [DOI] [PubMed] [Google Scholar]
- Serizawa S, Miyamichi K, Takeuchi H, Yamagishi Y, Suzuki M, and Sakano H (2006). A neuronal identity code for the odorant receptor-specific and activity-dependent axon sorting. Cell 127, 1057–1069. [DOI] [PubMed] [Google Scholar]
- Shigeoka T, Jung H, Jung J, Turner-Bridger B, Ohk J, Lin JQ, Amieux PS, and Holt CE (2016). Dynamic Axonal Translation in Developing and Mature Visual Circuits. Cell 166, 181–192. [DOI] [PMC free article] [PubMed] [Google Scholar]
- Shigeoka T, Jung J, Holt CE, and Jung H (2018). Axon-TRAP-RiboTag: Affinity Purification of Translated mRNAs from Neuronal Axons in Mouse In Vivo. Methods Mol. Biol 1649, 85–94. [DOI] [PubMed] [Google Scholar]
- Suh KS, Kim SY, Bae YC, Ronnett GV, and Moon C (2006). Effects of unilateral naris occlusion on the olfactory epithelium of adult mice. Neuroreport 17, 1139–1142. [DOI] [PubMed] [Google Scholar]
- Tan L, Li Q, and Xie XS (2015). Olfactory sensory neurons transiently express multiple olfactory receptors during development. Mol. Syst. Biol 11, 844. [DOI] [PMC free article] [PubMed] [Google Scholar]
- Teicher MH, and Blass EM (1977). First suckling response of the newborn albino rat: the roles of olfaction and amniotic fluid. Science 198, 635–636. [DOI] [PubMed] [Google Scholar]
- Todrank J, Heth G, and Restrepo D (2011). Effects of in utero odorant exposure on neuroanatomical development of the olfactory bulb and odour preferences. Proc. Biol. Sci 278, 1949–1955. [DOI] [PMC free article] [PubMed] [Google Scholar]
- van der Linden C, Jakob S, Gupta P, Dulac C, and Santoro SW (2018). Sex separation induces differences in the olfactory sensory receptor repertoires of male and female mice. Nat. Commun 9, 5081. [DOI] [PMC free article] [PubMed] [Google Scholar]
- Vassalli A, Feinstein P, and Mombaerts P (2011). Homeodomain binding motifs modulate the probability of odorant receptor gene choice in transgenic mice. Mol. Cell. Neurosci 46, 381–396. [DOI] [PMC free article] [PubMed] [Google Scholar]
- Vassar R, Ngai J, and Axel R (1993). Spatial segregation of odorant receptor expression in the mammalian olfactory epithelium. Cell 74, 309–318. [DOI] [PubMed] [Google Scholar]
- Verhaagen J, Oestreicher AB, Gispen WH, and Margolis FL (1989). The expression of the growth associated protein B50/GAP43 in the olfactory system of neonatal and adult rats. J. Neurosci 9, 683–691. [DOI] [PMC free article] [PubMed] [Google Scholar]
- von der Weid B, Rossier D, Lindup M, Tuberosa J, Widmer A, Col JD, Kan C, Carleton A, and Rodriguez I (2015). Large-scale transcriptional profiling of chemosensory neurons identifies receptor-ligand pairs in vivo. Nat. Neurosci 18, 1455–1463. [DOI] [PubMed] [Google Scholar]
- Watt WC, Sakano H, Lee ZY, Reusch JE, Trinh K, and Storm DR (2004). Odorant stimulation enhances survival of olfactory sensory neurons via MAPK and CREB. Neuron 41, 955–967. [DOI] [PubMed] [Google Scholar]
- Woo CC, Coopersmith R, and Leon M (1987). Localized changes in olfactory bulb morphology associated with early olfactory learning. J. Comp. Neurol 263, 113–125. [DOI] [PubMed] [Google Scholar]
- Yamada Y, Bhaukaurally K, Madarász TJ, Pouget A, Rodriguez I, and Carleton A (2017). Context- and Output Layer-Dependent Long-Term Ensemble Plasticity in a Sensory Circuit. Neuron 93, 1198–1212.e5. [DOI] [PMC free article] [PubMed] [Google Scholar]
- Yu CR, and Wu Y (2017). Regeneration and rewiring of rodent olfactory sensory neurons. Exp. Neurol 287, 395–408. [DOI] [PubMed] [Google Scholar]
- Zhao H, and Reed RR (2001). X inactivation of the OCNC1 channel gene reveals a role for activity-dependent competition in the olfactory system. Cell 104, 651–660. [DOI] [PubMed] [Google Scholar]
- Zhao S, Tian H, Ma L, Yuan Y, Yu CR, and Ma M (2013). Activity-dependent modulation of odorant receptor gene expression in the mouse olfactory epithelium. PLOS ONE 8, e69862. [DOI] [PMC free article] [PubMed] [Google Scholar]
Associated Data
This section collects any data citations, data availability statements, or supplementary materials included in this article.
Supplementary Materials
Data Availability Statement
Raw and processed data from the scRNA-seq and TRAP-seq experiments described in this paper have been deposited in NCBI’s Gene Expression Omnibus (Edgar et al., 2002). The GEO SuperSeries accession number corresponding to these data is GEO: GSE157120 (https://www.ncbi.nlm.nih.gov/geo/query/acc.cgi?acc=GSE157120).