Abstract
Objective
To evaluate the diagnostic value of apolipoprotein E (APOE) gene in Alzheimer's disease (AD).
Methods
Databases including PubMed, EMBASE, Google Scholar, Wanfang Med online, China National Knowledge Infrastructure (CNKI), and China Biomedical Literature Database (CBM) were searched for literatures in English or Chinese. No limitations on the date. The sensitivity, specificity, likelihood ratio, and diagnostic odds ratio were pooled for meta-analysis. The symmetric receiver operator characteristic curve (SROC) and Fagan's Nomogram were drawn, and metaregression and subgroup analysis were used to explore the source of heterogeneity.
Results
A total of 13 studies, including 2662 cases and 8843 controls, were analyzed. The combined sensitivity (SEN) was 0.62 (95% CI (0.58-0.66)), specificity (SPE) was 0.84 (95% CI (0.81-0.86)), the positive likelihood ratio was 3.8 (95% CI (3.3-4.3)), and the negative likelihood ratio was 0.45 (95% CI (0.41-0.49)). The area under the ROC curve was 0.80, and the diagnostic ratio (DOR) was 8. Neither publication bias was detected in Deeks' funnel plot, nor threshold effect was shown in the SROC. Metaregression analysis showed that the diagnostic methods, experimental design, and sample size contributed to the heterogeneity in SEN, while the diagnostic methods, experimental design, blind evaluation on test results, and sample size contributed to the heterogeneity in SPE. When the pretest probability was set as 50%, the posterior probability in Fagan's Nomogram was 79%, the positive likelihood ratio (LRP) was 5, and the negative likelihood ratio (LRN) was 0.42.
Conclusions
AD could neither be confirmed nor excluded by the APOE genotype test. The sensitivity and specificity of the APOE gene test were relatively low in the diagnosis of AD. The diagnostic value of APOE ε4 gene in AD was moderate; it might play an important role in the prevention of AD.
1. Introduction
Alzheimer's disease (AD), known as primary Alzheimer's disease, is a progressive neurodegenerative disease with occult onset, accounting for 50%-60% of all types of dementia [1]. An epidemiological survey in four major cities including Beijing, Shanghai, Chengdu, and Xi'an showed that the prevalence of AD in the elderly (>65 years old) was 3.4% in males, 7.7% in females, and 5.9% in total [2]. The main clinical manifestations of AD are memory disorder, cognitive dysfunction, language disorder, and personality and behavior changes, which seriously affect the quality of life of patients and their families with burden of care. For the aging China, the number of AD patients is rising to the peak year by year, while the treatment rate is very low [3]. Therefore, the work in AD prevention and treatment has been one of the key tasks for the government and the medical community.
At present, the etiology of AD has not been fully understood. Amyloid cascade hypothesis is widely accepted. This theory proposes that amyloid-beta (β-amyloid protein (Aβ)) is the key point [4]. The accumulation of Aβ sets off a series of events which has toxic effects on peripheral synapses and neurons that results in the death of brain cells and, eventually, Alzheimer's disease [5]. Apolipoprotein E (ApoE) is closely related to Aβ metabolism in the central nervous system, and the subtype can significantly affect the age spots formed by Aβ deposition. The best characterized APOE-associated risk for AD is due to the ε4 allele, which is an important risk factor. And ε2 has a protective effect on Alzheimer's disease, commonly known as “longevity factor” [6]. At present, APOE genotype has been used as an assistant diagnosis of AD in clinical practice, but its diagnostic value has not been reported in detail. In this research, the diagnostic value of APOE ε4 on AD will be studied by meta-analysis; a quantitative reference for clinical practice will also be provided.
2. Materials and Methods
2.1. Inclusion and Exclusion Criteria
2.1.1. Inclusion Criteria
The research content includes the application of APOE genotype detection in patients with Alzheimer's disease
The mental detection scale was recommended by the research group for imaging, histopathology and/or national guidelines, such as the World Health Organization's International Classification of Diseases, 10th Edition (ICD-10), the American Manual of The Diagnostic and Statistical Manual of Mental Disorders (DSM), and the National Neurolinguistic Disorder of the United States. According to the diagnostic criteria of National Institute of Neurological and Communicative Disorders and Stroke-Alzheimer's Disease and Related Disorders Association (NINCDS-ADRDA), and Classification and Diagnostic Criteria of Mental Disorders in China(CCMD), the patients with Alzheimer's disease (including mild, moderate, and severe ones) were diagnosed
The control group was the elderly without neurodegenerative diseases who had no significant difference in age and gender
Each APOE genotype was reported by exact cases: (ε2/ε2, ε2/ε3, ε3/ε3, ε2/ε4, ε3/ε4, and ε4/ε4, where ε2/ε2, ε2/ε3, ε3/ε3, and ε2/ε4 were considered negative, and ε3/ε4 and ε4/ε4 were considered positive)
2.1.2. Exclusion Criteria
The exclusion criteria were as follows: (1) review, case report, and animal experiment; (2) repeated study; (3) study with incomplete data, unable to calculate the four grid data (i.e., the numbers of true positive, false positive, false negative, and true negative cases); and (4) not Chinese or English.
2.2. Search Strategy and Article Selection
The following search databases were used: PubMed, EMBASE, Google Scholar, Wanfang Med online, CNKI, and CBM. The searching time was up to December 2017. The search term was “APOE and Alzheimer's disease.”
2.3. Data Extraction and Quality Assessment
Two evaluators independently screened and extracted the literature according to the acceptance and discharge criteria and cross-checked them. The content of data extraction includes article title, name of the first author, publication period, research country and race, diagnostic standard, total number of samples, experimental design, and four grid table data.
According to the quality assessment of diagnostic accuracy studies-2 (QUADAS-2), 14 items were evaluated according to the three criteria of “yes,” “no,” or “unclear”: “1” point for “yes,” “-1” point for “no,” and 0 point for unclear.
2.4. Statistical Analysis
The Midas command package of Stata 12.0 software was used to realize the meta-analysis of diagnostic accuracy data. Midas command uses the bivariate model to calculate the combined sensitivity (SEN), specificity (SPE), positive likelihood ratio (PLR), negative likelihood ratio (NLR), and diagnostic ratio (DOR) and draw the SROC curve to estimate the total diagnostic accuracy of the test. Fagan diagram is used to test the posttest probability. Q-test and I2 were used to evaluate the degree of heterogeneity between studies. If I2 was more than 50%, heterogeneity was considered.
If there is heterogeneity caused by nonthreshold effect, univariate regression analysis and subgroup analysis are used to explore the source of heterogeneity. In this study, the source of heterogeneity is mainly considered from the following aspects: diagnostic criteria, test design, blind evaluation of test results, and sample size. Publication bias was detected by Deeks' funnel chart.
3. Results
3.1. Flow Chart and Study Quality
407 papers (including documents, reviews, animal experiments, case reports, and repeated studies) were retrieved from each database; 367 of the non-Chinese or English papers were kicked out after abstract reading. The full text of remaining 40 were extracted. 30 studies with incomplete data in four tables were removed after reading the full text. The remaining 10 papers were extracted from the corresponding data according to the data extraction requirements. Because Ganguli et al. reported Indian data of two regions and Tang et al. reported data of black, white, and Hispanic Americans, 13 data were included in this study. The literature screening process can be seen in Figure 1. The basic characteristics and QUADAS-2 scores of each study included can be seen in Table 1.
Figure 1.
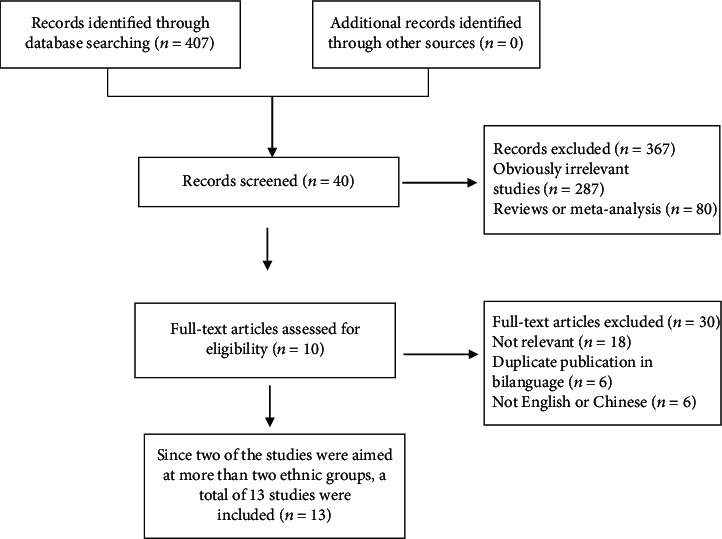
Literature screening process of the meta-analysis.
Table 1.
Main characteristics of the studies included in the meta-analysis.
| Study | Year | Country | Ethnicity | The way for diagnosis | Number of true positive cases | Number of false positive cases | False negative cases | True negative cases | The design of experiment | The blind method | QUADAS-2 score |
|---|---|---|---|---|---|---|---|---|---|---|---|
| Zheng [7] | 2014 | China | Asian | CCMD-3 | 76 | 19 | 42 | 90 | Case-control | NM | 10 |
| Zhou [8] | 2011 | China | Asian | CMMSE | 209 | 31 | 149 | 220 | Case-control | NM | 9 |
| Sando [9] | 2008 | Norway | Caucasian | NINCDS-ADRDA | 376 | 125 | 160 | 561 | Case-control | NM | 10 |
| Sunderland [10] | 2004 | USA | Whites | MMSE, CDR, GDS, DRS | 150 | 52 | 63 | 142 | Cross-sectional | NM | 10 |
| Lai [11] | 2001 | China | Asian | DSM-III-R, NINCDS-ADRDA | 110 | 61 | 97 | 518 | Cross-sectional | NM | 10 |
| Ganguli [12] | 2000 | USA | Monongahela Valley | NINCDS-ADRDA | 247 | 107 | 184 | 639 | Case-control | YES | 11 |
| Ganguli [12] | 2000 | USA | Ballabgarh | NINCDS-ADRDA | 64 | 581 | 62 | 4386 | Case-control | YES | 11 |
| Tang [13] | 1998 | USA | African Americans | CDR | 53 | 45 | 36 | 128 | Cross-sectional | NM | 10 |
| Tang [13] | 1998 | USA | Whites | CDR | 23 | 49 | 17 | 214 | Cross-sectional | NM | 10 |
| Tang [13] | 1998 | USA | Hispanics | CDR | 145 | 115 | 110 | 516 | Cross-sectional | NM | 10 |
| Nunomura [14] | 1996 | Japan | Asian | CT/MRI, ICD-10 | 72 | 12 | 36 | 83 | Case-control | NM | 9 |
| Xiao [15] | 1994 | Japan | Asian | NINCDS-ADRDA | 88 | 15 | 38 | 93 | Case-control | NM | 10 |
| Rebeck [16] | 1993 | USA | Whites | Biopsy | 39 | 6 | 16 | 35 | Case-control | NM | 8 |
CMMSE: Chinese Mini-Mental State Examination; CCMD-3: Chinese Classification and Diagnosis of Mental Diseases-3rd; NINCDS-ADRDA: National Institute of Neurological and Communicative Disorders and Stroke-Alzheimer's Disease and Related Disorders Association; ICD-10: International Classification of Diseases 10th Edition; MMSE: Mini-Mental State Examination; CDR: Clinical Dementia Rating; GDS: Global Deterioration Scale; DRS: Dementia Rating Scale; DSM-III-R: Diagnostic and Statistical Manual of Mental Disorders-III-R; CT: Computed Tomography; MRI: Magnetic Resonance Imaging; NM: not mentioned.
3.2. Statistical Analysis
3.2.1. Consolidation Statistics
The meta-analysis of diagnostic accuracy data was realized by using Stata Midas command. The combined sensitivity was 0.62 (95% CI (0.58, 0.66)), specificity was 0.84 (95% CI (0.81, 0.86)), positive likelihood ratio was 3.8 (95% CI (3.3, 4.3)), negative likelihood ratio was 0.45 (95% CI (0.41, 0.49)), area under ROC curve was 0.80, and diagnostic ratio (DOR) was 8, which indicated the APOE ε4 has a medium value in the diagnosis of AD. The test of heterogeneity is I2 = 97, highly heterogeneous. The details of combined sensitivity and specificity forest can be seen in Figure 2(a), the combined likelihood ratio forest in Figure 2(b), and the combined diagnosis ratio forest in Figure 2(c).
Figure 2.
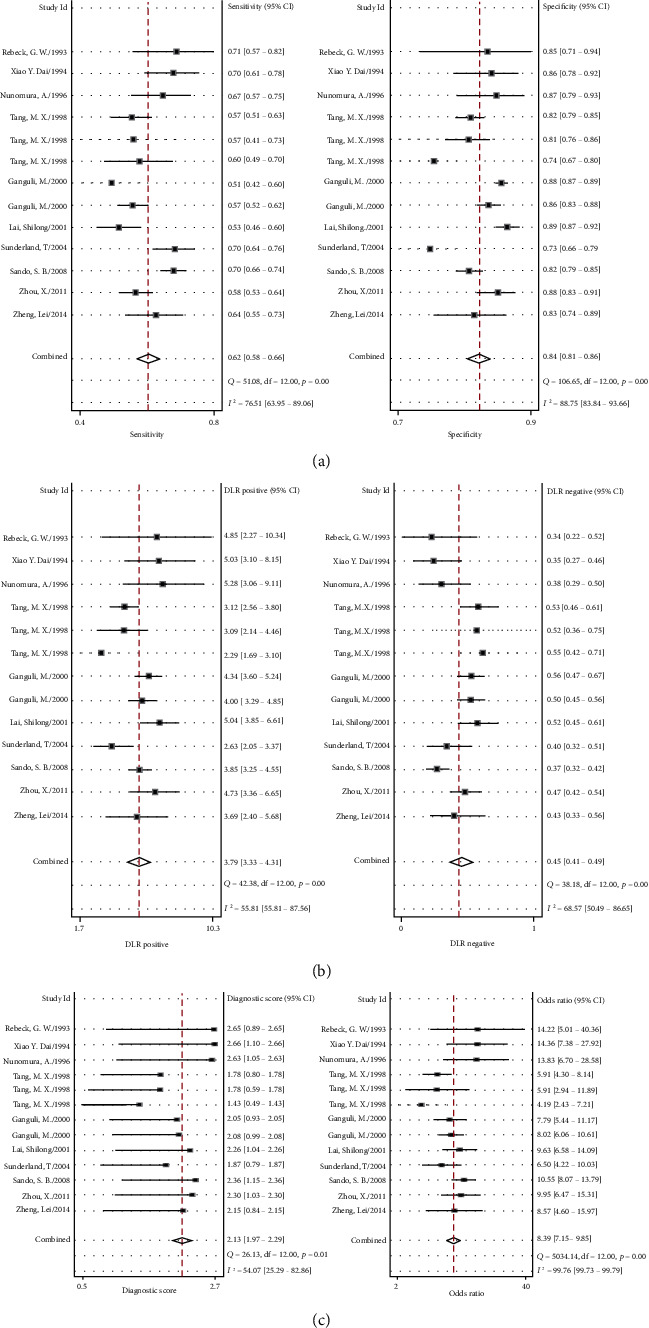
(a) Forest plot of sensitivity and specificity of APOE genotype in the diagnosis of Alzheimer's disease. (b) Forest plot of DLR positive and negative of Alzheimer's disease. (c) Forest map of the diagnostic odds ratio of APOE genotype in Alzheimer's disease.
3.2.2. Publication Bias
Midas used linear regression to test funnel asymmetry to evaluate publication bias. The digital results showed that the linear regression test p was 0.991, indicating that there was no asymmetry in funnel diagram (p < 0.01; the difference was statistically significant). The possibility of publishing bias was very small since the angle between the regression line and the horizontal axis (DOR axis) was very close to 90°; the details can be seen in Figure 3.
Figure 3.
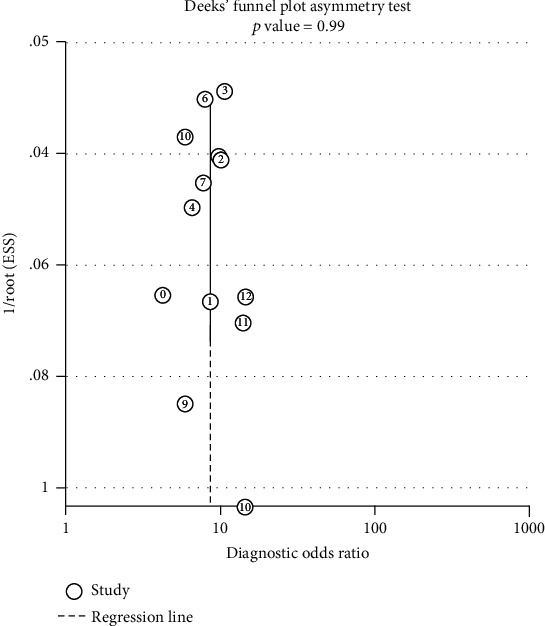
Deeks' funnel plot asymmetry test.
3.2.3. Threshold Effect
The threshold effect can be judged according to the SROC curve plane test. Since there was no typical “shoulder arm”, it can be concluded that there might be no threshold effect. As the correlation coefficient of sensitivity logarithm and the p value of 1-specificity logarithm were -0.78 and p = 0.61, respectively, it can be inferred that the threshold effect was not significant. However, since the Cochran's Q value was 59.49 and the p value was less than 0.05, which indicated the heterogeneity was caused by the non threshold effect, a moderate diagnostic value could be concluded by the value of the area under the SROC curve (AUC), which was 0.80 (95% CI: 0.76-0.83). The details of the SROC curve are shown in Figure 4.
Figure 4.
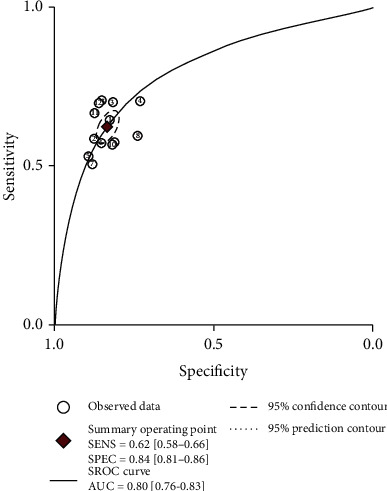
Summary receiver operating characteristic.
3.2.4. Metaregression and Subgroup Analysis
In this study, the factors brought to heterogeneity caused by a nonthreshold effect included diagnostic criteria (“1” for scale evaluation, 0 for nonscale evaluation, such as image or biopsy), trial design (1 for case-control, 0 for cross-sectional), and whether to evaluate the test results by blind method (1 for nonblind method, 0 for blind method) and sample size (0 for more than 300 people and less than 1300 people). As shown in Table 2, through the metaregression analysis of the above factors, it was found that although the sources of heterogeneity of SEN were statistically related to the diagnosis method, test design, and sample size, while the sources of heterogeneity of SPE were related to the diagnosis method, test design, blind evaluation of test results, and sample size, there was no significant difference in clinical significance. The details can be seen in Figure 5.
Table 2.
Metaregression and subgroup analysis.
| Variable | Category | Number of study | Sensitivity (95% CI) | p 1 | Specificity (95% CI) | p 2 |
|---|---|---|---|---|---|---|
| Diagnostic criteria | Checklist | 11 | 0.62 (0.58-0.66) | 0.01 | 0.83 (0.81-0.86) | ≤0.001 |
| Non-checklist | 2 | 0.69 (0.58-0.79) | 0.87 (0.79-0.94) | |||
| Experimental design | Case-control | 8 | 0.63 (0.58-0.68) | 0.04 | 0.85 (0.82-0.88) | ≤0.001 |
| Cross-sectional | 5 | 0.61 (0.54-0.67) | 0.81 (0.77-0.85) | |||
| Blind | No | 11 | 0.64 (0.60-0.67) | 0.68 | 0.83 (0.80-0.85) | ≤0.001 |
| Yes | 2 | 0.55 (0.46-0.63) | 0.87 (0.83-0.91) | |||
| Sample size | ≥300 | 6 | 0.59 (0.54-0.63) | ≤0.001 | 0.86 (0.84-0.88) | ≤0.001 |
| <300 | 7 | 0.66 (0.62-0.71) | 0.80 (0.77-0.84) |
Figure 5.
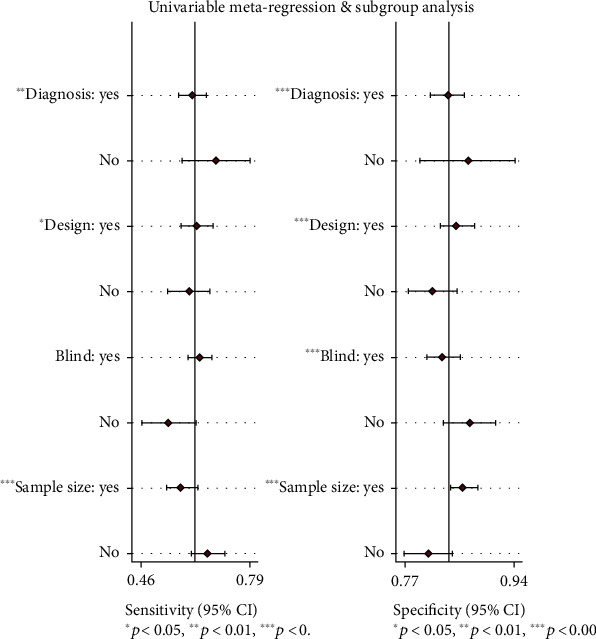
Single factor metaregression and subgroup analysis. Diagnosis—the scale: yes; the nonscale: no. Design—case control study: yes; a cross-sectional study: no. Blind—blind study: yes; nonblinded study: no. Sample size—over 300: yes; below 300: no.
3.2.5. Pretest Probability, Likelihood Ratio, and Posttest Probability
The Fagan graph was plotted to show the relationship among the prior probability, the likelihood ratio, and the posterior probability. The pretest probability was 50%, the APOE test results were high-risk (i.e. ε3/ε4 and ε4/ε4), and the probability of Alzheimer's disease was 79%. In addition, positive likelihood ratio (LRP) was <10 (LRP = 5) and negative likelihood ratio (LRN) was >0.1 (LRN = 0.42), indicating that the diagnosis can neither be confirmed nor excluded. Their diagnostic value of APOE ε4 in AD was limited. The details can be seen in Figure 6.
Figure 6.
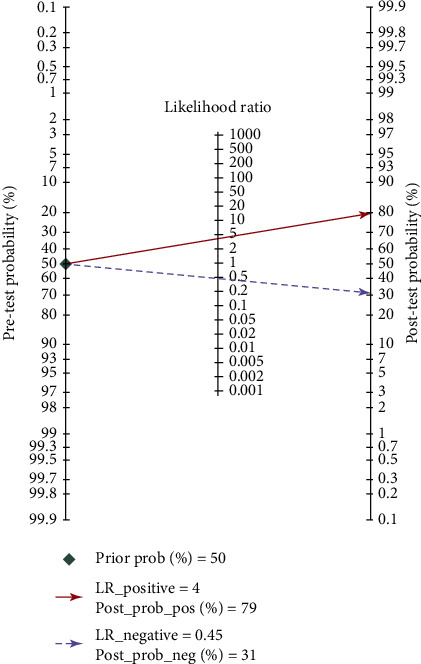
Fagan diagram of APOE genotype in the diagnosis of Alzheimer's disease.
4. Discussions
AD is the primary cause of dementia. It is one of the major diseases that cause death and disability in the elderly, and it affects the quality of life for patients and their families [17]. So far, the pathogenesis of AD is not clear. For the treatment of AD, whether it is drug therapy, physical therapy, or psychological therapy, it can only delay the development of the disease, it can not interrupt the progress of the course of AD, nor can it be completely cured [18]. Therefore, early diagnosis and timely intervention are the only effective measures to delay the progress of this disease [19]5. At present, there are three sets of international diagnostic standards for AD, namely, the National Institute of Neurological and Communicative Disorders and Stroke-Alzheimer's Disease and Related Disorders Association (NINCDS-ADRDA) standards, International Classification of Diseases 10th Edition (ICD-10) of the World Health Organization, and the 5th Edition of Diagnostic and Statistical Manual of Mental Disorders (DSM-IV-TR) [20–21]. None of the three standards mentioned the application of biomarkers. With the development of AD research, new AD diagnostic standards come up, such as International Working Group-2 (IWG-2) criteria issued by the International Working Group and Alzheimer's Association of the National Institute of Aging and National Institute on Aging and Alzheimer's Association (NIA-AA) issued by the USA National Institute of Aging [22–23]. The new standards include biomarkers such as Aβ 1-42 combined with total tau or phosphorylated tau protein level in cerebrospinal fluid (CFS), amyloid PET imaging, autosomal dominant mutation (e.g., PSEN1, PSEN2, and APP mutations) in the diagnosis and identification of AD [23]. However, the main disadvantage of the three sets of scales is that they can only be used when the patients have dementia and/or their daily ability is affected; the best opportunity for intervention is missed. Because the biomarkers in the CSF need operation, the patients often have concerns about this, so the application is limited. Although people with PSEN1, PSEN2, and APP mutations will get sick sooner or later, such patients only account for about 1% and 15% of all Alzheimer's patients [24]. Therefore, for the more common sporadic Alzheimer's patients, it is of great significance to carry out prevention work.
In this study, 2662 cases and 8843 controls were analyzed by meta-analysis. The results showed that the sensitivity of APOE genotype in the diagnosis of Alzheimer's disease was 0.62 (0.58-0.66), the specificity was 0.84 (0.81-0.86), and the area under the SROC curve was 0.80 (0.76-0.83). It is suggested that APOE genotype may be useful in the diagnosis of Alzheimer's disease. If the diagnosis of AD is combined with the APOE ε4 gene test and psychiatric scale, assuming that the physician estimates the probability of AD based on the patient's history and physical signs and the results of the scale test is 50% (the diagnostic accuracy of NINCDS-ADRDA is reported to be 65%-96% [25]), then, the posterior probability is 79%. This result is of great significance for the diagnosis and prevention of early AD, but it has limited value in distinguishing other types of dementia: some scholars reported in the early research that the specificity of APOE ε4 detection in distinguishing ad-induced dementia and other types of dementia is only 23%-88% [26], so it is necessary to combine other detection methods to exclude other factors that caused dementia.
However, there are still limitations in this study:
The number of included studies is less, and the number of covariates is more in regression analysis, which may lead to the probability of multiple comparisons making class I errors
Although a few of the included studies reported the race of the subjects, most of the studies did not mention it, so it is impossible to analyze the influence of race factors on the value of APOE in AD diagnosis
Most of the patients included in the study did not mention the degree of AD. In patients with mild or suspected AD or moderate or severe AD, the sensitivity and specificity of calculated APOE may be different. Due to the insufficient data, this study does not discuss the degree of AD hierarchically
The diagnostic criteria adopted are not uniform enough. Most of the studies have adopted the international recommended ICD or DSM scale, but some of the studies have adopted other mental scales or scales plus other diagnostic experiments, which is one of the reasons for the heterogeneity between the studies
5. Conclusions
AD could neither be confirmed nor be excluded by the APOE gene test. The sensitivity and specificity of APOE gene test were relatively low in the diagnosis of AD. The diagnostic value of APOE ε4 gene in AD was moderate; it might play an important role in the prevention of AD.
Acknowledgments
This paper is supported by the National Key Specialty Construction Project of Clinical Pharmacy (No. 30305030698). Xuan Xiong would like to thank 2018 Scientific Research Project of Sichuan Health Commission (formerly Health and Family Planning Commission of Sichuan Province) (18PJ554) and Sichuan Cadre Health Research Project (2018-212). Dongke Yu would like to thank Youth Fund of Sichuan Academy of Medical Sciences and·Sichuan Provincial People's Hospital (2017QN15).
Data Availability
The data used to support the findings of this study are available from the corresponding author upon request.
Conflicts of Interest
The authors declare that they have no conflicts of interest.
Authors' Contributions
Xuan Xiong, Hongtao Xiao, and Yuan Zhang contributed equally to this work.
References
- 1.Ramanan V. K., Castillo A. M., Knopman D. S., et al. Association of apolipoprotein E ɛ4, educational level, and sex with tau deposition and tau-mediated metabolic dysfunction in older adults. JAMA Network Open. 2019;2(10) doi: 10.1001/jamanetworkopen.2019.13909. [DOI] [PMC free article] [PubMed] [Google Scholar]
- 2.Wang H., Yu X. Epidemiological status of Alzheimer's disease in China. Chinese Journal of General Practitioners. 2006;5(6):358–360. [Google Scholar]
- 3.Wang Y., Zhidong X. Progress in the epidemiology of Alzheimer's disease. Chinese Journal of Practical Nervous Diseases. 2015;20:118–119. [Google Scholar]
- 4.Runhui L. Research status of Alzheimer's disease. Journal of Shenyang Medical College. 2013;15(3):129–133. [Google Scholar]
- 5.Shin W. S., Di J., Cao Q., et al. Amyloid β-protein oligomers promote the uptake of tau fibril seeds potentiating intracellular tau aggregation. Alzheimers Res Ther. 2019;11(1):1–13. doi: 10.1186/s13195-019-0541-9. [DOI] [PMC free article] [PubMed] [Google Scholar]
- 6.Yi T. Diagnostic criteria of Alzheimer's disease: from clinical diagnosis to pathophysiological diagnosis. Journal of Shandong University. 2017;55(10):14–20. [Google Scholar]
- 7.Zheng L., Yan W., Fengchun Z., Central Laboratory Combined detection of Apolipoprotein E ε4 allele and urinary AD7c-NTP in the early diagnosis of Alzheimer's disease. Journal of Apoplexy and Nervous Diseases. 2014;31(7):585–589. [Google Scholar]
- 8.Zhou X., Miao H., Rausch W. D., et al. Association between apolipoprotein E gene polymorphism and Alzheimer's disease in Uighur and Han populations. Psychogeriatrics. 2012;12(2):83–87. doi: 10.1111/j.1479-8301.2011.00389.x. [DOI] [PubMed] [Google Scholar]
- 9.Sando S. B., Melquist S., Cannon A., et al. APOE ε4 lowers age at onset and is a high risk factor for Alzheimer's disease; a case control study from Central Norway. BMC Neurology. 2008;8(1) doi: 10.1186/1471-2377-8-9. [DOI] [PMC free article] [PubMed] [Google Scholar]
- 10.Sunderland T., Mirza N., Putnam K. T., et al. Cerebrospinal fluid beta-amyloid1-42 and tau in control subjects at risk for Alzheimer's disease: the effect of APOE epsilon4 allele. Biological psychiatry. 2004;56(9):670–676. doi: 10.1016/j.biopsych.2004.07.021. [DOI] [PubMed] [Google Scholar]
- 11.Lai S., Chen Y., Wen Z. Association between apolipoprotein E polymorphism and Alzheimer's disease:a population-based study in Guangzhou, China. Chinese Journal of Epidemiology. 2001;22(3):202–204. [PubMed] [Google Scholar]
- 12.Ganguli M., Chandra V., Kamboh M. I., et al. Apolipoprotein E polymorphism and Alzheimer disease: the Indo-US Cross-National Dementia Study. Archives of Neurology. 2000;57(6):824–830. doi: 10.1001/archneur.57.6.824. [DOI] [PubMed] [Google Scholar]
- 13.Tang M. X., Stern Y., Marder K., et al. The APOE-epsilon4 allele and the risk of Alzheimer disease among African Americans, whites, and Hispanics. Jama. 1998;279(10):751–755. doi: 10.1001/jama.279.10.751. [DOI] [PubMed] [Google Scholar]
- 14.Nunomura A., Chiba S., Eto M., Saito M., Makino I., Miyagishi T. Apolipoprotein E polymorphism and susceptibility to early- and late-onset sporadic Alzheimer's disease in Hokkaido, the northern part of Japan. Neuroscience Letters. 1996;206(1):17–20. doi: 10.1016/0304-3940(96)12415-0. [DOI] [PubMed] [Google Scholar]
- 15.Dai X. Y., Nanko S., Hattori M., et al. Association of apolipoprotein E4 with sporadic Alzheimer's disease is more pronounced in early onset type. Neuroscience Letters. 1994;175(1-2) doi: 10.1016/0304-3940(94)91081-2. [DOI] [PubMed] [Google Scholar]
- 16.Rebeck G. W., Reiter J. S., Strickland D. K., Hyman B. T. Apolipoprotein E in sporadic Alzheimer's disease: allelic variation and receptor interactions. Neuron. 1993;11(4):575–580. doi: 10.1016/0896-6273(93)90070-8. [DOI] [PubMed] [Google Scholar]
- 17.Rathnayake A. U., Abuine R., Kim Y. J., Byun H. G. Anti-Alzheimer's materials isolated from marine bio-resources: a review. Current Alzheimer Research. 2019;16(10):895–906. doi: 10.2174/1567205016666191024144044. [DOI] [PubMed] [Google Scholar]
- 18.Li H., Liu C. C., Zheng H., Huang T. Y. Amyloid, tau, pathogen infection and antimicrobial protection in Alzheimer's disease -conformist, nonconformist, and realistic prospects for AD pathogenesis. Translational Neurodegeneration. 2018;7(1) doi: 10.1186/s40035-018-0139-3. [DOI] [PMC free article] [PubMed] [Google Scholar]
- 19.Brown B. M., Peiffer J., Rainey-Smith S. R. Exploring the relationship between physical activity, beta-amyloid and tau: A narrative review. Ageing Research Reviews. 2019;50:9–18. doi: 10.1016/j.arr.2019.01.003. [DOI] [PubMed] [Google Scholar]
- 20.McKhann G., Drachman D., Folstein M., Katzman R., Price D., Stadlan E. M. Clinical diagnosis of Alzheimer’s disease: report of the NINCDS-ADRDA Work Group under the auspices of Department of Health and Human Services Task Force on Alzheimer’s disease. Neurology. 1984;34(7):939–944. doi: 10.1212/WNL.34.7.939. [DOI] [PubMed] [Google Scholar]
- 21.Fratiglioni L., Grut M., Forsell Y., Viitanen M., Winblad B. Clinical diagnosis of Alzheimer's disease and other dementias in a population survey. Archives of Neurology. 1992;49(9):927–932. doi: 10.1001/archneur.1992.00530330049015. [DOI] [PubMed] [Google Scholar]
- 22.McKhann G. M., Knopman D. S., Chertkow H., et al. The diagnosis of dementia due to Alzheimer’s disease: recommendations from the National Institute on Aging-Alzheimer’s Association workgroups on diagnostic guidelines for Alzheimer’s disease. Alzheimers Dement. 2011;7:263–269. doi: 10.1016/j.jalz.2011.03.005. [DOI] [PMC free article] [PubMed] [Google Scholar]
- 23.Cohen A. D., Landau S. M., Snitz B. E., Klunk W. E., Blennow K., Zetterberg H. Fluid and PET biomarkers for amyloid pathology in Alzheimer's disease. Molecular and Cellular Neurosciences. 2019;97:3–17. doi: 10.1016/j.mcn.2018.12.004. [DOI] [PubMed] [Google Scholar]
- 24.Wm V. D. F., Pijnenburg Y. A., Fox N. C., Scheltens P. Early-onset versus late-onset Alzheimer's disease: the case of the missing APOE ɛ4 allele. Lancet Neurology. 2011;10(3):280–288. doi: 10.1016/S1474-4422(10)70306-9. [DOI] [PubMed] [Google Scholar]
- 25.Kuhlmann D. Primum non nocere. Canadian Medical Association Journal. 2011;68(3):p. 397. doi: 10.1001/archneurol.2011.15. [DOI] [PubMed] [Google Scholar]
- 26.Mayeux R., Saunders A. M., Shea S., et al. Utility of the apolipoprotein E genotype in the diagnosis of Alzheimer's disease. New England Journal of Medicine. 1998;338(8):506–511. doi: 10.1056/NEJM199802193380804. [DOI] [PubMed] [Google Scholar]
Associated Data
This section collects any data citations, data availability statements, or supplementary materials included in this article.
Data Availability Statement
The data used to support the findings of this study are available from the corresponding author upon request.


