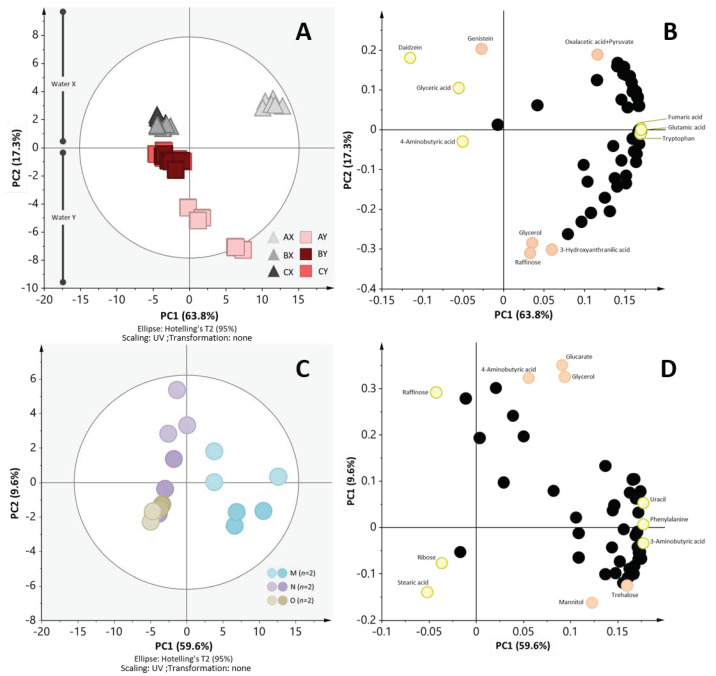
Figure 3.
Effect of raw materials and starter culture on metabolite profiles of tempe. (A) PCA score scatter plot of tempe made with different water and soybean from 53 annotated metabolites. In this experiment three soybeans were used (A, B, and C; coded by color). In addition, two different water types were used (water X and Y; coded by triangle). In this plot, two biological replicates and three chemical replicates from each sample are presented. Here, it shows that tempe AX and AY are separated from tempe BX, BY, CX, and CY along PC1 (explains 63.8% of variance). Additionally, it is shown that tempe made by water X (triangle) and water Y (rectangular) separated from each other along PC2 (explains 17.3% of variance). (B) The PCA loading plot raw material experiment. Representative metabolites are notated in this plot (yellow = PC1; orange = PC2). (C) PCA score plot of starter culture set. This figure shows tempe M (blue) has a different metabolite profile to that of tempe N (purple) and O (green) based on PC1 which explains 59.6% of variance. (D) The PCA loading plot showing representative metabolites that contribute to separation (yellow = PC1; orange = PC2).

