Abstract
Putting real-time medical data processing applications into practice comes with some challenges such as scalability and performance. Processing medical images from different collaborators is an example of such applications, in which chest X-ray data are processed to extract knowledge. It is not easy to process data and get the required information in real time using central processing techniques when data get very large in size. In this paper, real-time data are filtered and forwarded to the right processing node by using the proposed topic-based hierarchical publish/subscribe messaging middleware in the distributed scalable network of collaborating computation nodes instead of classical approaches of centralized computation. This enables processing streaming medical data in near real time and makes a warning system possible. End users have the capability of filtering/searching. The returned search results can be images (COVID-19 or non-COVID-19) and their meta-data are gender and age. Here, COVID-19 is detected using a novel capsule network-based model from chest X-ray images. This middleware allows for a smaller search space as well as shorter times for obtaining search results.
Keywords: Capsule networks, Topic-based hierarchical publish/subscribe, COVID-19 detection, Hybrid intelligence, X-ray images, Medical data management
Introduction
With the recent advances in big data technologies, new machine learning techniques for precision medicine (Njølstad et al. 2019; Van Den Berg et al. 2019), the life sciences, and clinical data analysis (Ho et al. 2019; Palanisamy and Thirunavukarasu 2019; Ngiam and Khor 2019) are continuously developed and extended in medical data science to achieve a better understanding of diseases. The field of medical data science covers different areas such as prediction of response to treatment in personalized medicine (Abul-Husn and Kenny 2019; Suwinski 2019), biomarker detection (Zhang et al. 2019; Fitzgerald 2020), tumor classification (Khan et al. 2019; Lin and Berger 2020), COVID detection and classification (Wang et al. 2020; Bragazzi et al. 2020), and the understanding of gene interactions (Shukla and Muhuri 2019). When it comes to big data, central processing techniques may not be enough to process these medical data and get the required information on time correctly.
Hybrid intelligence combines human and artificial intelligence. The main reason for this is the combination of complementary heterogeneous bits of intelligence to create a socio-technological ensemble that is able to overcome the current limitations of artificial intelligence (Dellermann 2019). In this paper, our proposed middleware includes the coronavirus disease 2019 (COVID-19) detection phase. Ground-truth data require domain expertise. Here, the output of human intelligence (labeling by experts) is used for training capsule networks (artificial intelligence). Similarly, the output of AI is used by clinicians to make their job easier and faster.
In recent years, medical/health data science and practices are among the issues that are carefully emphasized by various government agencies as well as private companies (Goulooze et al. 2019; Paul et al. 2017; Paul et al. 2016; Ford et al. 2019; Dixon et al. 2020; Dammann and Smart 2019). Image processing methods are also one of the basic algorithms used when developing these software solutions and applications. Although there are many studies in the literature on image processing-based medical data processing systems in general, to our knowledge no previous study has been performed on the publishing of classified chest X-ray images to the clients/consumers based on hierarchical topics (disease typed image, gender, age). The following paragraphs explain literature reviews on COVID-19 classification from images and streaming medical data.
COVID-19 is an infectious respiratory disease caused by severe acute respiratory syndrome coronavirus 2 (SARS-CoV-2) that affects humans. The disease, which was first discovered in Wuhan, China, in 2019, has spread worldwide since its discovery, causing a 2019–2020 coronavirus pandemic (Hui 2019). Common symptoms of the disease include fever, cough, and shortness of breath. Muscle aches, sputum production, and sore throat are less common symptoms. Gastrointestinal symptoms such as diarrhea have been reported (Jinyang et al. 2020; Miri et al. 2020).
In some studies, it has been shown that the virus also involves the central nervous system; the symptoms of loss of smell and difficulty in breathing are due to these reasons (Li et al. 2020). Although most of the cases have mild symptoms, some patients may experience severe pneumonia and multiple organ failures. According to the first major analysis of over 44,000 cases in China, confirmed cases are at least five times more common among patients with diabetes, high blood pressure, heart disease or respiratory problems. Different methods are used for the detection of COVID-19. Although real-time polymerase chain reaction (RT-PCR) testing of sputum is standard for the diagnosis of coronavirus, it is time-consuming to confirm because of the high false-negative results of COVID-19 patients (Huang et al. 2020). Therefore, medical imaging methods such as chest X-ray (CXR) and computed tomography (CT) can play an important role in confirming positive COVID-19 patients, especially in infected pregnant women and children (Ng et al. 2020; Liu et al. 2020). Volumetric CT chest lattice (thorax) images for lung and soft tissue have been investigated in recent studies to identify COVID-19 (Chung et al. 2020). The main disadvantage in using CT imaging is the high radiation dose and the cost (Kroft et al. 2019). In contrast, all hospitals and clinics have traditional radiographs or CXR machines to produce two-dimensional (2D) projection images of the patient’s chest. Generally, the CXR method is the first choice for radiologists to detect chest pathology and has been applied to identify or confirm COVID-19 in a small number of patients (Chen et al. 2020). For this reason, this study focused on the use of the X-ray imaging method for COVID-19 patients. Deep learning techniques have shown promising results for performing radiological tasks by automatically analyzing multimodal medical images in recent years. Evolutionary neural networks have also been used in many medical classification, detection and diagnostic studies. There are also studies in the literature using pre-trained deep neural networks to detect COVID-19 from X-ray images (Hemdan et al. 2003; Narin et al. 2003). Dansana et al. (2020) used convolution neural networks (CNN) for binary classification pneumonia-based conversion of VGG-19, Inception V2 and decision tree model on X-ray and CT scan image datasets. In this study, automatic COVID-19 is detected from chest X-ray images using capsule networks. Boccaletti et al. (Boccaletti et al. 2020) invited for a special issue focusing on bringing together the community of applied mathematicians, virologists, epidemiologists, the community of complex systems scientists, and the community of scientists to deal more successfully with circumstances like the current pandemic. So there are a number of works related to modeling and forecasting of spreading in COVID-19 in the literature. Contreras et al. (2020) presented a general multi-group SEIRA model for representing the spread of novel COVID-19 through populations with heterogeneous characteristics. This model can represent several mechanisms of interaction between different subpopulations. Crokidakis (2020) studied the dynamics of COVID-19 in Rio de Janeiro state, Brazil, by means of a Susceptible-Infectious-Quarantined-Recovered (SIQR) model with containment policies. It is seen that the social distancing policies led about 7 days to change the initial exponential growth of cases and to effectively decrease the rate of growth of confirmed cases. Abdo et al. (2020) investigated a mathematical model for calculating the transmissibility of COVID-19 disease by using non-singular fractional-order derivative. Chakraborty and Ghosh (2020) dealt with the real-time forecasts of the daily COVID-19 cases in five different countries using a hybrid ARIMA-WBF model. The model can be used as an early warning system to fight against the COVID-19 pandemic. Mandal et al. (2020) explored the role of quarantine and the governmental intervention strategies on COVID-19 control and elimination. Melin et al. (2020) analyzed the spatial evolution of coronavirus pandemic around the world by using a particular type of unsupervised neural network, self-organizing maps. Employing unsupervised self-organizing maps, similar countries in their fight against the coronavirus pandemic make similar strategies. Melin et al. (2020) proposed a new approach with multiple ensemble neural network models and fuzzy response aggregation for the COVID-19 time series. Castillo and Melin (2020) proposed a hybrid intelligent approach combining the advantages of fractal theory and fuzzy logic. Forecasting windows of 10 and 30 days ahead are used to test the proposed approach.
In addition to the COVID-19 classification from images, another subject we examine is the distribution of classified images and their metadata by the topic-based publish/subscribe (pub/sub) system. The pub/sub interaction is a message-based form of communication in a distributed environment. In this type of communication, producers/publishers publish information, while consumers/subscribers receive it by registering the information they want to receive. The pub/sub system is closely related to the message queuing paradigm and forms part of the message-based middleware system (Tanenbaum et al. 2007). In the pub/sub model, consumers receive some of the information published by the producers. This job is known as filtering. Generally, it is divided into three types: subject-based, content-based, and type-based filtering. In the subject-based pub/sub model, messages are posted to topics (or logical channels). The consumer who subscribes to the relevant subject receives all the messages published on that subject. With the same logic, all recipients who subscribe to the same subject receive the same messages posted (Harrison et al. 1997). In the content-based model, if the qualities or content of the published messages matches, the relevant messages are received by the consumers (Fabret et al. 2001). The type-based model is developed with inspiration from the object-oriented programming paradigm. In this model, the producer produces the message objects in the communication channel, and the consumer receives the object-type messages they are interested in, provided that they are registered with that communication channel (Eugster 2007). Pub/sub applications for data streams are a research topic. In data stream applications, the stream generally consists of geographically distributed producers and consumers querying them. Gray and Nutt (2005) offer a distributed data stream solution based on the pub/sub architecture that allows publishing stream data and querying them. Zou et al. (2010) propose distributed pub/sub architecture for real-time video viewing using wireless sensor networks and wireless mesh networks. Wadhwa et al. (2015) propose a pub/sub-based architecture for early exchange of healthcare data among different interested parties, e.g., doctors, researchers, and policy makers. Singh et al. (Singh et al. 2008) implement a middleware model to control the sharing of information in a publish/subscribe environment. It supports a fundamental requirement of the healthcare process. Contributions to the literature with the paper can be listed as follows:
Topic-based hierarchical messaging middleware is proposed for medical data streaming. In this sense, with the developed system, it is possible to convert hard real-time applications to soft real-time to access images on a topic-based basis. This solves the scaling and performance problems.
Middleware has single-point control—updating a single table (holding information or topics for the publisher and subscriber) will change the whole cycle.
This middleware is quite simple to implement. The structure of each system for handling the COVID-19 detection structure remains the same and hence leads to a considerable reduction in implementation cost.
We proposed a capsule network-based model for the diagnosis of COVID-19 from X-ray images.
The remainder of this article is organized as follows: In Sect. 2, details on the proposed topic-based hierarchical publish/subscribe messaging middleware are given. Section 3 presents the performance of the middleware. The last section concludes the article and discusses future works.
Materials and methods
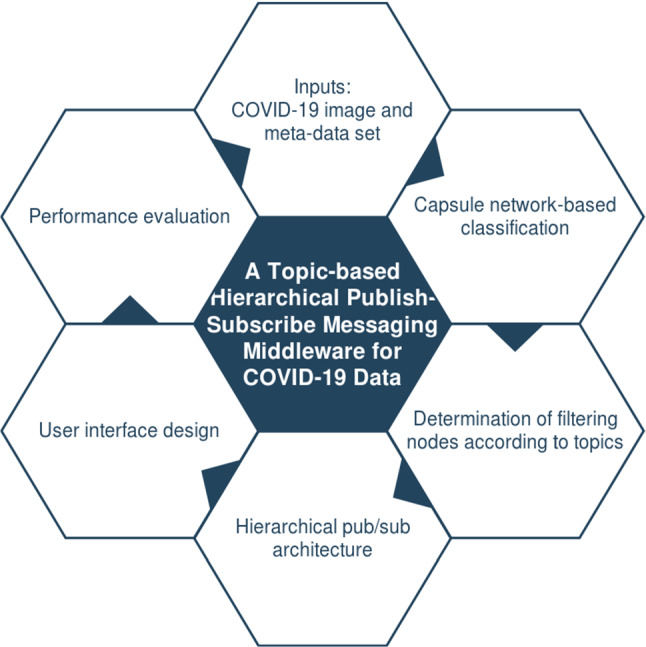
In this section, the architecture of the proposed pub/sub messaging middleware will be explained. Figure 1 shows the sub-components of the system, which will be explained in detail in the following sections.
Fig. 1.
Sub-components of the proposed system
With the hierarchical topic-based collaborative computer cluster, it will be possible to take the critical and strategic decisions in a timely and correct manner by partitioning and sharing the load of image processing. The proposed middleware enables the development of image-oriented searching and warning in real time. The distributed architectural infrastructure allows for scalable distributed system applications based on COVID-19 detection over chest X-ray images. With the proposed system, an increase in efficiency and reduction in manual operations are seen, while more accurate results are obtained. End users will be able to define search criteria as a hierarchical topic according to different features (image, age, gender). Searching and processing in less search space on images that come to users who subscribe for certain topics save time.
Proposed architecture
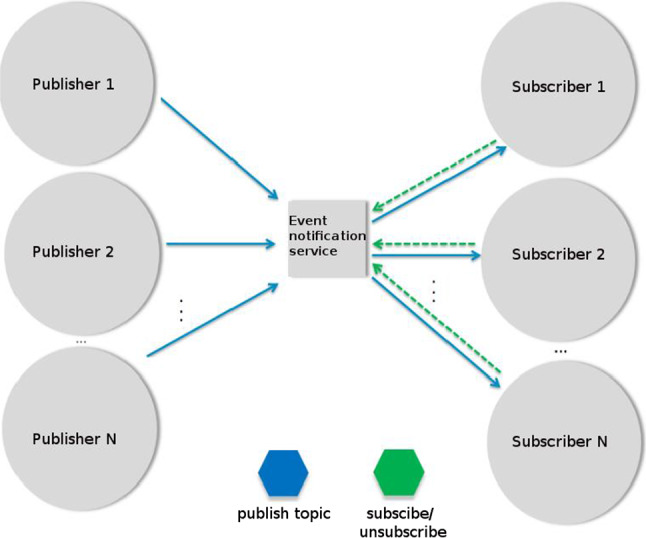
In the pub/sub messaging model in software architecture, topics are broadcast to a virtual channel (topic). While the message senders (publishers) broadcast messages without being aware of the subscribers, the recipients/subscribers can subscribe to one or more topics without being aware of the senders. The pub/sub model is often referred to along with the queue paradigm. In the pub/sub messaging model, topics can be organized in a hierarchy. The general structure of a topic-based pub/sub model is presented in Fig. 2.
Fig. 2.
Topic-based pub/sub structure
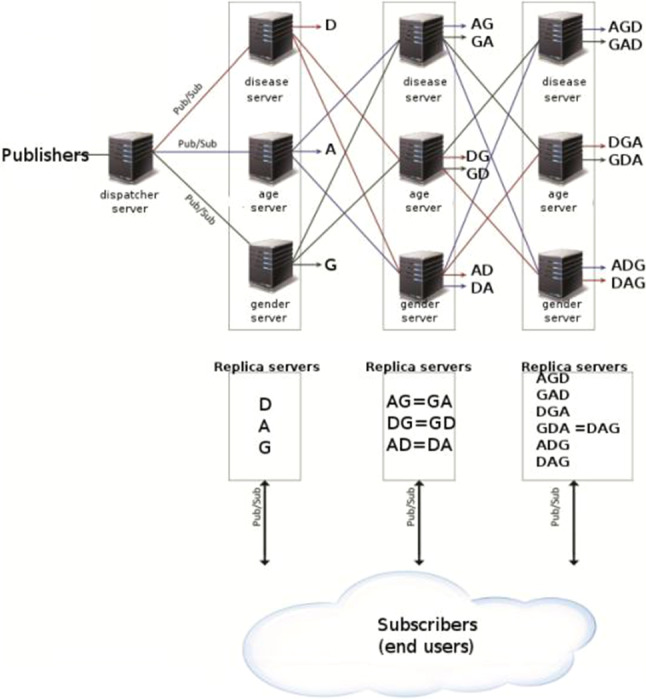
The proposed hierarchical topic-based pub/sub architecture is shown in Fig. 3. The received X-ray images are published to the other replica servers by the dispatcher server. Replica servers consist of three layers, and each layer has disease (D), age (A), and gender (G) servers. Subscribers connected to the first tier receive images containing only issues related to the disease (such as COVID-19 from all images), only gender (such as men), and only age (such as those below 50). Subscribers connected to the second tier take images according to two topics: COVID-19 patients over 65 age and women COVID-19 patients. So, there are three topics (disease/age—DA, disease/gender—DG, and age/gender—AG) at the second-tier output. Subscribers connected to the third tier receive images according to three topics (DAG): male COVID-19 patients over 65 years of age.
Fig. 3.
Hierarchical topic-based pub/sub architecture
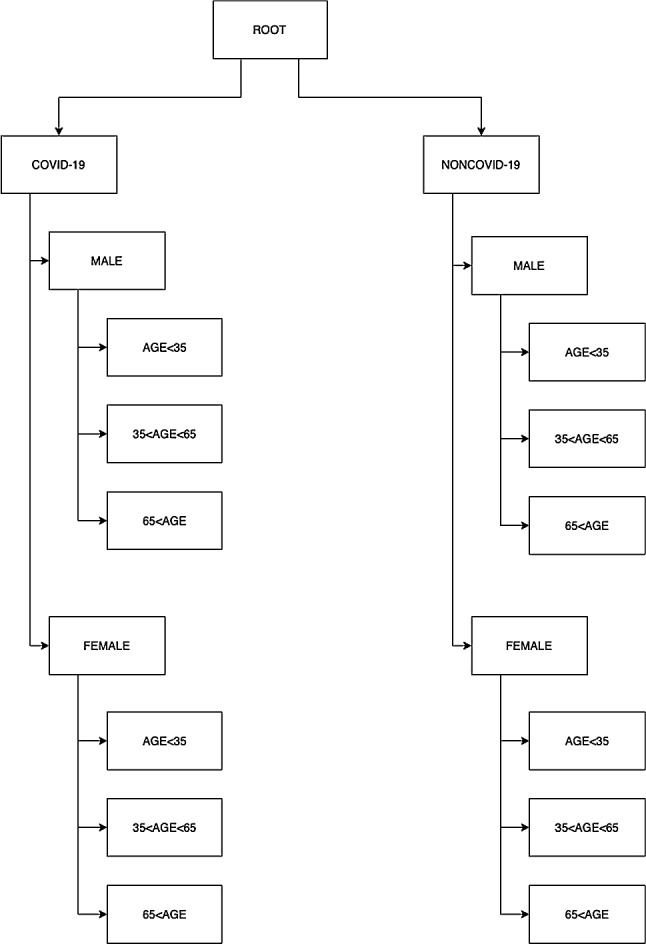
Figure 4 presents the hierarchical topic-based pub/sub architecture in the tree structure. In the proposed system, there are three main topics, but their sub-topics are as follows: disease (COVID-19 and non-COVID-19). The second-tier sub-topics of each of these are gender (male and female) information. In the last stage, there is a structure of age. Age information is limited in three ranges: less than thirty-five, between thirty-five and sixty-five, and more than sixty-five. The next two subsections explain the first tier of COVID-19 detection in hierarchical architecture and Apache Kafka-based pub/sub implementation, respectively.
Fig. 4.
Tree structure of hierarchical topic-based pub/sub architecture
Capsule network-based COVID-19 detection
CNNs have some limitations. CNNs are very sensitive to the orientation of the object and light intensity in the environment. A simple and complex spatial relationship between object and environment cannot be taken into consideration. Light intensity on the different perspectives of an object in the image decreases the performance of the network. Therefore, more training data are required to improve performance. However, this workaround requires a high computational cost, training time, and powerful hardware. On the other hand, another major problem with CNNs is the pooling layers, since this layer loses crucial information in the image.
Capsule Networks (CapsNets) manage to overcome the disadvantages of the CNNs. A capsule can be described as a small group of neurons. The input and output of a capsule are in the form of a vector, which differs from conventional artificial networks. Each capsule has an activity vector and pose; deformation and velocity are indicated by this vector (Sabour et al. 2017). The length of the activity vector corresponds to the probability of which object exists in the image and the orientation of the vector points out the instantiation parameters. It is very important to understand the basis of a capsule operation. Each capsule has three recognition units and four generation units. Recognition units can be considered as a hidden layer to calculate the probability of existence of the object (p) and position of the object (x and y). Generation units compute the contribution of each capsule to an image to be transformed. This network contains different capsules interacting at the last layer for the shifted image. The inputs of generation units are in the form of both an image and the amount of desired shift (denoted as ∆x and ∆y). If a capsule is not active, this means that there is no contribution to the output image. When randomly shifted input, output images and the amount of shift are applied, capsules learn how to find the position of the object.
CapsNets consist of a convolutional layer, primary capsule layer, capsule layer, mask layer, and decoder network. The first layer is a convolutional layer and extracts the basic features such as edges and color variations. After that, the primary capsule layer produces capsules from neuron outputs. This layer behaves like an inverse rendering operation. Given an image or other data, it computes the internal parameters of features such as rotation and scale. Then, the capsule layer extracts more abstract features in the data. Here, dynamic routing is applied for determining weights between low-level and high-level features. The last capsule layer has capsules with the same number of classes. After applying softmax operation to the output of capsules, class probabilities are obtained. Class predictions are achieved by selecting the class with the highest probability. The layers mentioned thus far make up the encoder network. Additionally, a decoder network is constructed for regularization. The capsule output of correct classes is given to a 2-layer fully connected network to rebuild the original data. The difference between original data and rebuilt data is provided as a regularization term to the error function. The calculated error value is carried backward using backpropagation, and learning is achieved.
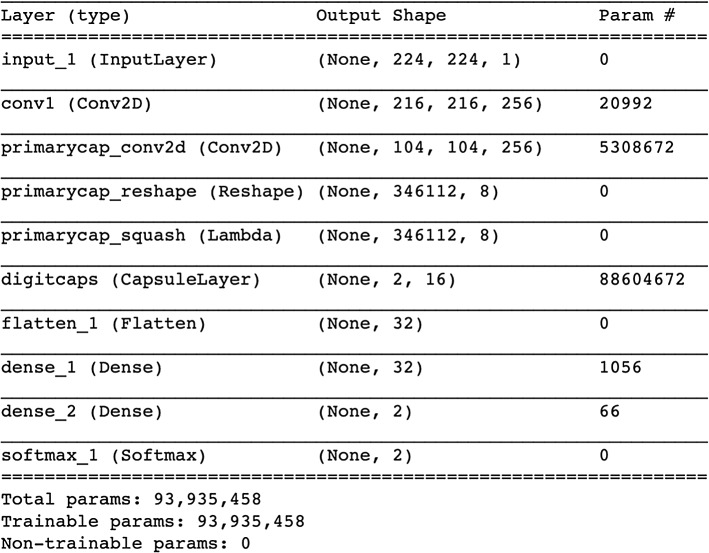
The architecture of the proposed capsule model is shown in Fig. 5. Layers of this architecture are described below:
Convolutional layer: It is just a conventional layer (Conv2D) for detecting the edges from the image. ReLU is chosen as the activation function to add nonlinearity. After the convolutional layer with 256 filters, kernel size and stride being 9 and 1, respectively, the output data have a size of 216*216*256. The total number of parameters at this layer is 20,992.
Primary capsule layer: Primary capsule with squash activation consists of a 2D convolutional layer with a kernel size, filters, and strides being 9, 256, and 2, respectively. The output data have a size of 104*104*256. After that, a reshape layer is applied to make data fit into a eight-dimensional capsule. The resulting data dimension is 346,112*8. The total number of parameters at this layer is 5,308,672.
Capsule layer: Each capsule in this layer has 16 nodes, i.e., 16 dimensions. The number of capsules is equal to the number of classes in the dataset. Each capsule corresponds to a class. Therefore, for a two-class dataset (COVID and non-COVID), the output is a 2*16 matrix. Total number of parameters at this layer is 88,604,672.
Flatten layer: Flattening transforms a two-dimensional matrix (2*16) of features into a vector (32) that can be fed into a fully connected neural network classifier.
Decoder network: It consists of two dense layers. The first layer has size 32 and the second one has 2. The last hidden layer has the same size as the input layer, which is 196. The total number of parameters at these layers is 1112.
Softmax layer: Softmax is implemented through a neural network layer just before the output layer. The Softmax layer must have the same number of nodes as the output layer. The total number of parameters in this network is equal to 93,935,458.
Fig. 5.
Architecture of the proposed capsule model for COVID-19 detection
COVID-19 medical data streaming with Apache Kafka
In this paper, Apache Kafka (version 2.11)-distributed streaming platform is used for topic-based pub/sub architecture. Apache Kafka aims to provide a unified, high-efficiency, low-latency platform to manage real-time data streams. The storage layer is essentially a ”highly scalable message queue” formatted as a distributed transaction log (Apache Kafka 2020). Kafka is the actual distribution system, a high-throughput distributor for messages, dealing with the enormous amount of data and supporting a huge number of consumers and producers. Kafka uses several partitions and brokers to perform parallelism. The parallelism accelerates the processes effectively. Furthermore, it automatically retrieves data in cases where the broker fails. Through these characteristics of Kafka, the real-time data streaming requirements are satisfied.
As shown in Fig. 4, data coming from publishers are first classified according to their disease type (D). Age (A) and gender (G) information is obtained from its meta-data. Then, the data from these tiers are combined as type–age (DA), type–gender (DG), age–gender (AG). Finally, the data from the combiner with the type–age (DA) and the data from the gender layer (G) are combined to obtain the type–age–gender (DAG) information. The relationships between the first replica servers (D, A, G) and combiners (DA, DG, AG, DAG) are visually illustrated in Fig. 6.
Fig. 6.
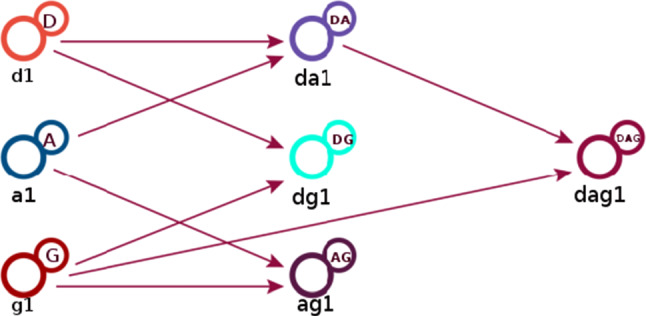
The relationships between replica servers and combiners
The working principle of the subprogram that combines data according to the type of disease and age is as follows. In order to combine the type of disease and age, the two disease types (COVID and non-COVID) opened by the classification process and the three age ranges combine information from Apache Kafka subjects according to their unique numbers as in Fig. 7. It publishes a total of 2 × 3 = 6 topics, consisting of type and age combinations (30 years of COVID, 40 years of non-COVID, etc.). Similarly, 4 (2 × 2) topics for type and gender combination and 6 (2 × 3) topics for gender and age combination are published. For type–age–gender combination, 2 × 3 × 2 = 12 topics are published. There are 28 topics in total.
Fig. 7.
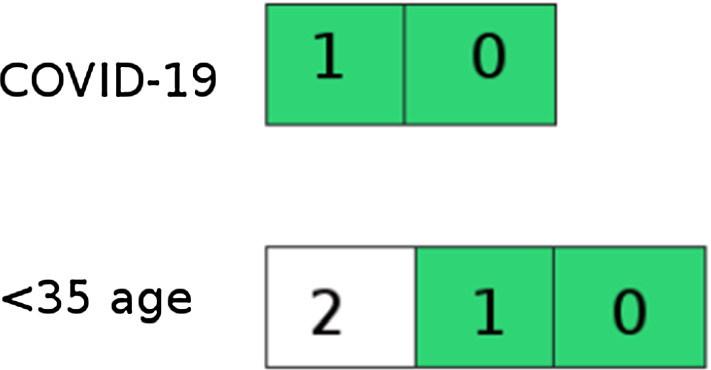
Combining disease type and age information
Experimental results and user interfaces
This section firstly describes the used COVID-19 datasets and then gives performance results for the proposed architecture. Finally, user interfaces are illustrated with the main actions.
COVID-19 image datasets
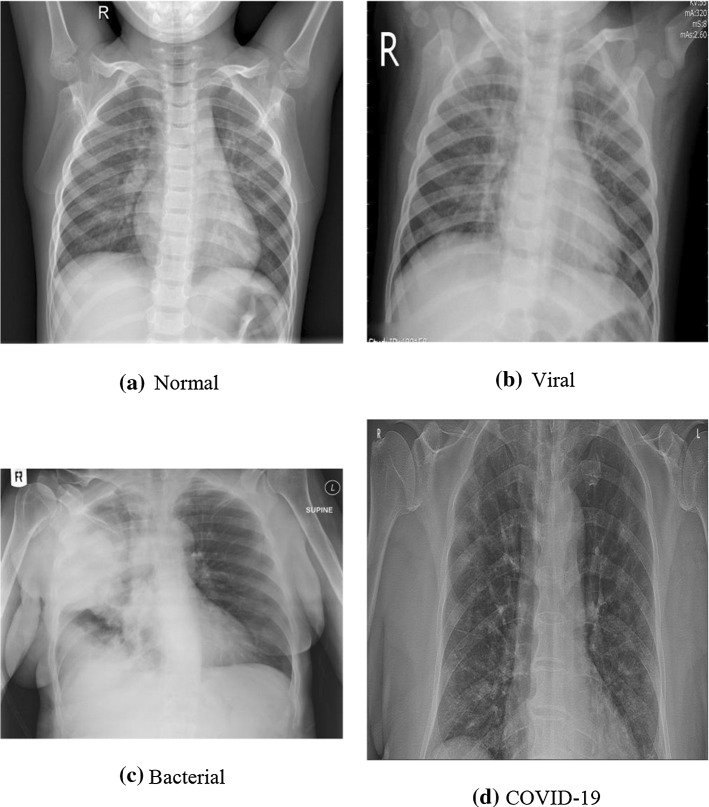
We used two publicly available chest X-ray datasets (Covid Chest X-ray Dataset 2020; Kaggle Chest X-ray Images (Pneumonia) Dataset 2020). As shown in Fig. 8, the datasets used for the tests contain four different class labels: normal, bacterial, non-COVID viral, and COVID-19. Class labels are reduced to two, with the first three as negative and the last as positive. Thus, binary classification is made. All images in this dataset have been scaled to 224 × 224 pixels. Also, images have some meta-data such as age, sex/gender, survival, intubated, modality, date, and location.
Fig. 8.
Labels available in the dataset
Our experiment environment runs an Intel Core i7-8700 K CPU with 3.70 GHz, 32 GB RAM and 2 MSI GTX 1080 Ti Armor OC 11 GB GPUs. Our proposed architectures are implemented in Keras framework with Tensorflow as the backend. The dataset was randomly divided into two independent datasets with 80% and 20% for training and testing, respectively. The batch size, learning rate, and epoch number are 10, 1e − 5, and 100, respectively. We evaluate the success/failure of the capsule-based model in terms of four measures such as accuracy, specificity, and recall derived from the confusion matrix as shown by the following equations:
| 1 |
| 2 |
| 3 |
Table 1 shows the comparison of the proposed capsule-based model with other approaches using the same dataset in the literature: COVID-CAPS with pre-training, without pre-training, deep features-based one, VGG 16, Inception_v2, and decision tree. As shown in Table 1, the proposed model outperforms COVID-CAPS without pre-training, deep features, Inception_v2, and decision tree in terms of accuracy. The proposed model outperforms COVID-CAPS without pre-training and deep feature in terms of specificity. Our model is also the best one according to sensitivity performance.
Table 1.
Performance comparison for COVID-19 classification
| Method | Accuracy (%) | Sensitivity (%) | Specificity (%) |
|---|---|---|---|
| COVID-CAPS without pre-training (Afshar et al. 2004) | 95.7 | 90 | 95.8 |
| Pre-trained COVID-CAPS (Afshar et al. 2004) | 98.3 | 80 | 98.6 |
| Deep features (Sethy and Behera 2020) | 95.38 | 97.29 | 93.47 |
| VGG 16 (Dansana et al. 2020) | 100 | 94 | NA |
| Inception_v2 (Dansana et al. 2020) | 78 | 76 | NA |
| Decision tree (Dansana et al. 2020) | 60 | 70 | NA |
| Proposed model | 96.01 | 97.6 | 96.83 |
Bold numbers indicate the best performance
User interfaces
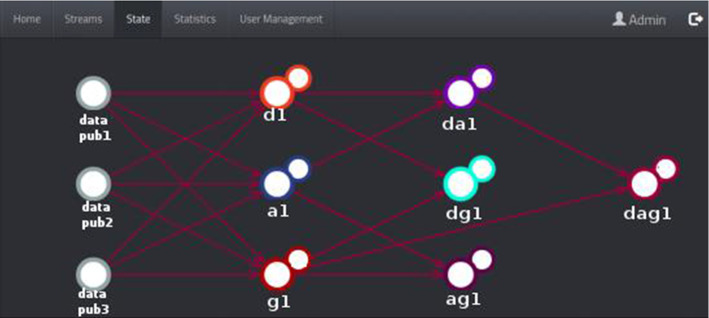
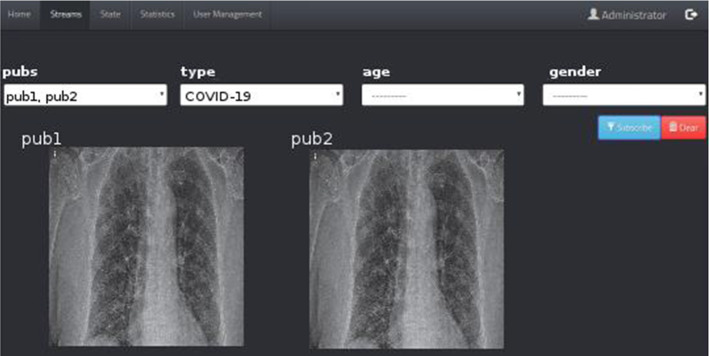
This subsection goes into detail about the user interfaces of our hierarchical topic-based pub/sub architecture. User interfaces (UIs) are pages with various images, graphics, scripts, and commands that allow users to access the program and control the whole or any part of the program. So, our web-based application is created using some technologies such as NGINX Stream Real-Time Messaging Protocol (RTMP), Node.js, and Socket.IO. As every web application, our application has registration, sign-in pages, and superuser page for system and user management. The statistics page where statistics on the NGINX RTMP unit are kept provides information on the health of the system. Super administrators and administrators can access this page. The information provided on this page includes the number of viewers, hardware usage values, and health/operability information of the system. Figure 9 illustrates the page showing the relationships between the publishers (image and meta-data providers), COVID-19 detector, and topic combiners. It is a graph structure of states that detects images and meta-data from the providers and displays notifications from detector and combiners instantly. Superusers and administrators can access this page. On the stream tab, users can filter the images they receive from the NGINX RTMP server as desired. All active users can access this page. In the example in Fig. 10, the user used the COVID-19 filter.
Fig. 9.
System state page
Fig. 10.
Topic-based filtering page
Conclusion
As it is known, image processing methods are used in many fields, ranging from military industry to security, from medicine to robotics, from astronomy to aviation, from biomedical to remote sensing. Disease diagnosis is one of the most important of these areas. In this study, we proposed a topic-based hierarchical pub/sub messaging middleware for COVID-19 detection in X-ray image and its meta-data. It is provided to classify the X-ray images obtained from image providers according to the type of disease and to send the classified image and its meta-data (age–gender information) to subscribed users on a topic-based basis.
The capsule network-based model was trained and tested using the chest X-ray dataset and several metrics used to evaluate the COVID-19 detection performance, such as accuracy, sensitivity, and specificity. The experimental results were compared with some of the recently published works. The comparison demonstrated that the proposed model achieves better sensitivity than other existing methods for the task of COVID-19 classification, while other metrics are close to the best results. Moreover, COVID-19 classification, user interfaces of our hierarchical topic-based pub/sub architecture are illustrated.
Here, human intelligence is integrated into an artificial intelligence system to complement machine capabilities (i.e., to make COVID-19 detection) throughout its life cycle. Human experts label images, and these (human inputs) are used by AI for training and validation. Human involvement can prevent the mistakes and failures that would be caused by an AI system. Similarly, the output of AI is used by clinicians to make their job easier and faster.
As for future work, we plan to contribute to the implementation of the ideas mentioned previously. Additionally, we plan to enrich our system by providing it with more powerful algorithms that try to get more meta-data on the patients. We also plan to add COVID-19 image and meta-data crawler to the system. Besides, the researcher will focus on increasing the training speed and efficiency of the model on a quantity-limited dataset, as well as extending this work by optimizing access to human intelligence. Optimization is very important when a system seeks additional evidence from humans to accomplish tasks and when a learning agent has access to teacher advice on how to act.
Acknowledgements
The author received no financial support for the research, authorship, and/or publication of this article.
Author’s contributions
S.E. contributed to the design and implementation of the research, to the analysis of the results, and to the writing of the manuscript.
Availability of data and material
1-Covid Chest X-ray Dataset https://github.com/ieee8023/covid-chestxray-dataset. 2-Kaggle Chest X-ray Images (Pneumonia) Dataset https://www.kaggle.com/paultimothymooney/chest-xray-pneumonia.
Compliance with ethical standards
Conflict of interest
The author declares that he has no known competing financial interests or personal relationships that could have appeared to influence the work reported in this paper.
Footnotes
This article has been retracted. Please see the retraction notice for more detail: https://doi.org/10.1007/s00500-023-08599-7
Publisher's Note
Springer Nature remains neutral with regard to jurisdictional claims in published maps and institutional affiliations.
Change history
5/29/2023
This article has been retracted. Please see the Retraction Notice for more detail: 10.1007/s00500-023-08599-7
References
- Abdo MS, et al. On a comprehensive model of the novel coronavirus (COVID-19) under Mittag-Leffler derivative. Chaos Solitons Fractals. 2020;135:109867. doi: 10.1016/j.chaos.2020.109867. [DOI] [PMC free article] [PubMed] [Google Scholar]
- Abul-Husn NS, Kenny EE. Personalized medicine and the power of electronic health records. Cell. 2019;177(1):58–69. doi: 10.1016/j.cell.2019.02.039. [DOI] [PMC free article] [PubMed] [Google Scholar]
- Afshar P, et al. (2020) Covid-caps: a capsule network-based framework for identification of covid-19 cases from x-ray images. arXiv:2004.02696 [DOI] [PMC free article] [PubMed]
- Apache Kafka. https://kafka.apache.org/. Accessed 20 May 2020
- Boccaletti S, et al. Modeling and forecasting of epidemic spreading: the case of Covid-19 and beyond”. Chaos Solitons Fractals. 2020;135:109794. doi: 10.1016/j.chaos.2020.109794. [DOI] [PMC free article] [PubMed] [Google Scholar]
- Bragazzi NL, et al. How big data and artificial intelligence can help better manage the COVID-19 pandemic. Int J Environ Res Public Health. 2020;17(9):3176. doi: 10.3390/ijerph17093176. [DOI] [PMC free article] [PubMed] [Google Scholar]
- Castillo O, Melin P (2020) Forecasting of COVID-19 time series for countries in the world based on a hybrid approach combining the fractal dimension and fuzzy logic. Chaos Solitons Fractals, 110242 [DOI] [PMC free article] [PubMed]
- Chakraborty T, Ghosh I. Real-time forecasts and risk assessment of novel coronavirus (COVID-19) cases: a data-driven analysis. Chaos Solitons Fractals. 2020;135:109850. doi: 10.1016/j.chaos.2020.109850. [DOI] [PMC free article] [PubMed] [Google Scholar]
- Chen N, et al. Epidemiological and clinical characteristics of 99 cases of 2019 novel coronavirus pneumonia in Wuhan, China: a descriptive study. The Lancet. 2020;395(10223):507–513. doi: 10.1016/S0140-6736(20)30211-7. [DOI] [PMC free article] [PubMed] [Google Scholar]
- Chung M, et al. CT imaging features of 2019 novel coronavirus (2019-nCoV) Radiology. 2020;295(1):202–207. doi: 10.1148/radiol.2020200230. [DOI] [PMC free article] [PubMed] [Google Scholar]
- Contreras S, et al. A multi-group SEIRA model for the spread of COVID-19 among heterogeneous populations. Chaos Solitons Fractals. 2020;136:109925. doi: 10.1016/j.chaos.2020.109925. [DOI] [PMC free article] [PubMed] [Google Scholar]
- Covid Chest X-ray Dataset. https://github.com/ieee8023/covid-chestxray-dataset. Accessed 20 May 2020
- Crokidakis N. COVID-19 spreading in Rio de Janeiro, Brazil: do the policies of social isolation really work? Chaos Solitons Fractals. 2020;136:109930. doi: 10.1016/j.chaos.2020.109930. [DOI] [PMC free article] [PubMed] [Google Scholar]
- Dammann O, Smart B. Causation in population health informatics and data science. 1. Berlin, Heidelberg: Springer; 2019. pp. 15–26. [Google Scholar]
- Dansana D, et al. Early diagnosis of COVID-19-affected patients based on X-ray and computed tomography images using deep learning algorithm. Soft Comput. 2020 doi: 10.1007/s00500-020-05275-y. [DOI] [PMC free article] [PubMed] [Google Scholar] [Retracted]
- Dellermann D, et al. Hybrid intelligence. Bus Inf Syst Eng. 2019;61(5):637–643. doi: 10.1007/s12599-019-00595-2. [DOI] [Google Scholar]
- Dixon BE, et al. Extending an open-source tool to measure data quality: case report on observational health data science and informatics (OHDSI) BMJ Health Care Inform. 2020;27(1):e100054. doi: 10.1136/bmjhci-2019-100054. [DOI] [PMC free article] [PubMed] [Google Scholar]
- Eugster P. Type-based publish/subscribe: concepts and experiences. ACM Trans Program Lang Syst (TOPLAS) 2007;29(1):6-es. doi: 10.1145/1180475.1180481. [DOI] [Google Scholar]
- Fabret F, et al. (2001) Filtering algorithms and implementation for very fast publish/subscribe systems. In: Proceedings of the 2001 ACM SIG-MOD international conference on management of data, pp 115–126
- Fitzgerald RC. Big data is crucial to the early detection of cancer. Nat Med. 2020;26(1):19–20. doi: 10.1038/s41591-019-0725-7. [DOI] [PubMed] [Google Scholar]
- Ford E, et al. Our data, our society, our health: a vision for inclusive and transparent health data science in the United Kingdom and beyond. Learn Health Syst. 2019;3(3):e10191. doi: 10.1002/lrh2.10191. [DOI] [PMC free article] [PubMed] [Google Scholar]
- Goulooze SC, et al. Beyond the randomized clinical trial: innovative data science to close the pediatric evidence gap. Clin Pharmacol Ther. 2019;107:786–795. doi: 10.1002/cpt.1744. [DOI] [PubMed] [Google Scholar]
- Gray AJG, Nutt W (2005) A data stream publish/subscribe architecture with self-adapting queries. In: Meersman R, Tari Z (eds) On the Move to Meaningful Internet Systems 2005: CoopIS, DOA, and ODBASE. OTM 2005. Lecture Notes in Computer Science, vol 3760. Springer, Berlin, Heidelberg. 10.1007/11575771_27
- Harrison TH, Levine DL, Schmidt Douglas C. The design and performance of a real-time CORBA event service. ACM SIGPLAN Notices. 1997;32(10):184–200. doi: 10.1145/263700.263734. [DOI] [Google Scholar]
- Hemdan EE-D, Shouman MA, Karar ME (2020) Covidx-net: a framework of deep learning classifiers to diagnose covid-19 in x-ray images. arXiv:2003.11055
- Ho CWL, et al. Governance of automated image analysis and artificial intelligence analytics in healthcare. Clin Radiol. 2019;74:329–337. doi: 10.1016/j.crad.2019.02.005. [DOI] [PubMed] [Google Scholar]
- Huang P, et al. Use of chest CT in combination with negative RT-PCR assay for the 2019 novel coronavirus but high clinical suspicion. Radiology. 2020;295(1):22–23. doi: 10.1148/radiol.2020200330. [DOI] [PMC free article] [PubMed] [Google Scholar]
- Hui DS, et al. The continuing 2019-nCoV epidemic threat of novel coronaviruses to global health—the latest 2019 novel coronavirus outbreak in Wuhan, China. Int J Infect Dis. 2020;91:264–266. doi: 10.1016/j.ijid.2020.01.009. [DOI] [PMC free article] [PubMed] [Google Scholar]
- Jinyang Gu, Han Bing, Wang Jian. COVID-19: gastrointestinal manifestations and potential fecal–oral transmission. Gastroenterology. 2020;158(6):1518–1519. doi: 10.1053/j.gastro.2020.02.054. [DOI] [PMC free article] [PubMed] [Google Scholar]
- Kaggle Chest x-ray Images (Pneumonia) Dataset. https://www.kaggle.com/paultimothymooney/chest-xray-pneumonia. Accessed 20 May 2020
- Khan S, et al. Optimized gabor feature extraction for mass classification using cuckoo search for big data e-healthcare. J Grid Comput. 2019;17(2):239–254. doi: 10.1007/s10723-018-9459-x. [DOI] [Google Scholar]
- Kroft LJM, et al. Added value of ultra-low-dose computed tomography, dose Equivalent to chest x-ray radiography, for diagnosing chest pathology. J Thoracic Imaging. 2019;34(3):179. doi: 10.1097/RTI.0000000000000404. [DOI] [PMC free article] [PubMed] [Google Scholar]
- Li Y-C, Bai W-Z, Hashikawa T. The neuroinvasive potential of SARS-CoV2 may play a role in the respiratory failure of COVID-19 patients. J Med Virol. 2020;92(6):552–555. doi: 10.1002/jmv.25728. [DOI] [PMC free article] [PubMed] [Google Scholar]
- Lin C-HA, Berger MS. Advancing neuro-oncology of glial tumors from big data and multidisciplinary studies. J Neuro-Oncol. 2020;146(1):1–7. doi: 10.1007/s11060-019-03369-8. [DOI] [PubMed] [Google Scholar]
- Liu H, et al. Clinical and CT imaging features of the COVID-19 pneumonia: focus on pregnant women and children. J Infect. 2020;80(5):e7–e13. doi: 10.1016/j.jinf.2020.03.007. [DOI] [PMC free article] [PubMed] [Google Scholar]
- Mandal M, et al. A model based study on the dynamics of COVID-19: prediction and control. Chaos Solitons Fractals. 2020;136:109889. doi: 10.1016/j.chaos.2020.109889. [DOI] [PMC free article] [PubMed] [Google Scholar]
- Melin P, et al. Analysis of spatial spread relationships of coronavirus (COVID-19) pandemic in the world using self organizing maps. Chaos Solitons Fractals. 2020;138:109917. doi: 10.1016/j.chaos.2020.109917. [DOI] [PMC free article] [PubMed] [Google Scholar]
- Melin P, et al. Multiple ensemble neural network models with fuzzy response aggregation for predicting COVID-19 time series: the case of Mexico”. Healthcare. 2020;8(2):181. doi: 10.3390/healthcare8020181. [DOI] [PMC free article] [PubMed] [Google Scholar]
- Miri SM, et al. Panic of buying toilet papers: a historical memory or a horrible truth? Systematic review of gastrointestinal manifestations of COVID-19. Hepat Mon. 2020;20(3):e102729. doi: 10.5812/hepatmon.102729. [DOI] [Google Scholar]
- Narin A, Kaya C, Pamuk Z (2020) Automatic detection of coronavirus disease (covid-19) using X-ray images and deep convolutional neural networks. arXiv:2003.10849 [DOI] [PMC free article] [PubMed]
- Ng M-Y, et al. Imaging profile of the COVID-19 infection: radiologic findings and literature review”. Radiol Cardiothoracic Imag. 2020;2(1):e200034. doi: 10.1148/ryct.2020200034. [DOI] [PMC free article] [PubMed] [Google Scholar]
- Ngiam KY, Khor W. Big data and machine learning algorithms for health-care delivery. Lancet Oncol. 2019;20(5):e262–e273. doi: 10.1016/S1470-2045(19)30149-4. [DOI] [PubMed] [Google Scholar]
- Njølstad PR, et al. Roadmap for a precision-medicine initiative in the Nordic region”. Nat Genet. 2019;51(6):924–930. doi: 10.1038/s41588-019-0391-1. [DOI] [PubMed] [Google Scholar]
- Palanisamy V, Thirunavukarasu R. Implications of big data analytics in developing healthcare frameworks–A review. J King Saud Univ-Comput Inf Sci. 2019;31(4):415–425. [Google Scholar]
- Paul PK, Dey JL (2017) Data science Vis-`a-Vis efficient healthcare and medical systems: a techno-managerial perspective. In: 2017 innovations in power and advanced computing technologies (i-PACT). IEEE, pp 1–8
- Paul PK, et al. Health data science: insight into the relevance of the domain with emerging and possible academic programs-a knowledge survey. Health. 2016;2(10):16. [Google Scholar]
- Sabour S, Frosst N, Hinton GE (2017) Dynamic routing between capsules. In: Advances in neural information processing systems, pp 3856–3866
- Sethy PK, Behera SK (2020) Detection of coronavirus disease (covid-19) based on deep features. Preprints 2020030300, p 2020
- Shukla AK, Muhuri PK. Big-data clustering with interval type-2 fuzzy uncertainty modeling in gene expression datasets. Eng Appl Artif Intell. 2019;77:268–282. doi: 10.1016/j.engappai.2018.09.002. [DOI] [Google Scholar]
- Singh J, et al. (2008) Policy-based information sharing in publish/subscribe middleware. In: 2008 IEEE workshop on policies for distributed systems and networks. IEEE, pp 137–144
- Suwinski P, et al. Advancing personalized medicine through the application of whole exome sequencing and big data analytics. Front Genet. 2019;10:49. doi: 10.3389/fgene.2019.00049. [DOI] [PMC free article] [PubMed] [Google Scholar]
- Tanenbaum AS, Van Steen M. Distributed systems: principles and paradigms. Upper Saddle River: Prentice-Hall; 2007. [Google Scholar]
- Van Den Berg Albert, et al. Personalised organs-on-chips: functional testing for precision medicine. Lab Chip. 2019;19(2):198–205. doi: 10.1039/C8LC00827B. [DOI] [PMC free article] [PubMed] [Google Scholar]
- Wadhwa R, et al. (2015) A pub/sub based architecture to support public healthcare data exchange. In: 2015 7th international conference on communication systems and networks (COMSNETS). IEEE, pp 1–6
- Wang CJ, Ng CY, Brook RH. Response to COVID-19 in Taiwan: big data analytics, new technology, and proactive testing. JAMA. 2020;323(14):1341–1342. doi: 10.1001/jama.2020.3151. [DOI] [PubMed] [Google Scholar]
- Zhang Y, et al. Identifying biomarker candidates of influenza infection based on scalable time-course big data of gene expression. Comput Intell. 2019;35(3):610–624. doi: 10.1111/coin.12226. [DOI] [Google Scholar]
- Zou Y, Cao J, Wu H (2010) “TraffiCast: real-time pub/sub based video surveillance system over interconnected WMNs and WSNs”. In: 2010 6th IEEE international conference on distributed computing in sensor systems workshops (DCOSSW). IEEE, pp 1–6
Associated Data
This section collects any data citations, data availability statements, or supplementary materials included in this article.
Data Availability Statement
1-Covid Chest X-ray Dataset https://github.com/ieee8023/covid-chestxray-dataset. 2-Kaggle Chest X-ray Images (Pneumonia) Dataset https://www.kaggle.com/paultimothymooney/chest-xray-pneumonia.


