

Abstract
The biodegradability of phtalic acid esters in marine and freshwater environments was characterized by their binding free energy with corresponding degrading enzymes. According to comprehensive biodegradation effects weights, the binding free energy values were converted into dimensionless efficacy coefficient using ratio normalization method. Then, considering comprehensive dual biodegradation effects value and the structural parameters of PAEs in both marine and freshwater environments, a 3D‐QSAR pharmacophore model was constructed, five PAE derivatives (DBP−COOH, DBP−CHO, DBP−OH, DINP−NH2, and DINP−NO2) were screened out based on their environmental friendliness, functionality and stability. The prediction of biodegradation effects on five PAE derivatives by biodegradation models in marine and freshwater environment increased by 15.90 %, 15.84 %, 27.21 %, 12.33 %, and 8.32 %, and 21.57 %, 15.21 %, 20.99 %, 15.10 %, and 9.74 %, respectively. By simulating the photodegradation path of the PAE derivative molecular, it was found that DBP−OH can generate .OH and provides free radicals for the photodegradation of microplastics in the environment.
Keywords: pharmacophore models, microplastics, molecular modification, photodegradation, ratio normalization method
Phtalic acid esters, as the main additive component of microplastics, are hard‐to‐degrade. This study developed a ratio‐normalization‐based 3D‐QSAR comprehensive model for designing environmental friendly PAE derivatives. The proposed method has advantages in reflecting dual biodegradation effects of PAEs in marine and freshwater environments. The PAE derivative DBP‐OH can form •OH and promote the photodegradation of microplastics under natural light.

1. Introduction
Because of its small density, large buoyancy, and strong durability, plastic has been widely distributed around the world. Around 1.5×10¹¹ kg of plastic enters the terrestrial and marine environment every year and gradually fragments into millimeter‐sized microplastic particles.1, 2 The surface of microplastic particles is uneven and has many cracks, and so crude oil, organic pollutants, bacteria, and even viruses can become attached to them. Microplastic accumulates in both marine and freshwater environments due to the influence of external forces such as monsoons and ocean currents.3, 4 The microplastic particles distributed in aquatic environments can come into direct contact with aquatic organisms, thereby potentially threatening the health of aquatic ecosystems. Investigations in the deep sea of the Rock‐all Trough in the North Atlantic have shown that the abundance of microplastic in deep seawater is up to 70.8 n/m3, which is comparable to that in the surface water; nearly half (48 %) of the invertebrates collected in deep seawater contain microplastic particles, and their accumulation is equivalent to that of coastal animals,5, 6 indicating that microplastic can migrate vertically in seawater and be ingested by deep‐sea organisms. Plankton and fish that ingest microplastic particles by mistake will have false satiety and toxins from the particles will accumulate in their bodies. Toxins can be transferred and enriched in food chains due to predation relationships, and can thus eventually threaten human health.7, 8, 9
In a study of adult male zebrafish (Danio rerio) exposed to polystyrene microspheres (1000 μg/L) with diameters of 0.5 and 50 μm, it was found that after 14 days, the zebrafish intestinal microflora significantly changed and caused a certain degree inflammatory response.10 Lonnstedt et al. found that polystyrene microplastic particles (90 μm) can inhibit the hatchability and growth rate of Perca fluviatilis larvae, change the adult feeding preferences and innate behavior, and results in a loss of response to danger signals for predators, and thus significantly increases the mortality rate.11 Microplastic leachate can also cause the death of marine copepods.12, 13, 14
After microplastic enters ocean and freshwater environments, organisms become attached to the particles so that their weight increases and they sink to the bottom of the water. It will take about 400 years for these plastics to be completely degraded in the environment,15 and its resistance to degradation is the main reason for its environmental hazardousness. It is generally believed that microplastic particles entering the ocean and freshwater environment usually have two destinations: most are ingested by aquatic animals whereas a very small amount is degraded by photolysis or micro‐organisms.16 However, chemists believe that the degradation of plastics by ultraviolet (UV) light or micro‐organisms is difficult and the degree of degradation is small.5, 17 Moreover, plastic pollution in deep‐sea sediment cannot be degraded by UV light. As a result, microplastic particles remain on the ocean floor for a relatively long time.18, 19
Plasticizers are often added during the synthesis process of plastics to increase their plasticity. Phthalic acid esters (PAEs) are the main components of plasticizers in plastic products, and comprise the largest amount of plasticizer in the world, accounting for about 85 % of the global plasticizer market.20, 21 The main chemical constituent of plastic products for daily necessities and industrial raw materials that cause pollution in rivers entering ocean and freshwater environments is polyvinyl chloride (PVC).22, 23 This product contains the largest amount of PAE plasticizer, accounting for 95 % of the total amount of plasticizer in the world. The PAE content is 2–10 % in rigid PVC (used in chair rails, roof sheathings, flat roofs, etc.),24, 25 is 10–30 % in semi‐rigid PVC (used in electrical casing, fluid delivery pipes, etc.),26 and is 30–70 % in soft PVC (used in cable sleeves, wire insulation tubes, medical tubes, etc.).27, 28 In addition, the occurrences of PAEs were widespread in the researched lakes with the total PAE concentrations ranged from 0.386 to 3.184 μg/L in water, from52.6 to 8216.4 ng/g dryweight in sediments and from 138.7 to 2052.4 μg/g dry weight in suspended particles from representative lakes of Beijing.29
PAEs cause hormone interference, reproductive, and developmental toxicity as well as carcinogenicity, teratogenicity, and mutagenicity.30, 31 As one of the most commonly detected endocrine disruptors in the environment, PAEs have been widely reported as a threat to humans and animals.32, 33 During the degradation of plastic, they are released into the marine and freshwater environment and are considered to be a major source of pollution by the current plastics industry. The US and the EU have indicated that the environmental control of such substances is a high priority. Studies have confirmed that the degradation of PAEs is difficult and their presence has been detected in various environmental media.34, 35, 36
Some scholars have explored the reaction mechanisms of UV photodegradation pathways of microplastic particles in the natural environment. When aqueous solutions of microplastic particles comprising polypropylene (PP), polyethylene (PE), or PVC are exposed to UV light, the chemical bonds in their polymer chains are destroyed to generate free radicals (PO., POO., .OH, etc.); these react with oxygen to form peroxy radicals, and then further complex radical reactions occur that cause auto‐oxidation. Peroxy radicals are highly oxidizing substances, and their production can promote the photodegradation of plastics such as PP, PE, and PVC,37, 38, 39 indicating that the generation of free radicals such as .OH is closely related to the UV photodegradation of microplastics and is thus an important influencing factor on the photolysis of microplastics.
In this paper, we examine PAEs, the main additive components of microplastics, to study the degradation of microplastics in marine and freshwater environments. Initially, we used the ratio normalization method to characterize the comprehensive biodegradation effect values of PAEs in marine and freshwater environments. We then constructed a 3D‐QSAR pharmacophore model that takes into account the comprehensive biodegradation effect values of PAEs and structure parameters in both marine and freshwater environments. Next, environmentally friendly PAEs molecules modification were performed to design and screen PAE derivative molecules with high biodegradability in marine and freshwater environments based on the model. Moreover, we focus on screening PAE derivative molecules that can produce .OH in the UV photodegradation path, so as to improve the biodegradability of the PAEs, thus provide .OH on the UV photodegradation of microplastics, indirectly promoting the photodegradation rate of microplastics. Compared with the existing research, the construction of a pharmacophore model of the comprehensive biodegradation effect values and structural parameters of PAEs is expected to break the limitation of designing derivative molecules based on the single effect of pollutants40 and shorten the time of molecular screening, which has certain research significance.
2. Results and Discussion
2.1. Construction of the Biodegradable PAE Molecule Pharmacophore Model
We used Discovery Studio 2.5 software to establish a 3D‐QSAR pharmacophore model based on the comprehensive dual biodegradation effect values of PAE molecules in marine and freshwater environments as dependent variables and the molecular structure parameters as independent variables. We randomly selected 10 PAE molecules as the training set to obtain the comprehensive dual biodegradation effects pharmacophore model for both marine and freshwater environments constructed by Hypo Gen and statistical data (Table 1). Four PAE molecules were used as the test set for comprehensive effects pharmacophore model verification (Table 2). Similarly, 10 PAE molecules were randomly selected as the training set to construct PAE single biodegradation effects pharmacophore models for marine and freshwater environments, respectively (Table 1), and four PAE molecules were used as the test set (Table 2).
Table 1.
Comprehensive biodegradation effects and single biodegradation effect pharmacophore models for PAEs in marine and freshwater environments constructed with Hypo Gen.
|
Model tape |
Hypo Gen model 3D spatial relationship |
Hypo No. |
Total cost |
RMS |
R2 |
Features |
|---|---|---|---|---|---|---|
|
Biodegradation comprehensive effects pharmacophore model in marine and freshwater environment |
|
C1 |
50.91 |
0.02 |
0.91 |
HBA[a] HBA RA[b] |
|
C2 |
50.91 |
0.00 |
0.00 |
HBA HBA RA |
||
|
C3 |
50.91 |
0.83 |
0.83 |
HBA HBA RA |
||
|
C4 |
50.91 |
0.00 |
0.00 |
HBA RA |
||
|
C5 |
50.91 |
0.02 |
0.77 |
HBA HBA RA |
||
|
C6 |
50.91 |
0.00 |
0.00 |
HBA HBA H[c] |
||
|
C7 |
50.91 |
0.02 |
0.78 |
HBA HBA |
||
|
C8 |
50.91 |
0.00 |
0.00 |
HBA HBA |
||
|
C9 |
50.91 |
0.02 |
0.83 |
HBA HBA |
||
|
Configuration cost: |
16.15 |
Fixed cost: |
33.64 |
Null cost: |
50.91 |
|
|
Biodegradation singel effects pharmacophore model in marine environment |
|
M1 |
50.71 |
0.04 |
0.95 |
HBA HBA RA |
|
M2 |
50.71 |
0.00 |
0.00 |
HBA HBA H |
||
|
M3 |
50.73 |
0.06 |
0.85 |
HBA HBA H |
||
|
M4 |
50.71 |
0.00 |
0.00 |
HBA HBA RA |
||
|
M5 |
50.73 |
0.07 |
0.81 |
HBA HBA RA |
||
|
M6 |
50.71 |
0.00 |
0.00 |
HBA HBA H |
||
|
M7 |
50.73 |
0.07 |
0.78 |
HBA HBA HBA |
||
|
M8 |
50.71 |
0.00 |
0.00 |
HBA HBA RA |
||
|
M9 |
50.73 |
0.07 |
0.81 |
HBA HBA |
||
|
Configuration cost: |
15.95 |
Fixed cost: |
33.64 |
Null cost: |
50.74 |
|
|
Biodegradation single effects pharmacophore model in freshwater environment |
|
F1 |
48.80 |
0.04 |
0.86 |
HBA HBA RA |
|
F2 |
48.79 |
0.00 |
0.00 |
HBA HBA RA |
||
|
F3 |
48.80 |
0.04 |
0.84 |
HBA HBA RA |
||
|
F4 |
48.79 |
0.00 |
0.00 |
HBA HBA H |
||
|
F5 |
48.80 |
0.04 |
0.86 |
HBA HBA RA |
||
|
F6 |
48.79 |
0.00 |
0.00 |
HBA HBA |
||
|
F7 |
48.80 |
0.04 |
0.79 |
HBA HBA |
||
|
F8 |
48.79 |
0.00 |
0.00 |
HBA HBA RA |
||
|
F9 |
48.80 |
0.04 |
0.83 |
HBA HBA H |
||
|
Configuration cost: |
14.03 |
Fixed cost: |
33.64 |
Null cost: |
48.80 |


[a] Hydrogen Bond Acceptor. [b] Aromatic Ring [c] Hydrophobic.
Table 2.
Comprehensive biodegradation effect values and predictions of PAEs in the test set with model Hypo 1.
|
PAEs |
|
Fit value |
Estimate |
Activ. |
Error |
|---|---|---|---|---|---|
|
Hypo C1 |
BMPP |
5.84 |
1.80 |
2.89 |
−1.60 |
|
DIDP |
5.73 |
2.32 |
1.23 |
1.89 |
|
|
DIPP |
5.52 |
3.81 |
2.01 |
1.90 |
|
|
BBP |
5.93 |
1.46 |
1.62 |
−1.10 |
|
|
Hypo M1 |
DEP |
5.82 |
2.54 |
1.99 |
1.28 |
|
BBP |
5.78 |
1.85 |
2.108 |
−1.13 |
|
|
DIHP |
5.78 |
1.86 |
1.90 |
−1.02 |
|
|
DINP |
5.76 |
2.16 |
2.03 |
1.07 |
|
|
Hypo F1 |
DEP |
5.85 |
2.61 |
1.88 |
1.38 |
|
DIHP |
5.79 |
2.15 |
2.14 |
1.00 |
|
|
DINP |
5.93 |
1.93 |
2.07 |
−1.07 |
|
|
BBP |
5.90 |
1.75 |
1.90 |
−1.09 |
As can be seen in the results in Table 1, Hypo C1 obtained the best evaluation scores for nine PAEs with the comprehensive biodegradation effects pharmacophore model for both marine and freshwater environments constructed with Hypo Gen: it had the smallest total cost (50.91) and root‐mean‐squared (RMS) error (0.02), and the maximum R2 was 0.91 (>0.7), (Hyho C2, C4, C6, and C8 were not considered because the RMS error and R2 were 0). In addition, the Hypo C1 pharmacophore model had a configuration value of 16.15 (<17), indicating that it offered the best predictions for the comprehensive biodegradation effect pharmacophore model for PAEs in both marine and freshwater environments. Thus, the significance of the model was established.40, 41 In the same way, optimal prediction with the single biodegradation effect pharmacophore models for PAEs in marine and freshwater environments was with Hypo M1 and Hypo F1, respectively.
2.2. Reliability Evaluation of the PAE Molecular Biodegradation Effects Pharmacophore Model
The results with the training set containing 10 PAE molecules confirmed the reliability of Hypo C1. We used a test set to evaluate the reliability and predictive ability of the comprehensive biodegradation effects pharmacophore model Hypo C1 for PAEs in marine and freshwater environments. The matches between Hypo C1 and the four PAE molecules in the test set were found to be good with error values of less than 2 (Table 2), which is within the allowable error range and indicates that it has stable prediction ability for PAE molecules.42 Therefore, we used the force field information that the PAE comprehensive biodegradation effects pharmacophore model Hypo C1 displayed to modify the target PAE molecules. In addition, the test set evaluation of the PAE single biodegradation effect pharmacophore models for marine and freshwater environments (Hypo M1 and Hypo F1, respectively) was also performed; the statistical data of the test results are listed in Table 2. The results show that they also have good robustness and predictive ability.
2.3. PAE Molecular Modification for Low Comprehensive Biodegradation Effect Values
As mentioned previously, the ideal comprehensive biodegradation effect value (binding free energy) of a PAE molecule in marine and freshwater environments is the smallest; the lower the binding free energy, the higher the biodegradability of PAEs. Therefore, the purpose of this research was to reduce the value of the comprehensive dual biodegradation effect for PAE molecules in marine and freshwater environments. We selected three representative superior control PAE molecules: dibutyl phthalate (DBP), di‐2‐ethylhexyl phthalate (DEHP), and diisononyl phthalate (DINP) to conduct molecular design experiments to obtain low comprehensive biodegradation effect values. The model Hypo C1 was used to analyze the various force fields generated by DBP, DEHP, and DINP molecules to determine the modified sites and substituent groups of PAE molecules.
2.3.1. Selection of PAE Molecular Modification Substitution Positions for Low Comprehensive Biodegradation Effect Values
The PAE hydrogen bond acceptor (HBA) positions can be determined on the 3D congruent map of Hypo C1 and DBP, DEHP, and DINP in Figure 1; the information for Hypo C1 can be integrated into the molecular planar structure diagram in the 3D congruent map regardless of the position of the green (HBAs) covering the PAE common framework structure position 11′22′33′44′55′66′ as shown in Figure 2. It can be seen that the HBA groups are all distributed at the connecting positions where the carboxyl oxygen atoms of the DBP, DEHP, and DINP molecules are connected to the branch chain (position 7), indicating that the introduction of HBA groups at this position in DBP, DEHP, and DINP can affect the comprehensive biodegradation effect value (the positions of the introduced substitution groups in the DMP, DBP and DNOP molecules are shown in Figure 2). This provides a theoretical basis for further design and modification of the PAE molecules.
Figure 1.
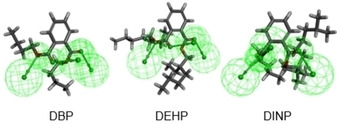
A 3D congruent map of Hypo C1 and DBP, DEHP, and DINP.
Figure 2.
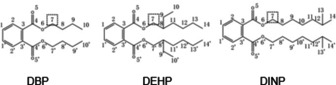
Schematic diagrams of the substitution positions affecting the comprehensive biodegradation effect values of DBP, DEHP, and DINP.
2.3.2. Selection of PAE Molecular Modification Substitution Groups for Low Comprehensive Biodegradation Effect Values
It can be seen in Figure 1 that the HBA groups act at site 7 in the DBP, DEHP, and DINP molecules, thus the introduction of HBA or hydrogen bond donor (HBD) groups can affect the comprehensive biodegradation effect value of a PAE. Therefore, HBD groups can be introduced at site 7 of DBP, DEHP, and DINP molecules to reduce the comprehensive biodegradation effect value of target molecules. 11 HBD groups were selected as substitution groups, including hydroxyl (−OH), carboxyl (−COOH), amino (−NH2), amide (−CONH2), nitro (−NO2), and aldehyde group (−CHO), chloro (−Cl), bromine (−Br), fluoro (−F), carbonyl (−COCH3), methoxy (−OCH3). Pharmacophore model Hypo C1 was used to perform single‐site substitution reactions in DBP, DEHP, and DINP. A total of 33 mono‐substituted derivative molecules were designed, of which 25 had reduced comprehensive biodegradation effect values; the predicted comprehensive biodegradation effect values are reported in Table 3. The fit values of the PAE derivative molecules were relatively high, indicating that they were well matched by the Hypo C1 model; the comprehensive dual biodegradation effect values of DEP−Cl, DEHP−NH2, and DINP−COCH3 were reduced by 26.38 %, 17.61 %, and 15.63 % compared with the target molecule, respectively, and so the modification effect appears to have been significant.
Table 3.
Predictive values and degree of change using comprehensive and single biodegradation effects models for PAE derivatives molecules in marine and freshwater environments.
|
Compd. |
|
Cpred |
Fit Value |
Reduction (%) |
Fpred |
Reduction (%) |
Mpred |
Reduction (%) |
Ratio |
|---|---|---|---|---|---|---|---|---|---|
|
Before modification |
DBP |
1.52 |
– |
– |
2.00 |
– |
1.98 |
– |
– |
|
After modification |
DBP−CONH2 |
1.31 |
5.75 |
0.14 |
1.76 |
0.12 |
1.57 |
0.21 |
0.58 |
|
DBP−Br |
1.34 |
5.87 |
0.12 |
1.86 |
0.07 |
1.78 |
0.10 |
0.72 |
|
|
DBP−COCH3 |
1.49 |
5.87 |
0.02 |
1.86 |
0.07 |
1.51 |
0.24 |
0.30 |
|
|
DBP−Cl |
1.12 |
5.89 |
0.26 |
1.69 |
0.16 |
1.72 |
0.13 |
1.18 |
|
|
DBP−F |
1.31 |
5.81 |
0.14 |
1.69 |
0.16 |
1.83 |
0.08 |
2.04 |
|
|
DBP−NH2 |
1.60 |
5.82 |
−0.05 |
1.74 |
0.13 |
1.53 |
0.23 |
0.58 |
|
|
DBP−OCH3 |
1.46 |
5.92 |
0.04 |
1.59 |
0.21 |
1.65 |
0.17 |
1.23 |
|
|
DBP−COOH |
1.48 |
5.83 |
0.02 |
1.57 |
0.22 |
1.67 |
0.16 |
1.36 |
|
|
DBP−NO2 |
1.74 |
5.87 |
−0.14 |
1.87 |
0.07 |
1.74 |
0.12 |
0.55 |
|
|
DBP−CHO |
1.42 |
5.98 |
0.07 |
1.70 |
0.15 |
1.67 |
0.16 |
0.96 |
|
|
DBP−OH |
1.34 |
5.93 |
0.12 |
1.58 |
0.21 |
1.44 |
0.27 |
0.77 |
|
|
Before modification |
DEHP |
1.34 |
– |
– |
2.13 |
– |
1.96 |
– |
– |
|
After modification |
DEHP−Br |
1.30 |
5.93 |
0.03 |
2.21 |
−0.04 |
1.97 |
−0.01 |
5.13 |
|
DEHP−COCH3 |
1.42 |
5.97 |
−0.06 |
2.50 |
−0.17 |
2.05 |
−0.05 |
3.47 |
|
|
DEHP−Cl |
1.30 |
5.87 |
0.03 |
2.31 |
−0.08 |
1.42 |
0.27 |
−0.30 |
|
|
DEHP−F |
1.23 |
5.99 |
0.08 |
1.95 |
0.09 |
2.24 |
−0.14 |
−0.60 |
|
|
DEHP−NH2 |
1.11 |
5.79 |
0.18 |
2.16 |
−0.01 |
2.10 |
−0.08 |
0.18 |
|
|
DEHP−CONH2 |
1.25 |
5.83 |
0.07 |
1.96 |
0.08 |
1.96 |
0.00 |
−19.25 |
|
|
DEHP−OCH3 |
1.36 |
5.91 |
−0.01 |
1.99 |
0.07 |
2.39 |
−0.22 |
−0.30 |
|
|
DEHP−NO2 |
1.39 |
5.82 |
−0.04 |
1.81 |
0.15 |
1.91 |
0.02 |
6.72 |
|
|
DEHP−OH |
1.57 |
5.95 |
−0.17 |
2.57 |
−0.21 |
2.07 |
−0.06 |
3.45 |
|
|
DEHP−CHO |
1.21 |
5.86 |
0.10 |
2.01 |
0.06 |
1.84 |
0.06 |
0.94 |
|
|
DEHP−COOH |
1.37 |
5.73 |
−0.02 |
2.13 |
0.00 |
2.00 |
−0.02 |
0.02 |
|
|
Before modification |
DINP |
1.33 |
– |
– |
2.07 |
– |
2.03 |
– |
– |
|
After modification |
DINP−CONH2 |
1.50 |
5.84 |
−0.13 |
2.11 |
−0.02 |
1.99 |
0.02 |
−1.28 |
|
DINP−COCH3 |
1.13 |
5.93 |
0.16 |
1.98 |
0.04 |
2.03 |
0.00 |
−16.66 |
|
|
DINP−Br |
1.22 |
5.87 |
0.09 |
2.24 |
−0.08 |
2.05 |
−0.01 |
7.34 |
|
|
DINP−F |
1.22 |
5.75 |
0.09 |
1.82 |
0.12 |
2.19 |
−0.08 |
−1.49 |
|
|
DINP−Cl |
1.27 |
5.87 |
0.05 |
1.88 |
0.09 |
2.06 |
−0.02 |
−5.81 |
|
|
DINP−NH2 |
1.23 |
5.87 |
0.08 |
1.76 |
0.15 |
1.78 |
0.12 |
1.23 |
|
|
DINP−OCH3 |
1.16 |
5.89 |
0.13 |
1.95 |
0.06 |
2.03 |
0.00 |
−81.91 |
|
|
DINP−COOH |
1.33 |
5.81 |
0.00 |
2.10 |
−0.01 |
1.95 |
0.04 |
−0.38 |
|
|
DINP−OH |
1.25 |
5.82 |
0.07 |
2.39 |
−0.15 |
1.89 |
0.07 |
−2.23 |
|
|
DINP−NO2 |
1.24 |
5.92 |
0.07 |
1.87 |
0.10 |
1.86 |
0.08 |
1.17 |
|
|
DINP−CHO |
1.22 |
5.98 |
0.09 |
1.75 |
0.16 |
2.13 |
−0.05 |
−3.04 |
2.4. Assessment of Modified PAE Derivative Molecules via Biodegradation Effects Pharmacophore Models
Prediction of the biodegradability of PAE derivative molecules in marine and freshwater environments and the validity of the comprehensive biodegradation effects pharmacophore model for both environments were carried out with the single biodegradation effect pharmacophore models for each environment. The values predicted by the single biodegradation effect pharmacophore models were compared with the comprehensive biodegradation effects value; the verification results are summarized in Table 3.
According to Table 3, 33 biodegradation effects values of the target DBP, DEHP, DINP derivative molecules had varying degrees of change. Among them, there were 12 comprehensive biodegradation effects predicted values (DBP−CONH2, DBP−Br, DBP−COCH3, DBP−Cl, DBP−F, DBP−OCH3, DBP−COOH, DBP−CHO, DBP−OH, DEHP−CHO, DINP−NH2, and DINP−NO2) that were improved (reduced) compared to the single biodegradation effect predicted values. Except for the comprehensive biodegradation effect values of DBP−NH2 and DBP−NO2, which were higher than the original values of their target molecules, the comprehensive biodegradation effect values of the other 9 DBP derivative molecules were reduced by varying degrees (the lower the biodegradation effect predicted value, the better the degradability). The prediction results of the single biodegradation effect model values of all DBP derivative molecules in marine and freshwater environments were reduced, which is consistent with the trend of comprehensive biodegradation effects values. There were relatively poor results in reducing the single biodegradation effect predicted values of DEHP and DINP molecules after modification. The comprehensive biodegradation effect values of DEHP derivative molecules increased by 50 %, and the predicted values of the single biodegradation effect models also increased. Moreover, the comprehensive biodegradation effects value of the DINP derivative molecules (except for DINP−CONH2) decreased; the results show that nearly 50 % of the predicted single biodegradation effect values of the DINP derivative molecules did not improve.
As mentioned earlier, when calculating the comprehensive biodegradation effects value of PAE, the weights of biodegradability in marine and freshwater environments are both set at 50 %. Based on the PAE prediction results using the single biodegradation effect models for the marine and freshwater environments (Table 3), the weight distribution of the predicted reduction of the same derivative molecule's single biodegradation effect basically concordant with 50 %: 50 % was found for DBP−Br, DBP−Cl, DBP−OCH3, DBP−COOH, DBP−CHO, DBP−OH, DEHP−CHO, DINP−NH2, and DINP−NO2.
2.5. Evaluation of the Environmental Friendliness of the PAE Derivative Molecules
Environmental hazardousness (biotoxicity, estrogen toxicity, bioconcentration, persistence, and migration), UV photodegradability, and biodegradation intermediate product toxicity are used as indicators to characterize the environmental friendliness of PAEs before and after molecular modification. The PAE derivative molecules simultaneous demonstrating low environmental hazardousness, strong UV photodegradability, and low toxicity of biodegradation intermediate products are identified as being environmentally friendly.
2.5.1. Evaluation of the Environmental Hazardousness of the PAE Derivative Molecules
We used the PAE molecular toxicity, persistence, bioaccumulation, and migration models constructed by Qiu et al.40 to predict the environmental friendliness of the previously mentioned 12 PAE derivative molecules, and we calculated the energy gap values, energy values, and frequencies of 12 PAE derivative molecules as functional evaluation factors. Finally, five environmentally friendly PAE derivative molecules with functional considerations were screened out (Table 4).
Table 4.
Evaluation of the environmental friendliness and functionality of the PAE derivative molecules.
|
PAEs |
Bio‐toxicity LC50 |
Estrogenic‐toxicity EC50 |
Bioaccumulation logBCF |
Persistence log t1/2 |
Migration pP L |
Energy gap (e.v.) |
Energy (a.u.) |
Frequency |
||||||||
|---|---|---|---|---|---|---|---|---|---|---|---|---|---|---|---|---|
|
|
Pred. |
Change rate |
Pred. |
Change rate |
Pred. |
Change rate |
Pred. |
Change rate |
Pred. |
Change rate |
Value |
Change rate |
Value |
Change rate |
Value |
|
|
Before modification |
DBP |
0.53 |
– |
0.23 |
– |
2.53 |
– |
3.45 |
– |
0.65 |
– |
5.47 |
– |
−1746.04 |
– |
5.19 |
|
After modification |
DBP−CONH2 |
0.52 |
−1.99 % |
0.51 |
120.50 % |
1.10 |
−56.64 % |
3.60 |
4.39 % |
0.30 |
−54.57 % |
5.4 |
−1.28 % |
−1866.04 |
−6.87 % |
4.87 |
|
DBP−Br |
0.58 |
11.04 % |
0.24 |
1.98 % |
0.96 |
−61.99 % |
3.25 |
−5.73 % |
0.30 |
−53.62 % |
5.05 |
−7.68 % |
−1796.74 |
−2.90 % |
4.59 |
|
|
DBP−COCH3 |
0.56 |
5.81 % |
0.60 |
159.27 % |
1.10 |
−56.55 % |
3.63 |
5.31 % |
0.30 |
−54.50 % |
5.49 |
0.37 % |
−1862.57 |
−6.67 % |
5.62 |
|
|
DBP−Cl |
0.81 |
53.66 % |
0.36 |
57.16 % |
0.79 |
−68.77 % |
3.62 |
5.04 % |
0.29 |
−55.35 % |
5.12 |
−6.40 % |
−1901.88 |
−8.93 % |
3.11 |
|
|
DBP−F |
1.03 |
95.33 % |
0.17 |
−25.10 % |
1.06 |
−58.11 % |
3.44 |
−0.09 % |
0.39 |
−39.54 % |
5.37 |
−1.83 % |
‐1859.39 |
−6.49 % |
6.21 |
|
|
DBP−OCH3 |
0.76 |
44.23 % |
0.18 |
−20.43 % |
0.61 |
−76.04 % |
2.37 |
−31.12 % |
0.24 |
−63.33 % |
4.99 |
−8.78 % |
−1826.17 |
−4.59 % |
3.15 |
|
|
DBP−COOH |
0.59 |
12.10 % |
0.41 |
78.60 % |
1.14 |
−54.97 % |
3.33 |
−3.38 % |
0.32 |
−51.54 % |
5.42 |
−0.91 % |
−1870.82 |
−7.15 % |
7.16 |
|
|
DBP−CHO |
0.67 |
27.70 % |
0.59 |
154.50 % |
1.12 |
−55.57 % |
2.98 |
−13.45 % |
0.30 |
−54.08 % |
5.39 |
−1.46 % |
−1830.09 |
−4.81 % |
7.91 |
|
|
DBP−OH |
0.60 |
13.97 % |
0.28 |
21.30 % |
2.11 |
−16.47 % |
3.07 |
−10.92 % |
0.55 |
−16.16 % |
5.59 |
2.19 % |
−1886.87 |
−8.07 % |
5.87 |
|
|
Before modification |
DEHP |
0.09 |
– |
0.03 |
– |
1.27 |
– |
2.82 |
– |
0.51 |
– |
5.78 |
– |
−1859.4 |
– |
7.06 |
|
After modification |
DEHP−CHO |
0.53 |
454.58 % |
0.39 |
1288.59 % |
1.19 |
−6.29 % |
2.51 |
−10.90 % |
1.11 |
116.93 % |
5.56 |
−3.81 % |
−1990.07 |
−7.03 % |
5.49 |
|
Before modification |
DINP |
0.04 |
– |
0.00 |
– |
1.39 |
– |
3.33 |
– |
0.54 |
– |
4.86 |
– |
−1674.48 |
– |
1.66 |
|
After modification |
DINP−NH2 |
0.69 |
1516.65 % |
0.34 |
9462.43 % |
0.96 |
−31.05 % |
3.14 |
−5.81 % |
0.48 |
−9.77 % |
4.86 |
0.00 % |
−1862.57 |
−11.23 % |
6.73 |
|
DINP−NO2 |
0.57 |
1233.44 % |
0.18 |
4991.01 % |
0.96 |
−30.64 % |
3.30 |
−1.07 % |
0.42 |
−21.96 % |
4.79 |
−1.44 % |
−1901.88 |
−13.58 % |
4.31 |
|
According to the prediction results from the PAE biotoxicity models, we know that except for the decrease of the LC 50 value of DBP‐CONH2 (1.99 %), those of the remaining 11 modified PAE derivative molecules all increased to a large extent (5.81–1516.65 %), indicating that the overall reduction in toxicity was significant. The prediction results from the estrogenic‐toxicity model show that the EC 50 values of DBP−F and DBP−OCH3 decreased greatly (25.10 % and 20.43 %, respectively), indicating that the estrogen toxicity was enhanced and so the molecules do not meet the environmentally friendly requirements. Meanwhile, the estrogen toxicity of the remaining PAE derivative molecules was greatly reduced. In the prediction of PAE bioaccumulation model, the logBCF values of the PAE derivative molecules decreased by varying degrees and with values of less than 3, which indicates that their bioaccumulation is suitably low and can be ignored.43 The persistence model indicated that the logt 1/2 values of DBP−CONH2, DBP−COCH3, DBP−Cl, and DEHP−CHO were all significantly increased, and so it is speculated that they can exist in the environment for a long period and thus do not meet the environmental friendly requirements. The migration model results show that except for DEHP−CHO, the migration ability of the other PAE derivative molecules presented a downward trend, with a decrease ranging from 9.77 % to 63.33 %, thus indicating that they are suitable candidates. Although compared with the figures that can show the changes of toxicity directly in the study of Xu et al. and Chen et al.,44, 45 the toxicity of new designed PAE derivatives was still belongs to “Toxic”, while the toxicity predicted by the single effect model by Qiu et al. has been reduced by 9.77 % to 63.33 %, indicating that the toxicity of the derivative molecules has been significantly reduced compared to the target molecules, meeting the requirements of environmental friendliness.
The Gaussian calculation results indicate that the energy gap values of DINP‐NH2, DBP‐COCH3, and DBP‐OH remained unchanged or increased slightly (0 %, 0.37 %, and 2.19 %, respectively), while the energy gap values of the remaining nine new PAE derivative molecules all slightly decreased. Among them, DBP−Br, DBP−Cl, and DBP−OCH3 had larger declines in energy gap values (7.68 %, 6.4 %, and 8.78 %, respectively), exceeding the 5 % cut‐off criterion and indicating poor insulation performance, while the energy gap of the remaining six PAE derivative molecules decreased by less than 4 % (0.91–3.81 %; the larger the energy gap value, the better the insulation.46 Thus, nine of the modified PAE derivative molecules (DBP−CONH2, DBP−COCH3, DBP−F, DBP−COOH, DBP−CHO, DBP−OH, DEHP−CHO, DINP−NH2, and DINP−NO2) had a slight increase in insulation or remain basically unchanged. The energy of the 12 PAE derivative molecules decreased to varying degrees compared to their target molecules, and their frequencies were positive, indicating that their structures were stable.47 After evaluating the biotoxicity, estrogen toxicity, bioaccumulation, persistence, migration, and functional characteristics, five environmentally friendly PAE derivative molecules were finally selected: DBP−COOH, DBP−CHO, DBP−OH, DINP−NH2, and DINP−NO2.
2.5.2. Evaluation of the UV Photodegradation of the PAE Derivative Molecules
There are many different possibilities of the products, related mechanisms, and the site where the UV photodegradation of PAE molecules begins (i. e. where .OH first attacks the PAE molecule) in UV photodegradation of the PAE molecules under different experimental conditions such as different substrates and catalysts.48, 49, 50 UV photodegradation of PAE molecules is closely related to .OH oxidation. PAEs can undergo self‐sensitization photolysis involving .OH. Besides UV light, .OH is the main reactive radical in the photolysis process of PAE molecules.51, 52, 53 Hydrogen peroxide (H2O2) exists in natural seawater, as do many heavy metal ions (e. g. Fe2+, Mn2+, Co2+, Cr3+, etc.) that can undergo redox reactions with H2O2 and dissolved oxygen to generate .OH.54 Thus, the photocatalytic degradation pathway of PAEs molecules in marine and freshwater environment can refer to the photolysis mechanism of the PAEs assisting H2O2 to simulate the pathway of environmentally friendly PAEs derivative molecules in this research.
Using H2O2 as a catalyst, GC‐MS was used to analyze and determine the photodegradation products of DEHP.49, 50 The irradiation experiment were carried out in photochemical reactor, equipped with a merry‐go‐round apparatus to ensure uniform light irradiation.55 H2O2 is a strong oxidant and can be decomposed into .OH under UV light. The .OH first attacks the alkoxy bond on ester group of DEHP to form intermediate o‐formylbenzoic acid octyl ester, and then o‐formylbenzoic acid octyl ester combines with .OH to form stable intermediate mono‐(2‐ethylhexyl) phthalate. The C−O bond of mono‐(2‐ethylhexyl) phthalate is cleaved under attack by .OH to form intermediate phthalic acid. In the end, phthalic acid is transformed into intermediate benzoic acid under the action of .OH. The degradation products of branched chains may be recombined to produce linear diols and linear carboxylic acids, and eventually mineralize to CO2 and H2O.52, 56 In addition, various studies have shown that the UV photodegradation reactions of DBP molecules start from the .OH attacking on its branched chains.52, 57 According to the above‐mentioned UV photodegradation pathway of DEHP catalyzed by H2O2, the UV photodegradation pathway of the target molecule DBP and the modified DBP derivative molecule DBP−OH is simulated and inferred (route II in red) in Figure 3.
Figure 3.
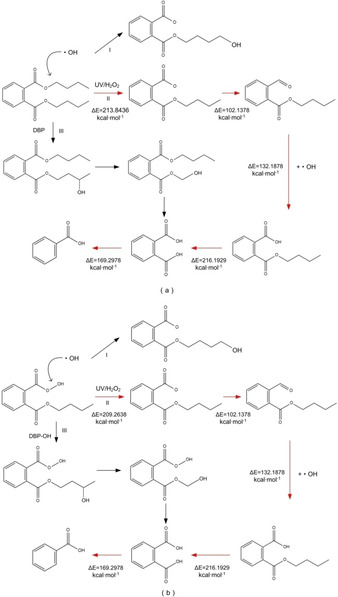
Schematic diagram of the UV photodegradation pathway simulation of DBP (a) and DBP‐OH (b).
In addition, .OH was more probably to form addition products according to the previous studies on PAEs (DEP) degradation, and the stable intermediate mono‐(2‐ethylhexyl) phthalate may also be generated through hydrolysis, which was related to solution pH.58, 59 Thus, according the above research, we simulated the other two possible photodegradation paths of DEP (route I and III). To further study the degree of difficulty before and after modification of UV photodegradation of DBP molecules, the energy barriers of UV photodegradation reactions of DBP and DBP‐OH were calculated (route II in red). The energy barriers of each degradation reaction are marked at the corresponding positions in Figure 3; the lower the barrier, the more likely the occurrence of the photolysis reaction.60 According to the degradation pathway of the DEHP ultraviolet light degradation catalyzed by H2O2, .OH first attacks the alkoxy bond and the O−OH bond on the side chain of the DBP and DBP−OH molecules, respectively, which is the key step in the UV photodegradation reaction of DBP molecules and their derivatives. In this step, the O−OH bond of the DBP−OH molecule is broken and produces .OH after the hydroxyl group has been removed. By calculating the reaction energy barriers required for the entire photodegradation reaction of the DBP molecule and its derivatives, we found that the energy barriers of cleavage reaction of alkoxy bond or O−OH are different only when .OH attacks the side chain at the first step. Compared with the alkoxy bond cleavage reaction energy barrier of target molecule DBP before modification (ΔE=213.8436 kcal/mol), the reaction energy barrier of the modified derivative molecule DBP−OH (ΔE=209.2638 kcal/mol) decreased by 4.5798 kcal/mol, indicating that the modified PAE derivative molecule DBP‐OH can effectively reduce the energy barrier of the O−OH cleavage reaction during the photodegradation process and can form .OH that provides free radicals for the photodegradation of microplastics, thereby potentially promoting the photodegradation reaction of microplastics under natural light irradiation.37, 38, 39
2.5.3. Evaluation of the Biodegradation Products Toxicity of the PAE Derivative Molecules
Due to the long natural decay process of PAEs, biodegradation is more likely to be the most important and effective way to remove them from aquatic and terrestrial environments.61, 62 Bacteria, fungi (even yeast), and algae can effectively degrade PAE under aerobic and anaerobic conditions.63, 64 In a study of DEHP‐degrading bacteria in the activated sludge from a petrochemical plant, it was found that intracellular degrading esterase is mainly responsible for the DEHP degradation.65 DEHP can be further degraded into benzoic acid and p‐hydroxybenzoic acid after reacting with degrading esterase to generate phthalate monoesters and phthalic acid, and finally converted into CO2 and H2O. Li and Gu studied the aerobic microbial degradation of PAEs (such as dimethyl phthalate (DMP) and DBP) and found that the ester bond hydrolysis of PAEs is a common initial step and that the degradation of the intermediate product phthalic acid is a key step in the microbial degradation process.63
In this research, DBP‐CHO with the greatest comprehensive improvement in environmental hazardousness was selected from among five environmentally friendly PAE derivative molecules (DBP−COOH, DBP−CHO, DBP−OH, DINP−NH2, and DINP−NO2) to explore its biodegradation mechanism. Studies have shown that the way microbes degrade PAEs is different according to whether the bacteria are Gram‐negative or Gram‐positive,63, 65 and based on this, the biodegradation path simulations of DBP−CHO were performed for both Gram‐negative and Gram‐positive bacteria (Figure 4). Based on the calculation results of reaction energy barriers, the path of environmental transformation which is more likely to occur is inferred.
Figure 4.
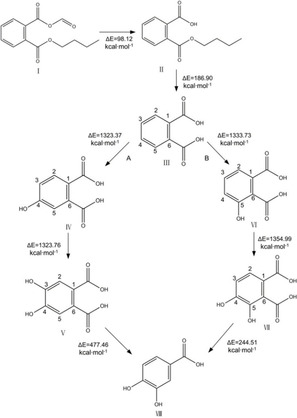
Schematic diagram of the aerobic biodegradation pathway simulation of DBP‐CHO (A: biodegradation pathway by Gram‐negative bacteria, B: biodegradation pathway by Gram‐positive bacteria, I. DBP‐CHO, II. phthalate monoesters, III. phthalic acid, IV. cis‐3,4‐ dihydroxy −3,4‐ dihydrogen p‐phenyl sulfonic acid; V. 3,4‐dihydroxy phthalic acid, VI. cis‐4,5‐dihydroxy‐4,5‐dihydrophthalic acid, VII. 4,5‐ dihydroxy phthalic acid, VIII. protocatechuate).
As shown in Figure 4, DBP−CHO mainly undergoes hydrolysis, oxidation, dehydrogenation, and decarboxylation reactions during microbial degradation.63 The ester bond of DBP−CHO is first cleaved under the action of microbial esterases to undergo a hydrolysis reaction and form phthalate monoesters (II) and is then further hydrolyzed to form phthalic acid (III). There are usually two ways for micro‐organisms to degrade phthalic acid: (A) Gram‐negative bacteria oxidize positions 3 and 4 of phthalic acid (III) through the action of intracellular dioxygenase, which is dehydrogenated to generate 3,4‐dihydroxy phthalic acid (V) and finally, transformation to protocatechuate (VIII) by decarboxylation.
Meanwhile, in the biodegradation pathway of Gram‐positive bacteria, phthalic acid (III) oxidative dehydrogenation at positions 4 and 5 generates dihydroxy phthalic acid (VII), which is transformed to protocatechuate (VIII) by decarboxylation.65 After the organic acids form protocatechuate, the tricarboxylic acid cycle finally degrades it into CO2 and H2O.66 It can be seen in Figure 4 that the total energy barrier required by Gram‐positive bacteria to degrade phthalic acid (III) (2933.23 kcal/mol) is lower than in the Gram‐negative bacteria degradation pathway (3094.59 kcal/mol), thus path B is more likely to occur in the aerobic biodegradation of DBP−CHO. The PAEs biotoxicity and estrogen toxicity pharmacophore model40 was used to predict the biotoxicity and estrogen toxicity of the transformation products produced by pathway B and these were compared with those for the precursor molecule DBP−CHO. The prediction results are shown in Table 5.
Table 5.
Biotoxicity and estrogen toxicity predictive results of PAE derivative DBP‐CHO and the products of its biodegradation by Gram‐positive bacteria.
|
Compd. |
Bio‐toxicity LC50 |
Change rate (%) |
Estrogen toxicity EC50 |
Change rate (%) |
|---|---|---|---|---|
|
I |
0.66 |
– |
0.41 |
– |
|
II |
0.60 |
−8.93 |
0.18 |
−55.79 |
|
III |
55.99 |
8411.13 |
38.37 |
9160.95 |
|
VI |
55.37 |
8316.08 |
38.02 |
9076.95 |
|
VII |
6,134.79 |
932433.07 |
37.70 |
8998.42 |
|
VIII |
444.12 |
67410.10 |
391.41 |
94370.39 |
Except for II (phthalate monoesters), the LC 50 and EC 50 values of the other transformation products of biodegradation pathway by Gram‐positive bacteria were increased by 2–4 orders of magnitude, indicating that II (phthalate monoesters), III (phthalic acid), VI (cis‐4,5‐dihydroxy‐4,5‐dihydrophthalic acid), VII (4,5‐ dihydroxy phthalic acid), and VIII (protocatechuate) have significantly reduced biotoxicity and estrogen toxicity and thus meet the environmentally friendly requirements.
Studies on the environmental behavior of PAEs in vivo and in vitro show that when some of the metabolites of the PAEs exist in the form of monoesters, their toxicity can be higher than their precursor molecules,67 which may have potential risks to the ecological environment and human health. This is consistent with the conclusion that the biotoxicity and estrogen toxicity values of compound II are higher than those of DBP−CHO.
2.6. Universal Analysis of the Biodegradation of PAE Derivative Molecules
In addition to manganese peroxidase and catalase that can degrade PAEs in marine and freshwater environments, respectively, other possible PAE degradation enzymes (serine hydrolase from Pseudomonas aeruginosa PAO1, PDB ID: 4F0J;68, 69, 70 serine hydrolase from Pestalotiopsis microspore, PDB ID: 1YCD;71, 72 lipase from Rhizopus arrizus, PDB ID: 6A0W;68, 73, 74 cutinase from Fusarium solani, PDB ID: 5AJH,75, 76 a biodegradation enzyme from Burkholderia cepacia, PDB ID:2nw6;62, 77 and a biodegradation enzyme from Ochrobactrum sp. Jdc‐41, PDB ID: 1EI5,78, 79 were selected for molecular docking with the five PAE derivative molecules that be screened by environmentally friendly evaluation to evaluate the adaption ability of PAEs derivative molecules to a variety of degrading bacteria (degrading enzymes). These strains come from different environments, including constructed wetland soil, WWTPs, marine sediment, shallow aquifer sediment, marine, and river sludge. The molecular docking results are shown in Figure 5.
Figure 5.
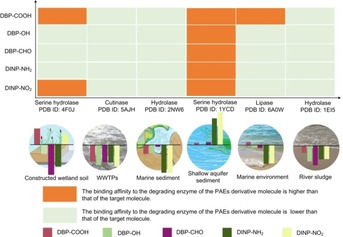
Schematic diagram of the biodegradability evaluation of PAE derivative molecules in various environments.
The scoring function of the molecular docking between the target molecules (DBP and DINP) and their degradation enzymes in five environments were used as the reference values (shown as a horizontal line in the middle of the background image of six circular environments in Figure 5). A bar graph above the horizontal line indicates that the scoring function of the molecular docking between a PAE derivative molecule and the degradation enzyme in the environment is higher than that of the PAE target molecule (a PAE derivative molecule above the horizontal line has better biodegradability). Meanwhile, a bar graph below the horizontal line indicates that the scoring function of the molecular docking between the PAE derivative molecule and the degradation enzyme is lower than that of the target molecule. The length of the bar graph clearly shows the increased and decreased amplitude of the biodegradability changes of the PAE derivative molecules in the environment.
From Figure 5, it can be seen intuitively that compared with the target molecules DBP and DINP, the biodegradability of all five PAE derivative molecules was improved in one‐three different environments; DBP−COOH had an increased probability of biodegradation in constructed wetland soils, shallow aquifer sediments, and marine environments, indicating that it may have good biodegradability in a variety of environments. In addition, it was also found that the binding affinity of the five PAE derivative molecules with the enzymes in shallow aquifer sediments were all improved to some degree. It can be speculated that the designed environmentally friendly PAE derivative molecules have good biodegradability in shallow aquifer sediment, wetland soil, and marine environments.
3. Conclusions
The ratio normalization method was used to construct a 3D‐QSAR comprehensive effects pharmacophore model that takes into account the comprehensive biodegradation effects values and structural parameters of PAEs in marine and freshwater environments, as verified by 3D‐QSAR biodegradable single effect pharmacophore models of PAE molecules in each environment. Based on this, five PAE derivative molecules (DBP−COOH, DBP−CHO, DBP−OH, DINP−NH2, and DINP−NO2), which are both functional and environmentally friendly, were designed. It was found that the conversion products of DBP−CHO showed the lowest toxicity during the biodegradation process. Besides, DBP−OH produced .OH during the photodegradation process which can provide free radicals for the photodegradation of microplastics and potential promote the photodissociation process of microplastics, thereby slowing down the environmental pollution of microplastics to a certain extent.
Experimental Section
Calculation of the Biodegradability of PAEs in Marine and Freshwater Environments – the Molecular Dynamics Method
The biodegradability of PAEs in marine and freshwater environments is represented by combining the free energy of PAEs and their degradation by manganese peroxidase from the bacterium Phanerochaete chrysosporium and catalase from the fungus Aspergillus niger in marine and freshwater environments, respectively.73, 75, 80, 81 The density functional theory (DFT) B3LYP/6‐31G (d) in the Gaussian 09 software was used to optimize the structures of the PAE molecules and their derivatives. With the optimal structures, the binding free energy of 19 PAE molecules and their receptor proteins were calculated in marine and freshwater environments, the results of which are reported in Table 6.
Table 6.
Comprehensive biodegradation effect values of PAE molecules in marine and freshwater environments.
|
PAEs[a] |
Freshwater Environment ΔGbind [kJ/mol] |
pDF [a] |
Marine Environment ΔGbind [kJ/mol] |
pDM [b] |
Comprehensive Evaluation Value |
|---|---|---|---|---|---|
|
BMPP |
−41.33 |
1.62 |
−81.20 |
1.91 |
2.89 |
|
DBP |
−101.05 |
2.00 |
−95.94 |
1.98 |
1.52 |
|
DEHP |
−134.94 |
2.13 |
−90.53 |
1.96 |
1.34 |
|
DEP |
−76.56 |
1.88 |
−97.44 |
1.99 |
1.79 |
|
DIDP |
−135.17 |
2.13 |
−107.54 |
2.03 |
1.23 |
|
DINP |
−118.00 |
2.07 |
−105.96 |
2.03 |
1.33 |
|
DIPP |
−95.96 |
1.98 |
−57.06 |
1.76 |
2.01 |
|
DIPrP |
−48.23 |
1.68 |
−75.61 |
1.88 |
2.65 |
|
DMP |
−71.34 |
1.85 |
−92.18 |
1.96 |
1.91 |
|
DNOP |
−114.22 |
2.06 |
−85.67 |
1.93 |
1.50 |
|
DIHP |
−139.13 |
2.14 |
−79.91 |
1.90 |
1.41 |
|
DUP |
−17.87 |
1.25 |
−58.92 |
1.77 |
5.97 |
|
DTDP |
−175.23 |
2.24 |
−76.58 |
1.88 |
1.32 |
|
BBP |
−78.56 |
1.90 |
−125.31 |
2.10 |
1.62 |
|
DAP |
−103.14 |
2.01 |
−100.76 |
2.00 |
1.47 |
|
DIHXP |
−99.80 |
2.00 |
−74.16 |
1.87 |
1.72 |
|
DMEP |
−86.50 |
1.94 |
−99.27 |
2.00 |
1.64 |
|
DPP |
−78.38 |
1.89 |
−75.82 |
1.88 |
1.94 |
|
DPrP |
−80.28 |
1.90 |
−123.79 |
2.09 |
1.60 |
[a] pDF represents the negative logarithm of the PAE binding free energy in the freshwater environment. [b] pDM represents the negative logarithm of the PAE binding free energy in the marine environment.
The calculation of the binding free energy values of manganese peroxidase and catalase with PAE molecules is based on the molecular dynamics simulation module of the Gromacs software on a Dell PowerEdge R7425 server. The composite systems of manganese peroxidase and catalase with PAE molecules were placed in a cube with a side length of 8.3 nm, respectively, the GROMOS96 43a1 force field was used for molecular restraint, and Na+ ions were added to neutralize the system charge. The composite system was set up as a group and the energy minimization simulation based on the steepest gradient method was performed with the number of simulation steps set to 100,000. The heat bath and pressure bath simulation times of the composite system were both 100 ps, the pressure bath was set to a constant standard atmospheric pressure of 1 bar, and the dynamic simulation calculation time of each level group is set to 200 ps.
Characterization of the Comprehensive Biodegradation Effects of PAEs in Marine and Freshwater Environments – the Ratio Normalization Method
The ratio normalization method has an important indicator (indicator bearing). The measurement may be different when the selected indicator tends to be a larger value (larger‐the‐better, LTB), a smaller value (smaller‐the‐better, STB), or an ideal value (distance‐to‐ideal, DTI).82 The ratio normalization method was used to characterize the biodegradation effect values of PAEs in the marine and freshwater environments (the biodegradation effect characterized by the binding free energy). The actual biodegradation effect values of PAEs in the two environments were converted into the dimensionless efficacy coefficient R s,j (Equation (1)). Next, C (Equation (2)), which represents the comprehensive dual biodegradation effects of PAEs based on the weighted relationship of the PAE molecules, was applied (Table 6). The ideal biodegradability effect value of a PAE molecule in marine and freshwater environments tends to be small.
Equation (1), in which the indicator bearing tends to be STB in the ratio normalization method, is used to convert the comprehensive biodegradation effects value of the dual biodegradation of PAE molecules in the marine and freshwater environment into a dimensionless value R S,j:
| (1) |
where represents the single effect value of the binding free energy of the PAE molecule binding to its degrading enzyme in either the marine or freshwater environment and is the binding free energy effect value of the jth PAE molecule binding to its degrading enzyme.
The purpose of this research is to improve the biodegradability of PAE molecules in the marine and freshwater environment indiscriminately. Therefore, the biodegradation effect weights (w) in the marine and freshwater environments are both selected to be 50 %. According to the set comprehensive biodegradation effects weight, the comprehensive biodegradation effects value for PAE molecules in both the marine and freshwater environments is calculated based on Equation (2), and the comprehensive biodegradation effect value of a PAE molecule in both environments is evaluated as
| (2) |
where and represent the dimensionless value of the biodegradation effect of PAE molecules in the marine and freshwater environments, respectively, after being transformed by the ratio normalization method.
Functional Characteristics and Environmentally Friendly Characterization Methods of the PAE Derivatives
The functional characteristics of PAE molecules before and after modification are evaluated using the energy gap (eV), total energy (a.u.), and positive frequency value.42 The energy gap value representing insulativity refers to the energy difference between the highest occupied orbit and the lowest occupied orbit; the larger the energy gap value is, the weaker the conductivity is. The values of total energy and positive frequency represent the stability of the molecule in the environment. Using Gaussian 09 software, the DFT (B3LYP), 6‐31G * basis set is used to calculate the PAE molecular energy gap value, total energy, and positive frequency before and after modification.
The environmental friendliness of PAEs before and after molecular modification can be characterized in terms of environmental hazardousness (biotoxicity, estrogen toxicity, bioconcentration, persistence, and migration), biodegradability, and UV photodegradation. If the modified PAE derivative molecules have lower environmental hazards than before modification, the biodegradation conversion product has lower toxicity and can generate .OH in the UV photodegradation process to provide free radicals from microplastics. Hence, we consider that the modified PAE derivative molecule has better environmental friendliness.
The 3D‐QSAR pharmacophore model concerning biotoxicity, estrogen toxicity, bioconcentration, persistence, and migration models for PAE molecules constructed by Qiu et al.40 was used to predict the environmental hazards of PAEs before and after modification: the median lethal concentration (LC 50) to fish was used as an indicator of biotoxicity, the median effect concentration (EC 50) was used as an indicator of estrogen toxicity, the logarithm of the bioconcentration factor (logBCF) represents the bioconcentration, the logarithm of the half‐life (log t 1/2) expresses the persistence, and the long‐range mobility is expressed by the negative logarithm of vapor pressure (−logP L is pP L). In addition, according to the biodegradation and UV photodegradation pathways of PAE molecules, the reaction energy barriers of the biodegradation and UV photodegradation pathways of PAE derivative molecules before and after modification were calculated. With the aid of the Gaussian 09 software,83 the structures of the reactants and products in the degradation reactions of the PAE target molecules and its derivative molecules were optimized at the B3LYP/6‐31G * basis set level, and the transition state (TS) and reaction energy barrier (ΔE) of the PAE derivative molecules were calculated for biodegradation and UV photodegradation reactions at the same base set level, respectively. The calculation of the degradation reaction energy barrier is as follows:
| (3) |
Furthermore, the simple resonance frequency of the PAE derivative molecule was calculated. TS has only one virtual frequency, the intermediate has no virtual frequency, and the intrinsic reaction coordinate verification of TS was performed.
Universal Adaptability Verification of the Biodegradation of PAE Derivatives in Marine and Freshwater Environments – the Molecular Docking Method
The universal biodegradation adaptation of the PAE derivative molecules in different environments were verified after being screened for evaluation of comprehensive dual biodegradation effects pharmacophore model, environmental friendliness and functionality. That is to say, the degrading enzymes of PAEs from various micro‐organisms in different environments were used to conduct molecular docking with the modified PAE derivative molecules via a scoring function to characterize the binding affinity of the degrading enzyme and the modified PAE derivative molecules. Based on this, the universal biodegradation adaptation of PAE derivative molecules for a variety of degrading enzymes in micro‐organisms was investigated.
We selected PAE‐degrading bacteria from constructed wetland soil, wastewater treatment plants (WWTP), marine sediment, shallow aquifer sediment, marine, and river sludge environments and determined their corresponding degradation enzymes. We obtained the protein molecular structure of these degradation enzymes from the Protein Data Bank (PDB, http://www.rcsb.org/pdb). Using the Dock‐Ligands (Libdock) module in the Discovery Studio software, we conducted molecular docking in semi‐flexible docking mode to simulate the binding of ligand molecules to the binding cavities of receptor proteins.
Conflict of interest
The authors declare no conflict of interest.
Acknowledgements
This research did not receive any specific grant from funding agencies in the public, commercial, or not‐for‐profit sectors. The authors would like to thank Wordvice (https://wordvice.cn/) for their English language editing.
H. Zhang, C. Zhao, H. Na, ChemistryOpen 2020, 9, 1033.
Contributor Information
Dr. Haigang Zhang, Email: zhanghg18@mails.jlu.edu.cn.
Dr. Chengji Zhao, Email: zhaochengji@jlu.edu.cn.
Dr. Hui Na, Email: 18686488713@163.com.
References
- 1. Geyer R., Jambeck J. R., Law K. L., Sci. Adv. 2017, 3, e1700782. [DOI] [PMC free article] [PubMed] [Google Scholar]
- 2. Razanajatovo R. M., Ding J., Zhang S., Jiang H., Zou H., Mar. Pollut. Bull. 2018, 136, 516–523. [DOI] [PubMed] [Google Scholar]
- 3. Wu Y., Guo P., Zhang X., Zhang Y., Xie S., Deng J., J. Hazard. Mater. 2019, 374, 219–227. [DOI] [PubMed] [Google Scholar]
- 4. Ory N. C., Gallardo C., Lenz M., Thiel M., Environ. Pollut. 2018, 240, 566–573. [DOI] [PubMed] [Google Scholar]
- 5. Courtene-Jones W., Quinn B., Gary S. F., Mogg A. O. M., Narayanaswamy B. E., Environ. Pollut. 2017, 231, 271–280. [DOI] [PubMed] [Google Scholar]
- 6. Lusher A. L., Hernandez-Milian G., Berrow S., Rogan E., O'Connor I., Environ. Pollut. 2018, 232, 467–476. [DOI] [PubMed] [Google Scholar]
- 7. Pellini G., Gomiero A., Fortibuoni T., Fabi G., Grati F., Tassetti A. N., Polidori P., Vega C. F., Scarcella G., Environ. Pollut. 2018, 234, 943–952. [DOI] [PubMed] [Google Scholar]
- 8. Su L., Deng H., Li B., Chen Q., Pettigrove V., Wu C., Shi H., J. Hazard. Mater. 2019, 365, 716–724. [DOI] [PubMed] [Google Scholar]
- 9. Anastasopoulou A., Viršek M. K., Varezić D. B., Digka N., Fortibuoni T., Koren Š., Mandić M., Mytilineou C., Pešić A., Ronchi F., Šiljić J., Torre M., Tsangaris C., Tutman P., Mar. Pollut. Bull. 2018, 133, 841–851. [DOI] [PubMed] [Google Scholar]
- 10. Jin Y., Xia J., Pan Z., Yang J., Wang W., Fu Z., Environ. Pollut. 2018, 235, 322–329. [DOI] [PubMed] [Google Scholar]
- 11. Lonnstedt O. M., Eklov P., Science. 2016, 352, 1213–1216. [DOI] [PubMed] [Google Scholar]
- 12. Gambardella C., Morgana S., Ferrando S., Bramini M., Piazza V., Costa E., Garaventa F., Faimali M., Ecotoxicol. Environ. Saf. 2017, 145, 250–257. [DOI] [PubMed] [Google Scholar]
- 13. Ziajahromi S., Kumar A., Neale P. A., Leusch F. D. L., Environ. Sci. Technol. 2017, 51, 13397–13406. [DOI] [PubMed] [Google Scholar]
- 14. Cong Y., Jin F., Tian M., Wang J., Shi H., Wang Y., Mu J., Chemosphere. 2019, 228, 93–100. [DOI] [PubMed] [Google Scholar]
- 15. Enfrin M., Lee J., Gibert Y., Basheer F., Kong L., Dumée L. F., J. Hazard. Mater. 2020, 384, 121393. [DOI] [PubMed] [Google Scholar]
- 16. Isobe A., Iwasaki S., Uchida K., Tokai T., Nat. Commun. 2019, 10, 417. [DOI] [PMC free article] [PubMed] [Google Scholar]
- 17. Waller C. L., Griffiths H. J., Waluda C. M., Thorpe S. E., Loaiza I., Moreno B., Pacherres C. O., Hughes K. A., Sci. Total Environ. 2017, 598, 220–227. [DOI] [PubMed] [Google Scholar]
- 18. Li Y., Wang J., Yang G., Lu L., Zheng Y., Zhang Q., Zhang X., Tian H., Wang W., Ru S., J. Hazard. Mater. 2020, 385, 121586. [DOI] [PubMed] [Google Scholar]
- 19. Yin L., Chen B., Xia B., Shi X., Qu K., J. Hazard. Mater. 2018, 360, 97–105. [DOI] [PubMed] [Google Scholar]
- 20. Wang X., Yang Y., Zhang L., Ma Y., Han J., Yang L., Zhou B., Environ. Toxicol. Chem. 2013, 32, 1846–1854. [DOI] [PubMed] [Google Scholar]
- 21. Tan W., Yu H., Huang C., Li D., Zhang H., Zhao X., Li R., Wang G., Zhang Y., He X., Xia B., J. Hazard. Mater. 2018, 359, 9–18. [DOI] [PubMed] [Google Scholar]
- 22. Fang L. F., Zhou M. Y., Cheng L., Zhu B. K., Matsuyama H., Zhao S. F., J. Membr. Sci. 2019, 572, 28–37. [Google Scholar]
- 23. Zhao T., Tan L., Huang W., Wang J., Environ. Pollut. 2019, 247, 883–889. [DOI] [PubMed] [Google Scholar]
- 24. Guo Y., Chang C. C., Halada G., Cuiffo M. A., Xue Y., Zuo X., Pack S., Zhang L., He S., Weil E., Rafailovich M. H., Polym. Degrad. Stab. 2017, 137, 205–215. [Google Scholar]
- 25. Koniecki D., Wang R., Moody R. P., Zhu J., Environ. Res. 2011, 111, 329–336. [DOI] [PubMed] [Google Scholar]
- 26. Dodson R. E., Nishioka M., Standley L. J., Perovich L. J., Brody J. G., Rudel R. A., Environ. Health Perspect. 2012, 120, 935–943. [DOI] [PMC free article] [PubMed] [Google Scholar]
- 27. Yurddaskal M., Nil M., Ozturk Y., Celik E., J. Mater. Sci. Mater. Electron. 2017, 29, 4557–4563. [Google Scholar]
- 28. Greco A., Ferrari F., Maffezzoli A., Polym. Degrad. Stab. 2016, 134, 220–226. [Google Scholar]
- 29. Zhao H., Du H., Lin J., Chen X., Li Y., Li H., Cai Q., Mo C., Qin H., Wong M., Sci. Total Environ. 2016, 562, 170–178. [DOI] [PubMed] [Google Scholar]
- 30. Zhang D., Li Y., Gao Y., Bawa M., Huo M., Wang X., Zhu S., J. Hazard. Mater. 2019, 368, 788–796. [DOI] [PubMed] [Google Scholar]
- 31. Eremina N., Paschke A., Mazlova E. A., Schüürmann G., Environ. Pollut. 2016, 210, 409–418. [DOI] [PubMed] [Google Scholar]
- 32. Daiem M. M. A., Rivera-Utrilla J., Ocampo-Pérez R., Méndez-Díaz J. D., Sánchez-Polo M., J. Environ. Manage. 2012, 109,164–178. [DOI] [PubMed] [Google Scholar]
- 33. Quintana-Belmares R. O., Krais A. M., Esfahani B. K., Rosas-Péreze I., Mucs D., López-Marure R., Bergman A., Alfaro-Moreno E., Environ. Res. 2018, 161, 439–445. [DOI] [PubMed] [Google Scholar]
- 34. He Y., Wang Q., He W., Xu F., Sci. Total Environ. 2019, 661, 285–293. [DOI] [PubMed] [Google Scholar]
- 35. Wang T., Qu G., Yin X., Sun Q., Liang D., Guo X., Jia H., J. Hazard. Mater. 2018, 357, 279–288. [DOI] [PubMed] [Google Scholar]
- 36. Cozar A., Echevarria F., Gonzalez-gordillo J. I., Irigoien X., Ubeda B., Hernández-León S., Palma A. T., Navarro S., García-de-Lomas J., Ruiz A., Fernández-de-Puelles M. L., Duarte C. M., Proc. Natl. Acad. Sci. USA 2014, 111, 10239–10244. [DOI] [PMC free article] [PubMed] [Google Scholar]
- 37. Gewert B., Plassmann M. M., Macleod M., Environ. Sci-Proc. Imp. 2015, 17, 1513–1521. [DOI] [PubMed] [Google Scholar]
- 38. Ariza-Tarazona M. C., Villarreal-Chiu J. F., Barbieri V., Siligardi R., Cedillo-González E. I., Ceram. Int. 2019, 45, 9618–9624. [Google Scholar]
- 39. Qiu Y., Jiang L., Zhang S., Li Y., Int. J. Environ. Anal. Chem. 2019, 1–16. [Google Scholar]
- 40. Arooj M., Thangapandian S., John S., Int. J. Mol. Sci. 2011, 12, 9236–9264. [DOI] [PMC free article] [PubMed] [Google Scholar]
- 41. Nayana R. S., Bommisetty S. K., Singh K., Bairy S. K., Nunna S., Pramod A., Muttineni R., J. Chem. Inf. Model. 2009, 49, 53–67. [DOI] [PubMed] [Google Scholar]
- 42. Jiang L., Li Y., J. Hazard. Mater. 2016, 307, 202–212. [DOI] [PubMed] [Google Scholar]
- 43. Davies R. P., Dobbs A. J., Water Res. 2017, 1984, 1253–1262. [Google Scholar]
- 44. Chen J., Xu X., Zeng X., Feng M., Qu R., Wang Z., Nesnas N., Sharma V. K., Water Res. 2018, 143, 1–9. [DOI] [PubMed] [Google Scholar]
- 45. Xu X., Chen J., Qu R., Wang Z., Chemosphere 2017, 185, 833–843. [DOI] [PubMed] [Google Scholar]
- 46. Wang X., Chu Z., Yang J., Li Y., Environ. Sci. Pollut. Res. Int. 2017, 24, 25114–25125. [DOI] [PubMed] [Google Scholar]
- 47. Qiu Y., Li Y., Environ. Sci. Pollut. Res. Int. 2018, 25, 34684–34692. [DOI] [PubMed] [Google Scholar]
- 48. Mailhot G., Sarakha M., Lavedrine B., Cáceres J., Malato S., Chemosphere. 2002, 49,525–532. [DOI] [PubMed] [Google Scholar]
- 49. Huang Z., Wu P., Lu Y., Wang X., Zhu N., Dang Z., J. Hazard. Mater. 2013, 246–247, 70–78. [DOI] [PubMed] [Google Scholar]
- 50. Xu L., Yang X., Guo Y., Ma F., Guo Y., Yuan X., Huo M., J. Hazard. Mater. 2010, 178, 1070–1077. [DOI] [PubMed] [Google Scholar]
- 51. Yuan B., Xiang Z., Graham N., Chemosphere. 2008, 72, 197–204. [DOI] [PubMed] [Google Scholar]
- 52. Peng X., Feng L., Li X., Chemosphere. 2013, 90, 220–226. [DOI] [PubMed] [Google Scholar]
- 53. Barreca S., Indelicato R., Orecchio S., Pace A., Microchem. J. 2014, 114,192–196. [Google Scholar]
- 54. Hammad K. M., Jung J. Y., Chemosphere. 2008, 72, 690–696. [DOI] [PubMed] [Google Scholar]
- 55. Qi Y., Qu R., Liu J., Chen J., Al-Basher G., Alsultan N., Wang Z., Huo Z., Chemosphere 2019, 237, 124484. [DOI] [PubMed] [Google Scholar]
- 56. Chang C. F., Man C. Y., Colloids Surf. A 2014, 441, 255–261. [Google Scholar]
- 57. Sundstrom D. W., Weir B. A., Klei H. E., Environ. Prog. 2010, 8, 6–11. [Google Scholar]
- 58. Chen N., Fang G., Zhou D., Gao J., Chemosphere 2016, 165, 52–58. [DOI] [PubMed] [Google Scholar]
- 59. Shuai W., Gu C., Fang G., Zhou D., Gao J., J. Environ. Sci. 2019, 80, 5–13. [DOI] [PubMed] [Google Scholar]
- 60. Yang J. W., Li Q., Li Y., Polymers. 2020, 12, 1672. [Google Scholar]
- 61. Li J., Gu J. D., Sci. Total Environ. 2007, 380, 181–187. [DOI] [PubMed] [Google Scholar]
- 62. Hahladakis J. N., Velis C. A., Weber R., J. Hazard. Mater. 2018, 344, 179–199. [DOI] [PubMed] [Google Scholar]
- 63. Li J., Gu J. D., Ecotoxicology. 2006, 15, 391–397. [DOI] [PubMed] [Google Scholar]
- 64. Gao D., Wen Z., Sci. Total Environ. 2016, 541, 986–1001. [DOI] [PubMed] [Google Scholar]
- 65. Chang H. K., Zylstra G. J., J. Bacteriol. 1998, 180, 6529–6537. [DOI] [PMC free article] [PubMed] [Google Scholar]
- 66. Stingley R. L., Microbiology. 2004, 150, 3749–3761. [DOI] [PubMed] [Google Scholar]
- 67. Heindel J. J., Powell C. J., Toxicol. Appl. Pharmacol. 1992, 115, 116–123. [DOI] [PubMed] [Google Scholar]
- 68. Russell J. R., Appl. Environ. Microbiol. 2011, 77, 6076–6084. [DOI] [PMC free article] [PubMed] [Google Scholar]
- 69. Wen Z. D., Gao D. W., Wu W. M., Appl. Microbiol. Biotechnol. 2014, 98, 4683–4690. [DOI] [PubMed] [Google Scholar]
- 70. Singh N., Dalal V., Mahto J. K., Kumar P., J. Hazard. Mater. 2017, 338, 11–22. [DOI] [PubMed] [Google Scholar]
- 71. Quevillon-Cheruel S., Leulliot N., Graille M., Hervouet N., Coste F., Zelwer C., Janin J., Van Tilbeurgh H., Protein Sci. 2005, 14, 1350–1356. [DOI] [PMC free article] [PubMed] [Google Scholar]
- 72. Zhang J., Zhang C., Zhu Y., Li J., Li X., Int. Biodeterior. Biodegrad. 2018, 132, 200–207. [Google Scholar]
- 73. Tokiwa Y., Calabia B. P., Int. J. Mol. Sci. 2009, 10, 3722–3742. [DOI] [PMC free article] [PubMed] [Google Scholar]
- 74. Zhang M., Yu X., Xu Y., Guo R., Swapna G. V. T., Szyperski T., Hunt J. F., Montelione G. T., Biochemistry. 2019, 58, 3943–3954. [DOI] [PMC free article] [PubMed] [Google Scholar]
- 75. Shimao M., Curr. Opin. Biotechnol. 2001, 12, 242–247. [DOI] [PubMed] [Google Scholar]
- 76. Dimarogona M., Nikolaivits E., Kanelli M., Christakopoulos P., Sandgren M., Topakas E., Biochim. Biophys. Acta. 2015, 1850, 2308–2317. [DOI] [PubMed] [Google Scholar]
- 77. Luic M., Stefanic Z., Ceilinger I., Hodoscek M., Janezic D., Lenac T., Asler I. L., Sepac D., Tomic S., J. Phys. Chem. B. 2008, 112, 4876–4883. [DOI] [PubMed] [Google Scholar]
- 78. Bompard-Gilles C., Remaut H., Villeret V., Prange T., Fanuel L., Delmarcelle M., Joris B., Frere J., Van Beeumen J., Structure. 2000, 8, 971–980. [DOI] [PubMed] [Google Scholar]
- 79. Wu X., Wang Y., Liang R., Dai Q., Bull. Environ. Contam. Toxicol. 2010, 85, 235–237. [DOI] [PubMed] [Google Scholar]
- 80. Cupp-Vickery J. R., Poulos T. L., Nat. Struct. Mol. Biol. 1995, 2, 144–153. [DOI] [PubMed] [Google Scholar]
- 81. Sundaramoorthy M., Youngs H. L., Gold M. H., Poulos T. L., Biochemistry. 2005, 44, 6463–6470. [DOI] [PubMed] [Google Scholar]
- 82. Bhardwaj H., Gupta R., Tiwari A., J. Polym. Environ. 2013, 21, 575–579. [Google Scholar]
- 83. Trine E., Int. Biodeterior. Biodegrad. 1999, 44, 117–126. [Google Scholar]