After a decade of speckle strain, the technique seems set to join a group of transformative innovations that have changed how we use echocardiography. Global longitudinal strain (GLS) has now been recommended as a means of follow-up for patients at risk of cancer therapeutic-related cardiac dysfunction (1). However, although the use of GLS has spread, many clinicians are unfamiliar with the practical process of data acquisition, and continue to rely on ejection fraction (EF). The purpose of this iPix is to facilitate the acquisition and measurement of GLS for following patients in unfamiliar hands, by illustrating its application with the most commonly used equipment in the USA.
Strain image acquisition:
Strain is analyzed by post-processing of apical views (Table 1).
Table 1:
Acquisition/Selection of appropriate image(s) for GLS measurement
| Appropriate depth | Appropriate depth, including the mitral annulus in diastole and effective visualization of the leaflet insertion point at annulus. This usually requires inclusion of up to half of the left atrium. |
| Appropriate sector width | Wide sector, to include a) the entire apex in diastole, b) some RV to ensure capture of the entire septum, c) epicardial borders of the anterior and lateral walls. A wide sector may sacrifice frame rate, but this is acceptable if it remains in the range of 40-70 frames/second. |
| Appropriate gain setting | Slight over-gain helps checking endocardial tracking |
| Avoid foreshortening | Foreshortening may cause overestimation of apical strain. |
| Clear endocardial border | Appropriate endocardial definition is needed, as for performing LV volumes and EF. |
| ECG tracing | A good quality ECG tracing is critical, as QRS and T waves are often used to define beginning and end-systole. |
Strain analysis:
The derivation of GLS from speckle tracking is slightly different with the software of different manufacturers (Figures 1-4), but there are five unifying steps – a) view selection, b) definition of end-systole, c) tracing, d) assessing tracking quality, e) integration. The analysis steps require minimal time and experience, but need to be followed - strain should not be used as a “black box”.
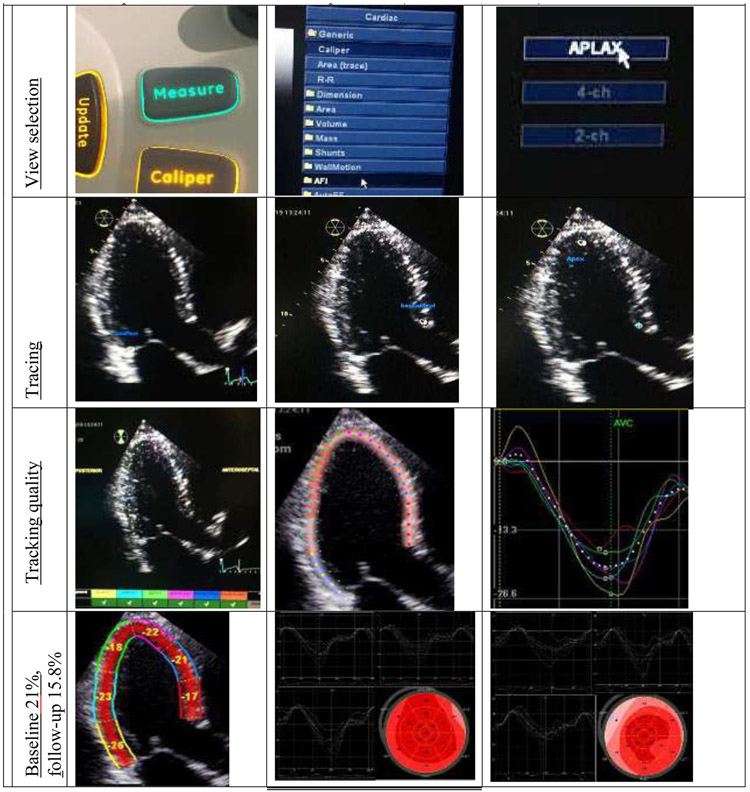
Figure 1. Elderly female with HER-positive breast cancer, no other risk factors, treated with trastuzumab after anthracycline.
Baseline GLS with automated function imaging (AFI, GE Medical Systems) was 21%. After her third monthly dose of trastuzumab, GLS decreased to 16%. Video is provided to illustrate the steps below (Video 1-3,on-line).
Figure 4. 72 year-old male with type 2 diabetes.
Baseline GLS with velocity vector imaging (Siemens) is gathered in preparation for exposure to anthracycline. Video is provided to illustrate the steps below (F3, on line).
Selection of apical views
The apical long axis is the first view for AFI. Go to the “Measurement” menu to choose AFI and begin with the APLAX view. This enables a manual cross-validation of end-systole with aortic valve closure.
Tracing
Tracing with AFI occurs automatically in end-systole, though manual marking of fiducial landmarks (two annulus and apex) may be necessary with technically difficult images. These points should be made based on the endocardial border, rather than myocardium nor pericardium. The automated definition of end-systole is based on anticipated duration from the QRS wave or the end of the T wave.
Tracking quality
This is the most important step in strain analysis. The overlay between the software’s detection of the endocardial border and the actual border should be assessed visually. Automatic displays of the adequacy of tracking are based on statistical metrics regarding edge detection within segments, but there is no substitute for visual assessment. If necessary, the border and the width of ROI may be adjusted. A broader width may include pericardium causing under-estimation of GLS. Strain profiles are often used to check tracking quality. In a ventricle that appears normal, the strain profiles should be roughly similar in timing, morphology and magnitude – major regional disparities should lead to further efforts to check tracking.
Integration
AFI gives peak systolic strain in a parametric (“Bull’s eye”) display, but this is only possible if all three views had similar cycle length. In this case, follow-up GLS is reduced - 15.9%), and deteriorated from baseline (−21%).
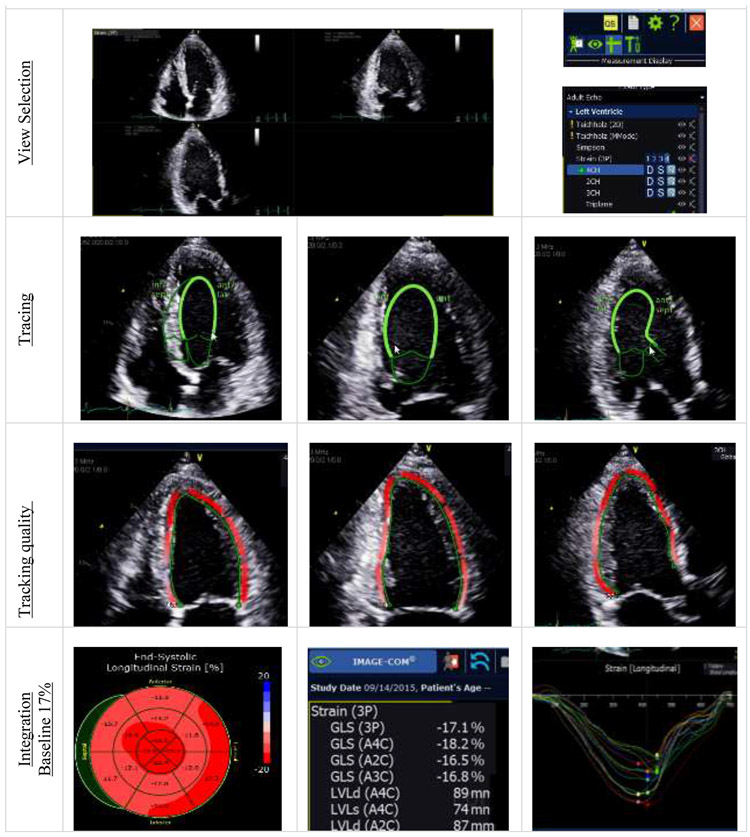
Selection of images
AutoStrain by Image-Arena, a vendor neutral platform, is used by importing studies in DICOM format. Double click on the selected view (apical 4CH, 2CH and 3CH) to move the images into the workspace.
Tracing
The entire LV endocardial border is traced automatically, starting and finishing with the MV insertion points. Timing of end-systole is automated based on the minimum LV cavity volume which can also be defined manually by measuring aortic valve closure time using pulsed wave Doppler of the LVOT.
Tracking quality
The assessment of tracking quality involves visual assessment and adjustment of the end-diastolic and end-systolic endocardial linear contour may be required..
Integration
After tracking three apical views, regional strains are combined to derive GLS in each view. This integration does not require three views of similar cycle length. In this case, the baseline GLS (−17%) is borderline, and likely reflects the effects of hypertension and obesity on LV dysfunction. The assessment of cardiotoxicity requires sequential follow-up.
Selection of images
After acquisition of appropriate images, aCMQ is activated for image processing. This software does not require a particular view to begin.
Tracing
aCMQ also allows an automated tracing or semi-automated by marking three fiducial landmarks (two annulus and apex) on the endocardial border in technically difficult images.
Tracking quality
Similarly, the overlay between the software’s detection of the endocardial border and the actual border should be assessed visually. If necessary, the border and the width of ROI may be adjusted. The ability to make this adjustment on segmental ROI is helpful to avoid the pericardial layer and papillary muscle – failure to do this may lead to under or over-estimation of GLS.
Integration
Once strain profiles are created, the global results tab provides a parametric (“bull’s eye”) display of peak systolic strain (−21%), which is normal.
Selection of images
After acquisition of appropriate apical images, a right click on the selected view permits selection of the VVI function. This does not require a specific initial view. The definition of end-systole in VVI is based on ECG (QRS and T wave).
Tracing
Manual tracing the entire LV endocardial contour is necessary, and care should be taken to begin and end the tracing on the mitral valve leaflet insertion points. Inclusion of the papillary muscles may cause over-estimation of GLS. Tracing is often done in end-systole, and manual adjustment of timing of tracing is possible.
Tracking quality
Visual assessment of tracking quality in VVI can be challenging compared to AFI or aCMQ as it is a linear contour. “Endo vector” can be turned on or off to facilitate this process visually. During processing, slight “over gain” of the images may optimize endocardial tracking, and freezing and “stepping through” freeze-frame images is essential.
Integration
After tracking three apical views, regional strains are combined to derive GLS based on either peak or peak systolic strain. The “bull’s eye” can be displayed in recent versions of the software, and does not require three views of similar cycle length.
In this patient, the baseline GLS (−17%) is borderline but not clearly abnormal. Sequential follow-up is the optimal means of using GLS for the recognition of cardiotoxicity.
Strain interpretation:
GLS is a simple parameter that expresses longitudinal shortening as a percentage, and which is calculated from all modern strain software. There are a number of ways of displaying different aspects of strain, including waveforms (to illustrate contraction delay and temporal dispersion in multiple segments) and parametric displays (which illustrate spatial dispersion throughout the cardiac cycle). These displays are of value for the assessment of regional strain. They are also of use in the quality control of testing subclinical LV dysfunction – where both temporal and spatial dispersion of strain are somewhat unusual and their presence should provide an alert to the presence of possible artifact.
Defining abnormal GLS is less simple than might be desired, because like any ejection-phase parameter, GLS is age-, sex- and load-dependent. There is some variation between post-processing algorithms of different manufacturers (Table 2), although this is now less than in former years. In adults, GLS <16% is abnormal, GLS >18% is normal, and GLS 16-18% is borderline – implying that it is more likely abnormal in a young man with a systolic blood pressure of 110 mmHg, and likely normal in an 80 year old woman with a systolic blood pressure of 150 mmHg. Use of the evolution of GLS from baseline is the preferred metric for the assessment of cardiotoxicity (1).
Table 2.
GLS measurements in the same population with recent software (2).
| GE | Tomtec | Siemens | Philips | |
|---|---|---|---|---|
| Mean | 21.0 | 21.5 | 20.0 | 18.8 |
| Lower limit (2SD) | 17.1 | 17.5 | 16.4 | 15.2 |
Conclusion:
The automation of this process should not suspend disbelief! Common errors have been previously summarized (3), and include errors of triggering and definition of the region of interest.
Practice is the key to strain analysis. A series of calibration cases are provided in raw data format, readable into EchoPac (General Electric Medical Systems, Milwaukee, WI). These are provided at http://www.menzies.utas.edu.au/research/diseases-and-health-issues/research-projects/strain-surveillance-during-chemotherapy-for-improving-cardiovascular-outcomes-succour-study, and interested persons may access this site, submit their measurements and receive their results, which can then be compared to those of expert readers.
Supplementary Material
Figure 2. 62 year-old female with obesity and hypertension, and HER-positive breast cancer, scheduled to receive anthracycline followed by trastuzumab.
Baseline GLS, processed with AutoStrain (Image Arena, TomTec Imaging System) is low normal (−17%). Video is provided to illustrate the steps below (video 4, on line).
Figure 3. 74 year-old male with hypertension and type 2 diabetes mellitus, treated with anthracycline for non-Hodgkins lymphoma.
Baseline GLS measurement is undertaken with automated function imaging (Automated Cardiac Motion Quantification [aCMQ], Philips), as illustrated in video 5, 6 on-line
Acknowledgments
Financial disclosure: THM is in receipt of research support from General Electric Medical Systems for an ongoing research study on the use of strain for the assessment of cardiotoxicity.
Footnotes
Publisher's Disclaimer: This is a PDF file of an unedited manuscript that has been accepted for publication. As a service to our customers we are providing this early version of the manuscript. The manuscript will undergo copyediting, typesetting, and review of the resulting proof before it is published in its final form. Please note that during the production process errors may be discovered which could affect the content, and all legal disclaimers that apply to the journal pertain.
References
- 1.Plana JC, Galderisi M, Barac A et al. Expert consensus for multimodality imaging evaluation of adult patients during and after cancer therapy: a report from the American Society of Echocardiography and the European Association of Cardiovascular Imaging. Journal of the American Society of Echocardiography : official publication of the American Society of Echocardiography 2014;27:911–39. [DOI] [PubMed] [Google Scholar]
- 2.Farsalinos KE, Daraban AM, Unlu S, Thomas JD, Badano LP, Voigt JU. Head-to-Head Comparison of Global Longitudinal Strain Measurements among Nine Different Vendors: The EACVI/ASE Inter-Vendor Comparison Study. Journal of the American Society of Echocardiography : official publication of the American Society of Echocardiography 2015;28:1171–1181, e2. [DOI] [PubMed] [Google Scholar]
- 3.Negishi K, Negishi T, Kurosawa K et al. Practical guidance in echocardiographic assessment of global longitudinal strain. JACC Cardiovascular imaging 2015;8:489–92. [DOI] [PubMed] [Google Scholar]
Associated Data
This section collects any data citations, data availability statements, or supplementary materials included in this article.


