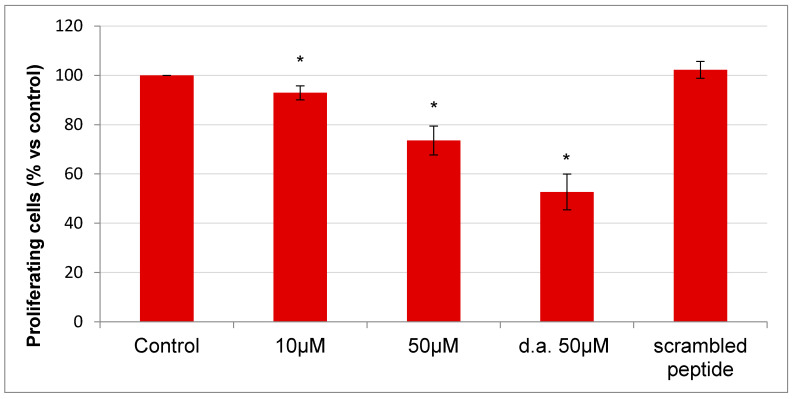
Figure 7.
Proliferation assay. HepG2 were treated with the peptide at different concentrations. Cell proliferation was evaluated considering the normalized cell index (CI) of each curve at about 24 h after treatment; results are presented as the percentage of CI of adherent cells versus control (cells not treated). HepG2 were also treated with 50 µM RGDechi15D with a second addition of 50 µM peptide (d.a. = peptide double addition) after 6 h. The results are expressed as means ± SE of at least three independent experiments performed in triplicate. Statistical significance was analyzed using Student’s t test, unpaired, two-sided (* p < 0.05).

