Abstract
Background
MUC15, one of the hydrophilic glycoproteins that protect wet-surfaced epithelia, has been shown to be involved in tumorigenesis of various tumors. However, the mechanism of MUC15 in pancreatic cancer have not been revealed yet. Our study focused on investigating its clinical significance and function in pancreatic cancer.
Material/Methods
Using tissue microarrays and immunohistochemical staining, we evaluated MUC15 expression in 92 patients diagnosed with pancreatic ductal adenocarcinoma (PDAC). The correlations between MUC15 expression and clinicopathological variables and prognosis were analyzed. To validate our findings, we analyzed the data from an online database. We then demonstrated its function or mechanism in pancreatic cancer cell lines using transwell assay, cytotoxicity assay, cell apoptotic detection, and western blot.
Results
The expression level of MUC15 was remarkably increased in PDAC tissues in comparison with para-cancerous tissues, and was associated with poor prognosis. Cytoplasmic MUC15 expression was identified as an independent prognostic indicator for overall survival by multivariate Cox regression analysis. Functionally, overexpressed MUC15 enhanced the migration and invasion ability in cancer cells. In vitro studies revealed that MUC15 enhanced the gemcitabine resistance of pancreatic cancer. Additionally, the regulatory mechanism of MUC15 in PDAC were correlated with ERK and AKT signaling pathways.
Conclusions
We performed integrated analysis and revealed that MUC15 is a good prognostic predictor for patients with PDAC. The functional experiments showed that MUC15 contributed to the malignant behaviors of pancreatic cancer in vitro.
MeSH Keywords: Carcinogenesis, Mucins, Pancreatic Neoplasms, Prognosis
Background
Pancreatic cancer (PC) has become one of the leading causes of cancer-related death due to its high mortality and extremely poor prognosis [1,2]. Pancreatic ductal adenocarcinoma (PDAC), which has high intra-tumoral heterogeneity, accounts for nearly 85% of PC. Patients are usually diagnosed at the relatively late stage and only one-quarter of them can receive surgical treatment [3], and the 5-year survival rate of patients who receive the operation is less than 30% [4,5]. Recently, more studies have focused on the prognostic markers and crucial molecules of PDAC [6–8], but the number of powerful biomarkers remains limited.
Mucins, a high-molecular-weight glycoprotein family, are located in the membrane and the cytoplasm, exerting roles of hydration, lubrication, and protection. Mucins usually consist 2 subtypes: secreted mucins and membrane-bound mucins [9]. The former subtype lack a transmembrane domain can be secreted outside the epithelia to the extracellular environment, such as MUC2, MUC5, MUC6, and MUC7 [10,11]. The latter subtype consists of the N-terminal portion and a transmembrane domain, which contain many phosphorylation sites for signaling transduction, including MUC1, MUC4, MUC12, and MUC15. These mucins not only provide a safe shield but also act as the sensor of signal transmitting between outer and inner cells [9,12].
In the mucin family, MUC15 lacks typical tandem repeats and is a membrane-bound glycoprotein. Its mRNA can be detected in various organs, including testis, ovary, breast, thymus, spleen, prostate and intestine, and it is also expressed in various tissues, including placenta, peripheral blood leukocyte, and bone marrow [13,14]. An increasing number of studies have focused on its role in various types of malignant tumors. However, the exact role of MUC15 in malignant tumors are unclear. MUC15 promotes malignant phenotypes in colon cancer, papillary thyroid cancer, and glioma, but MUC15 suppresses aggressive behaviors in hepatic cancer and renal cancer [15–20]. The mechanism underlying these opposite roles of MUC15 in different tumors is still unclear and may result from tissue heterogeneity.
According to TCGA database, MUC15 overexpression is associated with poor prognosis in PDAC. However, to the best of our knowledge, the function of MUC15 in tumorigenesis and progression of PDAC is not known. The present study is the first to investigate the biological role and clinical significance of MUC15 in PDAC. We explored the association between MUC15 and clinicopathological parameters and evaluated the prognostic value of MUC15 in pancreatic cancer, and the role of MUC15 in progression and chemo-resistance of pancreatic cancer cells were evaluated by cellular function experiments.
Material and Methods
Patients and tissue samples
Tissues were collected from patients who underwent R0 resection in Peking Union Medical College Hospital from November 2008 to October 2014. The inclusion criteria were as follows: the PDAC diagnosis confirmed pathologically, none of the patients received local therapy before surgery, and adjacent normal tissues could be obtained from the resected specimen. Patients were excluded as follows: final diagnosis other than PDAC, perioperative death, and lost to follow-up. The stage was according to the 8th American Joint Committee on Cancer Staging Manual. The median time of follow-up ranged from 3 to 42 months (median, 17.3 months). The clinicopathological data of 92 patients, including demographics, tumor status, and complete follow-up, was finally analyzed. The present study was approved by the Institutional Ethics Committee of Peking Union Medical College Hospital (ZS-1823) and inform consent was obtained.
Tissue microarrays (TMAs) constructions and immunohistochemistry
The TMA was constructed as described previously [7]. Tissues of formalin-fixed paraffin-embedded tumor tissues and para-tumor tissues were analyzed with a manual tissue arrayer (Beecher Instrument, WI, USA). The representative cancer and para-cancerous tissues of each PDAC patient were punched out on 2 cores (diameter=1.5 mm) after careful selection. Tissues were processed with deparaffinization and rehydration, and the antigens were retrieved, followed by endogenous peroxidase blocking. After that, sections were incubated with rabbit MUC15 antibody (Sigma Aldrich, HPA026110) and incubated with HRP-labeled secondary antibody for 60 min. Finally, the slides mixed with the chromogen were evaluated by light microscopy (Nikon, Japan). Normal nonimmune rabbit serum was used as the negative control.
Staining evaluation
TMAs were digitalized using Panoramic Viewer (NDP, Japan) after staining. Two pathologists blinded to clinicopathological data conducted the staining evaluation. Discrepancies were settled by discussion and consensus. Cytoplasmic and/or membrane brown coloration was identified as positive staining. The MUC15 expression was assessed by H-score [21]. Every TMA was divided into 5 parts, and the average value was regarded as the patient’s result.
Data mining from public databases
The Kaplan-Meier Plotter (www.kmplot.com) was applied to estimate the association of MUC15 expression with survival of patients, which was checked in an online database based on mRNA expression level using the log-rank test. GEPIA (http://gepia.cancer-pku.cn) was also used to evaluate the prognostic value of MUC15 in PC based on the Cancer Genome Atlas (TCGA) and the GTEx by using a standard processing pipeline. The basic expression level of MUC15 in different tissues was revealed by the gene database from the National Center for Biotechnology Information (NCBI) (https://www.ncbi.nlm.nih.gov) [22]. The protein expression level of MUC15 in various organs was acquired from the Human Protein Atlas (https://www.proteinatlas.org) [23].
Cell lines
The PDAC cell lines Panc-1, MIA PaCa-2, AsPC-1, T3M4, BxPC-3, and CFPAC-1 were introduced from the American Type Culture Collection (ATCC). The cell lines were cultured in DMEM, RPMI1640, and IMDM (Hyclone) with 10% fetal bovine serum (FBS, Gibco) and 1% antibiotics in a cell incubator at 37°C with 5% CO2.
Transfection
Cells were plated in 6-well plates and cultured at 37°C for 24 h. When cells reached 50–70% confluence, they were infected with MUC15-overexpression plasmid (MUC15-OE) and negative control plasmid (MUC15-NC) (Tsingke, China). Complementary DNA encoding GSTM3 was synthesized and subcloned into the pcDNA3.1(+) vector by BamHI-XhoI. The small interfering RNA of MUC15 (siMUC15) (siRNA: 5′-CCUUGGAAUACUACACUCA -3′) and negative control siRNA (siNC) (siRNA: 5′-UUCUCCGAACGUGUCACGU -3′) were constructed by RiboBio (Guangzhou, China). Lipofectamine 3000 (Invitrogen, USA) was used according to the official instructions. The efficiency of transfection was tested after 48–72 h by western blot and PCR.
Western blot assay
Western blot analysis was performed as described previously [24]. The primary antibodies were as follows: anti-MUC15 (1: 1000 dilution, Immunoway, USA), anti β-actin (Abcam, USA), anti-AKT antibody (Abcam, USA), anti-p-AKT antibody (Abcam, USA), anti-Erk1/2 antibody (Cell Signaling Technology, USA), anti-pErk1/2 antibody (Cell Signaling Technology, USA), and anti-GAPDH (Santa Cruz, USA).
RNA isolation and RT-PCR
RNA was extracted from treated PDAC cells using TRIzol reagent (Ambion, Life Technologies). The cDNA was created using a reverse transcription kit (Takara, China) on a 96-well thermal cycler (Applied Biosystems). Quantitative PCR was conducted used SYBR Premix Ex TaqTM Reagent (TaKaRa, China) by using StepOnePlus™ (Applied Biosystems) based on the manufacturer’s instructions. The MUC15 forward primer was CTCAAATCTCAAGGCGAGTCATTC and the MUC15 reverse primer was GCAGGTGTAGCATTGGGATGTGC. β-actin forward: CTCCATCCTGGCCTCGCT GT; β-actin reverse: GCTGTCACCTTCACCGTTCC. Fold changes relative to β-actin were calculated by 2−ΔΔCt.
Immunofluorescence assay
Monoclonal rabbit antihuman MUC15 (1: 100, Santa Cruz, USA) was applied for immunofluorescence staining. 4′6-diamidino-2-phenylindole was used to counterstain the nuclei. The intracellular localization of MUC15 was scanned through a confocal laser microscope (Nikon, Japan).
Transwell migration and invasion assays
The upper chambers of the transwell plate (24-well, 8-mm, Corning, Life Sciences) were prepared with Matrigel (BD Biosciences, USA) for invasion assay, and no Matrigel was used for migration assay. About 3×10⁴ cells were seeded in the upper chamber and incubated overnight. Culture medium with 10% FBS was placed in the lower chamber and culture medium without FBS was placed in the upper chamber. Then, the non-migrating cells were gently removed after incubation at 37°C for 48 h. Cells were fixed in 90% ethyl alcohol and then stained with 1% crystal violet. We counted cells from 5 random views under an inverted microscope.
Cytotoxicity assay
Firstly, 5×10³ cells were placed in 96-well plates, and then various concentrations of gemcitabine (10 nm, 100 nm, 1 μm, 10 μm, 100 μm, 1 mm) were added for 48 h. CCK8 (Dojindo, Japan) reagent was applied to incubate with cells for 2.5 h, and then the cellular viability was detected using an enzyme-labeling instrument. The formula of the inhibition rate was as follows: 1–(ODGEM–ODBlank)/(ODPBS–ODBlank). (OD=OD450-OD630)
Cell apoptosis
We used an annexin V-FITC/PI apoptosis assay kit (NeoBioscience, China) to detect cellular apoptosis. After digestion with trypsin, the cells were stained with Annexin V-FITC for 10 min. Then, PI was added to further stain the cells in the dark for 5 min. An AccuriC6 flow cytometer (BD, USA) was used to analyze the cells according to the manufacturer’s instructions.
Statistics analysis
Data are presented as the mean±(SD) from at least 3 independent experiments. Categorical variables were analyzed by chi-square test. Continuous variables were analyzed by the t test. The χ2 test or Fisher exact test was applied to evaluate the correlation between the expression of MUC15 and clinicopathological indicators. Kaplan-Meier method and the log-rank test were used for overall survival analysis. A multivariate analysis of prognostic predictors was calculated by Cox regression analysis. Statistical analyses were performed using SPSS23.0 software (SPSS, Inc., Chicago, USA) and GraphPad Prism 7.0 (La Jolla, USA). A P value less than 0.05 was regarded as statistically significant.
Results
MUC15 expression and its association with clinicopathological variables
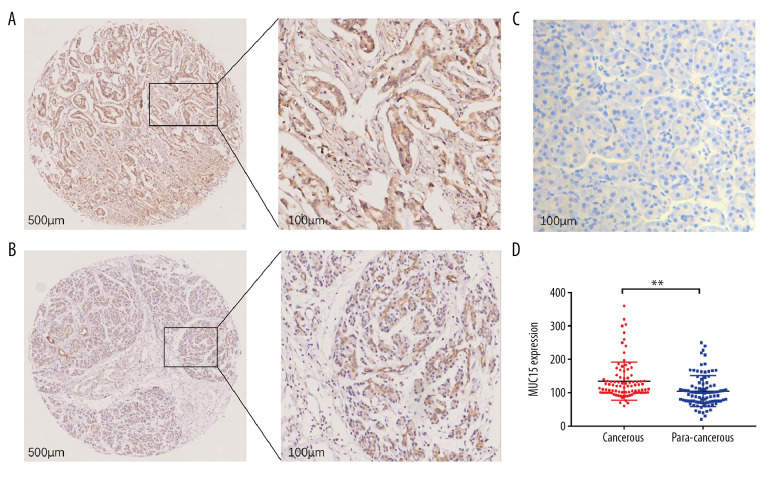
MUC15 stained positively in the cytoplasm of cancerous and para-cancerous tissues (Figure 1A–1C). The cytoplasmic expression of MUC15 was remarkably higher in the cancerous tissue than in the para-cancerous tissue (P<0.01) (Figure 1D). Based on the optimal cutoff value of H-score, there were 42 cases with high MUC15 expression level and 50 cases with low MUC15 expression level. MUC15 was also positive on the cellular membrane in 37 of 92 samples. High cytoplasmic expression of MUC15 was significantly associated with CA19-9 (P=0.019). There were no significant differences in other variables between high and low cytoplasmic MUC15 groups (Table 1). Membrane MUC15 was not significantly associated with the clinicopathological variables (P>0.05) (Table 2).
Figure 1.
Expression of MUC15 in pancreatic ductal adenocarcinoma tissues. (A) Representative microphotographs of strong cytoplasmic and membrane MUC15 expression in cancer tissue. Magnification, 500 μm, 100 μm. (B) Representative microphotographs of weak MUC15 expression in para-cancerous tissue. Magnification, 500 μm, 100 μm. (C) Negative MUC15 expression in control. Magnification, 100 μm. (D) Comparison of the cytoplasmic MUC15 expression staining scores between cancer and para-cancerous tissue. ** P<0.01.
Table 1.
Relationship between cytoplasmic MUC15 expression and clinicopathological characteristics in pancreatic cancer.
| Variables | n | MUC15 expression | P-value | |
|---|---|---|---|---|
| High | Low | |||
| Sex | 0.076 | |||
| Male | 59 | 31 (52.5%) | 28 (47.5%) | |
| Female | 33 | 11 (33.3%) | 22 (66.7%) | |
| Age | 0.304 | |||
| ≤60 | 45 | 23 (51.1%) | 22 (48.9%) | |
| >60 | 47 | 19 (40.4%) | 28 (59.6%) | |
| CA19-9 level | 0.019 | |||
| Elevated | 68 | 28 (41.2%) | 40 (58.8%) | |
| Normal | 18 | 13 (72.2%) | 5 (27.8%) | |
| Tumor size | 0.482 | |||
| ≥4cm | 42 | 21 (50.0%) | 21 (50.0%) | |
| <4cm | 47 | 20 (42.6%) | 27 (57.4%) | |
| Tumor location | 0.360 | |||
| Head | 53 | 22 (41.5%) | 31 (58.5%) | |
| Non-head | 35 | 18 (51.4%) | 17 (48.6%) | |
| Tumor differentiation | 0.857 | |||
| Well-moderate | 68 | 30 (44.1%) | 38 (55.9%) | |
| Poor | 15 | 7 (46.7%) | 8 (53.3%) | |
| Perineural invasion | 0.863 | |||
| Absent | 36 | 16 (44.4%) | 20 (55.6%) | |
| Present | 54 | 25 (46.3%) | 29 (53.7%) | |
| Vessel invasion | 0.746 | |||
| Absent | 63 | 28 (44.4%) | 35 (55.6%) | |
| Present | 27 | 13 (48.1%) | 14 (51.9%) | |
| Lymph node metastasis | 0.603 | |||
| Absent | 50 | 24 (48.0%) | 26 (52.0%) | |
| Present | 40 | 17 (42.5%) | 23 (57.5%) | |
| Stage | 0.923 | |||
| I–IIa | 45 | 21 (46.7%) | 24 (53.3%) | |
| ≥IIb | 46 | 21 (45.7%) | 25 (54.3%) | |
| T stage | 0.624 | |||
| T1–2 | 28 | 14 (50.0%) | 14 (50.0%) | |
| >T3 | 63 | 28 (44.4%) | 35 (55.6%) | |
| N stage | 0.696 | |||
| N0 | 50 | 24 (48.0%) | 26 (52.0%) | |
| N1 | 41 | 18 (43.9%) | 23 (56.1%) | |
P value in bold is statistically significant. Total patient number does not equal 92 in all categories, as patient information was not available for all cases. T – tumor; N – lymph node.
Table 2.
Relationship between membrane MUC15 expression and clinicopathological characteristics in pancreatic cancer.
| Variables | n | MUC15 expression | P-value | |
|---|---|---|---|---|
| High | Low | |||
| Sex | 0.728 | |||
| Male | 26 | 10 (38.5%) | 16 (61.5%) | |
| Female | 11 | 5 (45.5%) | 6 (54.5%) | |
| Age | 0.842 | |||
| ≤60 | 19 | 8 (42.1%) | 11 (57.9%) | |
| >60 | 18 | 7 (38.9%) | 11 (61.1%) | |
| CA19-9 level | 0.283 | |||
| Elevated | 24 | 8 (33.3%) | 16 (66.7%) | |
| Normal | 11 | 6 (54.5%) | 5 (45.5%) | |
| Tumor size | 0.265 | |||
| ≥4cm | 13 | 7 (53.8%) | 6 (46.2%) | |
| <4cm | 23 | 8 (34.8%) | 15 (65.2%) | |
| Tumor location | 0.391 | |||
| Head | 21 | 10 (47.6%) | 11 (52.4%) | |
| Non-head | 15 | 5 (33.3%) | 10 (66.7%) | |
| Tumor differentiation | 0.669 | |||
| Well-moderate | 28 | 11 (39.3%) | 17 (60.7%) | |
| Poor | 5 | 2 (40.0%) | 3 (60.0%) | |
| Perineural invasion | 0.681 | |||
| Absent | 13 | 6 (46.2%) | 7 (53.8%) | |
| Present | 23 | 9 (39.1%) | 14 (60.9%) | |
| Vessel invasion | 0.602 | |||
| Absent | 26 | 11 (42.3%) | 15 (57.7%) | |
| Present | 10 | 4 (40.0%) | 6 (60.0%) | |
| Lymph node metastasis | 0.486 | |||
| Absent | 20 | 9 (45.0%) | 11 (55.0%) | |
| Present | 15 | 5 (33.3%) | 10 (66.7%) | |
| Stage | 0.955 | |||
| I–IIa | 19 | 8 (42.1%) | 11 (57.9%) | |
| ≥IIb | 17 | 7 (41.2%) | 10 (58.8%) | |
| T stage | 0.681 | |||
| T1–2 | 13 | 6 (46.2%) | 7 (53.8%) | |
| >T3 | 23 | 9 (39.1%) | 14 (60.9%) | |
| N stage | 0.650 | |||
| N0 | 20 | 9 (48.0%) | 11 (52.0%) | |
| N1 | 16 | 6 (37.5%) | 10 (62.5%) | |
Total patient number does not equal 37 in all categories, as patient information was not available for all cases. T – tumor; N – lymph node.
Prognostic significance of MUC15 in PDAC
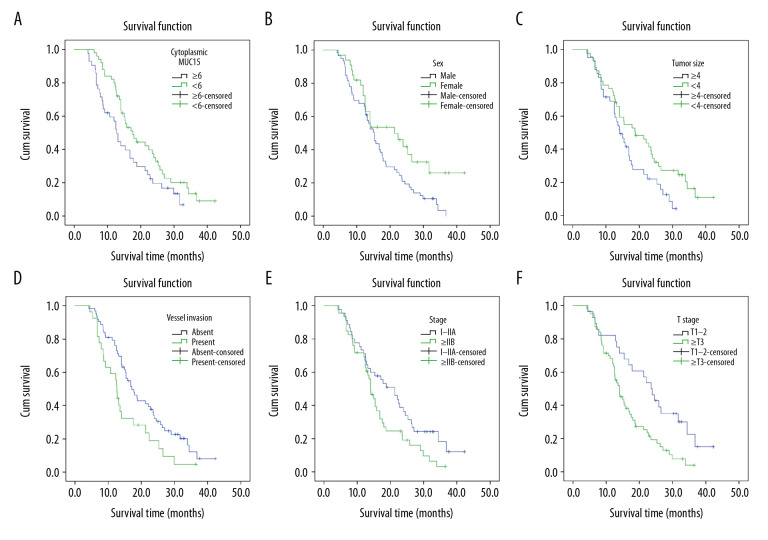
Kaplan-Meier analysis and log-rank test were performed to investigate the prognostic significance of various clinicopathological factors in PDAC patients. For univariate analysis, we observed that cytoplasmic MUC15 expression level was positively associated with overall survival (OS) of PDAC patients (median OS: 15.54 months vs. 20.83 months, respectively, P=0.042) (Figure 2A). In addition, sex, tumor size, vessel invasion, stage, and T stage were also prognostic predictors in univariate analysis (P=0.019, 0.034, 0.021, 0.036, and 0.003, respectively; Table 3) (Figure 2B–2F). However, the membrane MUC15 expression was not shown to be prognostic for OS (P=0.144). The multivariate Cox regression analysis identified cytoplasmic MUC15 expression as an independent prognostic indicator of PDAC (P=0.031), along with T stage (Table 3).
Figure 2.
Kaplan-Meier curves for overall survival of patients with pancreatic ductal adenocarcinoma. (A) Overall survival of patients according to cytoplasmic MUC15 expression in cancer tissues (P=0.042; log-rank test). (B) Kaplan-Meier curves for OS based on sex (P=0.019; log-rank test). (C) Kaplan-Meier curves for OS based on tumor size (P=0.034; log-rank test). (D) Kaplan-Meier curves for OS based on vessel invasion (P=0.021; log-rank test). (E) Kaplan-Meier curves for OS based on stage (P=0.036; log-rank test). (F) Kaplan-Meier curves for OS based T stage (P=0.003; log-rank test).
Table 3.
Univariate and multivariate analyses of prognosis factors in pancreatic cancer patients.
| Variables | Univariate analysis | Multivariate analysis | ||||
|---|---|---|---|---|---|---|
| Overall survival (Median±SE, months) | 95% confidence interval | P value | Hazard ratio | 95% confidence interval | P value | |
| Sex | 0.019 | 0.056 | ||||
| Male | 16.6±1.20 | 14.295–18.999 | 0.772 | 0.342–1.276 | ||
| Female | 23.09±2.46 | 18.285–27.914 | 1 | |||
| Age | 0.343 | |||||
| ≤60 | 19.56±1.74 | 16.143–22.980 | ||||
| >60 | 17.80±1.48 | 14.889–20.723 | ||||
| CA19-9 | 0.581 | |||||
| Elevated | 18.66±1.37 | 15.965–21.354 | ||||
| Normal | 20.03±2.76 | 14.616–25.453 | ||||
| Tumor size | 0.034 | 0.969 | ||||
| ≥4 | 16.01±1.23 | 13.591±18.448 | 0.632 | 0.378–1.021 | ||
| <4 | 21.17±1.76 | 17.703±24.638 | 1 | |||
| Tumor location | 0.810 | |||||
| Head | 19.47±1.55 | 16.424–22.530 | ||||
| Non-head | 18.52±1.79 | 15.009–22.041 | ||||
| Tumor differentiation | 0.173 | |||||
| Well-moderate | 20.34±1.40 | 17.628±23.120 | ||||
| Poor | 15.68±2.77 | 10.241±21.133 | ||||
| Perineuronal invasion | 0.070 | |||||
| Absent | 21.52±2.03 | 17.541–25.515 | ||||
| Present | 17.03±1.28 | 14.521–19.540 | ||||
| Vessel invasion | 0.021 | 0.060 | ||||
| Absent | 20.53±1.42 | 14.733–23.333 | 1.123 | 0.674–1.538 | ||
| Present | 14.89±1.69 | 11.579–18.203 | 1 | |||
| Lymphnode metastasis | 0.060 | |||||
| Absent | 20.77±1.64 | 17.497–24.059 | ||||
| Present | 16.17±1.47 | 13.294–19.059 | ||||
| Stage | 0.036 | 0.159 | ||||
| I–IIA | 21.18±1.82 | 17.602–24.763 | 2.013 | 1.247–3.263 | ||
| >IIB | 16.21±1.31 | 13.638–18.792 | 1 | |||
| T stage | 0.003 | 0.002 | ||||
| T1–T2 | 23.81±2.34 | 19.218–28.404 | 2.334 | 1.359–4.010 | ||
| >T3 | 16.18±1.11 | 13.977–18.378 | 1 | |||
| N stage | 0.063 | |||||
| N0 | 20.70±1.68 | 17.407–23.995 | ||||
| N1 | 16.17±1.43 | 13.369–18.977 | ||||
| Membrane MUC15 | 0.144 | |||||
| High | 18.00±2.01 | 14.076–21.924 | ||||
| Low | 23.26±2.79 | 17.791–28.745 | ||||
| Cytoplasmic MUC15 | 0.042 | 0.031 | ||||
| High | 15.54±1.43 | 12.735–18.356 | 0.593 | 0.369–0.954 | ||
| Low | 20.83±1.57 | 17.753–23.907 | 1 | |||
P value in bold is statistically significant. T – tumor; N – lymph node.
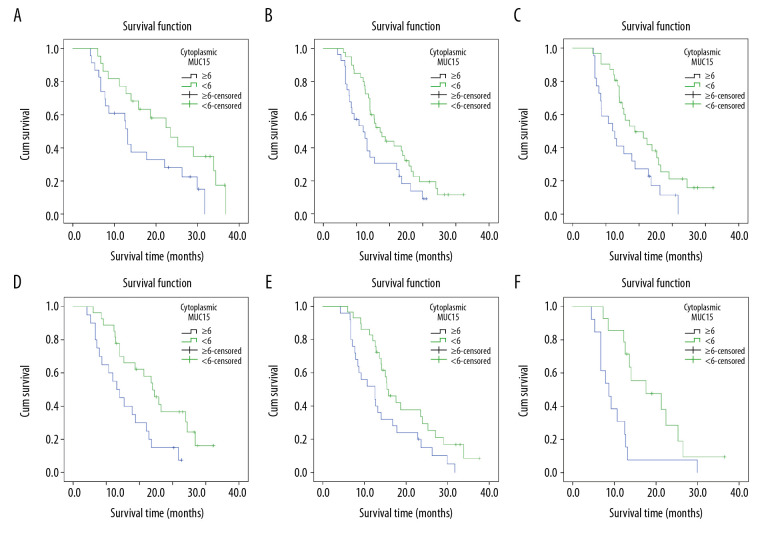
In subgroup survival analyses, MUC15 expression remained significantly associated with prognosis in 6 subgroups: age ≤60 years (P=0.035), elevated CA19-9 (P=0.036), head tumor locations (P=0.026), small tumor size <4 cm (P=0.008), perineural invasion (P=0.021), and vessel invasion (P=0.008). Survival curves are shown in Figure 3A–3F.
Figure 3.
Prognostic impact of MUC15 expression in selected patient subgroups. (A) Patients aged ≤60 years (P=0.035; log-rank test). (B) Patients with elevated CA19-9 (P=0.036; log-rank test). (C) Patients with tumors located at pancreatic head (P=0.026; log-rank test). (D) Patients with tumor size <4 cm (P=0.008; log-rank test). (E) Patients with perineural invasion (P=0.021; log-rank test). (F) Patients with vessel invasion (P<0.008; log-rank test).
Data mining of MUC15 from public databases
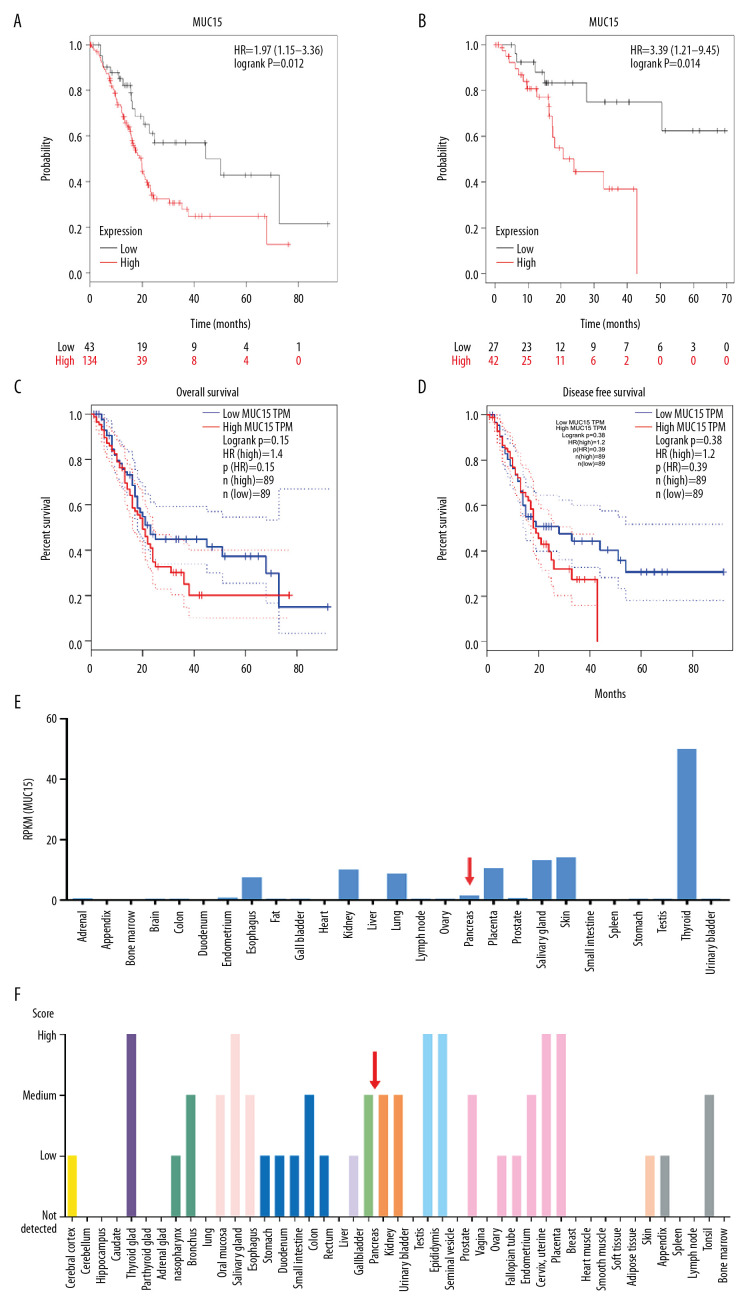
Confirming our finding that MUC15 is associated the poor prognosis of PDAC, the Kaplan-Meier plotter online database illustrated that the high level of MUC15 represented the worse OS and disease-free survival (DFS), which means MUC15 is a tumor promoter in PDAC (P=0.012, 0.014) (Figure 4A, 4B). Meanwhile, the analysis results from GEPIA demonstrated that patients with high MUC15 expression tended to have shorter OS and DFS compared to those with low MUC15 expression, although the difference was not significant (p=0.15, 0.39) (Figure 4C, 4D). Additionally, data from the NCBI Gene database demonstrated that the level of MUC15 in normal pancreases was lower than in other tissues, such as thyroid, placenta, and esophagus (Figure 4E). Consistently, according to data from the Human Protein Atlas, the protein level of MUC15 in pancreases was moderate compared with other organs or tissues, but was lower than in thyroid, placenta, and esophagus tissues (Figure 4F).
Figure 4.
Data mining of MUC15 from public databases. (A) Kaplan-Meier curves for overall survival based on MUC15 expression in PDAC by www.kmplot.com. (p=0.012). (B) Kaplan-Meier curves for disease-free survival based on MUC15 expression in PDAC by www.kmplot.com. (p=0.014). (C) Overall survival curves of MUC15 by GEPIA (P=0.15). TPM, transcripts per million. (D)The disease-free survival curves of MUC15 by GEPIA (P=0.38). TPM, transcripts per million. (E) Basic expression level of MUC15 in different organs or tissues by RNA-sequence. RPKM, reads per kilobase per million reads. (F) The protein expression level of MUC15 in different organs or tissues from the Human Protein Atlas.
The expression level of MUC15 in various cell lines
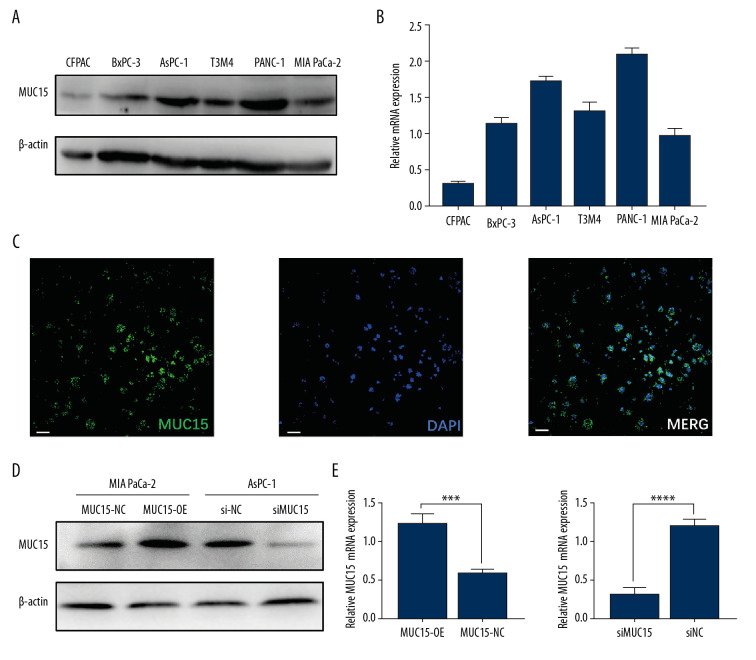
MUC15 was expressed in all the 6 cell lines. T3M3, AsPC-1, and Panc-1 had higher MUC15 expression levels, whereas BxPC-3, MIA PaCa-2, and CFPAC had relatively lower MUC15 expression levels (Figure 5A). RT-PCR proved that the expression of MUC15 mRNA was in accordance with its protein expression (Figure 5B). Immunofluorescence assay also verified that MUC15 is located in the cytoplasm and partially in the membrane (Figure 5C). To explore the biological function of MUC15 in PDAC cells, we overexpressed MUC15 in MIA PaCa-2 cells by transfection with MUC15-OE and downregulated of MUC15 in AsPC-1 cells by transfection with siMUC15. The efficacy of MUC15-OE and siMUC15 compared to negative control was further verified by western blot and PCR (Figure 5D, 5E).
Figure 5.
The expression of MUC15 in PC cell lines and transient transductions of MUC15 overexpression and knockdown were established. (A) MUC15 protein expression 6 PC cells lines. (B) The level of MUC15 mRNA in 6 PC cells lines. (C) Localization of MUC15 in cells by immunofluorescent analysis. White bar, 40 μm. (D, E) The efficiency of MUC15 overexpression and MUC15 knockdown in MIA PaCa-2 and Aspc-1 were confirmed by western blot and qRT-PCR. The data are presented as the mean±SD. (t test; *** p<0.001; **** p<0.0001) (MUC15-OE – MUC15 overexpression; MUC15-NC – MUC15 negative control; siMUC15 – MUC15 knockdown; siNC – scramble control).
MUC15 promoted PC cell migration and invasion
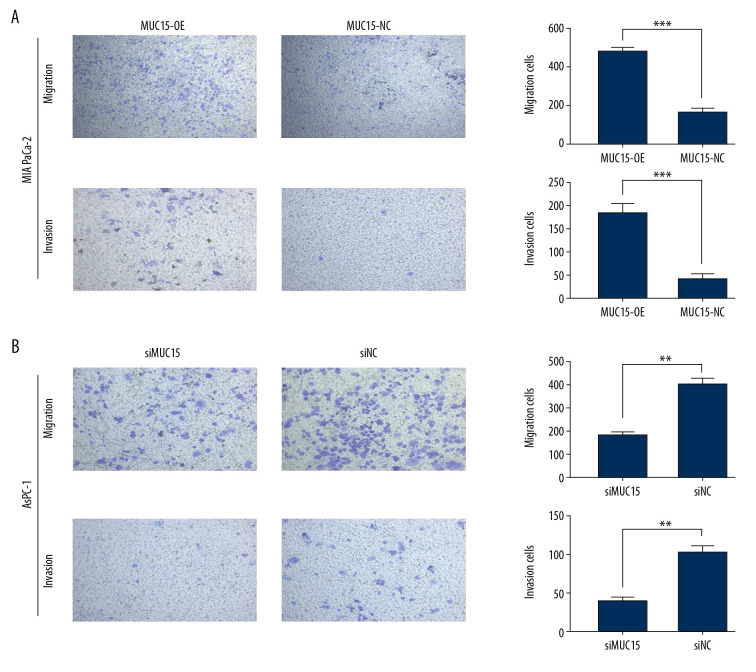
Cellular motility was evaluated by the transwell assay. Overexpression of MUC15 remarkably accelerated the migration and invasion capacity in MIA PaCa-2 cell lines (Figure 5A), while MUC15 knockdown significantly impaired cell migration and migration in AsPC-1 cells compared to negative control (Figure 5B). As previous studies have shown that MUC15 can promote the proliferation of tumor cells [17], we also investigated its effect on PC cell proliferation, but the results showed no significant difference between the MUC15-OE/siMUC15 group and the control groups.
MUC15 enhanced the chemo-resistance of gemcitabine in vitro
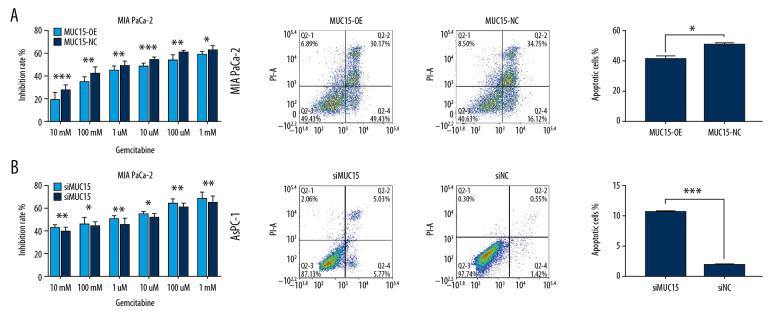
Cytotoxicity assay was performed to determine the function of MUC15 in chemical resistance in vitro. The MUC15 overexpression in MIA PaCa-2 decreased the inhibitory effects of gemcitabine compared with that in the MUC15-NC group (Figure 6A). The MUC15-OE group (42.1 μm) had a higher IC50 of gemcitabine than in the negative control group (3.7 μm). On the contrary, CCK-8 assay indicated that knockdown of MUC15 in AsPC-1 cells was associated with increased inhibition of gemcitabine chemotherapy compared with that in the siNC group (Figure 6B). The half-maximum inhibitory concentration (IC50) of gemcitabine in the siMUC15 group (0.8 μm) was lower than in the siNC group (9.3 um). In addition, the flow cytometry detection of apoptosis showed that the apoptotic rate of MUC15-OE was lower than in the MUC15-NC group after incubation with gemcitabine for 48 h (Figure 6A). By contrast, siMUC15 exhibited a higher rate of apoptosis than in the siNC group (Figure 6B). In summary, these results show that MUC15 enhanced the chemo-resistance of PDAC cells to gemcitabine in vitro.
Figure 6.
Pancreatic cancer cell migration/invasion was assessed by transwell assay. (A) MIA PaCa-2. (B) AsPC-1. (t test; ** p<0.01; *** p<0.001) (MUC15-OE – MUC15 overexpression; MUC15-NC – MUC15 negative control; siMUC15 – MUC15 knockdown; siNC – scramble control).
The underlying mechanism of MUC15 in prompting PDAC
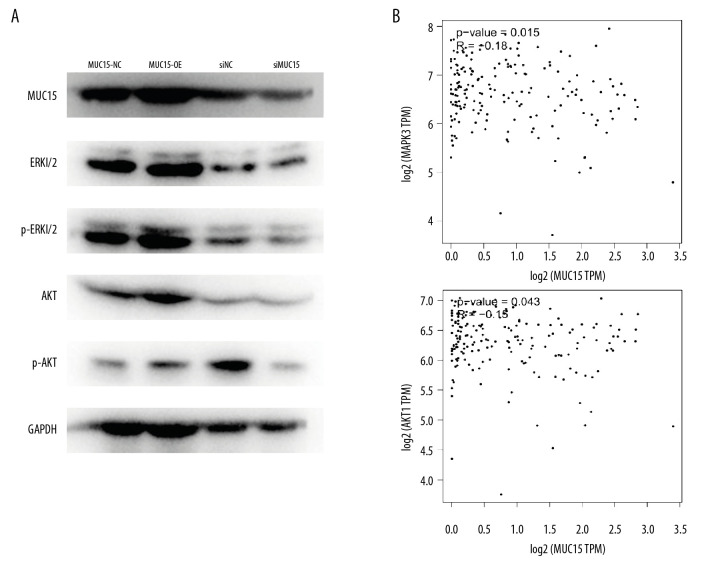
To further explore the mechanism of MUC15 in enhancing tumorigenesis of PDAC, western blot analysis was performed to evaluate changes in protein levels. Previous studies revealed that MUC15 participates in ERK and AKT pathways in other cancers; therefore, we assessed it in pancreatic cancer, showing that MUC15 increased the expression of ERK1/2 and AKT in PC cells by loss-of-function or gain-of-function strategies (Figure 7A). Confirming our findings, we discovered that the expression of MUC15 and ERK1 (also named MAPK3) was positively correlated in PC tissues analyzed by GEPIA (N of PC patients=179, 2-tailed Pearson correction=0.2, = 0.0069). MUC15 and AKT were also correlated with GEPIA (P=0.043) (Figure 7B). Taken together, our results suggest that MUC15 activates the ERK-MAPK and AKT signaling pathways in PDAC (Figure 8).
Figure 7.
MUC15 increased chemo-resistance to gemcitabine in vitro. (A) MUC15 overexpression increased chemo-resistance to gemcitabine. (B) MUC15 knockdown decreased chemo-resistance to gemcitabine. (* p<0.05; ** p<0.01; *** p<0.001;) (MUC15-OE – MUC15 overexpression; MUC15-NC – MUC15 negative control; siMUC15 – MUC15 knockdown; siNC – scramble control).
Figure 8.
MUC15 activated ERK and AKT signaling pathways in pancreatic cancer cells. (A) The key components in ERK and AKT signaling pathway were evaluated by western blot. (B) The expression level between MUC15 and MAPK3(ERK1) or AKT was positively correlated in PDAC as shown using GEPIA.
Discussion
Pancreatic cancer is an extremely malignant tumor with a dismal 5-year survival rate of less than 10% in the U.S. [1]. Increasing interest in novel cancer biomarkers has been focused on the mucin family, which contributes to the malignant phenotype of pancreatic cancer. However, MUC15 has received less attention. In the present study, we explored the expression of MUC15 in PDAC tissue and investigated the function of MUC15 in cancer cells in vivo. We also performed the bioinformatics analysis to further illustrate its role in PDAC. The results show that high cytoplasmic expression of MUC15 is an independent prognostic factor associated with overall survival. Loss-of-function and gain-of-function analyses both proved that MUC15 promotes cell motility and chemo-resistance in pancreatic cancer.
The mucin family has key roles in protecting mucous membranes, lubricating the epithelium, and participating in differentiation of epithelial cells [25,26]. Many mucin proteins, including MUC1, MUC2, MUC4, MUC5AC, and MUC16, widely participate in tumor progression and have clinical utility in pancreatic cancer [27–31]. Currently, there are 2 main contradictory theories on the role of MUC15 in tumorigenesis. Firstly, MUC15 is overexpressed in colon cancer cell lines, activates the p-ERK pathway, and promotes metastasis and invasion [17]. Subsequently, Yang [32] showed the MUC15 overexpression was correlated with cancer progression and can be used as a marker for poor prognosis in glioma patients. In thyroid cancer, Choi [18] showed that MUC15 has a vital function in sphere formation of cancer cells and activates ERK by FAK and GPCR/cAMP pathways. The above studies suggested that MUC15 enhances the occurrence, development, and invasion in malignancies. However, Wang [19] revealed that MUC15 suppresses tumorigenesis in hepatic cancer via the PI3K/AKT pathway. Yue [15] reported that MUC15 inhibits metastasis via PI3K/AKT signaling in renal cancer. It was also reported that upregulation of MUC15 significantly reduces the invasiveness of choriocarcinoma cells [33]. Collectively, the evidence shows that MUC15 exerts dual effects in cancer, and our data demonstrates that MUC15 acts as an oncogenic factor in PC, similar to that in colon cancer and thyroid cancer. The contradictory molecular function of MUC15 in various cancers may result from the tissue heterogeneity, and further studies are needed to elucidate this phenomenon.
We first investigated the expression level of MUC15 in human PDAC samples, and our finding showed cytoplasmic MUC15 is an independent prognostic indicator of pancreatic cancer. Survival data on MUC15 in PDAC from TCGA database also agrees with our results. Dai [34], analyzing TCGA, also reported that MUC15 combined with EMCN is a prognostic signature for gastric cancer. Because membrane MUC15 in our study was only positive in 37 of 92 samples, we failed to draw a strong conclusion about the relationship between membrane MUC15 and clinicopathological parameters, and larger immunohistochemistry studies are needed to explore its prognostic value.
Previous studies found that MUC15 upregulation significantly contributes to migration and invasion in colon cancer, thyroid cancer, and glioma [16–18]. In our study, we also demonstrated that MUC15 could enhance cell motility in PDAC by the strategy of silencing or overexpressing MUC15. At present, the relationship between MUC15 and chemotherapy is unclear. Our study proves that MUC15 promotes gemcitabine chemo-resistance in pancreatic cancer cells, but the underlying molecular mechanism is unclear.
MUC15 was predicted to contain a highly conserved cytoplasmic tail, a small transmembrane domain, and an extracellular domain, suggesting that MUC15 exerts a crucial function in signal transduction [35,36]. ERK-MAPKs are important pathways for the regulation of tumorigenesis, angiogenesis, and metastasis [37,38]. Interestingly, we proved that MUC15 activated the ERK-MAPK pathway in PC cells by western blot. The PI3K/AKT signaling pathway also promotes the invasion and metastasis of pancreatic cancer [32,39]. Activation of this pathway leads to cell progression, cellular apoptosis, protein synthesis, and genomic instability [40]. Not surprisingly, we also verified that MUC15 activates the AKT and p-AKT pathways. These results prove that MUC15 regulates the ERK-MAPK and AKT signaling pathways and induces the motility of PC cells.
A limitation of this study is that it is retrospective, not prospective. In addition, the prognostic value of MUC15 in pancreatic cancer needs to be further validated in larger samples. The mechanisms underlying the role of MUC15 in cancers remain to be elucidated. Further research is needed to investigate the mechanism of MUC15 and its role in the pathophysiology and carcinogenesis of pancreatic cancer.
Conclusions
The results of the present study suggest that cytoplasmic MUC15 could serve as an indicator of poor prognosis among PDAC patients. Moreover, MUC15 activated the ERK-MAPK and AKT signal pathways and strengthened the carcinogenic capacity of pancreatic cancer cells. We hope a more detailed investigation of MUC15 function and its regulatory network would provide new insight for basic and clinical studies of PDAC.
Footnotes
Conflict of interests
None.
Source of support: The project was supported by the Chinese Academy of Medical Science (CAMS) Innovation Fund for Medical Sciences (Grant No. 2016-I2M-3-005), and the National Major Research and Development Programs of the Ministry of Science and Technology of the People’s Republic of China during the 13th Five-Year Plan Period (Grant No. 2017YFC1308602)
References
- 1.Siegel RL, Miller KD, Jemal A. Cancer statistics, 2019. Cancer J Clin. 2019;69:7–34. doi: 10.3322/caac.21551. [DOI] [PubMed] [Google Scholar]
- 2.Chen W, Zheng R, Baade PD, et al. Cancer statistics in China, 2015. Cancer J Clin. 2016;66:115–32. doi: 10.3322/caac.21338. [DOI] [PubMed] [Google Scholar]
- 3.Gillen S, Schuster T, Meyer Zum Buschenfelde C, et al. Preoperative/neoadjuvant therapy in pancreatic cancer: A systematic review and meta-analysis of response and resection percentages. PLoS Med. 2010;7:e1000267. doi: 10.1371/journal.pmed.1000267. [DOI] [PMC free article] [PubMed] [Google Scholar]
- 4.Hartwig W, Hackert T, Hinz U, et al. Pancreatic cancer surgery in the new millennium: Better prediction of outcome. Ann Surg. 2011;254:311–19. doi: 10.1097/SLA.0b013e31821fd334. [DOI] [PubMed] [Google Scholar]
- 5.Katz MH, Hwang R, Fleming JB, Evans DB. Tumor-node-metastasis staging of pancreatic adenocarcinoma. Cancer J Clin. 2008;58:111–25. doi: 10.3322/CA.2007.0012. [DOI] [PubMed] [Google Scholar]
- 6.Zhu Y, Ke J, Gong Y, et al. A genetic variant in PIK3R1 is associated with pancreatic cancer survival in the Chinese population. Cancer Med. 2019;8:3575–82. doi: 10.1002/cam4.2228. [DOI] [PMC free article] [PubMed] [Google Scholar]
- 7.Lu J, Zhou L, Yang G, et al. Clinicopathological and prognostic significance of MKK4 and MKK7 in resectable pancreatic ductal adenocarcinoma. Hum Pathol. 2019;86:143–54. doi: 10.1016/j.humpath.2018.11.026. [DOI] [PubMed] [Google Scholar]
- 8.Lee SH, Jo JH, Kim YJ, et al. Plasma chromogranin a as a prognostic marker in pancreatic ductal adenocarcinoma. Pancreas. 2019;48:662–69. doi: 10.1097/MPA.0000000000001319. [DOI] [PubMed] [Google Scholar]
- 9.Singh PK, Hollingsworth MA. Cell surface-associated mucins in signal transduction. Trends Cell Biol. 2006;16:467–76. doi: 10.1016/j.tcb.2006.07.006. [DOI] [PubMed] [Google Scholar]
- 10.Ali MS, Pearson JP. Upper airway mucin gene expression: A review. Laryngoscope. 2007;117:932–38. doi: 10.1097/MLG.0b013e3180383651. [DOI] [PubMed] [Google Scholar]
- 11.Theodoropoulos G, Carraway KL. Molecular signaling in the regulation of mucins. J Cell Biochem. 2007;102:1103–16. doi: 10.1002/jcb.21539. [DOI] [PubMed] [Google Scholar]
- 12.Chauhan SC, Vannatta K, Ebeling MC, et al. Expression and functions of transmembrane mucin MUC13 in ovarian cancer. Cancer Res. 2009;69:765–74. doi: 10.1158/0008-5472.CAN-08-0587. [DOI] [PubMed] [Google Scholar]
- 13.Pallesen LT, Berglund L, Rasmussen LK, et al. Isolation and characterization of MUC15, a novel cell membrane-associated mucin. Eur J Biochem. 2002;269:2755–63. doi: 10.1046/j.1432-1033.2002.02949.x. [DOI] [PubMed] [Google Scholar]
- 14.Russo CL, Spurr-Michaud S, Tisdale A, et al. Mucin gene expression in human male urogenital tract epithelia. Hum Reprod. 2006;21:2783–93. doi: 10.1093/humrep/del164. [DOI] [PMC free article] [PubMed] [Google Scholar]
- 15.Yue Y, Hui K, Wu S, et al. MUC15 inhibits cancer metastasis via PI3K/AKT signaling in renal cell carcinoma. Cell Death Dis. 2020;11:336. doi: 10.1038/s41419-020-2518-9. [DOI] [PMC free article] [PubMed] [Google Scholar]
- 16.Cheng M, Liu L. MUC15 promotes growth and invasion of glioma cells by activating Raf/MEK/ERK pathway. Clin Exp Pharmacol Physiol. 2020;47:1041–48. doi: 10.1111/1440-1681.13277. [DOI] [PubMed] [Google Scholar]
- 17.Huang J, Che MI, Huang YT, et al. Overexpression of MUC15 activates extracellular signal-regulated kinase 1/2 and promotes the oncogenic potential of human colon cancer cells. Carcinogenesis. 2009;30:1452–58. doi: 10.1093/carcin/bgp137. [DOI] [PubMed] [Google Scholar]
- 18.Choi C, Thi Thao Tran N, Van Ngu T, et al. Promotion of tumor progression and cancer stemness by MUC15 in thyroid cancer via the GPCR/ERK and integrin-FAK signaling pathways. Oncogenesis. 2018;7:85. doi: 10.1038/s41389-018-0094-y. [DOI] [PMC free article] [PubMed] [Google Scholar]
- 19.Wang RY, Chen L, Chen HY, et al. MUC15 inhibits dimerization of EGFR and PI3K-AKT signaling and is associated with aggressive hepatocellular carcinomas in patients. Gastroenterology. 2013;145:1436–48.e1–12. doi: 10.1053/j.gastro.2013.08.009. [DOI] [PubMed] [Google Scholar]
- 20.Nam KH, Noh TW, Chung SH, et al. Expression of the membrane mucins MUC4 and MUC15, potential markers of malignancy and prognosis, in papillary thyroid carcinoma. Thyroid. 2011;21:745–50. doi: 10.1089/thy.2010.0339. [DOI] [PubMed] [Google Scholar]
- 21.McClelland RA, Finlay P, Walker KJ, et al. Automated quantitation of immunocytochemically localized estrogen receptors in human breast cancer. Cancer Res. 1990;50:3545–50. [PubMed] [Google Scholar]
- 22.Fagerberg L, Hallstrom BM, Oksvold P, et al. Analysis of the human tissue-specific expression by genome-wide integration of transcriptomics and antibody-based proteomics. Mol Cell Proteomics. 2014;13:397–406. doi: 10.1074/mcp.M113.035600. [DOI] [PMC free article] [PubMed] [Google Scholar]
- 23.Uhlen M, Zhang C, Lee S, et al. A pathology atlas of the human cancer transcriptome. Science. 2017;357:eaan2507. doi: 10.1126/science.aan2507. [DOI] [PubMed] [Google Scholar]
- 24.Li BQ, Liang ZY, Seery S, et al. WT1 associated protein promotes metastasis and chemo-resistance to gemcitabine by stabilizing Fak mRNA in pancreatic cancer. Cancer Lett. 2019;451:48–57. doi: 10.1016/j.canlet.2019.02.043. [DOI] [PubMed] [Google Scholar]
- 25.Byrd JC, Bresalier RS. Mucins and mucin binding proteins in colorectal cancer. Cancer Metastasis Rev. 2004;23:77–99. doi: 10.1023/a:1025815113599. [DOI] [PubMed] [Google Scholar]
- 26.Pallesen LT, Pedersen LR, Petersen TE, Rasmussen JT. Characterization of carbohydrate structures of bovine MUC15 and distribution of the mucin in bovine milk. J Dairy Sci. 2007;90:3143–52. doi: 10.3168/jds.2007-0082. [DOI] [PubMed] [Google Scholar]
- 27.Kohlgraf KG, Gawron AJ, Higashi M, et al. Contribution of the MUC1 tandem repeat and cytoplasmic tail to invasive and metastatic properties of a pancreatic cancer cell line. Cancer Res. 2003;63:5011–20. [PubMed] [Google Scholar]
- 28.Zhou H, Zhu Y, Wei F, et al. Significance of MUC2 gene methylation detection in pancreatic cancer diagnosis. Pancreatology. 2019;19:1049–53. doi: 10.1016/j.pan.2019.09.012. [DOI] [PubMed] [Google Scholar]
- 29.Urey C, Andersson B, Ansari D, et al. Low MUC4 expression is associated with survival benefit in patients with resectable pancreatic cancer receiving adjuvant gemcitabine. Scand J Gastroenterol. 2017;52:595–600. doi: 10.1080/00365521.2017.1290134. [DOI] [PubMed] [Google Scholar]
- 30.Zhang J, Wang Y, Zhao T, et al. Evaluation of serum MUC5AC in combination with CA19-9 for the diagnosis of pancreatic cancer. World J Surg Oncol. 2020;18:31. doi: 10.1186/s12957-020-1809-z. [DOI] [PMC free article] [PubMed] [Google Scholar]
- 31.Muniyan S, Haridas D, Chugh S, et al. MUC16 contributes to the metastasis of pancreatic ductal adenocarcinoma through focal adhesion mediated signaling mechanism. Genes Cancer. 2016;7:110–24. doi: 10.18632/genesandcancer.104. [DOI] [PMC free article] [PubMed] [Google Scholar]
- 32.Yang WB, Li CY. Correlations of MUC15 overexpression with clinicopathological features and prognosis of glioma. J Huazhong Univ Sci Technolog Med Sci. 2014;34:254–59. doi: 10.1007/s11596-014-1267-3. [DOI] [PubMed] [Google Scholar]
- 33.Shyu MK, Lin MC, Shih JC, et al. Mucin 15 is expressed in human placenta and suppresses invasion of trophoblast-like cells in vitro. Hum Reprod. 2007;22:2723–32. doi: 10.1093/humrep/dem249. [DOI] [PubMed] [Google Scholar]
- 34.Dai W, Liu J, Liu B, et al. Systematical analysis of the Cancer Genome Atlas Database reveals EMCN/MUC15 combination as a prognostic signature for gastric cancer. Front Mol Biosci. 2020;7:19. doi: 10.3389/fmolb.2020.00019. [DOI] [PMC free article] [PubMed] [Google Scholar]
- 35.Pallesen LT, Berglund L, Rasmussen LK, et al. Isolation and characterization of MUC15, a novel cell membrane-associated mucin. Eur J Biochem. 2002;269:2755–63. doi: 10.1046/j.1432-1033.2002.02949.x. [DOI] [PubMed] [Google Scholar]
- 36.Pallesen LT, Pedersen LR, Petersen TE, et al. Characterization of human mucin (MUC15) and identification of ovine and caprine orthologs. J Dairy Sci. 2008;91:4477–83. doi: 10.3168/jds.2008-1204. [DOI] [PubMed] [Google Scholar]
- 37.Friday BB, Adjei AA. Advances in targeting the Ras/Raf/MEK/Erk mitogen-activated protein kinase cascade with MEK inhibitors for cancer therapy. Clin Cancer Res. 2008;14:342–46. doi: 10.1158/1078-0432.CCR-07-4790. [DOI] [PubMed] [Google Scholar]
- 38.Reddy KB, Nabha SM, Atanaskova N. Role of MAP kinase in tumor progression and invasion. Cancer Metastasis Rev. 2003;22:395–403. doi: 10.1023/a:1023781114568. [DOI] [PubMed] [Google Scholar]
- 39.Oh HR, An CH, Yoo NJ, Lee SH. Frameshift mutations of MUC15 gene in gastric and its regional heterogeneity in gastric and colorectal cancers. Pathol Oncol Res. 2015;21:713–18. doi: 10.1007/s12253-014-9878-3. [DOI] [PubMed] [Google Scholar]
- 40.Ebrahimi S, Hosseini M, Shahidsales S, et al. Targeting the Akt/PI3K signaling pathway as a potential therapeutic strategy for the treatment of pancreatic cancer. Curr Med Chem. 2017;24:1321–31. doi: 10.2174/0929867324666170206142658. [DOI] [PubMed] [Google Scholar]


