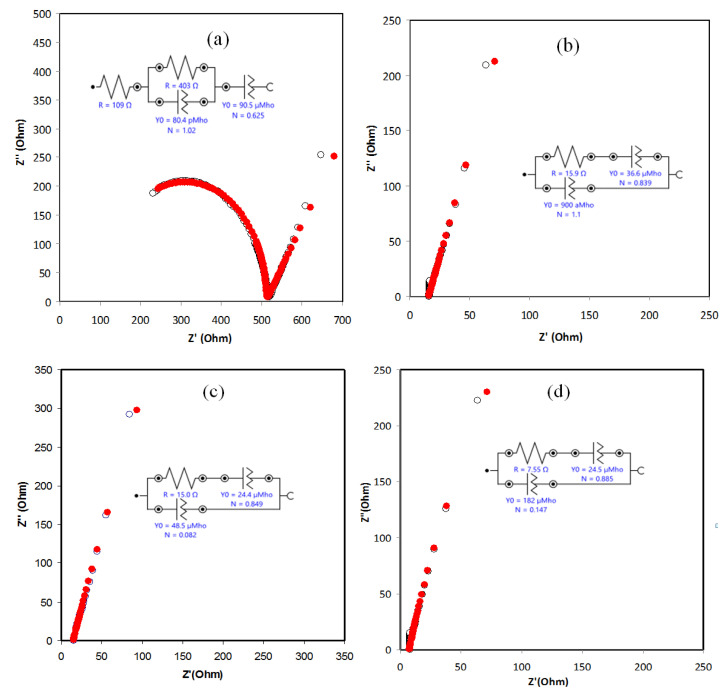
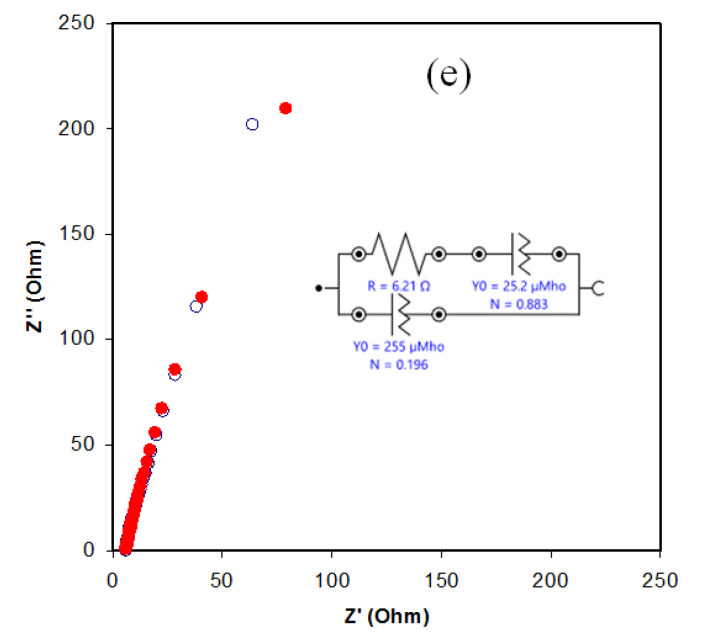
Figure 1.
Nyquist plot (Zi versus Zr) of gel polymer electrolytes with room temperature for (a) I0, (b) I1, (c) I2, (d) I3, and (e) I4 systems. It is obvious that the plot for the sample of I0 displays a semi-circle due to its incorporated with no KI salt. Subsequently, the spike region increases upon adding the KI salt, and the semi-circle was disappeared at the high-frequency regions for the samples of I1–I5.


