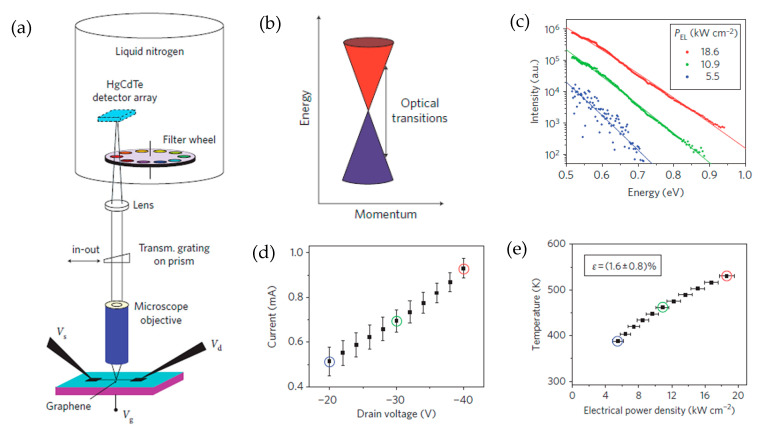
Figure 1.
(a) Shows the experiment setup comprised of infrared imaging, vacuum prob station, and microscope with sensitivity between 0.95 and 0.5 eV. In this, the grating transmission was utilized for spectroscopy and then detached for infrared imaging; to cut down the dark count, a low pass filter was utilized. (b) The direct point vicinity related to the electron dispersion. (c) The measured intensity of thermal infrared radiation from biased graphene under three power levels, where the slide line agrees with grey body radiations, fit to Equation (1). (d) Shows I-V characteristics curve and the error bars were utilized because of slight hysteresis response observed in measurement, where, the values of red, green, and blue highlighted bars correspond to the electrical power level. (e) shows the temperature as a function of electrical power level, based on grey body fitting [45].

