

Abstract
Purpose
The purpose of this study was to gain insights on the pathogenesis of chronic progressive external ophthalmoplegia, thus we investigated the vulnerability of five extra ocular muscles (EOMs) fiber types to pathogenic mitochondrial DNA deletions in a mouse model expressing a mutated mitochondrial helicase TWINKLE.
Methods
Consecutive pairs of EOM sections were analyzed by cytochrome C oxidase (COX)/succinate dehydrogenase (SDH) assay and fiber type specific immunohistochemistry (type I, IIA, IIB, embryonic, and EOM-specific staining).
Results
The mean average of COX deficient fibers (COX−) in the recti muscles of mutant mice was 1.04 ± 0.52% at 12 months and increased with age (7.01 ± 1.53% at 24 months). A significant proportion of these COX− fibers were of the fast-twitch, glycolytic type IIB (> 50% and > 35% total COX− fibers at 12 and 24 months, respectively), whereas embryonic myosin heavy chain-expressing fibers were almost completely spared. Furthermore, the proportion of COX− fibers in the type IIB-rich retractor bulbi muscle was > 2-fold higher compared to the M. recti at both 12 (2.6 ± 0.78%) and 24 months (20.85 ± 2.69%). Collectively, these results demonstrate a selective vulnerability of type IIB fibers to mitochondrial DNA (mtDNA) deletions in EOMs and retractor bulbi muscle. We also show that EOMs of mutant mice display histopathological abnormalities, including altered fiber type composition, increased fibrosis, ragged red fibers, and infiltration of mononucleated nonmuscle cells.
Conclusions
Our results point to the existence of fiber type IIB-intrinsic factors and/or molecular mechanisms that predispose them to increased generation, clonal expansion, and detrimental effects of mtDNA deletions.
Keywords: mtDNA deletions, extraocular muscle, type IIB fibers, cytochrome C oxidase, selective vulnerability
Chronic progressive external ophthalmoplegia (CPEO) is a disorder typically leading to bilateral ptosis and limitation of eye movements. It is caused by slowly progressive paralysis of the extra ocular muscles (EOMs), which are structurally, functionally, and biochemically distinct from other skeletal muscles in the body. Compared to these, EOMs are loosely packed with unusually high amounts of connective tissue, have a higher mitochondrial content in general, are more vascularized, and have higher calcium handling capacities, reflecting their high metabolic needs.1–4 Besides having fibers that express the typical slow I, fast IIA, and fast IIB myosin heavy chain (MyHC) isoforms observed in limb and trunk muscles, adult EOMs also have fibers that express embryonic MyHC (MyHC-emb), neonatal (MyHC-neo), slow-tonic MyHC, and EOM-specific isoforms (MyHC-eoms).5,6 Moreover, individual EOM fibers can also co-express several MyHC isoforms along their length.5,6 On the one hand, these unique features enable EOMs to mediate a wide range of sophisticated eye movements with very different speeds, but on the other hand, obviously confer differential vulnerability to neuromuscular diseases, including mitochondrial myopathies, for which CPEO is often an early manifestation.
Mitochondria are highly dynamic organelles that are involved in various cellular processes, including ATP generation, calcium buffering, signaling, and apoptosis, but also in intermediary metabolism and synthesis of cellular building blocks.7,8 ATP generation is carried out by the respiratory chain complexes I–IV and ATP synthase (complex V) that are embedded within the inner mitochondrial membrane.7,8 These respiratory chain complexes are assembled from a large number of subunits, 13 of which are encoded on mitochondrial DNA (mtDNA), present in thousands of copies in all cells, whereas the rest is encoded on nuclear DNA. In addition, mtDNA also encodes 22 transfer RNAs and 2 ribosomal RNAs, which are essential for translating the 13 messenger RNAs into protein subunits by the mitochondrial ribosomes.9 Deleted mtDNA molecules can be maternally inherited or acquired somatically, probably due to random replication errors, but they are most often due to mutations in nuclear genes encoding proteins needed for mtDNA maintenance. In skeletal muscles and other post mitotic tissues, such deleted mtDNA molecules undergo preferential clonal expansion and upon surpassing a certain critical threshold, usually > 60% of the total mtDNA copies, respiratory chain defects occur, ultimately leading to myopathy.9–11
In a previous study of patients with CPEO, EOMs were found to have a lower threshold for cytochrome C oxidase (COX) deficiency induced by mtDNA deletions and, consequently, an up to threefold higher proportion of COX-deficient (COX−) fibers compared to quadriceps muscle.12 EOMs have also been shown to have a higher mtDNA deletion load and proportion of COX− fibers compared to limb muscles during normal human aging.13 These previous studies clearly demonstrated a higher susceptibility of EOMs to accumulate mtDNA deletions and that these unique muscles suffer more from the associated respiratory chain defects. However, whether this increased vulnerability to mtDNA deletions is uniform across all the different EOM fiber types or not remained unclear, which is important in order to delineate potential fiber-intrinsic factors and/or underlying molecular mechanisms that modulate accumulation of mtDNA deletions, and to bring new insights into the pathogenesis of CPEO. To approach this, we expressed a dominant-negative mutant of the mitochondrial replicative helicase, K320E-Twinkle,14 using mice expressing Cre recombinase under the control of the myosin light chain 1f (Mlc1f)-promoter,15 thereby inducing accelerated accumulation of mtDNA deletions in all skeletal muscles. Here, we show that indeed different EOM fiber types exhibit differential vulnerability to COX deficiency induced by mtDNA deletions, with fiber type IIB being almost exclusively affected, whereas MyHC-emb-expressing fibers are almost completely spared.
Materials and Methods
Transgenic Mouse Generation
K320E-Twinkleskm transgenic mice were generated by crossing R26-K320E-TwinkleloxP/+ mice (point mutation K320E; Rosa26-Stop-construct; downstream EGFP)14 with mice expressing Cre recombinase under the control of the skeletal muscle-specific Mlc1f-promoter.15 All mice used for experiments were housed in a standard animal facility maintained at 23°C, 12:12 hours light-dark cycle, with free access to water and standard rodent chow. All procedures and experimentation with mice were performed according to protocols approved by the local authority (LANUV, Landesamt für Natur, Umwelt und Verbraucherschutz North Rhine Westphalia [NRW], approval number: 2013-A165). The animal experiments also adhered to ARVO Statement for the use of Animals in Ophthalmic and Vision Research.
Sample Collection and Preparation
Mice were euthanized by cervical dislocation and both eyes with all EOMs attached were rapidly dissected, mounted on cork with optimal cutting temperature compound (Tissue-Tek, Sakura), snap frozen in isopentane that was pre-cooled in liquid nitrogen, then stored at −80°C until needed. For all histological studies, 10 µm thick sections from the distal, midbelly, and proximal parts of EOMs were produced using a cryostat maintained at −20°C (Leica CM 3050s, Techno-med), then stored at −80°C until needed.
Hematoxylin and Eosin Staining
Standard hematoxylin and eosin (H&E) staining was used to assess general EOM structure. Briefly, 10 µm thick frozen cross-sections were air dried for 10 minutes, stained with Gill 3 Hematoxylin (Thermo Scientific) for 3 minutes, washed for 1 minute in acidified milli Q (MQ) water, and then put under running tap water for 10 minutes. The sections were then stained with Eosin Y solution (Carl Roth) for 2 minutes, dehydrated in ascending concentrations of ethanol (50%, 70%, 95%, and 100%), cleared in 100% xylene two times, and mounted with Entellan (Merck, Germany).
Modified Gomori-Trichrome Staining
To visualize abnormal accumulation of sub-sarcolemmal mitochondria (“ragged red fibers”), 10 µm thick frozen cross-sections were air dried for 10 to 15 minutes, then stained with Gill Hematoxylin (Thermo Scientific), as described above. The sections were then incubated in Gomori-Trichrome solution (0.6% w/v Chromotrop 2R [Carl Roth], 0.3% w/v fast green FCF (Sigma Aldrich), 0.6% w/v phosphotungstic acid (Sigma-Aldrich), 1% v/v acetic acid, and final pH 3.4) for 60 minutes then washed for 1 minute in 0.2% v/v acetic acid. After dehydration in ascending concentrations of ethanol (50%, 70%, 95%, and 100%), the stained sections were cleared in two changes of 100% xylene and then mounted with Entellan (Merck, Germany).
Picro-Sirius Red Staining
To evaluate fibrosis, 10 µm thick frozen sections were air dried for 10 to 15 minutes, fixed in cold acetone (−20°C) for 10 minutes, and stained for collagen in 0.1% v/v solution of Sirius red F3B (Sigma-Aldrich) saturated with picric acid (Sigma-Aldrich) for 60 minutes. The sections were then washed for 2 minutes in 0.5% v/v glacial acetic acid, and then treated as described above.
Fiber Type Identification
The sources and dilutions of antibodies against MyHC isoforms were as follows: mouse anti-embryonic MyHC (1:20; embryonic-MyHC, IgG; F1.652), mouse anti-EOM-specific MyHC (1:30; Eom-specific-MyHC, IgM; 4A6), mouse anti-type I MyHC (1:50; I-MyHC, IgG2b; BA-D5), mouse anti-type IIa MyHC (1:100; IIa-MyHC, IgG; SC-71), and mouse anti-type IIb MyHC (1:20; IIb-MyHC, IgM; BF-F3); these were obtained from the Developmental Studies Hybridoma Bank (DSHB, University of Iowa, Iowa City, IA, USA). The secondary antibodies, Dylight 488 (1:200–500, goat anti-mouse IgG) and AlexaFluor 594 (1:1000, goat anti-mouse IGM) were obtained from Invitrogen. Additionally, Alexa Fluor 488 (1:500, goat anti-mouse IgM), Alexa Fluor 555 (1:500, goat anti-mouse IgG), and Alexa Fluor 647 (1:500, goat anti-mouse IgG2b) were used for fiber type triple staining.
Sequential Cytochrome C Oxidase/Succinate Dehydrogenase Histochemistry
To assess the functional integrity of respiratory chain (RC) complexes, 10 µm thick cross- and longitudinal sections were sequentially stained for COX and succinate dehydrogenase (SDH) activities. Briefly, frozen sections were air dried for 10 to 15 minutes and incubated for 20 minutes in COX staining solution (20 mg/mL catalase (Sigma), 75 mg/mL sucrose (Sigma), 2 mg/mL cytochrome C (reduced form, Sigma), and 1 mg/mL 3,3'-diaminobenzidine (DAB; Sigma) in 50 mM Na2HPO4, final pH 7.4) at 37°C, then washed in PBS for 2 minutes. The sections were then incubated in SDH staining solution (2 mg/mL Nitrozolium blue tetrachloride [NBT]; Sigma), 0.2 M sodium succinate, 50 mM MgCl2, 50 mM Tris-HCl, final pH 7.4) for 1 hour at 37°C, then washed in MQ water for 2 minutes, and mounted with glycerol gelatin (Sigma).
In the sequential COX-SDH double staining, cells with normal COX activity oxidizes 3,3'-DAB, leading to formation of a brown indamine polymer product, which localizes in cristae and saturate cells, thereby appearing brown on visualization. Cells with COX deficiencies, will not oxidize 3,3'-DAB, and therefore will not be saturated by the indamine polymer, allowing SDH to efficiently reduce nitroblue tetrazolium to a blue formazan end product, thus revealing COX deficient cells in blue (Ross et al., 2011), whereas the COX positive fibers appear brown to dark brown. This, double COX-SDH staining approach, which is considered the gold standard in clinical diagnosis of mitochondrial disorders, is more sensitive and specific than either COX or SDH alone.11,16
mtDNA Deletion Screening
Total DNA was isolated using DNeasy Blood and Tissue Kit (Qiagen) according to the manufacturer's instructions. 25 ng of total DNA was used for the following experiments. Long range PCR was used to screen for the presence of mtDNA deletions accumulated in muscles of mutant mice. The deleted mtDNA molecules were then amplified using TAKARA LA PCR Kit (TAKARA Bio), as described previously.14 The PCR products were then resolved on a 0.8% agarose gel in TAE buffer, stained with ethidium bromide (0.8 µg/mL), and visualized under ultraviolet (UV)-light (EL Logic 200 Imaging system). Four of the most common mtDNA deletions present in aged mice17,18 were detected by standard PCR and resolved in 2% agarose gel using the following primers (5’-3’): deletion 1: Forward: ggaatttcaccacttaaccct, Reverse: tagctgttatagaagtggcga; deletion 3: Forward: agagtaattaacctgtacactg, Reverse: atgcggtgaataatagatggg; deletion 13: Forward: attagcagtccggcttacagc, Reverse: tcatgtcattggtcgcagttg; deletion 17: Forward: tcgtaacaaggtaagcatactg, Reverse: ctcgcggactagtatatcct. D-Loop region primers were Forward: cataaacacaaaggtttggtcc, Reverse: ctaggcaaggtgtcttaagc. When the corresponding deletions were detected in standard PCR, the same primers were used to quantify the relative amount of deletions by quantitative PCR using the fold change method and the D-Loop as the internal control. Mitochondrial DNA copy number was determined by analyzing threshold amplification differences between mitochondrial DNA and nuclear DNA (delta C(t) method with the following primers (5’-3’): mitochondrial DNA_Forward: cctatcacccttgccatcat, mitochondrial DNA_Reverse: gaggctgttgcttgtgtgac; nuclear DNA (Pecam1 gene)_Forward: atggaaagcctgccatcatg, nuclear DNA (Pecam1 gene)_Reverse: tccttgttgttcagcatcac).
Image Acquisition and Analysis
Whole sections stained by hematoxylin and eosin, modified Gomori trichrome, Sirius Red, and COX / SDH were scanned at 20× magnification and digitized using Leica SCN400 (CECAD Imaging Facility, Cologne, Germany). Images of whole sections single-stained for fiber types were taken using ZEISS Axio Scan.Z1. To determine the fiber type of the COX deficient cells, images of consecutive sections stained for COX activity (sequential COX / SDH histochemistry) and MyHC isoforms (single immunofluoresence) were analysed using ImageJ / FIJI and CellProfiler open source software. The ImageJ / FIJI Plugin bUnwarpJ19,20 was used to perform an elastic transformation based on corresponding landmarks that were manually set on the consecutive COX / SDH and fiber type images. The registration was then checked manually and all the areas with satisfactory registration were selected as regions of interest. Segmentation was then performed on the COX / SDH images using CellProfiler, as previously described,21 to identify individual fibers. A filtration step was then performed using predefined parameters (e.g. size) to exclude misidentified objects. The classifier function in Cell Profiler Analyst22 was then trained to specifically recognize COX-deficient cells. The signal intensity of the corresponding fiber in the registered immunofluorescence image was then analyzed to determine whether it was positively stained for a specific fiber type.
Quantification of Sirius red was performed in at least 3 regions of interest per mouse of 150 × 150 µm for global layer and 100 × 100 µm for orbital layer to get an averaged value. Red green blue (RGB) images were split in the three main channels and the green channel was thresholded to obtain the area occupied by collagen. Internal plugin of Image J was used to obtain the percentage of the image occupied by Sirius red positive collagen.
Quantification of fiber number and fiber cross sectional area (CSA) were performed on hematoxylin and eosin stained sections. For fiber number quantification, regions of interest measuring 200 × 200um were selected from global and orbital layers of inferior and medial recti muscles using Aperio Imagescope software (Leica Biosystems). The cell counter plugin in Image J was then used to count fibers in at least two regions of interest per mouse. For the fiber cross sectional area, two regions of interest measuring 200 × 200 um were obtained from global and orbital layers of inferior and medial recti muscles using Aperio Imagescope software (Leica Biosystems). The free hand tool in image J software was then used to mark individual whole fibers, after which the area and ferret diameter was measured.
Results
K320E-Twinkleskm Extraocular Muscles Exhibit Accelerated Accumulation of mtDNA Deletions
Expression of K320E-Twinkle has been shown to produce either mtDNA depletion or accumulation of mtDNA deletions depending on the targeted tissue (Baris et al., 2015; Weiland et al., 2018; and Holzer et al., 2019). To characterize mitochondrial DNA defects after transgenic expression of K320E-Twinkle in the EOMs, we performed mtDNA copy number quantification and Long Range PCR to detect mtDNA depletion or deletions, respectively. The mtDNA copy number showed no difference in samples from 12 and 24 month old animals (Fig. 1A). However, re-arrangements of mtDNA were observed at 24 months old K320E-Twinkleskm by Long Range PCR (Fig. 1B). We also performed standard PCR to detect 4 common deletions, namely deletion 1, deletion 3, deletion 13, and deletion 17, covering different areas of the mtDNA sequence (Fig. 1C; Tanhauser and Laipis, 1995; Neuhaus et al., 2014). As shown in Figure 1D, only deletion 17, covering the area of the common deletion mtDNA4977, was present at 12 month old animals. However, at the age of 24 months, this deletion and several additional deletions located in the mitochondrial DNA major arc were present. To quantify the relative amount of such deletions we performed quantitative PCR analysis taking the D-loop region as an internal control. In K320E-Twinkleskm, deletion 17 was up to 150 times more abundant than in control samples at the age of 12 months (Fig. 1E). At the age of 24 months, all of the deletions mentioned above were present in both genotypes but enriched in K320E-Twinkle mice (Fig. 1F). These data indicate that K320E-Twinkle cause mitochondrial DNA instability in extraocular muscles, effectively leading to an accumulation of mitochondrial DNA deletions.
Figure 1.

Analysis of mtDNA deletions in extraocular muscles. (A) Quantitative PCR analysis of mtDNA copy number in EOMs at the indicated ages. (B) Long range PCR of recti muscles at 12 and 24 months of age (2 PCR products present at both time points are probably derived from nuclear pseudogenes.14 (C) Schematic representation of the most common mitochondrial DNA deletions present in aged mice. (D) PCR analysis of deletions 1, 3, 13, and 17 and the D-Loop region of mitochondrial DNA at 12 and 24 months of age. (E) Quantitative PCR of indicated deletions at 12 months and (F) 24 months. Student's t-test, * P < 0.05; ** P < 0.01.
Different Eye Muscles and Extraocular Muscle Layers in K320E-Twinkleskm Show Distinct Patterns of COX Deficiency
EOMs comprise of four recti (superior rectus [SR], inferior rectus [IR], lateral rectus [LR], and medial rectus [MR]) and two oblique muscles; superior oblique and inferior oblique.23,24 These extraocular muscles have two structurally and functionally distinct layers, the global layer (GL) close to the eyeball and the orbital layer (OL), which is adjacent to the orbit.4,25–27 In addition to these six EOMs, rodents also have retractor bulbi muscles, which surround the optic nerve24 (Supplementary Fig. S1). At 12 months of age, the percentage of COX deficient fibers in the global layer of recti muscles was 0.28 ± 0.09% in control mice compared to 1.72 ± 0.89% in K320E-Twinkleskm (P = 0.15, unpaired t-test, N = 5). This proportion increased > 4-fold, reaching 9.61 ± 1.7% in K320E-Twinkleskm compared to 0.20 ± 0.04% in control mice at 24 months of age (P = 0.0015, unpaired t-test, N = 4, Figs. 2A, 2B, and Supplementary Fig. S1). In the orbital layer, the proportions of COX deficient fibers were 0.18 ± 0.06% and 0.32 ± 0.13% in controls and mutants, respectively, at 12 months (P = 0.37, unpaired t-test, N = 5) and were significantly higher in mutants compared to controls by the age of 24 months (2.23 ± 0.56% vs. 0.05 ± 0.03%, P = 0.008, unpaired t-test, N = 4, Figs. 2C, 2D). In the retractor bulbi, K320E-Twinkleskm mice had a significantly higher proportion of COX deficient fibers compared to controls already at 12 months (2.6 ± 0.78% vs. 0.13 ± 0.12%, P = 0.03, unpaired t-test, N = 5), which increased 7-fold by 24 months of age (20.85 ± 2.69% vs. 0.02 ± 0.02%, P < 0.0001, unpaired t-test, N = 4, .Figs. 2E, 2F). Comparative analysis in K320E-Twinkleskm mice showed that, the retractor bulbi was affected more heavily compared to the global layer of the recti muscle, which in turn had a significantly higher COX deficiency burden compared to the orbital layer at 24 months of age (Fig. 2G and Supplementary Fig. S1, P < 0.001, 2-way ANOVA). This suggests that at 12 months, the retractor bulbi accumulates a higher mutational load compared to recti muscles. Although not among the EOMs controlling eye movements, the levator palpebrae superioris (LPS) was also strongly affected at 24 months, to an extent that seems comparable to the retractor bulbi (Figs. 2H, 2I). Altogether, these results indicate a very different susceptibility to mtDNA deletions-driven COX deficiency in different mouse eye muscles.
Figure 2.

Age-dependent and differential COX deficiency in extraocular muscles and retractor bulbi muscle. (A–F) Sequential cytochrome c oxidase (COX)/succinate dehydrogenase (SDH) histochemical analysis showing an accelerated and age-dependent increase in COX deficient (blue) fibers in the A global layer of rectus muscles, C orbital layer of rectus muscles and E retractor bulbi of K320E-Twinkleskm compared to control mice. *Indicates COX deficient cells. Scale bar, 100 µm. (B, D, F) show the average proportion of COX deficient fibers in both global and orbital layer of the rectus muscles and the retractor bulbi, respectively. Student´s t-test. * P < 0.05; ** P < 0.01; ***, P < 0.001. (G) Differential COX deficiency burden in the global layer and orbital layers of rectus muscles, and retractor bulbi of K320E-Twinkleskm. (H) Sequential cytochrome C oxidase (COX) / succinate dehydrogenase (SDH) histochemical analysis in levator palpebrae superioris. * Indicates COX deficient cells. Two-way ANOVA. *** P < 0.001. (I) Average proportion of COX deficient fibers in LPS. Data expressed as mean ± SEM. Student´s t-test. *** P < 0.001. N = 4 to 5 animals per group. Scale bar, 100 µm.
Type IIB Fibers are Most Vulnerable to COX Deficiency in K320E-Twinkleskm
To determine wether there exists a differential succeptibility of different muscle fiber types in EOMs to develop COX deficiency, a pair of consecutive muscle sections obtained from recti muscles of mutant mice were stained for COX activity (sequential COX-SDH histochemistry) and myosin heavy chain isoforms (immunofluoresence), respectively. As shown in Figure 3, a significantly higher proportion of COX deficient fibers were of type IIB, both at 12 (Figs. 3A, 3E, P < 0.001, 2-way ANOVA) and 24 months (Figs. 3B, 3E, P < 0.001, 2-way ANOVA) of age, compared to the other 4 fiber types (I, IIA, embryonic, and EOM specific) that were analysed. Notably, MyHC embryonic-expressing fibers were completely spared (Fig. 3E).
Figure 3.

Type IIB fibers show selective vulnerability to develop COX deficiency. (A) Representative pictures from consecutive sections stained for sequential COX / SDH histochemistry and MyHC I, IIA, and IIB (triple-immunofluorescence) of 12 months and (B) 24 months old K320E-Twinkleskm. Numbers highlight the COX− fibers and the corresponding fiber type on the consecutive section. (C) Representative pictures for sequential COX-SDH histochemistry and myosin heavy chain embryonic and (D) for extraocular muscle specific myosin heavy chain. Numbers label same fibers in the corresponding images. (E) Proportions of different fiber types that were COX deficient in selected rectus muscles of K320E-Twinkleskm at the age of 12 and 24 months. Scale bar, 100 µm. Data expressed as mean ± SEM, N = 4 to 5 animals per group. Two-way ANOVA., Interaction: ** P < 0.01; Fiber Type: **** P < 0.0001; Age: P = 0.0616.
Extraocular Muscles of K320E-Twinkleskm Mice Show Altered Fiber Type Composition
In previous studies, respiratory chain defects induced by mtDNA deletions have been associated with fiber atrophy and fiber loss.28,29 We therefore asked whether the observed selective vulnerability of type IIB fibers (see Fig. 3) would cause a preferential decrease in the proportion of this particular fiber type over time, thereby altering the fiber type composition of EOMs. To this end, we quantified the fiber type proportions in the global and orbital layers of EOMs as well as the retractor bulbi. As shown in Figures 4A, 4B, the proportion of type IIB fibers in the retractor bulbi, which has the highest proportion of COX deficient fibers (Figs. 2F, 2G), decreased from 70% at 12 months to 45% at 24 months of age in the mutant mice compared with the appropriate age-matched controls (P < 0.001, 2-way ANOVA). This decrease in type IIB fibers was accompanied by a tendency to increased proportions of embryonic fibers and other fiber types (not statistically significant). The global layer of the recti muscles also showed a tendency to decreased proportion of type IIB fibers at 24 months (see Fig. 4B, not statistically significant), whereas there was no change in the orbital, which has a much lower proportion of type IIB fibers (see Fig. 4B) and thus also had the lowest burden of COX deficiency (Figs. 2C, 2D). Interestingly, however, the orbital layer of mutant recti muscles exhibited a significantly higher proportion of type IIA compared to controls at 24 months of age (see Fig. 4B, P < 0.05, 2-way ANOVA). Altogether, these results demonstrated that COX deficiency alters the fiber type composition of EOMs during aging, with the more susceptible type IIB fibers undergoing a preferential decline over time.
Figure 4.

Respiratory chain defects alter fiber type composition of extraocular muscles and retractor bulbi. (A) Representative images of whole extraocular muscle sections stained for MyHC I, IIA, and IIB (triple-immunofluorescence) at 12 and 24 months. (B) Proportions of type I, IIA, and IIB in global and orbital layer of recti muscles and retractor bulbi. (C) Proportions of EOM-specific and embryonic fiber types in global and orbital layer of recti muscles and retractor bulbi. Data expressed as mean SEM, N = 4 to 5 animals per group. Two-way ANOVA, Tukey multiple comparison test. ** P < 0.001, *** P < 0.001. Scale bar, 200 µm.
In order to further characterize the effects of RC defects on aging-related histological changes of EOMs, we conducted hematoxylin and eosin as wells as Picro-Sirius red histochemical analyses. Hematoxylin and eosin staining showed increased fibrous connective tissue in the orbital, but not the global layer of the mutant mice as early as 12 months of age (Fig. 5B). Fiber number analysis revealed a trend to increase in mutants compared to controls at 24 months (Figs. 5C, 5D). Fiber cross sectional area was lower in mutants compared to controls at 24 months, both in the global and orbital layers, indicating that mtDNA deletions induce atrophic changes in EOMs. Consistent with the hematoxylin and eosin staining, Picro-Sirius red analysis revealed increased collagen deposition, again particularly in the orbital layer of the mutant mice compared to controls (Figs. 6C, 6D). Modified Gomori trichrome staining revealed the presence of ragged-red fibers. Notably, this staining, combined with double COX / SDH staining on consecutive sections, demonstrated that only a few COX deficient fibers with increased SDH activity (COX− / SDH++) are ragged-red (Figs. 7C, 7D).
Figure 5.

Respiratory chain defects alter general architecture of extraocular muscles. (A) Hematoxylin and eosin histochemical analysis of global and (B) orbital layers of rectus muscle (inferior). (C) Quantification of fiber numbers in the indicated layers of the medial rectus and (D) the inferior rectus. Data expressed as Mean ± SEM. (E) CSA quantification and fiber size distribution for global and (F) orbital layer of the rectus muscles. Mann-Whitney test. Scatter plots show Median value. ** P < 0.01; **** P < 0.0001. Scale bar, 100 µm.
Figure 6.
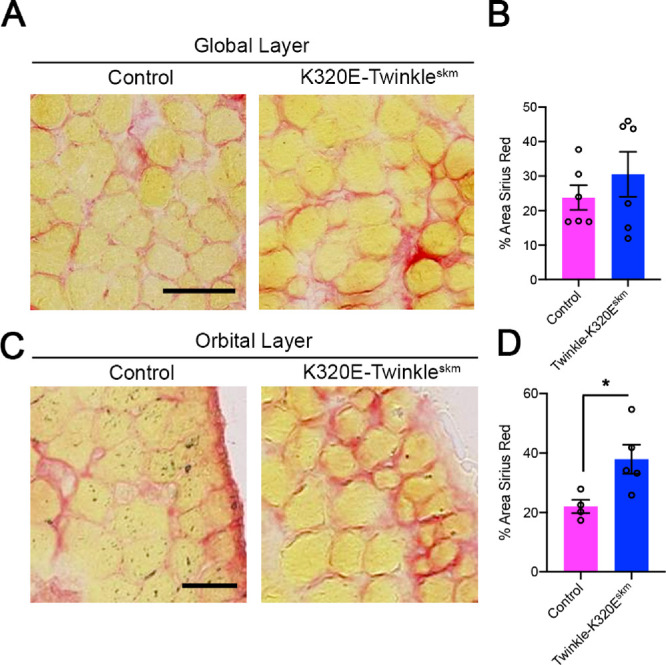
Mitochondrial DNA deletions cause increased collagen deposition in the orbital layer of rectus mucles. Picro-Sirius red histochemical analysis of 24 months old mice. (A) Collagen staining in global and (C) orbital layer of inferior rectus muscles. Scale bar in A, 50 µm; scale bar in C, 25 µm. (B) Quantification of the area occupied by collagen in global layer and (D) orbital layer. Student's t-test, * P < 0.05.
Figure 7.

Respiratory chain defects are associated with a ragged-red fiber phenotype in K320E extraocular muscles. (A) Modified Gomori trichrome analysis of global and (B) orbital layers of rectus muscle (inferior). Ragged red fibers are depicted by the arrows in the global layer of 24 months old K320E-Twinkleskm mice. (C, D) Consecutive sections of 24 month old K320E-Twinkleskm, showing Ragged red fibers and the same fiber stained for COX / SDH activities. Ragged red fibers were mainly COX− / SDH++ (arrows). Scale bar in C, 100 µm.
Discussion
Previous studies in CPEO patients with mtDNA deletions reported a threefold higher proportion of COX deficient fibers in EOMs compared to limb skeletal muscles.12 Moreover, EOMs were also shown to accumulate higher levels of somatic mtDNA deletions concomitant with a higher proportion of COX deficient fibers compared to limb muscles during normal aging in healthy humans.13 The current study, using a genetic model accelerating the generation of mitochondrial DNA deletions in mice, extends these findings and shows that there is a surprisingly differential vulnerability to respiratory chain defects caused by such mtDNA deletions among different fiber types.
The retractor bulbi muscle, which is predominantly composed of type IIB fibers (see Fig. 4B) had a much higher proportion of COX deficient fibers than the recti muscles both at 12 and 24 months of age in our K320E-Twinkleskm mice (see Figs. 2A–2G). The percentage of COX deficient fibers was also higher in the global layer of the rectus muscle compared to the orbital layer (see Figs. 2A–2D). Notably, these two layers differ in fiber type composition, with the global layer again having a higher proportion of type IIB (see Fig. 4B). A small proportion of EOM specific fibers were also COX deficient at 12 months of age, whereas COX deficiency could only be detected at 24 months of age in type I and IIA fibers, and embryonic fibers were, in contrast, completely spared (see Fig. 3E). Collectively, these results clearly demonstrate selective vulnerability of type IIB fibers to respiratory chain defects in EOMs and retractor bulbi. Importantly, this leads to a preferential decrease in the proportion of type IIB fibers with age, concomitant with an increase in other fiber types, particularly type IIA and embryonic MyHC-expressing fibers (see Fig. 4).
Although we did not conduct functional experiments in the current study, which would be technically extremely challenging in mice, the selective vulnerability of the glycolytic type IIB to mtDNA deletion-induced respiratory chain defects and subsequent progressive decrease in their proportion (see Figs. 3C and 4B) might cause progressive weakness of EOMs. Indeed, the glycolytic type IIB fibers generate stronger force, which is crucial for the execution of tasks that require powerful contractions.6 Notably, humans do not express type IIB fibers, but express fiber type IIX, which is closely related to fiber type IIB in terms of metabolism (preferentially glycolytic), force generation and fatigue resistance.6 The selective vulnerability of the strong glycolytic fibers such as type IIB (probably IIX in humans), as well as the early but lower vulnerability of EOM specific fibers to respiratory chain defects (see Fig. 3E), might thus explain why slow saccades are an early and common symptom in patients with CPEO.30 This is because type IIB and EOM specific fibers have the fastest shortening velocities of all the other fiber types.6,31 Ptosis due to impaired levator muscle function is a common and early clinical symptom in patients with mitochondrial myopathies.32,33 This is in line with our observation of extensive respiratory chain defects in levator palperae superioris muscle of the mutant mice (see Fig. 1I).
Consistent with our data, a differential vulnerability of fiber types to respiratory chain defects has also been observed in limb skeletal muscles. In one recent study, the central parts of the rat quadriceps, which are predominantly composed of type I fibers was spared from beta‐guanidinopropionic acid-induced mtDNA deletions compared to peripheral parts of quadriceps, which is predominantly composed of type II fibers.29 Type II fibers in rat rectus femoris muscles,34 and specifically type IIB fibers in rhesus monkey vastus lateralis35 have also been shown to have higher susceptibility to aging-related mtDNA deletion accumulation compared to type I fibers. Moreover, mtDNA deletion-associated respiratory chain defects were found to occur much earlier in fiber type IIB-rich vastus lateralis muscle compared to fiber type I-rich soleus in rats.36
Type IIB fibers are highly glycolytic, with a comparatively low mitochondrial content compared to type I and IIA fibers in limb muscles.1,6 This low mitochondrial content of type IIB has been suggested as a potential factor underlying their selective vulnerability to respiratory chain defects because deletion of even a few mtDNA molecules would be enough to surpass the mtDNA mutational threshold.36 However, the mitochondrial content of all the EOM fibers, type IIB included, is at least threefold higher than in limb muscle fiber types,1 yet EOMs still are more susceptible to mtDNA deletions.12,13 Greaves, and colleagues12 demonstrated a lower mtDNA mutational threshold for COX deficiency and a higher rate of mtDNA deletion accumulation in EOMs compared to limb muscles. Therefore, our results showing that type IIB fibers in EOMs are affected earlier and more extensively (see Figs. 3A, 3B, 3E), suggest that these fibers might either have a faster rate of mitochondrial DNA deletion accumulation, clonal expansion, or a lower threshold compared to the other fiber types.
mtDNA deletions have been proposed to arise sporadically due to increased replication errors in cells with mutated Twinkle or polymerase gamma (Pol-γ).37,38 It is thus possible that type IIB fibers inherently have higher mtDNA replication error rates compared to other fiber types, which become exacerbated in the presence of a defective Twinkle as observed in our model. The induction and/or efficiency of mitophagy in removing mitochondria harboring deleted mtDNA molecules might also be lower in type IIB fibers relative to the other fiber types. Importantly, oxidative fibers have been shown to have elongated mitochondrial networks with higher fusion rates than glycolytic fibers.39 Mitochondrial fusion promotes content mixing, which has been proposed to maintain mitochondrial function and enable human cells to tolerate high mtDNA mutations load.40,41 In skeletal muscles, impaired mitochondrial fusion due to deletion of mitofusins 1 and 2 has particularly been shown to accelerate mtDNA mutagenesis and decreases mitochondrial DNA copy number.42 Therefore, the lower mitochondrial fusion rates observed in glycolytic fibers39 might be another likely factor that could drive accelerated accumulation of mtDNA deletions in type IIB fibers.
Recent studies have also demonstrated that respiratory chain defects activates mammalian target of rapamycin complex1 (mTORC1)-driven stress responses, which contributes to mitochondrial DNA deletion accumulation in skeletal muscles, probably via induction of deoxynucleotide triphosphates (dNTPs) pool imbalances, which are highly mutagenic.43 Inhibition of mTORC1 has also previously been shown to promote mitophagy in cybrid cells carrying large scale partial deletions of mtDNA.44 It would thus be of interest in future studies to also determine whether stress responses to respiratory chain defects caused by mtDNA deletions, particularly the induction of mTORC1-driven integrated mitochondrial stress response, is heightened or occur preferentially in type IIB fibers.
We observed fiber atrophy, ragged-red fibers, increased collagen fibrosis, and infiltration of mono-nucleated non-muscle cells (see Figs. 56–7). This is consistent with the histopathological changes that have been observed in skeletal muscles of patients with multiple mtDNA deletions, including patients with CPEO,45 pointing to the value of our model in studying the mechanistic links between mitochondrial DNA deletions and histopathology in mitochondrial disorders. Importantly, detrimental levels of multiple mtDNA deletions have also been suggested to play a role in aging-related sarcopenia.28,36 Our observations of histological changes, including fiber atrophy, and altered fiber type composition, further support such a role.
In conclusion, the susceptibility of EOM fibers to mitochondrial DNA deletions vary with fiber type, IIB fibers being the most affected. Because EOMs are tonically active, this suggests the existence of fiber / specific intrinsic factors and / or molecular mechanisms that predispose them to increased generation and clonal expansion followed by the detrimental effects of mitochondrial DNA deletions. Our K320E-Twinkleskm mouse represents a valuable model to delineate these putative factors and mechanisms, and further explore the pathogenesis of CPEO.
Supplementary Material
Acknowledgments
The authors thank S.J. Burden (Helen L. and Martin S. Kimmel Center for Biology and Medicine at the Skirball Institute of Biomolecular Medicine, New York University Medical School, New York) for generously donating MLC1f mice. The anti-MyHC IIA (SC-71), MyHC IIB (BF-F3), and MyHC I (BA-D5) antibodies developed by Schiaffino, anti-MHCemb (F1.652), and MyHC-eoms (4A6) developed by Blau, H.M., were obtained from Developmental Studies Hybridoma Bank, created by NICHD of the NIH and maintained at the University of IOWA, Department of Biology, Iowa, IA 52242, USA.
Declarations
Ethics approval and consent to participate.
All procedures and experimentation with mice were performed according to protocols approved by the local authority (LANUV, Landesamt für Natur, Umwelt und Verbraucherschutz NRW, approval number: 2013-A165).
S.K. was Supported by Deutscher Akademischer Austauschdienst (DAAD). R.J.W. was supported by Deutsche Forschungsgemeinschaft (DFG, German Research Fundation) – SFB1218 – Projektnummer 269925409 and Cologne Excellence cluster on Cellular stress responses in Aging associated diseases – CECAD. R.R.O. was supported by CECAD.
S.K. and R.R.O. performed experiments, analyzed the data in Figures 123456–7, and wrote the first manuscript draft. M.H.J.W. performed isolation of EOM and lavetor palperae muscles and reviewed the draft manuscript. P.Z. and A.S. performed image analysis which formed the core results reported in Figure 3E. O.R.B. generated K320E-Twinkleskm mouse model, organized mouse cohorts, breedings, and reviewed and edited the manuscript. T.P. reviewed and edited the final manuscript. D.P.M. performed mtDNA analysis, performed image analysis, generated figures, and reviewed the manuscript. R.J.W. conceived the study, obtained funding, and edited the final manuscript.
Disclosure: R.R. Oexner, None; D. Pla-Martín, None; T. Paß, None; M.H.J. Wiesen, None; P. Zentis, None; A. Schauss, None; O.R. Baris, None; S. Kimoloi, None; R. J. Wiesner, None
References
- 1. Carry MR, Ringel SP, Starcevich JM. Mitochondrial morphometrics of histochemically identified human extraocular muscle fibers. Anat Rec. 1986; 214(1): 8–16. [DOI] [PubMed] [Google Scholar]
- 2. Wooten GF, Reis DJ.. Blood flow in extraocular muscle of cat. Arch Neurol. 1972; 26(4): 350–352. [DOI] [PubMed] [Google Scholar]
- 3. Porter JD, Karathanasis P.. Extraocular muscle in merosin-deficient muscular dystrophy: cation homeostasis is maintained but is not mechanistic in muscle sparing. Cell Tissue Res. 1998; 292(3): 495–501. [DOI] [PubMed] [Google Scholar]
- 4. Spencer RF, Porter JD.. Biological organization of the extraocular muscles. Prog Brain Res. 2006; 151: 43–80. [DOI] [PubMed] [Google Scholar]
- 5. Wasicky R, Ziya-Ghazvini F, Blumer R, Lukas JR, Mayr R. Muscle fiber types of human extraocular muscles: a histochemical and immunohistochemical study. Invest Ophthalmol Vis Sci. 2000; 41(5): 980–990. [PubMed] [Google Scholar]
- 6. Schiaffino S, Reggiani C.. Fiber types in mammalian skeletal muscles. Physiol Rev. 2011; 91(4): 1447–1531. [DOI] [PubMed] [Google Scholar]
- 7. McBride HM, Neuspiel M, Wasiak S. Mitochondria: more than just a powerhouse. Current biology: CB. 2006; 16(14): R551–R560. [DOI] [PubMed] [Google Scholar]
- 8. Spinelli JB, Haigis MC.. The multifaceted contributions of mitochondria to cellular metabolism. Nat Cell Biol. 2018; 20(7): 745–754. [DOI] [PMC free article] [PubMed] [Google Scholar]
- 9. Larsson NG. Somatic mitochondrial DNA mutations in mammalian aging. Annu Rev Biochem. 2010; 79: 683–706. [DOI] [PubMed] [Google Scholar]
- 10. Shoubridge EA, Karpati G, Hastings KE. Deletion mutants are functionally dominant over wild-type mitochondrial genomes in skeletal muscle fiber segments in mitochondrial disease. Cell. 1990; 62(1): 43–49. [DOI] [PubMed] [Google Scholar]
- 11. Taylor RW, Turnbull DM.. Mitochondrial DNA mutations in human disease. Nat Rev Genet. 2005; 6(5): 389–402. [DOI] [PMC free article] [PubMed] [Google Scholar]
- 12. Greaves LC, Yu-Wai-Man P, Blakely EL, et al.. Mitochondrial DNA defects and selective extraocular muscle involvement in CPEO. Invest Ophthalmol Vis Sci. 2010; 51(7): 3340–3346. [DOI] [PMC free article] [PubMed] [Google Scholar]
- 13. Yu-Wai-Man P, Lai-Cheong J, Borthwick GM, et al.. Somatic mitochondrial DNA deletions accumulate to high levels in aging human extraocular muscles. Invest Ophthalmol Vis Sci. 2010; 51(7): 3347–3353. [DOI] [PMC free article] [PubMed] [Google Scholar]
- 14. Baris OR, Ederer S, Neuhaus JF, et al.. Mosaic deficiency in mitochondrial oxidative metabolism promotes cardiac arrhythmia during aging. Cell Metab. 2015; 21(5): 667–677. [DOI] [PubMed] [Google Scholar]
- 15. Bothe GW, Haspel JA, Smith CL, Wiener HH, Burden SJ. Selective expression of Cre recombinase in skeletal muscle fibers. Genesis. 2000; 26(2): 165–166. [PubMed] [Google Scholar]
- 16. Ross JM. Visualization of mitochondrial respiratory function using cytochrome c oxidase/succinate dehydrogenase (COX/SDH) double-labeling histochemistry. J Vis Exp. 2011;57: e3266. [DOI] [PMC free article] [PubMed] [Google Scholar]
- 17. Tanhauser SM, Laipis PJ.. Multiple deletions are detectable in mitochondrial DNA of aging mice. J Biol Chem. 1995; 270(42): 24769–24775. [DOI] [PubMed] [Google Scholar]
- 18. Neuhaus JF, Baris OR, Hess S, et al.. Catecholamine metabolism drives generation of mitochondrial DNA deletions in dopaminergic neurons. Brain. 2014; 137(Pt 2): 354–365. [DOI] [PubMed] [Google Scholar]
- 19. Schindelin J, Arganda-Carreras I, Frise E, et al.. Fiji: an open-source platform for biological-image analysis. Nat Methods. 2012; 9(7): 676–682. [DOI] [PMC free article] [PubMed] [Google Scholar]
- 20. Arganda-Carreras I, Sorzano COS, Marabini R, Carazo JM, Ortiz-de-Solorzano C, Kybic J. Consistent and Elastic Registration of Histological Sections Using Vector-Spline Regularization 2006; Berlin, Heidelberg. [Google Scholar]
- 21. Kamentsky L, Jones TR, Fraser A, et al.. Improved structure, function and compatibility for CellProfiler: modular high-throughput image analysis software. Bioinformatics. 2011; 27(8): 1179–1180. [DOI] [PMC free article] [PubMed] [Google Scholar]
- 22. Jones TR, Kang IH, Wheeler DB, et al.. CellProfiler Analyst: data exploration and analysis software for complex image-based screens. BMC Bioinformatics. 2008; 9: 482. [DOI] [PMC free article] [PubMed] [Google Scholar]
- 23. Remington LA. Clinical anatomy and physiology of the visual system. 3rd ed. Louis: St. Elsevier/Butterworth-Heinemann; 2012. [Google Scholar]
- 24. Treuting PM, Dintzis SM, Frevert CW, Liggitt D, Montine KS. Comparative anatomy and histology : a mouse and human atlas. 1st ed. London: Elsevier; 2012. [Google Scholar]
- 25. Spencer R, Porter J, eds. Structural organization of the extraocular muscles. New York: Elsevier; 1988. JA B-E, ed. Reviews in oculomotor research; No. 2. [PubMed] [Google Scholar]
- 26. Wiesen MH, Bogdanovich S, Agarkova I, Perriard JC, Khurana TS. Identification and characterization of layer-specific differences in extraocular muscle m-bands. Invest Ophthalmol Vis Sci. 2007; 48(3): 1119–1127. [DOI] [PubMed] [Google Scholar]
- 27. Budak MT, Bogdanovich S, Wiesen MH, Lozynska O, Khurana TS, Rubinstein NA. Layer-specific differences of gene expression in extraocular muscles identified by laser-capture microscopy. Physiol Genomics. 2004; 20(1): 55–65. [DOI] [PubMed] [Google Scholar]
- 28. Herbst A, Pak JW, McKenzie D, Bua E, Bassiouni M, Aiken JM. Accumulation of mitochondrial DNA deletion mutations in aged muscle fibers: evidence for a causal role in muscle fiber loss. J Gerontol A Biol Sci Med Sci. 2007; 62(3): 235–245. [DOI] [PMC free article] [PubMed] [Google Scholar]
- 29. Herbst A, Wanagat J, Cheema N, Widjaja K, McKenzie D, Aiken JM. Latent mitochondrial DNA deletion mutations drive muscle fiber loss at old age. Aging Cell. 2016; 15(6): 1132–1139. [DOI] [PMC free article] [PubMed] [Google Scholar]
- 30. Koerner F, Schlote W. Chronic progressive external ophthalmoplegia: association with retinal pigmentary changes and evidence in favor of ocular myopathy. Arch Ophthalmol. 1972; 88(2): 155–166. [DOI] [PubMed] [Google Scholar]
- 31. Briggs MM, Schachat F.. The superfast extraocular myosin (MYH13) is localized to the innervation zone in both the global and orbital layers of rabbit extraocular muscle. J Exp Biol. 2002; 205(Pt 20): 3133–3142. [DOI] [PubMed] [Google Scholar]
- 32. Caballero PE, Candela MS, Alvarez CI, Tejerina AA. Chronic progressive external ophthalmoplegia: a report of 6 cases and a review of the literature. The neurologist. 2007; 13(1): 33–36. [DOI] [PubMed] [Google Scholar]
- 33. Petty RK, Harding AE, Morgan-Hughes JA. The clinical features of mitochondrial myopathy. Brain. 1986; 109(Pt 5): 915–938. [DOI] [PubMed] [Google Scholar]
- 34. Wanagat J, Cao Z, Pathare P, Aiken JM. Mitochondrial DNA deletion mutations colocalize with segmental electron transport system abnormalities, muscle fiber atrophy, fiber splitting, and oxidative damage in sarcopenia. FASEB J. 2001; 15(2): 322–332. [DOI] [PubMed] [Google Scholar]
- 35. Lopez ME, Van Zeeland NL, Dahl DB, Weindruch R, Aiken JM. Cellular phenotypes of age-associated skeletal muscle mitochondrial abnormalities in rhesus monkeys. Mutat Res. 2000; 452(1): 123–138. [DOI] [PubMed] [Google Scholar]
- 36. Bua EA, McKiernan SH, Wanagat J, McKenzie D, Aiken JM. Mitochondrial abnormalities are more frequent in muscles undergoing sarcopenia. J Appl Physiol (1985). 2002; 92(6): 2617–2624. [DOI] [PubMed] [Google Scholar]
- 37. Copeland WC, Ponamarev MV, Nguyen D, Kunkel TA, Longley MJ. Mutations in DNA polymerase gamma cause error prone DNA synthesis in human mitochondrial disorders. Acta Biochim Pol. 2003; 50(1): 155–167. [PubMed] [Google Scholar]
- 38. DeBalsi KL, Hoff KE, Copeland WC. Role of the mitochondrial DNA replication machinery in mitochondrial DNA mutagenesis, aging and age-related diseases. Ageing Res Rev. 2017; 33: 89–104. [DOI] [PMC free article] [PubMed] [Google Scholar]
- 39. Mishra P, Varuzhanyan G, Pham AH, Chan DC. Mitochondrial dynamics is a distinguishing feature of skeletal muscle fiber types and regulates organellar compartmentalization. Cell Metab. 2015; 22(6): 1033–1044. [DOI] [PMC free article] [PubMed] [Google Scholar]
- 40. Ono T, Isobe K, Nakada K, Hayashi JI. Human cells are protected from mitochondrial dysfunction by complementation of DNA products in fused mitochondria. Nature Genetics. 2001; 28(3): 272–275. [DOI] [PubMed] [Google Scholar]
- 41. Nakada K, Sato A, Hayashi J. Mitochondrial functional complementation in mitochondrial DNA-based diseases. IntJBiochemCell Biol. 2009; 41(10): 1907–1913. [DOI] [PubMed] [Google Scholar]
- 42. Chen H, Vermulst M, Wang YE, et al.. Mitochondrial fusion is required for mtDNA stability in skeletal muscle and tolerance of mtDNA mutations. Cell. 2010; 141(2): 280–289. [DOI] [PMC free article] [PubMed] [Google Scholar]
- 43. Khan NA, Nikkanen J, Yatsuga S, et al.. mTORC1 regulates mitochondrial integrated stress response and mitochondrial myopathy progression. Cell Metabolism. 2017; 26(2): 419–428.e415. [DOI] [PubMed] [Google Scholar]
- 44. Gilkerson RW, De Vries RL, Lebot P, et al.. Mitochondrial autophagy in cells with mtDNA mutations results from synergistic loss of transmembrane potential and mTORC1 inhibition. Hum Mol Genet. 2012; 21(5): 978–990. [DOI] [PMC free article] [PubMed] [Google Scholar]
- 45. Fratter C, Gorman GS, Stewart JD, et al.. The clinical, histochemical, and molecular spectrum of PEO1 (Twinkle)-linked adPEO. Neurology. 2010; 74(20): 1619–1626. [DOI] [PMC free article] [PubMed] [Google Scholar]
Associated Data
This section collects any data citations, data availability statements, or supplementary materials included in this article.