

Abstract
Purpose
To evaluate the in vivo treatment efficacy and biocompatibility of a biodegradable aflibercept-loaded microsphere-hydrogel drug delivery system (DDS) in a laser-induced choroidal neovascularization (CNV) rat model.
Methods
Two weeks after CNV induction, animals were randomly assigned into four experimental groups: (1) no treatment, (2) single intravitreal (IVT) injection of blank DDS, (3) bimonthly bolus IVT aflibercept injections, and (4) single IVT injection of aflibercept-DDS. CNV lesion sizes were monitored longitudinally using fluorescence angiography and multi-Otsu thresholding for 6 months. For safety and biocompatibility assessment, an additional three non-CNV animals received a blank DDS injection. Electroretinogram, intraocular pressure, and clinical ophthalmoscopic examinations were performed.
Results
The average lesion areas at week 0 (treatment intervention) were (1) 8693 ± 628 µm2 for no treatment, (2) 8261 ± 709 µm2 for blank DDS, (3) 10,368 ± 885 µm2 for bolus, and (4) 10,306 ± 1212 µm2 for aflibercept-DDS. For the nontreated groups, CNV lesion size increased by week 2 and remained increased throughout the study. The treated groups exhibited CNV size reduction after week 2 and remained for 6 months. At week 22, the average percent changes in CNV lesion area were +38.87% ± 7.08%, +34.19% ± 9.93%, –25.95% ± 3.51%, and –32.69% ± 5.40% for the above corresponding groups. No signs of chronic inflammation and other ocular abnormalities were found.
Conclusions
The aflibercept-DDS was effective in treating CNV lesions for 6 months and is safe, well tolerated, and biocompatible.
Translational Relevance
The proposed DDS is a promising system to reduce IVT injection frequency for anti–vascular endothelial growth factor treatment.
Keywords: sustained release, drug delivery system, anti-VEGF treatment, laser-induced CNV, in vivo safety
Introduction
Since the identification of vascular endothelial growth factors (VEGFs) and their key role in ocular neovascularization at the end of last century,1,2 anti-VEGF therapy has been developed and proved to be effective for treatment of neovascular eye diseases such as wet age-related macular degeneration (AMD), diabetic macular edema, and proliferative diabetic retinopathy. Several pivotal clinical trials, including Anti-vascular endothelial growth factor Antibody for the Treatment of Predominantly Classic Choroidal Neovascularization in AMD (ANCHOR) and Minimally Classic/Occult Trial of the Anti-VEGF Antibody Ranibizumab in the Treatment of Neovascular AMD (MARINA), demonstrated significant improvement in visual outcomes for all types of choroidal neovascularization (CNV) in wet AMD.3,4 Consequently, these studies prompted the anti-VEGF therapy to become the current standard of care for wet AMD and other vascular diseases. Four anti-VEGF therapeutics have been approved by the US Food and Drug Administration for treatment of wet AMD, including pegaptanib (Macugen; OSI Pharmaceuticals, Melville, NY, USA), ranibizumab (Lucentis; Genentech, South San Francisco, CA, USA), aflibercept (Eylea; Regeneron, Tarrytown, NY, USA), and brolucizumab (Beovu; Novartis, East Hanover, NJ, USA). Another anti-VEGF therapeutic, bevacizumab (Avastin; Genentech), is used as off-label drug.5
Despite its great success in the treatment of wet AMD, the current anti-VEGF regimen requires monthly/bimonthly intravitreal (IVT) injections of anti-VEGF drugs due to their fast clearance and short half-lives.6,7 These repeated IVT injections are associated with increased risks of complications, including endophthalmitis, retinal detachment, intravitreal hemorrhage, and cataract.8 In addition, pharmacokinetic profiles of drugs are nonoptimal, since the peak level of drug after bolus injections may cause potential toxic effect while the quick clearance later may render subtherapeutic concentration.9 Finally, the significant socioeconomic burden upon patients, family, and health care systems cannot be ignored. Therefore, there is a great demand in developing a drug delivery system (DDS) for anti-VEGF that will result in a controlled and extended delivery and reduction in frequency of IVT injections.
Recent years have seen a variety of DDSs developed for controlled and extended delivery of anti-VEGF drugs in the form of ocular implants, cell-based systems, injectable nano-/microparticles, injectable hydrogels, and composite systems.7 Among the aforementioned systems, the composite systems that encapsulate injectable nano-/microparticles within injectable hydrogels offer a great potential due to their applicability as a minimally invasive localized delivery platform.10,11 Evidences have shown that encapsulation of drug-loaded microspheres into hydrogel's network would minimize the characteristic initial burst release and extend drug release for a longer time.10,11 Other issues of injectable particulate systems, including unconstrained migration associated with glaucoma and ocular inflammation, as well as fast clearance by phagocytes, can also be overcome.12 On the other hand, encapsulating anti-VEGF drug directly into injectable hydrogels usually resulted in a rapid release time of approximately 1 month due to hydrogels’ inherent high water content.13 Furthermore, the ability of controlling the amount and type of particles loaded within hydrogels can enhance the drug delivery potential.
A composite ocular DDS consisting of poly(lactic-co-glycolic acid) (PLGA) microspheres suspended within a biodegradable thermoresponsive poly(ethylene glycol)-co-(L-lactic-acid) diacrylate/N-isopropylacrylamide (PEG-PLLA-DA/NIPAAm) hydrogel has been developed by our laboratory recently.11,14 Characterization studies showed that the hydrogel is thermoresponsive and can be injected through a 28-gauge needle at room temperature. After injection, the body temperature triggers the hydrogel to solidify into a solid-like structure to localize microspheres.14 It was shown that this DDS is capable of releasing bioactive anti-VEGF drugs such as ranibizumab and aflibercept for 6 months with good biocompatibility in vitro.11 More important, the hydrolytically biodegradable cross-linker PEG-PLLA-DA enabled in vitro degradation of hydrogel structure in a delayed manner. This is more compatible with a multiple injection regimen as well as enhanced drug release compared to our previous nondegradable PEG-DA/NIPAAm hydrogel.
The purpose of this study was to demonstrate the in vivo treatment efficacy of our biodegradable aflibercept-loaded microsphere-hydrogel DDS in a laser-induced CNV rat model. A multi-Otsu thresholding (MOT) method was used to quantify lesion size changes based on late-phase fluorescein angiography (FA) images. In addition, the preliminary in vivo biocompatibility and degradability of DDS were investigated. It is hypothesized that controlled and extended aflibercept delivery from our degradable DDS will render as effective treatment as conventional bimonthly bolus IVT injections for CNV with a good biocompatibility.
Materials and Methods
Fabrication of Microsphere-Hydrogel Drug Delivery System
Aflibercept (40 mg/mL) was generously provided by Dr. William F. Mieler at University of Illinois at Chicago. All subsequent chemicals were purchased from Sigma-Aldrich (St. Louis, MO, USA). Blank/aflibercept-loaded PLGA 75:25 microspheres were fabricated using a modified double-emulsion, solvent evaporation technique described in detail elsewhere.10,15 Briefly, the primary water-in-oil emulsion (w1/o) was created by vortex; this first emulsion was immediately added to the outer aqueous phase (w2) containing polyvinyl alcohol to create a (water-in-oil)-in-water (w1/o/w2) double emulsion by vortex. Several excipients were used to stabilize and protect the aflibercept during fabrication, storage, and release: bovine serum albumin, PEG (molecular weight 8 kDa), and sucrose were added in the inner aqueous (w1) phase; Mg(OH)2 was added as a buffering salt in the oil phase (o). After solvent evaporation, microspheres were harvested by centrifugation, washed three times in deionized (DI) water, lyophilized to a dry powder, and stored at 4°C.
Degradable thermoresponsive hydrogels composed of PEG-PLLA-DA and NIPAAm were synthesized by free radical polymerization method described in detail elsewhere.16 Briefly, hydrogels precursors were prepared by dissolving 2 mM PEG-PLLA-DA, 350 mM NIPAAm, 50 mM N-tert-butylacrylamide, and 13 mM ammonium persulfate in pH 7.4 1 × phosphate-buffered saline. Under sterile conditions, the hydrogel precursor and initiator were filtered through a sterile 13-mm syringe filter (0.22 µm; Fisherbrand, Thermo Fisher Scientific, Waltham, MA, USA). Blank/aflibercept-loaded microspheres were placed under UV light for 30 minutes before being suspended in hydrogel precursor at a 20-mg/mL concentration. Polymerization of the hydrogel was initiated by mixing 168 mM N,N,N′,N′-tetramethylethylenediamine (pH adjusted to 7.4 with hydrochloric acid) into the hydrogel precursor; the reaction was allowed to proceed on ice for 30 minutes to form microsphere-hydrogel DDS. After polymerization, DDSs were collected, washed three times in sterile DI water, and loaded into a 0.5-cc U-100 insulin syringe (28-gauge ½-in.; Becton Dickinson and Co., Franklin Lakes, NJ, USA). Prepared DDSs were stored at 4°C before injection.
Animal Preparation
All animal procedures were in accordance with protocols approved by the Institutional Animal Care and Use Committee at the Illinois Institute of Technology and with the principles embodied in the statement on the use of animals in ophthalmic and vision research adopted by the Association for Research in Vision and Ophthalmology. Long-Evans male rats (250–200 g) were purchased from ENVIGO Laboratories (Indianapolis, IN, USA). Animals were anesthetized using 80 mg/kg ketamine hydrochloride (Henry Schein Animal Health, Dublin, OH, USA) and 10 mg/kg xylazine (Henry Schein Animal Health) through intraperitoneal injection. Proparacaine drops (Bausch and Lomb, Rochester, NY, USA) were used to anesthetize the corneas, followed by both phenylephrine (Bausch and Lomb) and atropine drops (Bausch and Lomb) to dilate the pupils. Heart rate and blood oxygen saturation were monitored with a pulse oximeter (8500 AV; Nonin Medical, Inc., Plymouth, MN, USA). Animals were placed on a heated stage to maintain a core body temperature of 37.5°C during any procedures and examinations.
In Vivo Treatment Efficacy Evaluation
A laser-induced rat model of CNV was used to evaluate in vivo treatment efficacy of the DDS due to its simplicity, inexpensiveness, and consistent CNV formation rate (∼80%).17 FA was used to monitor CNV lesion growth longitudinally for different treatment groups. Histology was done at the end point of the study to examine the lesions after treatment.
Laser-Induced Model of CNV
Laser photocoagulation was performed using an Argon-green laser (AKC-8000; NIDEK, Inc., Fremont, CA, USA) attached to a slit lamp with a laser power of 550 mW, duration of 100 ms, and spot diameter of 50 µm. A 90-diopter lens was used to view the posterior pole of the eye and focus the laser beam. Five to six lesions per eye were induced two- to three-disc diameters from, and centered on, the optic disc. Laser-induced disruption of Bruch's membrane was identified by the appearance of a bubble at the site of photocoagulation. Only laser spots that resulted in a bubble without hemorrhage were included in the study.
Experimental Design and Fluorescein Angiography
Twelve Long-Evans rats in total, after checking for ocular integrity and laser photocoagulation, were randomly assigned to four treatment groups as follows: (1) no-treatment group, which did not receive any treatment or injection after laser induction; (2) blank DDS group, which received a single IVT injection of drug-free DDS; (3) bolus aflibercept group, which received an IVT bolus injection of aflibercept (200 µg of drug per injection) every 2 months; and (4) aflibercept-DDS group, which received a single IVT injection of aflibercept-loaded DDS (1 µg of drug). All IVT injections were 5 µL and performed 2 weeks after laser induction through a 28-gauge needle.
A confocal scanning laser ophthalmoscope (cSLO) system (Heidelberg Retina Angiography [HRA]; Heidelberg Engineering, Heidelberg, Germany) was used to image the retina. Late-phase FA images of CNV lesions were captured at 15 minutes after intravenous (IV) injection of 0.1 mL of 10 wt% fluorescein dye (Sigma-Aldrich) via tail vein. Images were acquired prior to CNV induction and at predetermined time points postinduction as shown in Figure 1, which is a detailed schematic for experimental design and timeline for CNV treatment efficacy studies.
Figure 1.
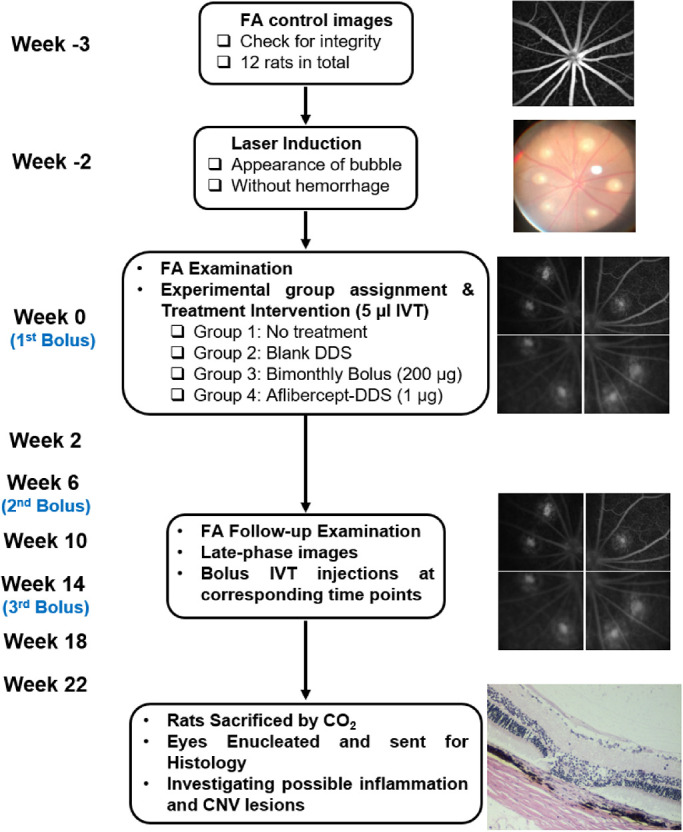
Schematic experimental design and timeline for CNV treatment efficacy evaluation for aflibercept-loaded DDS.
CNV Lesion Quantification
CNV lesion areas were objectively quantified using late-phase FA images and MOT, a technique developed and described in detail elsewhere.18 The use of late-phase (15-minute) images allows time for the fluorescein to clear the normal vasculature, preventing vessel hyperfluorescence from interfering with area measurement. All FA images were analyzed by investigators who were masked to the treatment of each lesion. To quantify the lesion, each lesion was selected and isolated using ImageJ (Rasband, WS; ImageJ; National Institutes of Health, Bethesda, MD, USA) software. The MOT plugin for ImageJ was set to three levels, or “regions,” defined as background, diffuse leakage (nonhyperfluorescent leakage), and CNV lesion (hyperfluorescent leakage). The CNV lesion was then carefully outlined and converted into a binary image. Number of pixels within the lesion was counted and converted to area (µm2) by a previously determined conversion factor of 3.3 µm2 per pixel.19 CNV lesion areas at week 0 (i.e., the day of IVT injection) were taken as 0% in area change, and changes thereafter were calculated accordingly.
Histology for CNV Lesions
Serial histologic sections were made of all lesions from the no-treatment, blank DDS, bolus aflibercept, and aflibercept-DDS groups at the end of study (after week 22). Animals were sacrificed by condense CO2 chamber. Eyes were enucleated, fixed in Davidson's solution, and embedded in paraffin. Serial sections of 5 µm width were made every 50 µm through the target lesions and stained with hematoxylin and eosin (H&E). The extent of fibrovascular growth of each lesion from different experimental groups was determined by measuring the relative thickness across the lesion.20 Relative thickness is defined as the ratio of the thickness from the bottom of the pigmented choroid to the top of the CNV lesion to the thickness of adjacent, normal choroid. The lesions from the treated groups were often observed to have little fibrovascular growth. The vitreous were also investigated for any possible inflammatory responses.
DDS In Vivo Biocompatibility
Three additional Long-Evans (non-CVN) rats were included in the study and received 5 µL sterile blank DDS (drug-free) IVT injections into their both eyes. Electroretinography (ERG) testing was performed before injection (control baseline) and at 2, 4, 8, 16, and 24 weeks after IVT injection to evaluate DDSs’ effects on retinal functions. Intraocular pressure (IOP) was monitored before each ERG examination throughout the study. Imaging examinations using direct slit-lamp ophthalmoscope and cSLO infrared reflectance (IR) module were conducted before injection, immediately after injection, and 3 and 6 months postinjection. Finally, histopathology was performed at the end of study.
ERG
The ERG is a noninvasive measurement that represents the overall electrophysiologic activity of the retina in response to a stimulus flash and is routinely used in biocompatibility studies.21–23 Any alterations in terms of maximal response or sensitivity of a- and b-waves would indicate changes of retinal functions.24–26
All ERG measurements were performed under scotopic conditions with animals dark-adapted for more than 2 hours prior to the experiment. In response to the full-field Ganzfeld stimulation, ERG signals were recorded with a gold wire electrode placed on the cornea. The reference and ground electrodes were platinum subdermal needle electrodes inserted into the cheek and nape, respectively. The ERGs were elicited with full-field Ganzfeld stimulation with a flash intensity of 311 sc⋅cd⋅s⋅m−2 and flash duration of 2 ms. The ERGs were amplified (1000×), filtered (low pass, 3 kHz), digitized (10 kHz), and stored on a computer. A series of log unit neutral density filters were used to attenuate the flash to achieve different light intensities. The a-wave and b-wave intensity responses were recorded by presenting series of single flashes with increasing intensity, and maximum a-wave and b-wave amplitudes were recorded in response to single saturated flashes of light (311 sc⋅cd⋅s⋅m−2). Eyes were dark-adapted for at least 2 minutes between two separate flashes.
IOP
Prior to each ERG examinations, IOP of both eyes of animals was measured using an applanation tonometer (TONO-PEN XL; Medtronic, Minneapolis, MN, USA). The tono-pen was calibrated each time before using according to the manufacturer's manual. Three measurements per eye were recorded and averaged.
Slit-Lamp Ophthalmoscope and cSLO Examinations
At predetermined time points, a direct slit-lamp ophthalmoscope was used to examine any abnormal changes and ocular inflammatory responses in the anterior and posterior segments throughout the study with a 90D lens (Bausch and Lomb). Appearance of injected DDS was viewed using a cSLO IR module for characterization of in vivo degradation.
Histopathology
Serial histopathologic sections were made of all blank DDS-injected eyes at the end of study. Animals were sacrificed by condensed CO2 chamber. Eyes were enucleated, fixed in Davidson's solution, and embedded in paraffin. Serial sections of 5 µm width were made every 100 µm through the whole eyes and stained with H&E. Digital photographs from the histologic slides were taken under bright-field microscope and investigated for possible inflammatory responses and adverse events.
Statistical Analysis
All values were reported as mean ± standard error, and in all graphs, error bars represented standard errors. For CNV lesion analysis, each lesion was considered independent and monitored throughout the study. Repeated-measures two-way analysis of variance (ANOVA) followed by Holm-Sidak multiple comparison test was performed for comparison of CNV lesion across both treatment groups and time points. And one-way ANOVA followed by Holm-Sidak test was performed for comparison of histologic CNV relative thickness. All the ERG parameters and IOP values for follow-up examinations were compared to control/baseline values using a paired Student's t-test. A P value less than 0.05 was determined to be significantly different.
Results
The blank and aflibercept-loaded PLGA microspheres were successfully formed using our modified double-emulsion, solvent evaporation technique as shown in Figure 2a. The average size of microspheres was 8.2 ± 2.2 µm by measuring under a microscope, which was consistent with our previous studies (7.5 ± 0.4 µm).14 The thermoresponsive PEG-PLLA-DA/NIPAAm hydrogel was translucent and liquid-like without microspheres inside (Fig. 2b). Although hydrogel turned opaque due to encapsulation of microspheres, the microsphere-hydrogel DDS remained injectable through a 28-gauge needle under room temperature (Fig. 2c).
Figure 2.

Fabrication of microsphere-hydrogel DDS. (a) Aflibercept-loaded PLGA microspheres. Scale bar: 10 µm in length. (b) Blank thermoresponsive PEG-PLLA-DA/NIPAAm hydrogel under room temperature. (c) Drug-loaded microsphere-hydrogel DDS loaded into a syringe and injected through a 28-gauge needle under room temperature.
CNV Lesion Quantification
A total of 108 CNV lesions were included in the study: 25 lesions in no-treatment group, 26 lesions in blank DDS group, 28 lesions in the bolus aflibercept group, and 29 lesions in aflibercept-DDS group. Figure 3 shows representative late-phase FA images of hyperfluorescent CNV lesions from the four experimental groups at week 0 (i.e., treatment intervention day) and week 22, respectively. Qualitatively, the CNV lesions in groups receiving either bimonthly bolus or single aflibercept-DDS injection were smaller in size by week 22 compared to week 0. However, CNV lesions in no-treatment and blank DDS groups remained unchanged, and some even became larger in size by week 22.
Figure 3.

Representative late-phase FA images of CNV lesions from the four experimental groups at Week 0, Week 10, and Week 22, respectively.
The MOT technique was able to effectively and objectively quantify CNV lesion area using late-phase FA images. At week 0, the average CNV lesion areas for no-treatment, blank DDS, bolus aflibercept, and aflibercept-DDS groups were measured as 8693 ± 628 µm2, 8261 ± 709 µm2, 10,368 ± 885 µm2, and 10,306 ± 1212 µm2, respectively. No significant difference in CNV lesion area was observed among the four experimental groups at week 0 (P > 0.6). Using week 0 as the baseline CNV size, CNV lesion area changes were quantified through week 2 to week 22 as shown in Figure 4. In both no-treatment and blank DDS groups, CNV lesion size increased by week 2 and remained increased throughout the studies. The bolus aflibercept and aflibercept-DDS groups exhibited a reduction in CNV lesion size after week 2, and this reduction remained until end point. At week 22, the average percent changes in CNV lesion area were +38.87% ± 7.08%, +34.19% ± 9.93%, –25.95% ± 3.51%, and –32.69% ± 5.40% for no-treatment, blank DDS, bolus aflibercept, and aflibercept-DDS groups, respectively. No significant difference was observed between no-treatment and blank DDS groups at any time point throughout the study. Significant reduction of CNV lesions was found in the bolus aflibercept group compared to both no-treatment and blank DDS groups (P < 0.001) throughout the study. In addition, CNV lesion area in the aflibercept-DDS group decreased significantly throughout the study compared to no-treatment and blank DDS groups (P < 0.001). Although reduction of CNV size in the aflibercept-DDS group was usually greater than that in the bolus aflibercept group, they were not significantly different throughout the study. However, it is worth noting that the single IVT injection of aflibercept-DDS (1 µg drug in a 5-µL DDS injection) is as effective as bimonthly IVT bolus aflibercept injections (200 µg drug/5 µL per injection and total of three injections received) to inhibit CNV in a laser-induced rodent model. Considering the lower overall dose with one IVT injection and equal treatment efficacy, our aflibercept-DDS is advantageous over the multiple injections of bolus for clinical management of CNV.
Figure 4.

Boxplot of percent changes in CNV lesion area relative to week 0 (taken as 0%) for the four experimental groups: (1) no treatment (dark red), (2) blank DDS (orange), (3) bolus aflibercept (yellow-green), and (4) aflibercept-DDS (green) at corresponding time points. Asterisk indicates statistically significant differences between the two groups using Holm-Sidak multiple comparison test after repeated-measures two-way ANOVA (P < 0.05). Note: one rat in the aflibercept-DDS group died after anesthesia at week 14; the number of lesions reduced from 29 to 19 thereafter.
Histopathology for CNV Lesions
Histopathology of CNV lesions confirmed that extent of fibrovascular proliferation (i.e., choroid relative thickness) for the four experimental groups exhibited a similar pattern to that of the CNV lesion area measured by MOT (Fig. 4). Figures 5a–d show representative images of CNV lesions from the four experimental groups, respectively. Substantial fibrovascular proliferation (larger relative thickness) was observed in the no-treatment and blank DDS groups, while lesions from the two treated groups exhibited smaller fibrovascular growth qualitatively. After quantification as shown in Figure 5e, relative thickness was reported as 3.69 ± 0.76, 3.05 ± 0.46, 2.03 ± 0.75, and 2.01 ± 0.74 for no-treatment, blank DDS, bolus aflibercept, and aflibercept-DDS groups, respectively. Significantly smaller relative thickness was found in both two treated groups compared to the no-treatment group (P < 0.01). However, no significant difference between the two treated groups was observed. It is worth noting that although relative thickness in the blank DDS group was bigger than that in the two treated groups, the difference was not significant (P > 0.05). In addition, no obvious inflammatory responses were observed in the vitreous or anterior segment for all the eyes.
Figure 5.

Histology analysis of CNV lesions. Representative images of CNV lesions from (a) no-treatment, (b) blank DDS, (c) bolus aflibercept, and (d) aflibercept-DDS groups. (e) Quantification of CNV lesion relative thickness for the four experimental groups, where the asterisk indicates statistically significant differences between the two groups using Holm-Sidak multiple comparison test after ANOVA (P < 0.05). Note: the relative thickness was measured by taking the ratio of the thickness from the bottom of the pigmented choroid to the top of the CNV lesion (black arrow in a) to the thickness of adjacent, normal choroid (white arrow in a).
ERG
The outer retinal function was evaluated by the a-wave, which reflects the activity of the photoreceptors.24,25 The single-flash maximum a-wave amplitudes and intensity response of the a-wave were determined before and after injection of the DDS at predetermined time points. Figure 6a shows the maximum a-wave amplitudes in response to a single saturated flash throughout the study. Significant decrease in amplitudes was observed at week 2 (28.92%), week 4 (29.87%), and week 8 (27.07%) after IVT injections (P < 0.05). This decrease in maximum a-wave amplitudes was not significantly different from preinjection values at week 16 and thereafter. The intensity-response function with Naka-Rushton analysis for the a-wave, which examines the sensitivity of the response to a given intensity range, is shown in Figure 6b. No significant changes in a-wave sensitivity (i.e., half-saturation intensity) were observed throughout the study compared to control (5.01 ± 2.59 sc⋅cd⋅s⋅m−2) (Table).
Figure 6.

ERG responses before and after IVT injection of blank DDS. (a) Maximum a-wave amplitudes in response to single bright flashes (intensity of 311 sc⋅cd⋅s⋅m−2). (b) Average a-wave intensity-response function. Flash intensities range from 0.311 to 311 sc⋅cd⋅s⋅m−2. Solid lines are results of the Naka-Rushton analysis. (c) Maximum b-wave amplitudes in response to single bright flashes (intensity of 311 sc⋅cd⋅s⋅m−2). (d) Average b-wave intensity-response function. Flash intensities range from 0.000311 to 0.311 sc⋅cd⋅s⋅m−2. Solid lines are results of the Naka-Rushton analysis. Amplitudes of intensity-response functions for a- and b-wave were normalized by their maximum response, respectively. Error bars represent standard error (n = 6). Asterisk indicates statistically significant difference compared to control (prior to IVT injection) (P < 0.05).
Table.
Summary of ERG Responses before and after IVT Injection of Blank DDS
| Maximum A-Wave | A-Wave Sensitivity | Maximum B-Wave | B-Wave Sensitivity | |
|---|---|---|---|---|
| Time | (µV) | (sc⋅cd⋅s⋅m−2) | (µV) | (sc⋅cd⋅s⋅m−2) |
| Control | 604.82 ± 110.15 | 5.01 ± 2.59 | 1113.93 ± 231.99 | 0.013 ± 0.001 |
| Week 2 | 429.93 ± 52.08a | 4.75 ± 2.06 | 876.63 ± 109.51 | 0.010 ± 0.001b |
| Week 4 | 424.15 ± 73.11a | 5.57 ± 1.62 | 931.72 ± 211.79 | 0.017 ± 0.002b |
| Week 8 | 441.08 ± 35.83a | 5.51 ± 2.24 | 983.89 ± 154.69 | 0.015 ± 0.002 |
| Week 16 | 459.56 ± 38.94 | 4.87 ± 1.38 | 1011.88 ± 91.18 | 0.014 ± 0.001 |
| Week 24 | 482.83 ± 100.52 | 4.83 ± 2.11 | 1086.43 ± 304.56 | 0.016 ± 0.004 |
Data presented as mean ± SEM (n = 6).
P < 0.05.
P < 0.01.
The inner retinal function was assessed by the single-flash maximum b-wave amplitudes and intensity-response function of b-wave.26 The b-wave amplitudes in response to a saturated single flash are shown in Figure 6c. Although there was an initial 21.30% decrease in b-wave amplitudes at week 2 after injection, this decrease was not significantly different from control (P > 0.1), and the maximum b-wave amplitudes continued to recover to baseline level at the end of study. The sensitivity values of the b-wave were determined by Naka-Rushton analysis of b-wave intensity-response function at corresponding time points (Fig. 6d). A significant increase (P < 0.01) and decrease (P < 0.01) of b-wave sensitivity were found at week 2 and week 4, compared to control, respectively. No significant changes in sensitivity were observed at subsequent weeks (P > 0.05). Table summarizes both maximum amplitudes and sensitivity for a-wave and b-wave throughout the study.
IOP
The IOP measurements were taken prior to and immediately after IVT injections and at every follow-up ERG exam throughout the course of study. Figure 7 shows the mean IOP measurements at each corresponding time point. The average baseline IOP was 24.17 ± 1.38 mm Hg, which is within normal range for rats (15–25 mm Hg).27 The IOP increased significantly to 28.50 ± 2.09 mmHg (P < 0.05) immediately after IVT injection of 5 µL DDS. The IOP then decreased but remained significantly higher (P < 0.05) than the baseline at week 2 and week 4 after IVT injection. Finally, the IOP returned to the baseline level at week 8 and was not significantly different from baseline for the rest of study.
Figure 7.
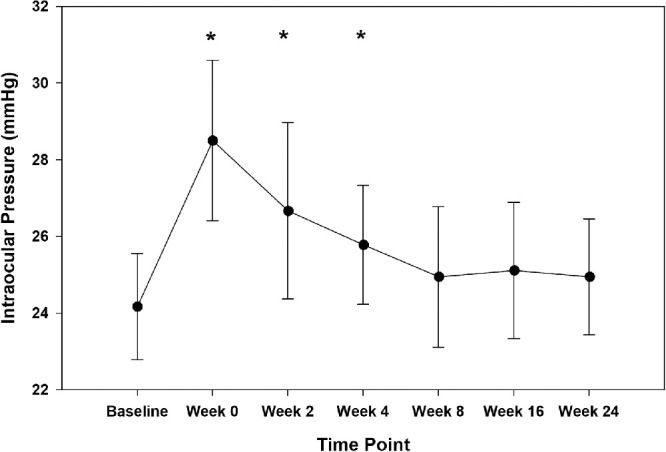
IOP measurements before and after IVT injections of blank DDS. Error bars represent standard error (n = 6). Asterisk indicates statistically significant difference compared to baseline (P < 0.05).
Slit-Lamp and cSLO Examinations
The microsphere-hydrogel DDS was successfully delivered into the vitreous humor by a 28-gauge insulin needle and can be viewed using a cSLO IR module (Fig. 8G). Most of the eyes showed no adverse events immediately after IVT injection of DDS (Figs. 8A, 8D), and only two of the six injected eyes showed mild conjunctival swelling and localized hemorrhage that completely resolved after 3 months of injection. The lens and cornea remained clear during the entire follow-up period (Figs. 8A–C), and no inflammatory responses or fundus abnormalities such as fundus lesions, retinal whitening, or retinal hemorrhage were found throughout the study (Figs. 8D–F). Signs of biodegradation of whole DDS were observed at 3 and 6 months after IVT injection, as shown in Figures 8G–I. The bulk of DDS became more and more transparent with time lapse. At 6 months after IVT injection, the size of the DDS became smaller and almost completely transparent under the cSLO IR module.
Figure 8.
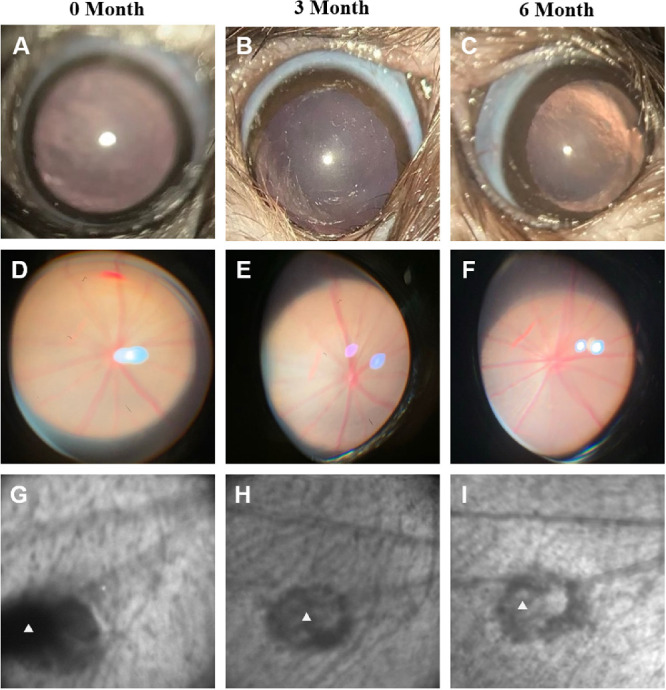
Representative slit-lamp and cSLO infrared examinations of eyes after DDS IVT injection. The first row shows slit-lamp photographs of the anterior chamber at 0, 3, and 6 months (A, B, and C) after DDS injection; the second row shows slit-lamp photographs of fundus at 0, 3, and 6 months (D, E, and F) after DDS injection; and the third row shows cSLO IR images of blank DDS (indicated by white triangles) at 0, 3, and 6 months (G, H, and I) after injection.
Histopathology for Biocompatibility
Ocular histopathology was performed 6 months after DDS IVT injection for non-CNV animals and is shown in Figure 9. No signs of chronic inflammatory responses or foreign body reactions, such as mononuclear/multinucleate giant cells infiltration and tissue fibrosis, were detected in both posterior and anterior segments of the eyes. Signs of retinal toxicity such as inner or outer retinal atrophy and folding were not detected. The iris and the anterior chamber angle showed no abnormalities or inflammation for all injected eyes.
Figure 9.
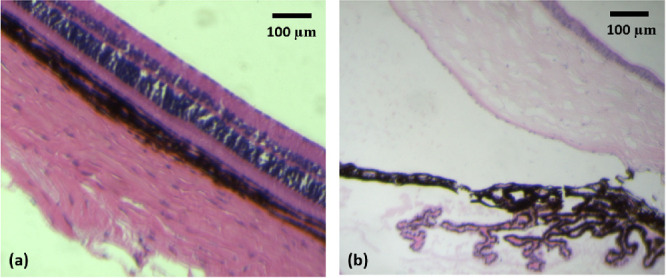
Representative end-point histopathology images of eyes after blank DDS IVT injection. (a) Bright-field microscopy of the retina 6 months after IVT injection of blank DDS. The ganglion cell layer is facing upward. (b) Bright-field microscopy of the anterior chamber 6 months after IVT injection of blank DDS. The iris tissue is facing upward.
Discussion
In this study, we have demonstrated that our aflibercept-DDS is as effective as, if not better than, the bimonthly aflibercept bolus injections in treating laser-induced CNV for 6 months. Our findings also demonstrate in vivo safety, tolerability, and biocompatibility of the microsphere-hydrogel DDS in the eyes of healthy Long-Evans rats for the entire 6 months after IVT delivery. Current results suggested that our DDS is advantageous over the current bimonthly bolus regimen in terms of less injections and less overall dosage, which is one single injection of 1 µg aflibercept in DDS compared to 200 µg drug in each bolus IVT injection, which accumulates to 600 µg of drug over 6 months in total.
In our previous study, treatment intervention was carried out immediately after laser photocoagulation.22 However, it was reported that CNV does not fully form until 2 weeks after laser, and the peak level of VEGF concentration in vitreous occurred after only 7 days of photocoagulation.17,28 Therefore, what the previous study investigated is mostly the preventive effect of DDS on CNVs instead of long-term therapeutic effects. To investigate long-term therapeutic effects, the bolus aflibercept and aflibercept-DDS injections were given 2 weeks after laser photocoagulation in the current study. CNV formations were confirmed by hyperfluorescence in late-phase FA images before treatment intervention. Although laser-induced CNV lesions were known to have some variability among individual animals,17 no significant differences in CNV lesion area were observed among different experimental groups before treatment intervention. This justifies using week 0 as baseline for comparisons. The significant decrease of CNV lesion area in bolus aflibercept and aflibercept-DDS groups compared to no-treatment and blank DDS groups (Fig. 4) throughout the study demonstrated the treatment effects of both bimonthly bolus and aflibercept-DDS on CNVs for 6 months. Despite no significant difference, an additional ∼7% decrease in CNV lesion area was found in animals receiving aflibercept-DDS (32.69% ± 5.40%) compared to animals receiving bimonthly bolus aflibercept injections (25.95% ± 3.51%) at the end of study. It should be noted here that we used aflibercept clinical stock solution at the concentration of 40 mg/mL for bolus IVT injections in this study, which rendered the initial intravitreal concentration of 10 mg/mL given the volume of rats’ vitreous as 20 µL.27 Compared to the initial intravitreal concentration for humans after bolus injection (0.5 mg/mL), it is possible that we were overtreating the CNVs in rats. This may explain lack of significant differences between bolus aflibercept and aflibercept-DDS groups. Nonetheless, the current results suggest that that a single injection of aflibercept-DDS is as effective as multiple bolus injections of aflibercept in treating CNVs. In addition, no significant differences in CNV lesion changes were observed between no-treatment and blank DDS group animals at all time points other than week 14, where the blank DDS group showed higher CNV growth (P < 0.05). This implies that the injection of blank DDS does not have any effects on the CNV lesion changes.
The laser-induced rodent model was chosen in the current study for treatment evaluation due to its simplicity, cost-effectiveness, consistent and stable CNV formation rate (∼80%), and ability to have longitudinal monitoring through FA.17 Nevertheless, for an animal model to be valid for evaluating long-term treatment efficacy, the CNV lesions should be sustainable for the period of investigation, which in our case is 6 months. There have been debates as to whether the laser-induced CNV can be sustainable for prolonged periods before its natural regression.29,30 This natural regression could confound with the treatment efficacy provided by any sustained drug delivery system. Multiple groups have studied the natural course of a laser-induced CNV model on different species of animals using different quantification methods and reported a different time before CNV regression. In C57BL6 mice, laser-induced CNV was found to first appear on day 3 postlaser, was fully developed at week 2, and then regressed significantly thereafter,29,30 while in nonhuman primate studies, it was discovered that the severity and time course of CNV exhibited large variability among individuals. For example, CNVs in some rhesus monkeys persisted for as long as 20 weeks with no significant regression compared with baseline, while CNVs in some other rhesus monkeys regressed within a month or were even not responsive to laser photocoagulation.31,32 This variability in CNV severity and time course may compromise the reliability of results using primates. In pigmented Norway Brown rats, Kuroki et al.26 demonstrated using vascular casts and a scanning electron microscope that laser-induced CNVs continued to develop new vessel connections until 3 months after photocoagulation, and CNV regression was not seen until 6 months after laser. Therefore, the regression of CNVs can vary significantly among different species of animals. In our current study, the hyperfluorescence leakage of CNV lesions was maintained in Long-Evans rats for six 6 months after laser induction (Fig. 3), and the increase of CNV area in nontreated animals was sustained throughout the study. This agreed well with our previous study, where nontreated CNVs were followed up to 12 weeks after photocoagulation and continued to grow by ∼1% per week without signs of regression based on FA.22 With all the above evidence, we are confident that the reduction in CNV area was the result of treatment efficacy of our DDS. Further rigorous testing of CNV treatment by our DDS in a laser photocoagulation nonhuman primate model31 is planned for the future.
To quantify and monitor CNV lesions, we used the MOT technique previously developed by our laboratory. We demonstrated that the lesion area measured by MOT correlated well with standard histopathology measurements.18 In the current study, the histopathologic evaluations of CNVs at the end of study also agreed well with measurements of CNVs using MOT. This further validated the ability of MOT in quantifying CNVs. Compared to other commonly used CNV quantification methods such as fluorescent flat-mount and CNV scoring by trained retina specialists, MOT is simpler, more objective, more cost-effective, faster, and less sensitive to image brightness. In addition, MOT enables longitudinal monitoring of the same lesion, allowing for better visualization of the CNV natural course. However, it should be noted that MOT only works well on uniformly illuminated classical CNV lesions not overlapping with large bright retinal vessels. Diffusive CNVs are usually difficult to be segmented and accurately quantified due to interference from overlapping large vessels.18 To achieve comparable image quality under all conditions, special attention was made to the inclusion of the CNV lesion. The inclusion criteria were that only well-isolated CNV lesions not overlapping with large retinal vessels and under uniform illumination were included in the final analysis.
All DDS-injected eyes showed no long-term functional and morphologic abnormalities over the entire study period. The DDS was successfully delivered and viewed in the target location (superior-temporal region of peripheral vitreous) without difficulties, and proof of in vivo degradability of DDS was shown. However, the complete clearance of the NIPAAm polymer residues may take longer than 6 months, which is in line with our in vitro findings.11 Longer time of monitoring and quantification of degradation are needed in the future. For example, fluorescent labeling of hydrogel polymer block could enable real-time noninvasive tracking and quantifying of in vivo hydrogel degradation.33
The retinal cellular function was evaluated using ERG parameters, including a-wave and b-wave maximal amplitudes and their sensitivity (i.e., half-saturation intensity) under scotopic conditions. As summarized in the Table, there were transient significant changes in terms of a-wave maximal amplitude and b-wave sensitivity within 2 months of blank DDS IVT injection. However, all ERG parameters showed no significant differences from baseline values (preinjection) after 2 months of injection for the entire follow-up period. This indicates that our DDS had no long-term physiologic effects on both the outer and inner retina. While not significant, the maximal a-wave and b-wave amplitudes were still lower than baseline in later weeks of the study. It was reported in our previous study that this may be caused by corneal drying due to repeated testing and exposure to anesthesia.23 A well-known factor that could contribute to changes in retinal function is IOP.34 In the current study, a transient significant increase in IOP (P < 0.05) was observed immediately after DDS IVT injection, which corresponded with initial changes of ERG parameters. The IOP returned to baseline level after 4 weeks of IVT injection, which also corresponded with the recovery of ERG parameters. Therefore, this initial transient increase of IOP may explain the initial changes of ERG parameters. It is worth noting that changes of IOP were not observed in our rhesus monkey studies due to larger vitreous space (4 mL) compared to rats’ vitreous volume (only 20 µL).35 However, whether the above transient changes observed in ERG parameters and IOP increase will have a direct impact on rats’ visual acuity is not known based on the current studies. In addition, although we expected that the opacity of DDS after IVT injection due to thermal transition will not affect patients’ vision, the injection volume of delivery is small and the injection site is in the peripheral region of the vitreous. Behavioral assessment of visual acuity in animals is warranted in the future to get more information on the influence of IVT DDS injection on vision.36
No obvious acute or chronic inflammatory responses or any adverse events were observed in the eyes after blank DDS injections. However, minimal acute anterior segment inflammation was reported during the first 7 days after IVT injection of pNIPAAm-based adhesives by others.21 The results of a current in vivo biocompatibility study corresponded well with our previous in vitro study demonstrating that no cytotoxicity was caused by degraded by-products of the DDS.14
An important design criterion of any biodegradable sustained-release DDS for ocular application is clearance of the polymer residue from the site of injection. The current DDS was designed such that the microspheres will degrade first to release the active aflibercept, and then the hydrogel will degrade once the drug release is finished. The rationale for the delayed degradation of hydrogel is to ensure that the microspheres do not escape the hydrogel complex. In this study, signs of in vivo degradation of DDS were demonstrated, but the hydrogel's polymer residue was not completely cleared at the end of drug release. The DDSs were observed to be significantly smaller and almost completely transparent under the cSLO IR module. This agreed well with our previous in vitro degradation results that the encapsulated PLGA microspheres completely degraded after 160 days of incubation,10 and the hydrogel became smaller and less condense after 6 months of incubation.11,14 One limitation of current study is that, despite demonstrated treatment efficacy, the drug metabolism/pharmacokinetics (DMPK) of aflibercept released from DDS in eyes was not investigated. Therefore, no information on drug distribution and in vivo half-life can be extracted so far. This is because the size and anatomy of the rodent eye are so different from those of humans, and any DMPK of drug in the rat eye is hard to be translated into humans. In addition, immune responses to foreign objects are also different in rats than humans. On this ground, an in vivo pharmacokinetic, efficacy, and safety study of our DDS on nonhuman primates has been planned and ongoing.35
In conclusion, we demonstrated that a single IVT injection of aflibercept-DDS was effective in treating laser-induced CNV in rats for 6 months. The microsphere-hydrogel DDS investigated in this study is safe, well tolerated, and biocompatible in vivo. No long-term functional and morphologic abnormalities were observed for the entire 6 months after IVT injection. The changes observed in ERG parameters and IOP were transient and did not persist after 2 months of injection. No chronic inflammatory or foreign body reactions were found. Our controlled and extended-release aflibercept microsphere-hydrogel DDS is advantageous over the current bimonthly bolus regimen in terms of less injections and less overall dose needed.
Acknowledgments
The authors thank Chang Hong in processing and preparing the histologic slides of rats’ eyes and providing advice in analyzing the images, as well as Kenneth M. Tichauer and David Mogul for sharing their knowledge of statistical analysis of the results.
Supported by the National Institutes of Health/National Eye Institute under Grants EY025434 and EY029298.
Disclosure: W. Liu, None; A.P. Tawakol, None; K.M. Rudeen, None; W.F. Mieler, None; J.J. Kang-Mieler, microsphere-thermoresponsive drug delivery system (P)
References
- 1. Aiello LP, Avery RL, Arrigg PG, et al.. Vascular endothelial growth factor in ocular fluid of patients with diabetic retinopathy and other retinal disorders. N Engl J Med. 1994; 331: 1480–1487. [DOI] [PubMed] [Google Scholar]
- 2. Kwak N, Okamoto N, Wood JM, Campochiaro PA. VEGF is a major stimulator in model of choroidal neovascularization. Invest Ophthalmol Vis Sci. 2000; 41: 3158–3164. [PubMed] [Google Scholar]
- 3. Brown DM, Michels M, Kaiser PK, Heier JS, Sy JP, Ianchulev T; ANCHOR Study Group. Ranibizumab versus verteporfin photodynamic therapy for neovascular age-related macular degeneration: two-year results of the ANCHOR study. Ophthalmology. 2009; 116: 57–65. [DOI] [PubMed] [Google Scholar]
- 4. Rosenfeld PJ, Brown DM, Heier JS, Boyer DS, Kaiser PK, Chung CY; MARINA Study Group. Ranibizumab for neovascular age-related macular degeneration. N Engl J Med. 2006; 355: 1419–1431. [DOI] [PubMed] [Google Scholar]
- 5. Kim LA, D'Amore PA.. A brief history of anti-VEGF for the treatment of ocular angiogenesis. Am J Pathol. 2012; 181: 376–379. [DOI] [PMC free article] [PubMed] [Google Scholar]
- 6. Stewart MW, Rosenfeld PJ, Penha FM, et al.. Pharmacokinetic rationale for dosing every 2 weeks versus 4 weeks with intravitreal ranibizumab, bevacizumab, and aflibercept (vascular endothelial growth factor Trap-eye). Retina. 2012; 32: 434–457. [DOI] [PubMed] [Google Scholar]
- 7. Kang-Mieler JJ, Dosmar E, Liu W, Mieler WF. Extended ocular drug delivery systems for the anterior and posterior segments: biomaterial options and applications. Expert Opin Drug Deliv. 2017; 14: 611–620. [DOI] [PubMed] [Google Scholar]
- 8. Falavarjani KG, Nguyen QD.. Adverse events and complications associated with intravitreal injection of anti-VEGF agents: a review of literature. Eye. 2013; 27: 787–794. [DOI] [PMC free article] [PubMed] [Google Scholar]
- 9. Yun YH, Lee BK, Park K. Controlled drug delivery: historical perspective for the next generation. J Control Release. 2015; 219: 2–7. [DOI] [PMC free article] [PubMed] [Google Scholar]
- 10. Osswald CR, Kang-Mieler JJ.. Controlled and extended release of a model protein from a microsphere-hydrogel drug delivery system. Ann Biomed Eng. 2015; 43: 2609–2617. [DOI] [PubMed] [Google Scholar]
- 11. Liu W, Lee BS, Mieler WF, Kang-Mieler JJ. Biodegradable microsphere-hydrogel ocular drug delivery system for controlled and extended release of bioactive aflibercept in vitro . Curr Eye Res. 2019; 44: 264–274. [DOI] [PMC free article] [PubMed] [Google Scholar]
- 12. Adamson P, Wilde T, Dobrzynski E, et al.. Single ocular injection of a sustained-release anti-VEGF delivers 6 months pharmacokinetics and efficacy in a primate laser CNV model. J Control Release. 2016; 244: 1–13. [DOI] [PMC free article] [PubMed] [Google Scholar]
- 13. Li J, Mooney DJ.. Designing hydrogels for controlled drug delivery. Nat Rev Mater. 2016; 1: 16071. [DOI] [PMC free article] [PubMed] [Google Scholar]
- 14. Liu W, Borrell MA, Venerus DC, Mieler WF, Kang-Mieler JJ. Characterization of biodegradable microsphere-hydrogel ocular drug delivery system for controlled and extended release of ranibizumab. Transl Vis Sci Technol. 2019; 8: 12. [DOI] [PMC free article] [PubMed] [Google Scholar]
- 15. Osswald CR, Kang-Mieler JJ.. Controlled and extended in vitro release of bioactive anti-vascular endothelial growth factors from a microsphere-hydrogel drug delivery system. Curr Eye Res. 2016; 41: 1216–1222. [DOI] [PubMed] [Google Scholar]
- 16. Drapala PW, Jiang B, Chiu YC, et al.. The effect of glutathione as chain transfer agent in PNIPAAm-based thermo-responsive hydrogels for controlled release of proteins. Pharm Res. 2014; 31: 742–753. [DOI] [PubMed] [Google Scholar]
- 17. Grossniklaus HE, Kang SJ, Berglin L. Animal models of choroidal and retinal neovascularization. Prog Retin Eye Res. 2010; 29: 500–519. [DOI] [PMC free article] [PubMed] [Google Scholar]
- 18. Guthrie MJ, Osswald CR, Valio NL, Mieler WF, Kang-Mieler JJ. Objective area measurement technique for choroidal neovascularization from fluorescein angiography. Microvasc Res. 2014; 91: 1–7. [DOI] [PMC free article] [PubMed] [Google Scholar]
- 19. Patel NB, Luo X, Wheat JL, Harwerth RS. Retinal nerve fiber layer assessment: area versus thickness measurements from elliptical scans centered on the optic nerve. Invest Ophthalmol Vis Sci. 2011; 52: 2477–2489. [DOI] [PMC free article] [PubMed] [Google Scholar]
- 20. Ming Y, Algvere PV, Odergren A, et al.. Subthreshold transpupillary thermotherapy reduces experimental choroidal neovascularization in the mouse without collateral damage to the neural retina. Invest Ophthalmol Vis Sci. 2004; 45: 1969–1974. [DOI] [PubMed] [Google Scholar]
- 21. Lima LH, Morales Y, Cabral T. Ocular biocompatibility of poly-N-isopropylacrylamide (pNIPAAm). J Ophthalmol. 2016; 2016: 5356371. [DOI] [PMC free article] [PubMed] [Google Scholar]
- 22. Osswald CR, Guthrie MJ, Avila A, Valio JA, Mieler WF, Kang-Mieler JJ. In vivo efficacy of an injectable microsphere-hydrogel ocular drug delivery system. Curr Eye Res. 2017; 42: 1293–1301. [DOI] [PubMed] [Google Scholar]
- 23. Turturro SB, Guthrie MJ, Appel AA, et al.. The effects of cross-linked thermoresponsive PNIPAAm-based hydrogel injection on retinal function. Biomaterials. 2011; 32: 3620–3626. [DOI] [PubMed] [Google Scholar]
- 24. Kang-Derwent JJ, Linsenmeier RA.. Intraretinal analysis of the a-wave of the electroretinogram (ERG) in dark-adapted intact cat retina. Vis Neurosci. 2001; 18: 353–363. [DOI] [PubMed] [Google Scholar]
- 25. Lamb TD, Pugh EN.. A quantitative account of the activation steps involved in phototransduction in amphibian photoreceptors. J Physiol. 1992; 449: 719–758. [DOI] [PMC free article] [PubMed] [Google Scholar]
- 26. Stockton RA, Slaughter MM.. B-wave of the electrogram: a reflection of ON bipolar cell activity. J Gen Physiol. 1989; 93: 101–122. [DOI] [PMC free article] [PubMed] [Google Scholar]
- 27. Pang IH, Wang WH, Clark AF. Acute effects of glaucoma medications on rat intraocular pressure. Exp Eye Res. 2005; 80: 207–214. [DOI] [PubMed] [Google Scholar]
- 28. Kuroki AM, Bhutto IA, Kitaoka T, Amemiya T. Natural course of experimental choroidal neovascularization: three-dimensional study with corrosion cast and scanning electron microscope. Ophthalmic Res. 2002; 34: 200–205. [DOI] [PubMed] [Google Scholar]
- 29. Hoerster R, Muether PS, Vierkotten S, Schroder S, Kirchhof B, Fauser S. In vivo and ex vivo characterization of laser-induced choroidal neovascularization variability in mice. Graefes Arch Clin Exp Ophthalmol. 2012; 250: 1579–1586. [DOI] [PubMed] [Google Scholar]
- 30. Zhu Y, Lu Q, Shen J, et al.. Improvement and optimization of standards for a preclinical animal test model of laser-induced choroidal neovascularization. PLoS One. 2014; 9: e94743. [DOI] [PMC free article] [PubMed] [Google Scholar]
- 31. Lin X, Wang Q, He M. Repeated retinal photocoagulation in monkeys for the optimization of a laser-induced choroidal neovascularization model. Exp Eye Res. 2019; 184: 1–7. [DOI] [PubMed] [Google Scholar]
- 32. Yu Y, Lin X, Wang Q, He M, Chau Y. Long-term therapeutic effect in nonhuman primate eye from a single injection of anti-VEGF controlled release hydrogel. Bioeng Transl Med. 2019; 4: e10128. [DOI] [PMC free article] [PubMed] [Google Scholar]
- 33. Wang W, Liu J, Li C, et al.. Real-time and non-invasive fluorescence tracking of in vivo degradation of the thermosensitive PEGylated polyester hydrogel. J Mater Chem B. 2014; 2: 4185–4192. [DOI] [PubMed] [Google Scholar]
- 34. Wang J, Dong Y.. Characterization of intraocular pressure pattern and changes of retinal ganglion cells in DBA2J glaucoma mice. Int J Ophthalmol. 2016; 9: 211–217. [DOI] [PMC free article] [PubMed] [Google Scholar]
- 35. Kim S, Kang-Mieler JJ, Liu W, et al.. Safety and biocompatibility of aflibercept-loaded microsphere thermoresponsive hydrogel drug delivery system in nonhuman primate model. Transl Vis Sci Technol. 2020; 9: 30. [DOI] [PMC free article] [PubMed] [Google Scholar]
- 36. Prusky GT, West PWR, Douglas RM. Behavioural assessment of visual acuity in mice and rats. Vision Res. 2000; 40: 2201–2209. [DOI] [PubMed] [Google Scholar]