Abstract
This article reviews the magnetic resonance imaging (MRI) findings of the normal anatomy and various pathologic conditions of the ankle and foot commonly encountered in clinical practice. The spectrum of entities discussed includes osseous and osteochondral injuries, ligamentous injuries, common traumatic and degenerative tendon pathology, abnormalities of transverse tarsal joint (Chopart) and tarsometatarsal joint (Lisfranc) complexes, pathological conditions affecting capsuloligamentous structures of the great toe and lesser toes, as well as pedal infection, with a focus on diabetic osteomyelitis and neuropathic osteoarthropathy.
Keywords: MRI, foot, ankle, review, ligament, tendon
Introduction
Magnetic resonance imaging (MRI) has become a routine imaging tool in diagnosing disorders of the ankle and foot. Although radiographic assessment remains an essential initial step, MRI allows further insight into diagnosis of pathologic conditions of articular cartilage and bone, and detailed evaluation of soft issue structures. Compared to other anatomic areas in musculoskeletal imaging, MRI of the ankle and foot offers an additional challenge for interpretation, due to the relatively complex anatomy and a wide spectrum of normal variants and pathologic conditions. This review will focus on MRI diagnosis of common clinical conditions affecting the ankle and foot along with a brief review of pertinent normal MRI anatomy.
Anatomic regions in the ankle and foot include the ankle (talocrural joint, formed by the talus, distal tibia, and fibula), hindfoot (which includes talus and calcaneus), midfoot (encompassing cuboid, navicular, and cuneiform bones), and forefoot (which includes metatarsal bones and toes). Several articulations exist within each of these anatomic regions. There are two talocalcaneal joints: the subtalar joint (also referred to as posterior talocalcaneal or posterior subtalar joint) and talocalcaneonavicular joint (or anterior subtalar joint). The Chopart joint is located between the hindfoot and midfoot, and the Lisfranc joint is located between the midfoot and forefoot, which are described in subsequent sections.
Magnetic resonance imaging technique and protocol
Standard MRI includes individual protocols for three examination zones: the ankle and hindfoot, the midfoot, and the forefoot. The midfoot may also be adequately imaged with either the ankle or the forefoot. High field strength 1.5T or 3T scanners and dedicated extremity coils provide adequate signal-to-noise ratio and the spatial resolution required for proper imaging of the complex regional anatomy of the ankle and foot. Standard MRI planes for ankle and foot include sagittal, coronal, and axial planes. For examination of the forefoot, imaging planes are prescribed relative to the axis of the second or third metatarsal bones. Because the axial plane for the ankle (also referred to as transverse plane) provides a coronal display of the foot, and, conversely, the coronal plane of the ankle represents a transverse display of the foot, some confusion may occur in communicating an imaging protocol to a technologist, particularly when MRI examinations of several neighbouring anatomic zones are performed. To avoid such miscommunication, three anatomic imaging planes are used universally for both the ankle and the foot in the author’s institution. For example, an axial plane for both foot and ankle is referred to a plane prescribed parallel to the plantar surface of the foot. The scanning protocol includes at least one short TI inversion recovery sequence to resolve potential artifacts from inhomogeneous fat suppression, often encountered in the ankle and foot. Non-fat-suppressed T1-weighted images are obtained in at least one imaging plane. For MRI examination of the forefoot, obtaining T1-weighted sequences in all three planes may be beneficial due to reliance on T1-weighted imaging for diagnosis of fractures, osteomyelitis, or Morton’s neuroma. Fat-suppressed T2-weighted sequences, and non-fat-suppressed and fat-suppressed proton-density-weighted sequences are commonly used (Tables 1 and 2). Imaging after administration of intravenous gadolinium-based contrast is reserved for specific clinical scenarios, such as pedal infection and evaluation of a neoplasm. MR arthrography of the ankle is performed infrequently, most commonly for characterisation of osteochondral lesions.
Table 1.
Sample non-contrast ankle and hindfoot imaging protocol at 3T
| Sequence | TR (ms) | TE (ms) | Slice thickness (mm) | FOV (mm) | Matrix |
|---|---|---|---|---|---|
| Sagittal T1 | 600 | 20 | 3.0 | 150 | 288 × 256 |
| Sagittal STIR | 4000 | 60 | 3.0 | 150 | 288 × 256 |
| Axial PD | 3000 | 30 | 3.0 | 140 | 320 × 288 |
| Axial T2 FS | 4000 | 65 | 3.0 | 140 | 288 × 256 |
| Coronal PD FS | 3000 | 30 | 3.0 | 140 | 320 × 288 |
FOV – field of view, STIR – short TI inversion recovery, FS – fat-suppressed, PD – proton density, TE – echo time, TR – repetition time.
Table 2.
Sample non-contrast forefoot and midfoot imaging protocol at 3T
| Sequence | TR (ms) | TE (ms) | Slice thickness (mm) | FOV (mm) | Matrix |
|---|---|---|---|---|---|
| Sagittal T1 | 600 | 20 | 3.0 | 140 | 288 × 256 |
| Sagittal STIR | 4000 | 60 | 3.0 | 140 | 288 × 256 |
| Coronal T1 | 600 | 20 | 3.0 | 100 | 288 × 256 |
| Coronal T2 FS | 4000 | 65 | 3.0 | 100 | 320 × 288 |
| Axial T1 | 600 | 20 | 3.0 | 140 | 288 × 256 |
| Axial PD FS | 3000 | 30 | 3.0 | 140 | 320 × 288 |
FOV – field of view, STIR – short TI inversion recovery, FS – fat-suppressed, PD – proton density, TE – echo time, TR – repetition time.
Osseous structures and cartilage
Non-neoplastic disorders of articular cartilage and bone frequently encountered in clinical imaging include acute traumatic injuries, chronic repetitive injury, and degenerative and inflammatory conditions.
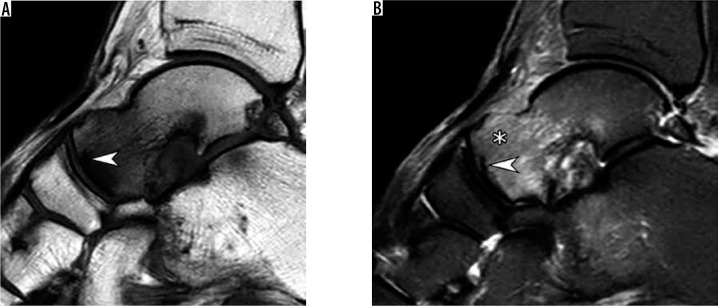
MRI terminology for osseous and osteochondral injuries is based on the presence of a bone marrow edema pattern, fracture line, contour deformity, or chondral or osteochondral involvement [1]. A bone marrow edema-like signal refers to ill-defined areas of increased signal intensity on fluid-sensitive sequences that do not completely replace marrow fat on T1-weighted images (Figure 1). Osteochondral fractures are diagnosed when there is a contour deformity or a fracture line that disrupts articular cartilage and subchondral bone plate; subchondral fractures are defined by the presence of a subchondral fracture line that does not violate the articular surface (Figure 1); bone contusions manifest as an edema-like bone marrow signal without a contour deformity or discrete fracture line [2].
Figure 1.
Subchondral insufficiency fracture of the talar head in a 64-year-old woman presenting with foot pain for several weeks without history of trau- ma. Sagittal T1-weighted (A) and short TI inversion recovery (B) magnetic resonance images demonstrate a prominent bone marrow edema-like signal at the talar head and neck (asterisk in b) that extends from the articular surface and an irregular hypointense fracture line (arrowhead A,B) that runs parallel and in close proximity to the subchondral bone plate
Considering the general principle that impaction fractures are typically associated with prominent bone marrow edema and distraction fractures demonstrate minimal marrow edema [3], MRI may be inferior to radiographs and computed tomography (CT) in the detection of avulsion fractures due to the lack of bone marrow edema at the donor site and prominent surrounding soft tissue edema “engulfing” small cortical fragments. Complimentary roles of radiographs, CT, and MRI may become particularly important when avulsion injuries involve key ligamentous attachments, such as in a Lisfranc injury.
Stress injuries are produced by a chronic repetitive microtrauma. These are subdivided into insufficiency fractures, resulting from a normal physiologic stress applied to a weak bone, and fatigue fractures, occurring when excessive repetitive stress is applied to a normal bone [1,4]. The three most common locations in the ankle and foot include the posteromedial distal tibia, calcaneus, and metatarsals [5]. In regard to prognostic significance, a group of high-risk stress fractures must be distinguished from a low-risk group. High-risk fractures are located at the concentration of tensile forces (in contrast to the compressive forces in a low-risk group) or regions of decreased vascularity, or both. Such fractures are prone to delayed union or non-union and may require restricted weight-bearing or surgery. The high-risk group includes fractures of anterior tibial cortex, medial malleolus, talus, navicular bone (Figure 2), base of the second metatarsal, proximal fifth metatarsal, and hallux sesamoids [5].
Figure 2.
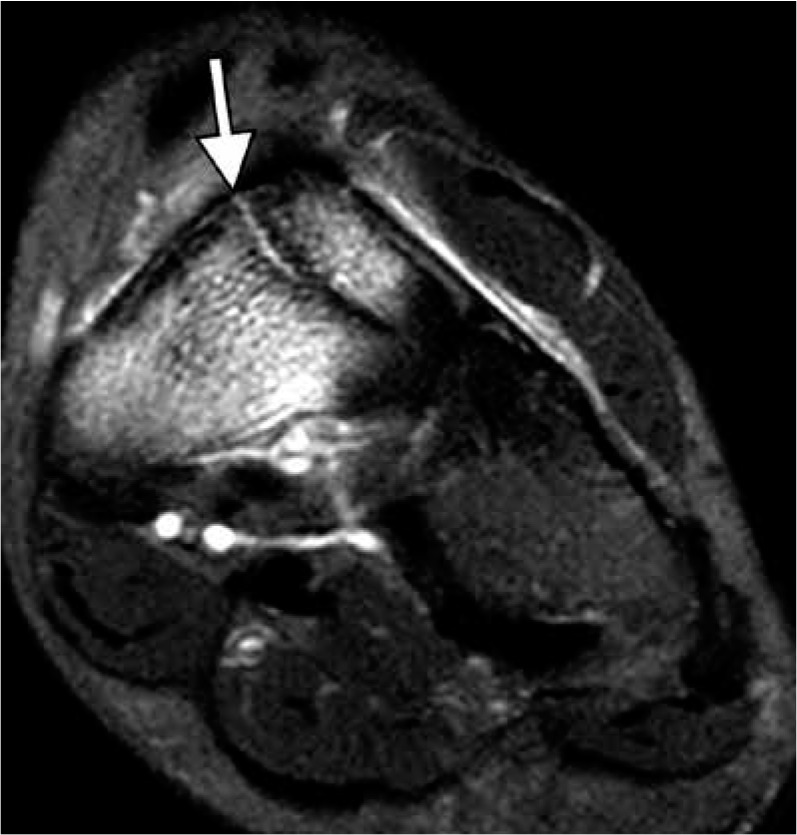
Navicular stress fracture in an 18-year-old female athlete la- crosse player. Coronal fat-suppressed proton density weighted magnetic resonance image demonstrates an incomplete fracture line (arrow) that extends in the sagittal oblique plane through the midportion of the tar- sal navicular bone dorsally amid an extensive bone marrow edema-like signal. This characteristic location often makes such fractures difficult to detect radiographically
A bone marrow edema-like signal on the ankle and foot MRI is often related to non-traumatic causes such as inflammation or infection [6]. For example, a bone marrow edema-like signal representing osteitis is frequently seen in a setting of inflammatory, degenerative, or crystal-induced arthropathy, particularly gout, and may be quite extensive during disease exacerbation (Figure 3).
Figure 3.
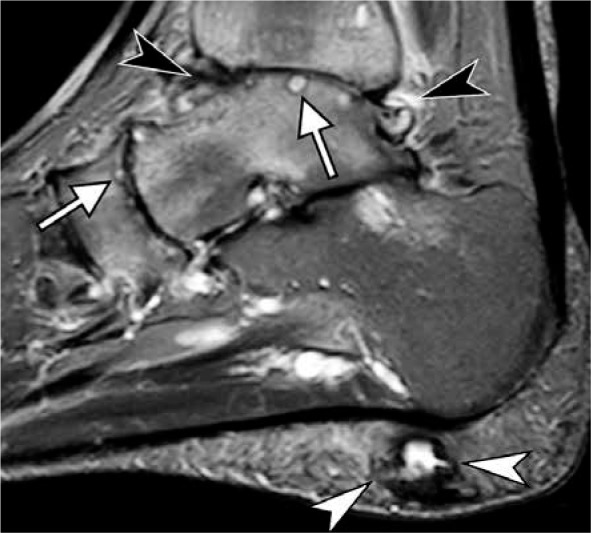
Rheumatoid arthritis of the ankle and hindfoot in a 37-year-old wom- an. Sagittal short TI inversion recovery magnetic resonance image of the ankle demonstrates characteristic uniform joint space loss involving the tibiotalar and anterior and posterior subtalar joints, complex joint effusion (black arrowheads) with periarticular soft tissue swelling, subchondral cyst-like changes (arrows) and an intense periarticular bone marrow edema-like marrow signal which represents osteitis. Findings most prominent in the tibiotalar and talonavicular joints. Note a cystic rheumatoid nodule at the heel fat pad (white arrowheads)
Osteochondral lesions (OCL) of the talus, or osteochondral lesion of the talus, represent a wide spectrum of conditions, including acute and chronic post-traumatic lesions, chronic degenerative lesions, and osteochondritis dissecans. The term OCL lacks specificity and should be reserved for cases when the exact diagnosis is unknown (Figure 4). Given the variability of conditions producing these lesions, the spectrum of imaging appearances is also wide. Multiple classification systems were proposed for talar OCLs based on radiographic, CT, MRI, and arthroscopic characteristics [7,8]. It was shown that some of the MRI features such as lesion size, bone marrow edema, and underlying cyst-like changes may demonstrate improvement or a complete resolution on MRI [9] and may not serve as reliable signs of lesion severity or prognostic indicators.
Figure 4.
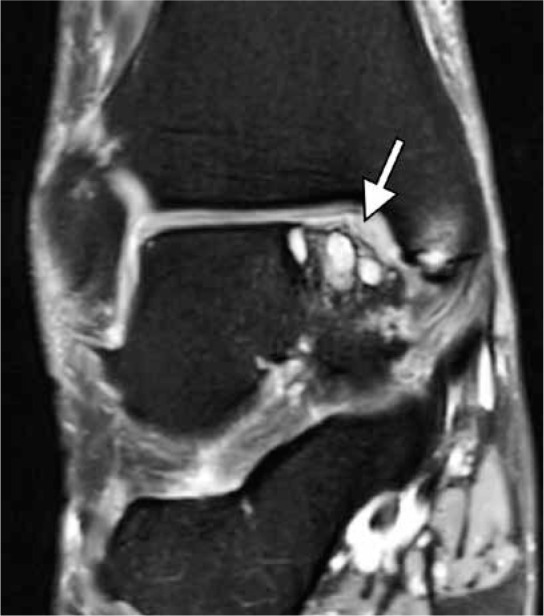
Chronic osteochondral lesion of the talus in a 46-year-old woman with chronic ankle pain and no history of trauma. Coronal fat-suppressed proton-density-weighted magnetic resonance image depicts an irregularity of the articular cartilage and subchondral bone plate at the medial talar dome (arrow) with prominent underlying subchondral cyst-like changes. No osteochondral fragment in situ is visualized
Osteochondritis dissecans (OCD) represents a discrete clinicopathologic entity that most commonly affects the knee, ankle, and elbow joints [10]. Although its exact cause remains unknown, a currently accepted theory is that repetitive microtrauma results in a focal disruption of endochondral ossification of the epiphysis and subsequent growth disturbance of subchondral bone that, in turn, may either heal or result in instability and disruption of overlying articular cartilage [11]. Analysis of literature regarding OCD of the talus may be difficult, as this entity is frequently combined with degenerative and posttraumatic lesions, all covered under the umbrella term OCL. When assessing talar OCD on MRI, some general rules developed for MRI assessment of OCD of the femoral condyle may be extrapolated. A patient’s skeletal maturity and fragment stability are the two most important factors that determine OCD prognosis and treatment [12-14]. Four classic signs of OCD instability include: 1) a high-signal-intensity line at the interface between the fragment and the adjacent bone on T2-weighted images; 2) fluid-filled cysts beneath the lesion; 3) a high-signal-intensity line extending through the articular cartilage overlying the lesion; and 4) a focal osteochondral defect filled with joint fluid (Figure 5) [13]. These criteria demonstrated high sensitivity and specificity for instability in adult OCD, and high sensitivity but poor specificity in juvenile OCD [12]. To increase the specificity of MRI for juvenile OCD of the knee, the classic criteria were revised with the addition of three criteria: 1) T2-weighted high-signal-intensity rim surrounding an OCD lesion indicates instability only if it has the same signal intensity as joint fluid; 2) second outer rim of T2-weighted low signal intensity; and 3) multiple breaks in the subchondral bone plate. Cyst-like changes surrounding a juvenile OCD lesion indicate instability only if they are multiple or larger than 5 mm [12].
Figure 5.
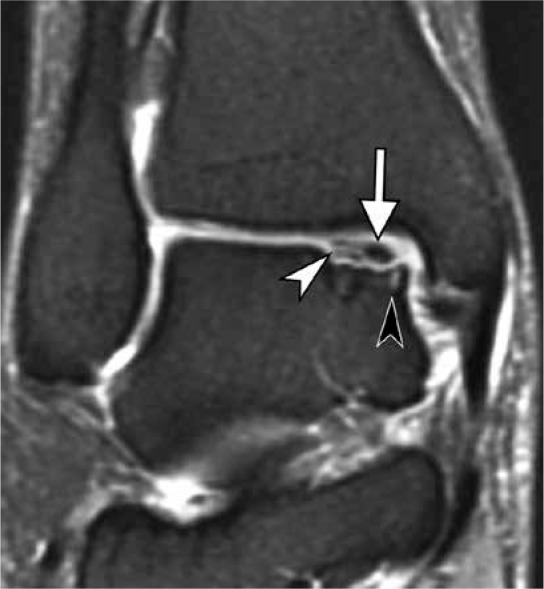
Osteochondritis dissecans (OCD) of the medial talar dome in a 43-year-old woman. Coronal fat-suppressed proton-density-weighted magnetic resonance image demonstrates an osteochondral fragment in situ (arrow) at the medial talar dome. Note high signal intensity rim (white arrowhead) and small cyst-like changes (black arrowhead) at the interface between the fragment and parent bone; both these findings indicate in- stability in adult OCD
Treatment strategies for OCL of the talus depend on the patient’s age, lesion size and location, and associated findings, such as ankle instability and secondary osteoarthritis. Surgical options range from debridement and microfracture to more advanced cartilage restoration procedures, such as autologous chondrocyte implantation, osteochondral autograft, or allograft transfer [8].
Ankle ligaments
The ligaments about the ankle are comprised of three complexes : syndesmotic, lateral, and medial (Figure 6) [15,16].
Figure 6.
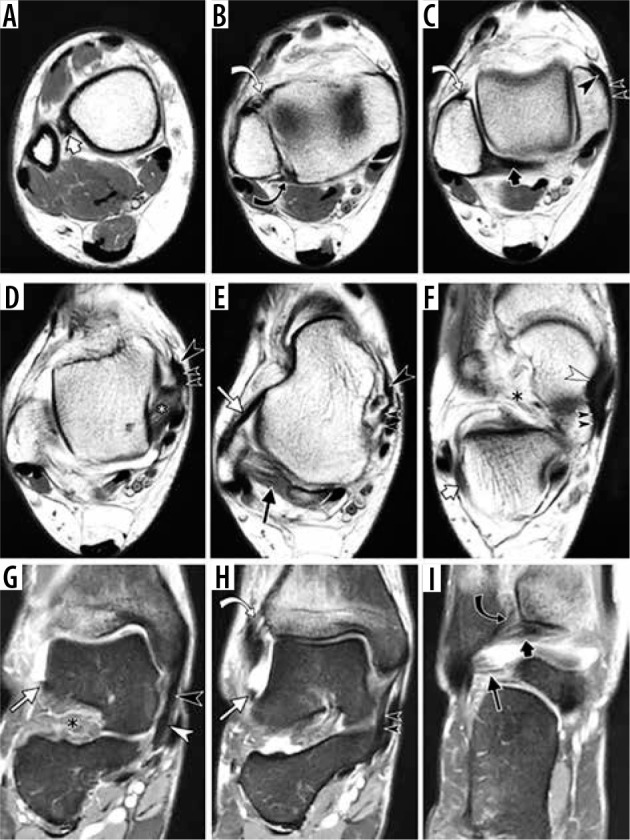
Normal appearance of the ankle ligaments in a 47-year-old fe- male with distal tibial stress fracture and ankle joint effusion allowing bet- ter delineation of the ligaments. Sequential axial proton density weighted magnetic resonance (MR) images (A–F) and coronal fat-suppressed proton density weighted MR images (G–I) of the ankle depict syndesmotic liga- ments (interosseous ligament (short white arrow in A), anterior tibiofibular ligament (curved white arrow in B, C and H), posterior tibiofibular ligament (curved black arrow in B and I), inferior transverse ligament (short black arrow in C and I); lateral ligamentous complex (anterior talofibular ligament (long white arrow in A and H), posterior talofibular ligament (long black arrow in E), calcaneofibular ligament (short white arrow in F), some compo- nents of the deltoid complex (posterior tibiotalar ligament (white asterisk in D), tibiospring ligament (large black arrowhead in D and G), tibiocalca- neal ligament (small double black arrowheads in D and H)) and superome- dial component of spring ligament complex (white arrowhead in F and G); sinus tarsi (black asterisk in F and G)
Syndesmotic complex includes anterior and posterior tibiofibular ligaments; inferior transverse ligament, located further distally to the posterior tibiofibular ligament; and interosseous ligament, viewed as a distal thickening of the interosseous membrane. Anterior inferior tibiofibular ligament is a multifascicular structure with discrete distal fascicle present in the majority of anatomic specimens [17,18]. Some authors distinguish a separate accessory anterior inferior tibiofibular ligament [19], also referred to as “Bassett’s ligament” [20]. Variable in appearance, posterior intermalleolar ligament can also be identified in most cases [21,22]. Some authors referred to it as tibial slip of the posterior talofibular ligament [23]. The lateral ligamentous complex includes anterior and posterior talofibular ligaments and calcaneofibular ligament. When evaluating syndesmotic and lateral ligamentous complexes on sequential axial MR images, it is helpful to keep the appearance of the talus as a reference point for ligament identification: a square-shaped talar dome is visible at the level of fibular attachment of the anterior tibiofibular ligament (Figure 6C), while the talar body and head are shaped like a cello or a snowman at the level of the anterior talofibular ligament (Figure 6E). The calcaneofibular ligament is best identified at the level immediately distal to the lateral malleolus, coursing between the peroneal tendons and lateral aspect of the calcaneus (Figure 6F).
Injuries of the syndesmotic ligaments are less common than those of the lateral ligamentous complex, comprising up to 12% of all ankle sprains [24], but they are more debilitating. They are often referred to as “high ankle sprain” (Figure 7) [25]. Injuries of the lateral ligamentous complex are the most common setting of acute trauma, generally referred to as “ankle sprain”. The lateral ligamentous injuries are amongst the most common traumatic injuries in adults and typically occur in sequence, progressing from anterior talofibular to calcaneofibular to posterior talofibular ligament (Figure 8). The rare exception from the usual pattern may be seen in a subtalar sprain when the calcaneofibular ligament may be injured in isolation. A spectrum of ligamentous injuries includes low-grade sprain, depicted as edema along the course of the ligament without fibre disruption, moderate-grade sprain with incomplete fibre discontinuity, and high-grade sprain or a full thickness tear with complete midsubstance fibre discontinuity or complete avulsion. As seen in injuries of capsular-forming ligaments in general, full thickness tear of anterior talofibular ligament is typically associated with prominent soft tissue swelling related to capsular disruption and leakage of intra-articular fluid.
Figure 7.

Syndesmotic injury, aka “high ankle sprain”, in a 44-year-old woman who fell down the steps one month ago. Sequential axial fat-sup- pressed T2-weighted magnetic resonance images of the ankle demonstrate a tear of the inferior interosseous ligament (white arrow, A), complete tear of the anterior tibiofibular ligament (white curved arrow, B), sprain of the posterior tibiofibular ligament (black curved arrow, B) and sprain of the inferior transverse tibiofibular ligament (black arrow, C)
Figure 8.
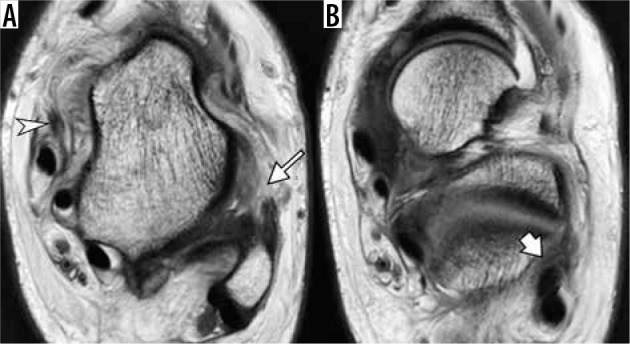
Medial and lateral ligamentous injury in a 15-year-old boy injured playing basketball one day ago. Axial proton density weighted magnetic resonance images of the ankle demonstrate complete disruption of the anterior talofibular ligament (arrow, A). The calcaneofibular ligament is indistinct and edematous (arrow, B), consistent with a high-grade sprain. Note lax appearance of the torn superficial component of deltoid ligament (arrowhead in A)
Medial ankle ligaments are composed of a deltoid ligament complex that can be divided into deep and superficial layers [26]. The deep layer is composed of anterior and posterior tibiotalar ligaments – short ligaments crossing the ankle joint. The posterior tibiotalar ligament is the thickest and strongest part of the deltoid ligament complex, and it typically demonstrates striated pattern (Figure 6D). The superficial layer of the deltoid ligament represents a delta shaped ligamentous layer with the apex attached to the medial malleolus and broad-based distal attachment on several structures, including navicular bone, calcaneus, and spring ligament (Figures 6E-H). The components of the superficial layer are named according to their proximal and distal attachments.
The spring ligament complex courses between the calcaneus and navicular bones at the superomedial and plantar aspect of the foot [27,28]. Although this complex belongs to the transverse tarsal joint described in the later section, anatomically and functionally it is closely associated with medial ligaments of the ankle joint. Along with the superficial layer of the deltoid ligament, it forms a ligamentous confluence at the medial aspect of the navicular bone that both stabilises the medial ankle joint and supports the talar head stabilising the hindfoot [29]. Three distinct components of the spring ligament are identified: superomedial calcaneonavicular ligament, medioplantar oblique calcaneonavicular ligament, and inferoplantar longitudinal calcaneonavicular ligament (Figures 6F,G) [30]. These short ligaments received their long names in order to describe their course and distinguish them from the other ligaments of the transverse tarsal joint, such as the lateral calcaneonavicular bundle of bifurcate ligament.
The deep and superficial components of the deltoid ligament may be injured in acute trauma (Figure 8), although not as commonly as the lateral ligamentous complex. Abnormalities of the superficial component of the deltoid and superomedial component of the spring ligament are frequently encountered in the setting of acquired adult flat foot deformity, encompassing a spectrum of degenerative changes ranging from soft tissue edema, calibre changes of the ligament, and full-thickness tear [26,28].
Tendons
Pathologic conditions affecting the tendons about the ankle and foot include tendinopathy, (or tendinosis), tendon tear, tenosynovitis and stenosing tenosynovitis [31], paratendinitis, and peritendinitis. Tendinosis represents tendon degeneration and can be manifested by tendon enlargement and an increased intrasubstance signal that does not reach fluid signal intensity. Tendon tears usually show high signal intensity on T2-weighted images. Partial thickness tears may be represented by both tendon enlargement due to multiple longitudinal splits or tendon thinning, produced by more severe partial disruption of the tendon fibres causing tendon attenuation [32]. The distinction between tendinosis and an interstitial tendon tear may be challenging and somewhat arbitrary. Both conditions may coexist as degenerative changes, and micro-tears may progress to a macroscopic tendon tear [33]. Full-thickness tendon tears are characterised by complete disruption of the tendon, often accompanied by tendon retraction. Term tenosynovitis refers to inflammation of the tendon sheath primarily depicted by an increased amount of tenosynovial fluid and secondary findings that include inflammation of the adjacent soft tissues or bone. A stenosing tenosynovitis results from adhesions between the tendon and its sheath, leading to a restricted movement of the tendon and compartmentalisation of tenosynovial fluid. Peritendinitis represents inflammation confined to the peritenon, while paratendinitis refers to inflammation of tissues adjacent to the tendon.
Review of the tendons about the ankle and foot can be organised by grouping them by their location: anterior, posterior, medial, and lateral (Figure 9).
Figure 9.
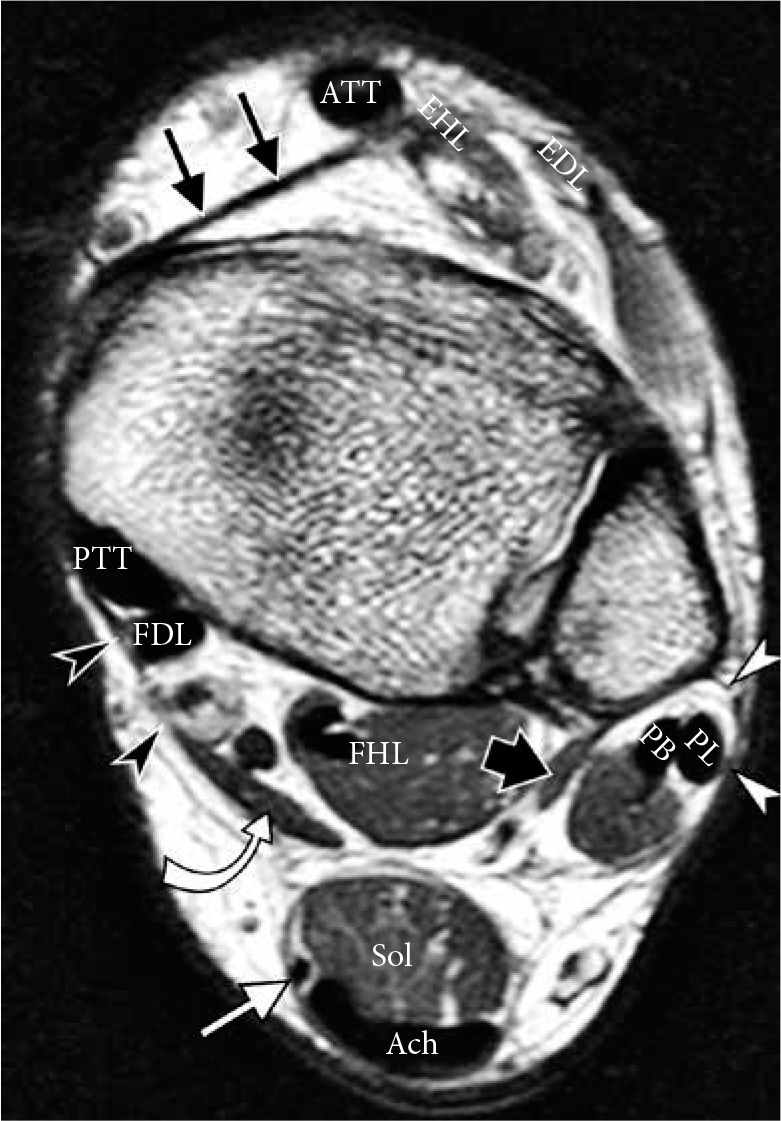
Normal tendons and retinacula of the ankle in a 40-year-old man. Axial proton density weighted magnetic resonance image shows normal size and normal homogeneously low signal intensity of the anterior group of tendons: anterior tibialis tendon, extensor hallucis longus (EHL), exten- sor digitorum longus (EDL); medial group: posterior tibialis tendon, flexor digitorum longus (FDL), flexor hallucis longus; lateral group: peroneus lon- gus and peroneus brevis tendons. Posterior group: plantaris tendon (white arrow) is seen medially to the Achilles tendon (Ach) and soleus muscle belly (Sol). Accessory peroneus quadratus (thick black arrow) and flexor digito- rum accessorius longus (curved arrow) muscles are present in this patient. Flexor retinaculum (black arrowheads), superior peroneal retinaculum (white arrowheads) and superior extensor retinaculum (thin black arrow) are well delineated on a nonfat suppressed image
Anterior tendons
In the anterior group, the anterior tibialis tendon (ATT) is the largest of the three. Tears of the ATT are often partial thickness and may be clinically subtle. Even complete ATT tears may go unrecognised due to preserved function of other ankle extensors. ATT tears often present as a mass at the anterior aspect of the ankle, produced by tendon enlargement due to tendinopathy and microtears or due to complete tendon rupture with a bulbous retracted stump simulating a mass [34].
Posterior tendons
The posterior group is represented by the Achilles tendon. The Achilles tendon is the longest and thickest tendon in the body, measuring 10 to 15 cm in length. It represents a conjoined tendon formed by soleus and gastrocnemius muscles. Devoid of tendon sheath, the Achilles tendon is surrounded by paratenon. The gastrocnemius, soleus, and plantaris muscles are referred to as the “triceps-surae complex”. The variably present plantaris tendon crosses obliquely between the soleus and gastrocnemius muscle and inserts at the superior medial aspect of the calcaneal tuberosity, typically separate from the Achilles insertion. A true anatomic synovial lined bursa, called the retrocalcaneal bursa, is located between the Achilles insertion and calcaneus, bordered by Kager’s fat pad. An acquired adventitious bursa that can be formed posteriorly to the Achilles tendon is referred to as a retro-Achilles bursa. On MRI, normal Achilles tendon is homogeneously hypointense with a straight course on sagittal and coronal images and a concave anterior margin on axial images [35,36]. The spectrum of traumatic, degenerative, and inflammatory conditions affecting the Achilles tendon include tendinosis, partial and full-thickness tears, and associated soft tissue and osseous abnormalities such as retrocalcaneal bursitis, Achilles paratendinitis and peritendinitis, and reactive osteitis of the calcaneus. The Achilles tendon is the most commonly torn tendon in the ankle. The relatively avascular region, located 2-6 cm proximal to the calcaneal insertion, referred to a “critical zone”, represents a typical site of tendinopathy and traumatic tears (Figure 10A), although tears may also occur proximally and distally. Treatment of Achilles tendon tears include both surgical and nonsurgical options. Operative treatments consist of open, percutaneous or mini-open repair, and augmentative repair. MRI provides critical information for preoperative planning by depicting the location of tear, size of the tendinous gap, and overall condition of the tendon.
Figure 10.
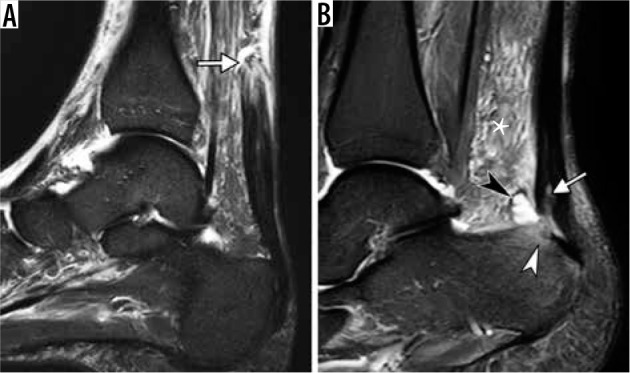
Spectrum of Achilles tendon pathology. A) Sagittal short TI inversion recovery (STIR) magnetic resonance (MR) images of the ankle in a 68-year-old man, who heard and felt a pop in posterior ankle while playing tennis, demonstrates full-thickness Achilles tendon rupture with a fluid-filled gap (arrow) located 7 cm proximally to its calcaneal insertion. B) Sagittal STIR MR image in a 40-year-old woman with posterior heel pain for several months shows thickened Achilles tendon, consistent with tendinosis, and superimposed partial-thickness tear (arrow) at calcaneal insertion, associated with retrocalcaneal bursitis (black arrowhead), Achil- les paratendinitis depicted as edema in the Kager’s fat pad (asterisk) and reactive osteitis of calcaneal tuberosity (white arrowhead)
Haglund’s syndrome is a common cause of posterior heel pain and swelling at the Achilles tendon insertion (Figure 10B). This condition is caused by mechanical irritation and compression of the Achilles tendon, and retrocalcaneal and retro-Achilles bursae by a stiff heel counter in certain types of athletic footwear as well as in pump style shoes. Prominent convex tuberosity of the calcaneus, aka bursal projection, creates an anatomic predisposition to this condition, while chronic irritation of the bone causes further enlargement of the tuberosity and propensity for recurrent symptoms [36,37].
“Tennis leg” is a relatively common clinical condition presenting as acute pain in the mid-calf, associated with a snapping sensation, which commonly occurs during athletic activities. Although originally attributed to injury to the plantaris tendon, injuries of the gastrocnemius muscle, in particular its medial head, are much more common (Figure 11) [38]. Recent studies highlighted a significant number of associated injuries of the soleus muscle and provided detailed MRI anatomic descriptions of the calf complex [39,40].
Figure 11.
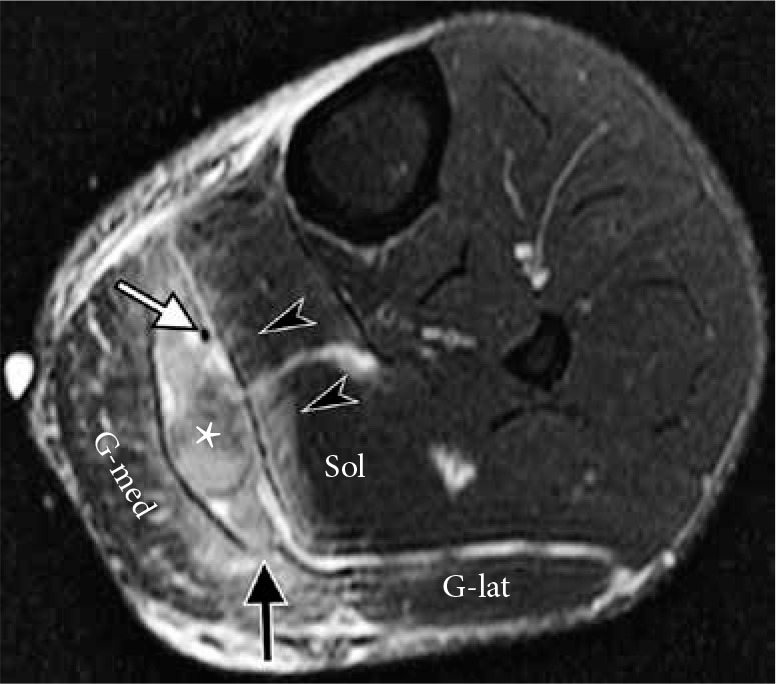
Avulsion of the medial head of the gastrocnemius from gastroc- nemius soleus aponeurosis in a 40-year-old male who felt a pop and pre- sented with calf pain and swelling after diving into a pool. Axial T2-weight- ed fat-suppressed magnetic resonance image of the calf demonstrates hematoma (asterisk) between the soleus muscle (Sol) and medial head of the gastrocnemius (G-med) as well as disruption at the myotendinous junc- tion of the medial head of the gastrocnemius (black arrow); G-lat – lateral head of the gastroenemius. A low-grade strain of the soleus muscle is also present (arrowheads). Note intact plantaris tendon (white arrow) coursing through the hematoma
Medial tendons
The medial group is composed of the posterior tibialis tendon (PTT), flexor digitorum longus, and flexor hallucis longus. The PTT is by far the most biomechanically important tendon and the one most frequently involved in pathologic processes [29]. This is the largest tendon in the medial tendon group. The normal diameter of this tendon is approximately twice the size of the flexor hallucis or flexor digitorum longus tendons, or it approximately equals the size of the combined peroneal tendons (Figure 9). At the level of the ankle, the PTT lies within the groove behind the medial malleolus and is secured in place by the flexor retinaculum. As it passes to the foot further distally, the PTT divides into three components [29,41]. A dominant anterior component includes the principal PTT insertion on the tuberosity of the navicular bone and additional fibres inserting on an inferior capsule of the cuneonavicular joint and medial cuneiform bone. A smaller middle component continues distally to insert on the second and third cuneiform and cuboid bones and form tendinous slips that attach to the bases of the second, third, and fourth metatarsal bones. The posterior component inserts on the sustentaculum tali. Due to its position relative to the ankle joint and subtalar axis, the PTT plantar flexes, adducts, and supinates the foot, and it supports the talar head and prevents it from descending. Failure of the PTT disrupts the normal biomechanics of the foot and leads to pes planus (collapse of the longitudinal arch and plantar flexion of the talus), forefoot abductus, and hindfoot valgus. The talar head becomes uncovered by the navicular bone and loses its osseous support. Hindfoot valgus leads to lateral hindfoot impingement that encompasses talocalcaneal and subfibular impingement [42]. Medial ankle pain is a typical presenting symptom in the early stages of the PTT dysfunction; however, with the development of hindfoot valgus and lateral impingement, lateral symptoms tend to predominate. As the PTT dysfunction progresses, flexible flat foot deformity is followed by a fixed flat foot deformity.
A spectrum of clinical findings referred to as PTT dysfunction includes various morphologic changes in PTT and results in global biomechanical abnormalities. Morphologic changes of the PTT depicted on MRI include tendinosis, represented by tendon enlargement beyond the physiologic range, partial-thickness tears demonstrated by either calibre change or increased intrasubstance signal, and tenosynovitis (Figure 12) [29]. Secondary findings can be observed in the adjacent bone and soft tissues, particularly in a superficial deltoid and spring ligament complex (Figure 13). Associated compressive changes can be seen on the lateral side manifested by sinus tarsi edema and findings of lateral hindfoot impingement (Figure 13) [42]. The more current term acquired adult flatfoot deformity (AAFD) encompasses a wider spectrum of pathologic and clinical findings that start with PTT dysfunction medially and progress to subsequently include abnormalities on lateral and plantar foot, malalignment, and secondary degenerative changes [28,29]. The staging system of AAFD is based on objective findings, such as normal alignment (stage I) or the presence of flexible (stage II) or rigid (stage III) flatfoot deformity. Stage IV is characterised by lateral hindfoot impingement, tibiotalar valgus, and secondary osteoarthritis [43]. Weight-bearing radiography is essential for accurate assessment and treatment planning. MRI serves a supplemental role by providing additional characterisation of the osseous, tendinous, and ligamentous abnormalities. The range of treatment options includes non-operative treatment in early stages with rest, bracing, and physical therapy, or an operative treatment in more advanced stages that includes tendon transfer, corrective osteotomies, and ligamentous repair or reconstruction.
Figure 12.
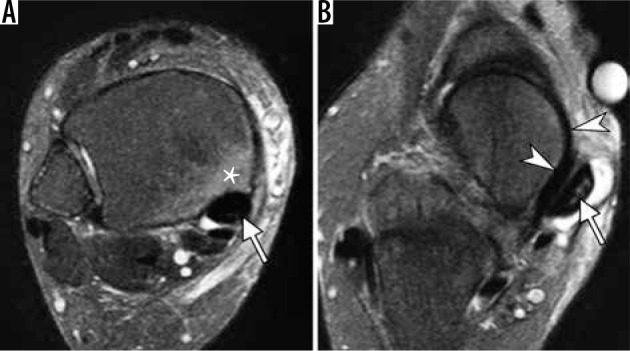
Abnormalities of the posterior tibialis tendon (PTT) in a 64-year- old woman with adult acquired flat foot deformity. Axial fat-suppressed T2-weighted magnetic resonance images of the ankle demonstrate abnor- mally enlarged PTT (arrow, A) with increased intrasubstance signal (arrow, B), indicative of tendon degeneration and intrasubstance tearing; prominent tenosynovitis with fluid distending PTT tendon sheath (B); osseous hyper- trophy and a bone marrow edema like signal (asterisk in A) in the medial malleolus representing reactive osteitis. Note intact superomedial bundle of spring ligament (arrowheads in B) coursing between the talar head and PTT. In b, note incomplete bone coverage of the talar head by the navicular in keeping with pes planus
Figure 13.
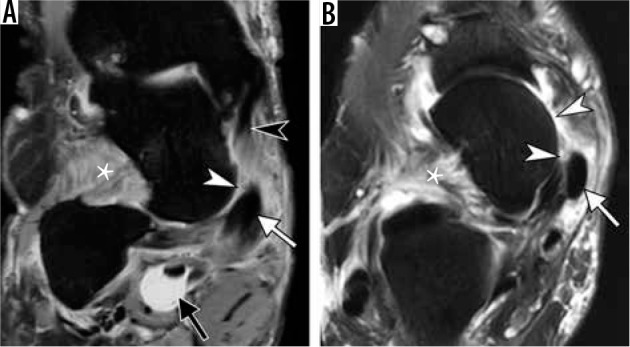
Adult acquired flat foot deformity in a 67-year-old woman. Coro- nal fat-suppressed proton-density-weighted (A) and axial T2-weighted (B) magnetic resonance images of the ankle demonstrate mildly enlarged pos- terior tibialis tendon (PTT) (arrow). There is complete degenerative tear of the superomedial bundle of the spring ligament (white arrowheads) with soft tissue edema and absence of the ligament along its expected course be- tween PTT and talar head and distal to tibiospring portion of the superficial deltoid (black arrowhead in A). Prominent soft tissue edema is present in the sinus tarsi (asterisk). There is a marked distension of the flexor hallucis longus tendon sheath (black arrow in A). Note increased lateral angulation of the calcaneus (A) consistent with hindfoot valgus and incomplete bony coverage of the talar head by the navicular (B) in keeping with pes planus
Figure 14.
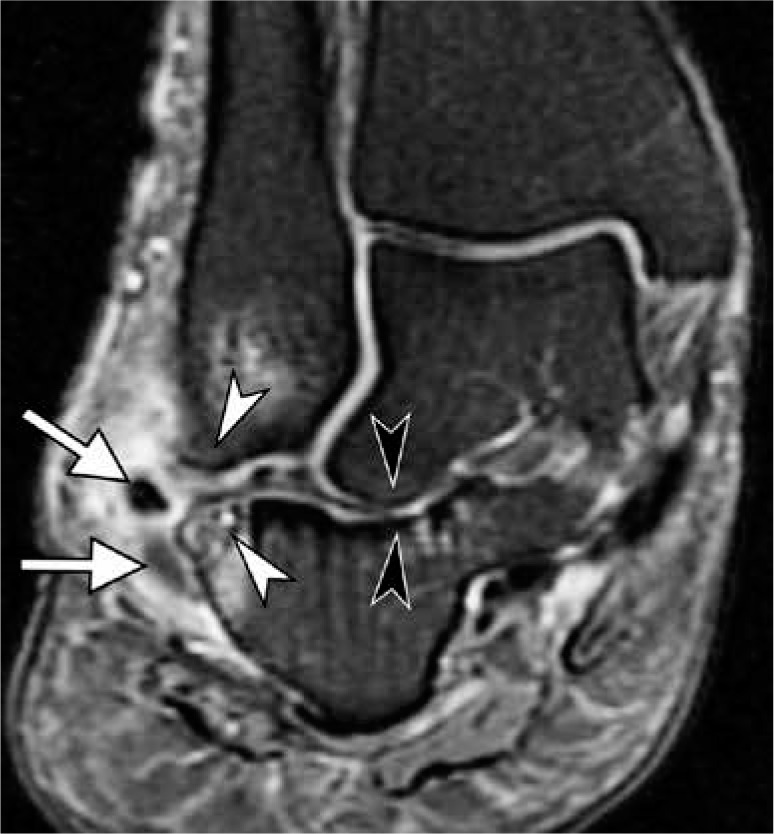
Lateral hindfoot impingement in a 47-year-old woman with advanced acquired adult flatfoot deformity due to chronic posterior tibialis tendon dysfunction. Coronal fat-suppressed proton-density-weighted mag- netic resonance image depicts talocalcaneal impingement with obliteration of the sinus tarsi and abnormal contact between lateral talar process and calcaneus with sclerotic changes (black arrowheads), as well as subfibular impingement with bone marrow edema like signal, osseous hypertrophy and sclerosis at opposing surfaces of fibula and calcaneus (white arrow- heads). Note lateral subluxation of the peroneal tendons (arrows) with tendinosis and prominent surrounding inflammation
Lateral tendons
The lateral tendon group is represented by peroneus longus (PL) and brevis tendons. Comprehensive analysis of the PL should include its entire course from the lower leg to the plantar foot at its insertion [44,45]. Evaluation of the distal PL tendon is particularly important. Its dominant insertion on the plantar base of the first metatarsal and medial cuneiform and additional variable tendinous slips act to stabilise the first tarsometatarsal joint and the Lisfranc joint as well as support the tarsometatarsal arch [45-47]. At the retromalleolar groove of the fibula, the peroneus brevis (PB) tendon is normally located anteromedially to the PL tendon (Figure 9) [48]. Both tendons are secured in their position in the fibular groove by the superior peroneal retinaculum [49]. Further distally, both tendons run in the shallow canal created by the calcaneus and inferior peroneal retinaculum where the PB tendon is located anterior to the PL tendon, separated by a peroneal trochlea (aka peroneal tubercle) [49]. The PB tendon inserts on the lateral aspect of the base of the fifth metatarsal. The retromalleolar groove is the most common site of peroneal tendon instability. Tendon subluxation or dislocation more commonly affects the PL, although both tendons may be affected, which typically manifests as intermittent painful snapping at the lateral ankle. Oden’s classification divides traumatic injuries to the superior peroneal retinaculum into four types [50], distinguishing periosteal stripping (Figure 15), tearing, or avulsion fracture at fibular attachment of the retinaculum and, least common, posterior tearing of the retinaculum. Although MRI provides detailed anatomic information, dynamic ultrasound is more sensitive in diagnosing transient tendon subluxation [51], and it is the imaging modality of choice for evaluation of intra-sheath subluxations [48]. Peroneal tendon tears may be caused by acute trauma, repetitive microtrauma due to instability, and by attrition and degeneration[48]. Full-thickness tears cause complete tendon discontinuity with various degrees of retraction, while partial-thickness tears are diagnosed based on tendon thinning or tendon thickening that is associated with intrasubstance intermediate or high signal intensity. The most common type of peroneal tendons tear is a longitudinal split tear of the PB tendon at the retromalleolar groove (Figure 16), frequently with distal reconstitution at the level of the peroneal tubercle [48]. Such tears result from a combination of anatomic factors and dynamic mechanical stress related to the position of the PB tendon, the morphology of the fibular groove, anomalous low-lying PB muscle belly, or accessory peroneus quartus (PQ) muscle, and the laxity of the superior peroneal retinaculum [52]. Intratendinous ganglion cysts, although uncommon in general, can be encountered in a setting of chronic peroneal tendon tear and mucoid degeneration [48,53]. The PL tendon is most commonly torn at the level of the cuboid groove where it is subjected to high shear stresses because of acute tendon turn [45]. The os peroneum is a sesamoid bone imbedded in the PL tendon at the level of the calcaneocuboid joint. It may be fibrocartilaginous or ossified; single, bipartite, or multipartite. Painful os peroneum syndrome (POPS) represents a spectrum of entities associated with plantar lateral foot pain [54]. Such entities include acute and chronic fractures of the os peroneum or a diastasis of a multipartite os peroneum (Figure 17), leading to loss of continuity of the PL tendon and, in a chronic setting, stenosing PL tenosynovitis; attrition, partial or complete rupture of the PL tendon adjacent to the os peroneum; or entrapment of PL due to presence of a large peroneal tubercle, typically measuring more than 4–5 mm from the calcaneal surface on axial images [55]. When evaluating the integrity of the os peroneum, fragment separation of 2 mm or less may be seen with nondisplaced os peroneum fractures and bipartite os peroneum, while a greater separation, 6 mm or more, indicates os peroneum fracture or diastasis, that are associated with a full-thickness PL tendon tear [56]. Treatment options for disorders of peroneal tendons and retinacula are based on the chronicity of the injury, patient’s age, and functional demands. Conservative treatment with bracing, anti-inflammatory medications, and physical therapy is a typical first line of treatment. When peroneal tendon tears are treated surgically, if more than 50% of the tendon is intact, debridement or repair can be attempted. However, tenodesis or tendon reconstruction is considered if less than 50% of the tendon remains intact after the debridement. Correction of underlying osseous malalignment such as a pes cavus and hindfoot varus oftentimes needs to be performed to prevent recurrent tears. Surgical excision of symptomatic PQ muscle may be performed. In cases of peroneal tendon instability refractory to conservative measures, multiple procedures restoring superior peroneal retinaculum are described. Such procedures include primary repair, bone block procedures or reinforcement with local tissue transfer, tendon rerouting, and groove-deepening procedures. For painful os peroneum, both surgical and nonsurgical treatment options are available [48].
Figure 15.
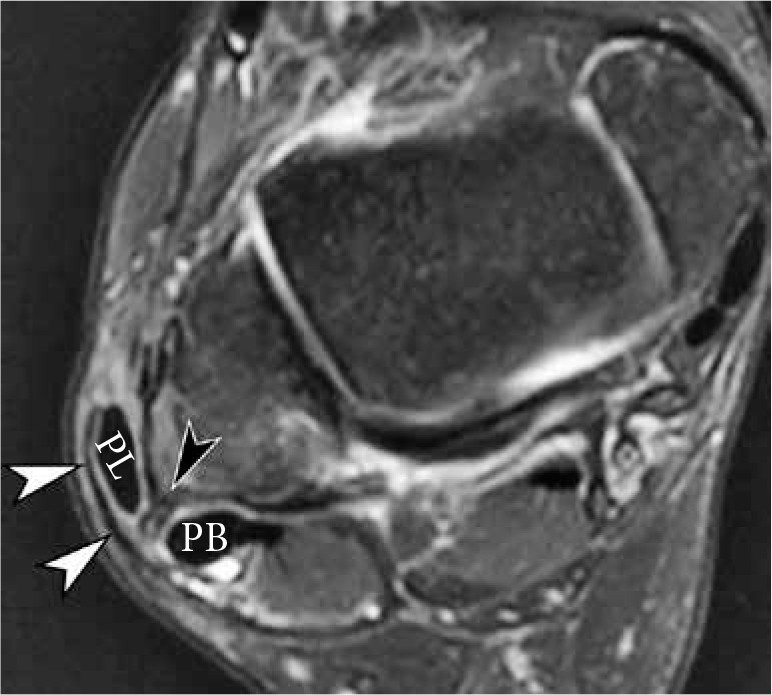
Injury of the superior peroneal retinaculum (SPR) in a 46-year-old woman presenting with pain and snapping sensation over the lateral malle- olus 3 months after injury. Axial fat-suppressed T2-weighted magnetic reso- nance image of the ankle demonstrates stripping of SPR (white arrowheads) and anterolateral subluxation of peroneus longus tendon. Note a fibrous ridge at the expected fibular attachment of SPR (black arrowhead). Peroneus brevis tendon is located at the lateral aspect of the retromalleolar groove
Figure 16.
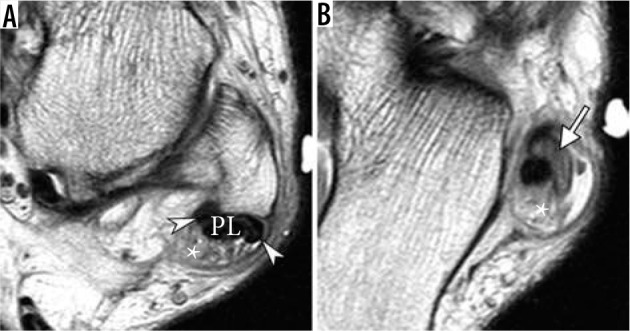
Longitudinal split tear of peroneus brevis (PB) tendon in a 47-year-old man, presenting with lateral ankle pain three months after injury. Axial proton-density-weighted magnetic resonance images of the ankle demonstrate a longitudinal split tear of the PB tendon (arrowheads) with its fibers, also referred to as “hemitendons”, located both medial and abnormally lateral to peroneus longus tendon. There is reconstitution of PB tendon below the lateral malleolus with mucoid changes within the tendon (arrow in B). Note prominent peroneal tenosynovitis (asterisk)
Figure 17.
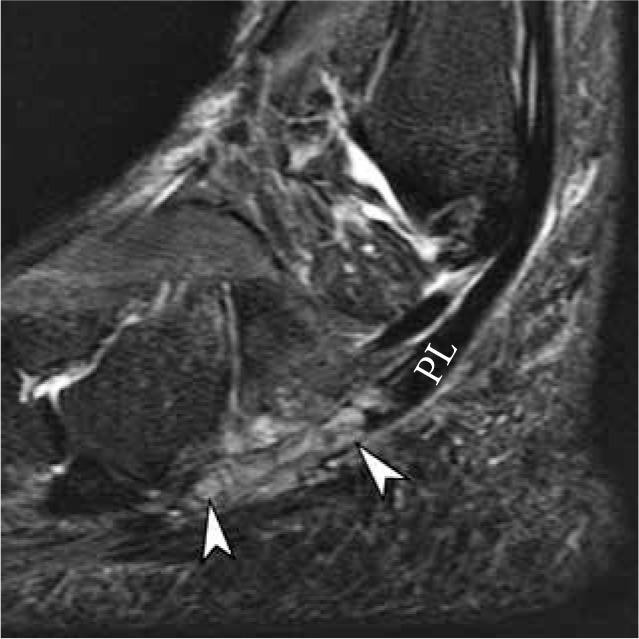
Painful os peroneum syndrome with traumatic diastasis of bi- partite os peroneum in a 56-year-old woman after a fall. Sagittal short TI inversion recovery magnetic resonance (MR) image demonstrates distrac- tion and edema of the proximal and distal ossicles of bipartite os perone- um (arrowheads), equivalent to a complete peroneus longus tendon tear. The ossicles may be difficult to identify on fluid sensitive sequences due to bone contusions and surrounding soft tissue swelling. Correlation with T1-weighted MR images and radiographs is essential. The proximal stump of the torn PL tendon is retracted into the inframalleolar region
Accessory muscles and tendons
Accessory muscles are commonly encountered as incidental asymptomatic findings on ankle and foot MRI [57,58] (Figure 18). In some cases, accessory muscles may be associated with symptoms due to impingement of the surrounding structures, tarsal tunnel syndrome, or they may subsequently present as a mass lesion. The nomenclature of the accessory peroneal muscles is somewhat confusing because of the large number of variations of these accessory muscles and nonuniform terminology [59]. Therefore, the exact prevalence of each variant may be difficult to determine. The peroneus tertius tendon and muscle are reportedly present in up to 95% of specimens in cadaveric studies. They are located in the anterior compartment of the leg, originating from the distal fibula or extensor digitorum longus muscle [58]. The tendon passes deep to the extensor retinaculum and inserts onto the base and dorsal surface of the fifth metatarsal. On the lateral side posteriorly, the PQ is the commonly found accessory muscle with a prevalence of 16% (Figure 9). PQ may originate at the posterior surface of the fibula, PL, or PB muscle. Multiple variations of the insertion are reported, retrotrochlear eminence at the lateral aspect of the calcaneus, posterior to the peroneal tubercle, being the most common site [60]. The clinical significance of the PQ muscle is the potential for crowding of the peroneal tendons deep to the superior peroneal retinaculum, which predisposes them to tendinopathy, tears, tenosynovitis, and instability [61]. The tendon of the accessory PQ muscle can also mimic longitudinal split tear of the peroneal tendons. The four commonly described accessory muscles in the posterior medial ankle include flexor digitorum accessorius longus (FDAL), accessory soleus, peroneocalcaneus internus (PCI), and tibiocalcaneus internus (TCI). The key features that differentiate these muscles include their position with respect to the flexor hallucis longus (FHL) muscle, to the neurovascular bundle and to the flexor retinaculum and deep aponeurosis of the lower leg [57,58]. The accessory soleus muscle is the only muscle located superficially to the deep aponeurosis, with a reported prevalence of 0.7-5.5%. The insertion of the accessory soleus at the superior or medial aspect of the calcaneus may be flashy or tendinous. When symptomatic, the accessory soleus may present as a painless or painful mass. FDAL is one of the most common accessory muscles in the ankle with 6–8 % prevalence (Figure 9) [62]. Its origin is extremely variable and includes any structure of the posterior compartment of the lower leg. The FDAL tendon travels with the posterior tibial neurovascular bundle in the tarsal tunnel and inserts on the quadratus plantae muscle or FDL tendon, but, unlike TCI of PCI, it does not insert on the calcaneus. The presence of the accessory FDAL can be associated with tarsal tunnel syndrome [63]. The PCI in TCI are much less commonly encountered accessory muscles (1% or unknown prevalence on imaging, respectively). The PCI originates from the fibula and travels laterally to the FHL muscle, inserting on the base of the sustentaculum. The TCI muscle originates from the tibia, travels posteriorly to the FHL within the tarsal tunnel and superficially to the neurovascular bundle, and inserts on a medial calcaneus; the latter feature distinguishes it from FDAL.
Figure 18.
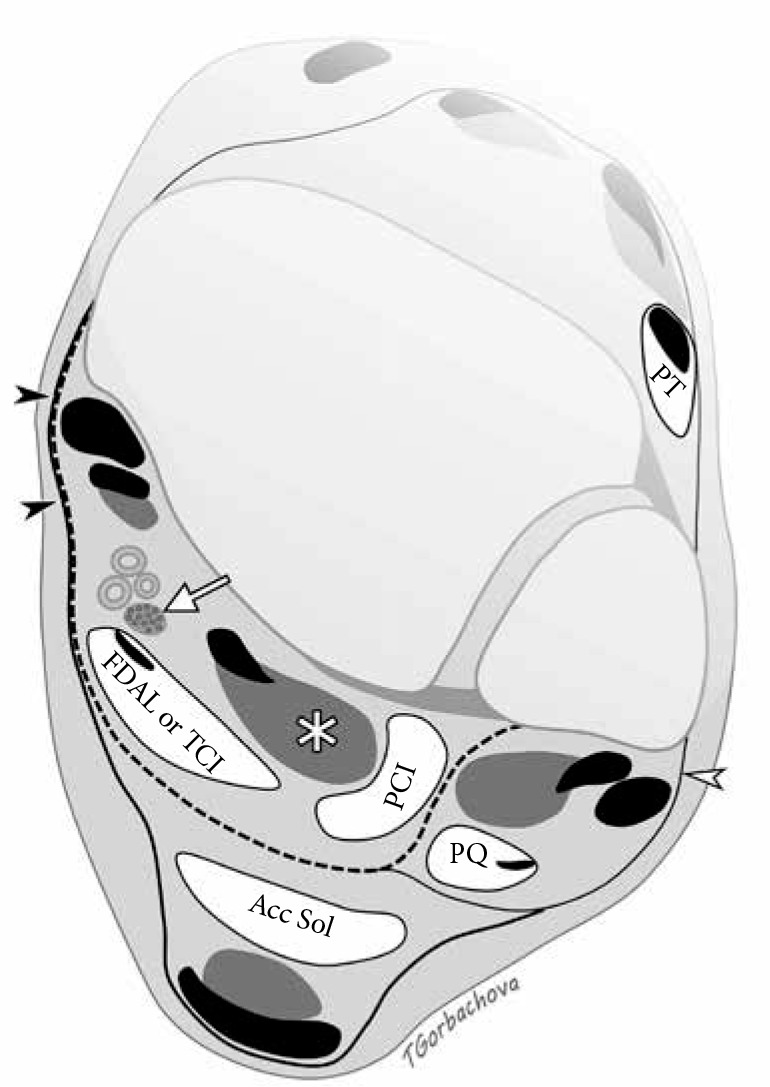
Accessory muscles of the ankle. Axial drawing illustrates location of common accessory muscles relative to the flexor hallucis longus (FHL) muscle (asterisk), deep aponeurosis (dashed line), and neurovascular bundle including posterior tibial nerve (arrow). Flexor retinaculum (black arrowheads) is formed by fusion of the superficial and deep aponeurosis. Accessory soleus muscle (Acc Sol) is located superficially to the deep aponeurosis. Peroneal calcaneus internus muscle is situated laterally to FHL. Both flexor digitorum accessorius longus and tibiocalcaneus internus muscles are located deep to the aponeu- rosis and posteromedial to the FHL; they can be differentiated by tracing their insertions distally. Peroneus quartus travels posteromedial to the peroneal tendons encircled by superior peroneal retinaculum (white arrowhead). Pero- neus tertius is located in the anterior compartment
Plantar fascia
The plantar fascia is a strong aponeurotic structure extending from the calcaneal tuberosity to the metatarsal heads and proximal phalanges, and it consists of three major components: the medial (or tibial), central, and lateral (or peroneal) limbs (a.k.a. cords or components). The dominant component of the aponeurosis is the central part that attaches to the medial tuberosity of the calcaneus and adheres to the flexor digitorum brevis muscle and extends into the toes. The central cord may receive contribution from the Achilles tendon. A smaller lateral component extends from the lateral margin of the calcaneal tuberosity, blending with the fascia of the abductor digiti minimi, and attaching to the base of the fifth metatarsal. A very thin medial part of the plantar aponeurosis forms a fascia of the abductor hallucis muscle. Being primarily a static stabiliser, the plantar fascia is an important structure supporting the longitudinal arch of the foot. It also provides dynamic stability during the gait, transmitting forces between the hindfoot and forefoot generated by the Achilles tendon [29,64,65]. On MRI, a normal plantar fascia demonstrates smooth margins without thickening or nodularity, and it measures less than 4 mm in thickness. The plantar fasciitis represents a painful inflammation of the plantar fascia and perifascial structures, produced by mechanical, degenerative, and systemic causes. Pathologic changes typically affect the proximal third of the central cord of the plantar fascia and manifest as heel pain. The MRI findings of plantar fasciitis depend on the activity of the process and degree of adjacent inflammatory changes. Typical findings include abnormal thickening of the plantar fascia or subtle contour nodularity, abnormal intrasubstance signal, as well as perifascial edema. Associated bone marrow edema-like signal and erosive or proliferative changes can be seen in the calcaneus. Plantar fascia rupture frequently accompanies plantar fasciitis and may occur spontaneously or after local corticosteroid injections; on MRI it is depicted by a gap in the plantar fascia (Figure 19). Insertional lateral cord plantar fasciopathy is a less commonly seen condition that affects the lateral cord of the plantar fascia at its insertion to the base of the fifth metatarsal. The spectrum of MRI findings is similar to the typical abnormalities seen at the calcaneal insertion of the plantar fascia. Lateral cord plantar fasciopathy presents with pain and swelling at the lateral midfoot and clinically may mimic a stress fracture of the fifth metatarsal or peroneal tendon pathology [66]. Plantar fibromatosis is a benign fibrous proliferation depicted on MRI as a distinct nodular thickening of the plantar fascia, most commonly seen along its medial aspect.
Figure 19.
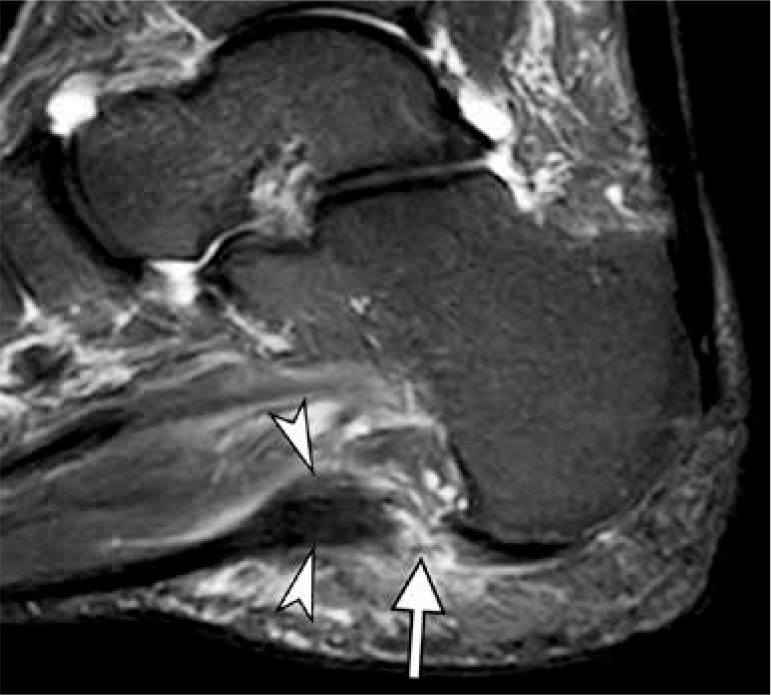
Plantar fasciitis in a 51-year-old woman with an acute exacerba- tion of chronic heel pain after cortisone injection. Sagittal short TI inversion recovery magnetic resonance image of the ankle shows fusiform thickening of the central cord of the plantar fascia (arrowheads) seen in chronic plantar fasciitis. Full-thickness tear of the plantar fascia with complete discontinuity of the fibers and associated high signal intensity (arrow) is present at the calcaneal attachment
Sinus tarsi
The sinus tarsi (also known as tarsal sinus and tarsal canal) is a cone-shaped region along the lateral aspect of the hindfoot located between the posterior subtalar joint and talocalcaneonavicular joint (Figures 6F-G) [67]. This region is mostly filled with fat; however, it also contains arterial anastomoses between the posterior tibial and peroneal arteries, nerve endings, roots of the inferior extensor retinaculum, and two principal ligaments: the talocalcaneal interosseous ligament, located medially, and the cervical ligament, located along the lateral margin of the sinus tarsi [68]. Sinus tarsi syndrome refers to pain and tenderness along the lateral side of the foot with sensation of hindfoot weakness and instability. It can be seen following a sprain of the lateral ligamentous complex and subtalar joint sprain. Also commonly, sinus tarsi syndrome can be associated with PTT dysfunction and hindfoot valgus in which rotation at the subtalar joint causes overloading of the sinus tarsi ligaments [29]. MRI findings of sinus tarsi syndrome include edema or fibrosis, loss of definition of normal ligaments within sinus tarsi (Figure 13), and fluid collections such as ganglion cysts, posterior subtalar joint recess, or a sinus tarsi bursa, also known as Gruberi bursa.
Tarsal tunnel
The tarsal tunnel is a fibro-osseous channel located posteriorly and inferiorly to the medial malleolus with a roof formed by the flexor retinaculum. The tarsal tunnel can be subdivided into an upper tibiotalar tunnel at the level of the ankle joint and lower talocalcaneal tunnel in the hindfoot, the latter considered a true anatomic tarsal tunnel [63]. The tunnel contains medial ankle tendons, posterior tibial artery and vein, and posterior tibial nerve. The posterior tibial nerve bifurcates into the medial and lateral plantar nerves along the course of the tarsal tunnel or, less commonly, proximal to the tunnel. Tarsal tunnel syndrome represents a compressive neuropathy of the posterior tibial nerve. Patients typically present with pain, paresthesias and sensory loss along the plantar aspect of the foot. This spectrum of abnormalities producing the syndrome includes space occupying lesions, such as tumor, ganglia, varicosities or accessory muscles, traumatic injuries, congenital or acquired foot deformities, as well as systemic diseases such as diabetes and peripheral vascular disease, or idiopathic condition which can be seen in up to 40% of patients. MRI can identify space occupying lesions that produce posterior tibial nerve entrapment within the tunnel (Figure 20).
Figure 20.
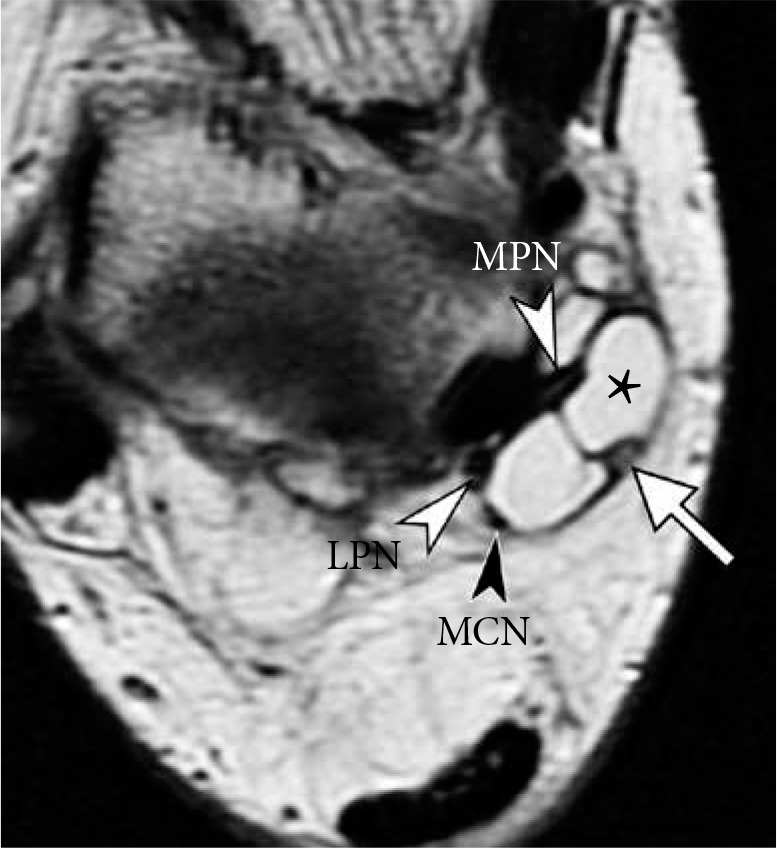
Tarsal tunnel syndrome in a 48-year-old woman. Axial proton density weighted magnetic resonance image of the ankle shows a lobulated soft tissue ganglion (asterisk) splaying the contents of the tarsal tunnel: medial plantar nerve (white arrowhead, MPN), lateral plantar nerve (white arrowhead, LPN), medial calcaneal nerve (black arrowhead, MCN) and pos- terior tibial artery (arrow)
Transverse tarsal joint (Chopart joint complex)
Situated between commonly injured ankle and Lisfranc joints, transverse tarsal joint, also referred as Chopart joint or midtarsal joint, received relatively little attention in the literature until recent years. Transverse tarsal joint complex includes calcaneocuboid and talocalcaneonavicular joints; injuries of these two components commonly coexist and often they are associated with acute lateral ankle injuries, which may dominate clinical presentation [30,69,70]. The anatomic structures that should be routinely examined on clinical MRI include dorsal talonavicular ligament, spring ligament complex (described in earlier section on ankle ligaments), bifurcate ligament (also known as “the key to Chopart joint”, composed of lateral calcaneonavicular and medial calcaneocuboid ligaments), dorsolateral calcaneocuboid ligament, inferior calcaneocuboid ligaments (also known as short and long plantar ligaments) [71]. Presence of osseous injuries such as fractures of the anterior process of the caclaneous [72,73] and osteochondral injuries at the plantar aspect of the talar head [74] should prompt careful evaluation for additional injuries along the transverse tarsal joint complex (Figure 21).
Figure 21.
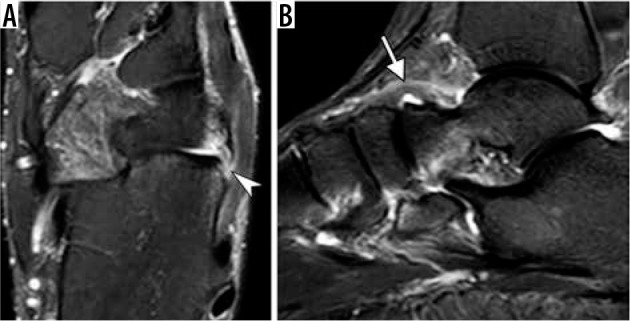
Chopart joint injury. Axial fat-suppressed T2-weighted magnetic resonance (MR) image (A) of the ankle in a 35-year-old man demonstrates calcaneal avulsion of dorsolateral calcaneocuboid ligament (arrowhead). Sagittal short TI inversion recovery MR image in a 54-year-old woman shows thickening and edema of the dorsal talonavicular ligament consistent with a moderate grade sprain (arrow)
Tarsometatarsal joint (Lisfranc joint complex)
Lisfranc joint complex spans the first through fifth tarsometatarsal joints and provides stability to the midfoot and forefoot. The medial cuneiform and first metatarsal bone form an independent medial tarsometatarsal joint. The second and third metatarsal bones and intermediate and lateral cuneiform bones form the intermediate tarsometatarsal joint, which may communicate with the intercuneiform and cuneonavicular joints of the midfoot. The base of the fourth and fifth metatarsal bones and the distal aspect of the cuboid form the lateral tarsometatarsal joint. When unrecognized, Lisfranc injuries lead to chronic pain, midfoot instability and osteoarthritis [75].The osseous and ligamentous anatomy is complex and it is important to evaluate the dorsal, interosseous and plantar components of the Lisfranc ligamentous complex (Figure 22) [76]. The interosseous component, or a Lisfranc ligament proper, is considered the strongest and most important biomechanically, with the interosseous ligament coursing from the medial cuneiform, C1, to the base of the second metatarsal, M2; this component is often formed by two distinct bundles [76]. The plantar Lisfranc ligament is also critical for stability, it has two bundles extending from the medial cuneiform to the bases of the second and third metatarsals (C1M2 and C1M3). High grade injuries of the plantar ligament are highly suggestive of unstable midfoot that requires surgical stabilization [77]. MRI can detect ligamentous injury, bone contusions and fractures along the tarsometatarsal joint [16]. The cortical avulsion fractures occur at attachment sites of key ligaments; such injuries produce instability despite intact appearance of the ligaments on MRI. Various imaging modalities serve complimentary roles in assessment of Lisfranc joint injuries. CT is superior to MRI in detection of cortical fractures, in particular small fracture fragments, while MRI has the greatest advantage in evaluation soft-tissue and ligamentous injuries and bone contusions (Figure 23) [75,78].
Figure 22.

Normal magnetic resonance imaging anatomy of Lisfranc ligamentous complex in a 51-year-old man. Fat-suppressed coronal pro- ton-density-weighted magnetic resonance (MR) image (A) and axial T2-weighted MR images (B and C) demonstrate normal appearance of the dorsal ligament (black arrow in A, a thick interosseous component (white arrows in A and C) composed of two distinct bands in this individual, and a plantar component with its two bands extending from the medial cunei- form (C1) to the bases of second (M2) and third (M3) metatarsals (white arrowheads in A and C). The plantar Lisfranc ligament can be identified immediately subjacent to the distal peroneus longus tendon which courses more superficially (black arrowhead in C). In B, note normal alignment of the second ray with medial side of second metatarsal (M2) flush with mid- dle/second cuneiform (C2)
Figure 23.
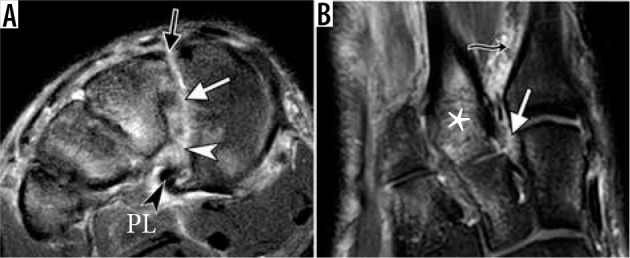
Lisfranc injury in a 17-year-old boy who sustained injury play- ing football. Fat-suppressed coronal proton-density-weighted (A) and axial T2-weighted (B) magnetic resonance images demonstrate complete disrup- tion of the dorsal (black arrow in A), interosseous (white arrow in A and B), and plantar (white arrowhead in A) components of the Lisfranc ligament complex. Multiple bone contusions are present in the midfoot, most prom- inent at the base of second metatarsal bone (asterisk in B). Characteristic soft tissue edema is seen between the first and second metatarsals (wavy arrow in B). Intact peroneus longus tendon (black arrowhead in A) is seen near its insertion to the medial cuneiform. Note subtle lateral step-off along the medial margin of second metatarsal and middle cuneiform bones (B)
Turf toe and pathological conditions of the lesser metatarsophalangeal joints
The term “turf toe” refers to a spectrum of traumatic injuries of the capsuloligamentous structures of the first metatarsophalangeal (MTP) joint, typically resulting from a hyperextension injury. Initially, it was described in association with sports injuries occurring on artificial turf. However, first MTP joint injuries can be encountered in various traumatic settings [79,80]. The anatomy of the capsular ligamentous structures of the first MTP joint is best viewed as a confluence of structures converging on the medial and lateral sesamoids embedded in a firm fibrous structure at the plantar aspect of the first MTP joint, referred to as a plantar plate [79,80]. Various components of the plantar plate are named in reference to connections between the sesamoids and adjacent bones: intersesamoid ligament, medial and lateral sesamoid phalangeal ligaments, and medial and lateral sesamoid metatarsal ligaments. In addition, collateral ligaments are distinguished and represented by medial and lateral main collateral ligaments and accessory sesamoid ligaments. The plantar capsule is also reinforced by tendinous insertions including abductor hallucis medially, transverse and oblique heads of the adductor hallucis laterally, and medial and lateral heads of the flexor hallucis brevis running along the plantar surface medial and lateral. Individual components of this complex should be assessed on MRI. The spectrum of traumatic injuries of the first MTP joint includes various grades of ligamentous injury, tendon injury, osteochondral and osseous injuries and diastasis of the bipartite sesamoid (Figure 24). The clinical implication of “turf toe” is potential destabilization of the metatarsal sesamoid phalangeal complex, resulting in a debilitating injury.
Figure 24.
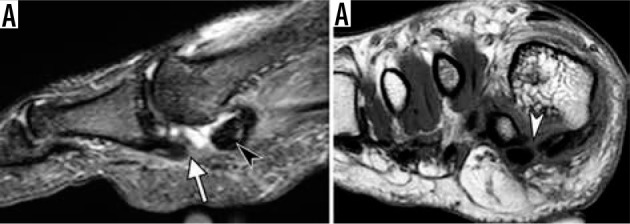
Turf toe. Sagittal short TI inversion recovery (A) and coronal T1-weighted (B) magnetic resonance images of the first metatarsophalan- geal joint in a 19-year-old man who sustained injury of capsular ligamen- tous complex of the great toe when landing from a skateboard jump a few weeks prior. There is a complete rupture of the medial sesamoid phalangeal ligament at its proximal attachment (arrow in A) associated with a fluid- filled gap and proximal retraction of medial sesamoid (black arrowhead in A) and rupture of the inter-sesamoid ligament (white arrowhead in B)
In contrast to traumatic injuries to the plantar plate of the first MTP joint, pathology of the plantar plate of the lesser toes is typically encountered in atraumatic setting as a result of chronic degeneration [80]. The plantar plate of the lesser MTP joints is identified as a low signal intensity U-shaped band deep to the flexor tendon. It is important to evaluate this structure on contiguous coronal and sagittal images, so that peripheral or distal partial thickness tears are not overlooked [80]. Differential diagnosis of abnormalities of the lesser MTP joint capsule on MRI frequently revolves around plantar plate tears and Morton’s neuroma, as both can present as soft tissue lesions and loss of normal fat in the intermetatarsal space [81]. Morton’s neuroma, aka interdigital neuroma, is a pseudoneuroma, a nonneoplastic lesion caused by a perineural fibrosis along the common plantar digital nerve. It is typically depicted as a teardrop or a dumbbell soft tissue mass centered at the intermetatarsal space (Figure 25). The most common locations are the interspace between the third and fourth toes (third web space), followed by the interspace between the second and third toes; however, any intermetatarsal space may be affected and multiple Morton’s neuromas are frequently encountered [82,83]. Because of variable composition of the inflammatory and fibrotic tissue, the appearance of Morton’s neuroma on fluid sensitive sequences and degree of gadolinium enhancement are highly variable [84]. Compared to fluid sensitive sequences, T1-weighted sequence allows greater conspicuity and thus more reliable identification of this lesion, showing neuroma as a mass isointense to the muscle replacing normal fat at the plantar aspect of the intermetatarsal space with a variable degree of dorsal intermetarsal extension. Pericapsular fibrosis associated with plantar plate and capsular tears can mimic Morton’s neuroma [81]. In such cases, an eccentric location of the mass, adherent to the capsule rather than centered over the interdigital space, as well as a presence of primary and secondary signs of plantar plate tear provide helpful diagnostic clues (Figure 26) [85]. Intermetatarsal bursitis is commonly associated with both abnormalities. It is important to remember that the presence of Morton’s neuroma or metatarsal bursitis does not imply symptomatology; only larger lesions or bursal collections tend to correlate with symptoms [82,83]. Treatment options for symptomatic Morton’s neuromas include conservative measures, such as footwear modifications and steroid injections, minimally invasive therapy, such as cryoneurolysis, radiofrequency or alcohol ablation or high-intensity laser therapy, and surgical procedures, such as digital neurectomy, percutaneous osteotomy and intermetatarsal ligament release, for refractory lesions [86].
Figure 25.
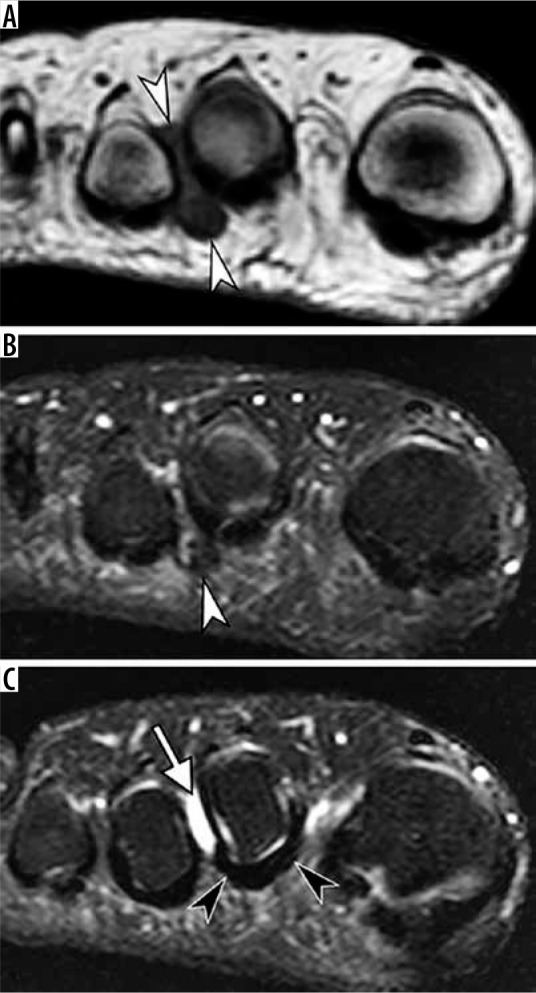
Morton’s neuroma in a 33-year-old man. Coronal T1 weighted (A) and fat-suppressed T2-weighted (B and C) magnetic resonance (MR) images of the forefoot at the level of the second metatarsophalangeal joint space (A and B) and slightly more proximally (C) demonstrate a teardrop mass centered at the second intermetatarsal space (white arrowheads) consistent with interdigital neuroma. The mass is much more conspicuous on the background of normal fat on T1-weighted MR image compared to a fluid sensitive sequence. Note second intermetatarsal bursitis (white arrow in C) as well as normal uniformly hypoin- tense plantar plate of the second metatarsophalangeal joint (black arrowheads)
Figure 26.
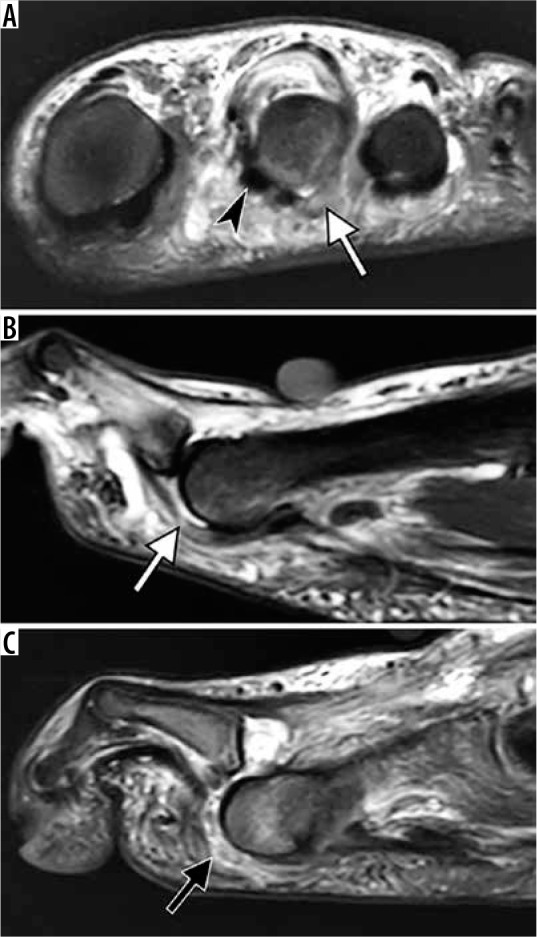
Degenerative plantar plate tears of the lesser metatarsophalan- geal joints in two different patients. Coronal fat-suppressed T2-weighted (A) and sagittal short TI inversion recovery (STIR) (B) magnetic resonance (MR) images of the second metatarsophalangeal (MTP) joint in a 58-year-old woman demonstrate chronic tear of the plantar plate and lateral capsule of the second MTP joint with stretched attenuated appearance and increased signal intensity of plantar plate laterally (white arrow) and soft tissue swell- ing about the second MTP joint. Note medial subluxation of the second toe flexor tendon (arrowhead in A) and dorsal subluxation of the second MTP joint (in B). Sagittal STIR MR image of the third MTP joint in a 66-year-old man demonstrates a full-thickness tear of the plantar plate (black arrow) with dorsal dislocation of the MTP joint
Pedal infection
MRI evaluation for osteomyelitis is a common clinical request in a setting of penetrating wound, soft tissue ulcer, after surgery and particularly in diabetic foot infection. MRI allows to define the presence and extent of marrow involvement, soft tissue collections and thus helps surgical planning (Figure 27) [87,88]. On fluid sensitive images, the presence of an edema-like marrow signal is a sensitive, although not specific sign of bone marrow involvement by infection. Loss of a normal fatty signal on T1 weighted images, particularly in a confluent pattern, is a more specific sign as it indicates marrow replacement rather than reactive marrow changes [89]. Secondary signs such as underlying skin ulcer, sinus tract, abscess and cortical interruption increase diagnostic confidence [90]. Recent studies highlighted that frequently in cases of diabetic foot ulcer, patients who initially demonstrated only a bone marrow edema-like signal and a normal marrow signal on T1 weighted imaging eventually progressed to osteomyelitis based on clinical or MRI criteria [91,92]. Intravenous contrast administration is not critical for diagnosis of marrow changes in osteomyelitis as contrast enhancement generally follows the distribution of the bone marrow edema and lacks specificity. However, contrast-enhanced images are extremely helpful for specific diagnostic tasks, such as delineating a necrotic, non-enhancing bone, or rim enhancing fluid collections, such as abscess and sinus tract. Diffusion-weighted imaging helps in characterizing fluid collections and adds certainty in the diagnosis of abscess, which can be particularly useful in patients with contraindications to intravenous gadolinium based contrast [93,94]. Diagnosis of the osteomyelitis in a setting of neuropathic arthropathy is particularly challenging. In Charcot’s foot, the marrow signal is altered by the presence of sclerosis and a bone marrow edema-like signal due to inflammation and microtrauma. The analysis in such cases is based on the principle that marrow abnormalities in neuropathic foot are articular-centered, while infection is introduced to the bone by a direct spread from a soft tissue ulcer [87]. Continuity between the ulcer and adjacent bone via sinus track and replacement of subcutaneous fat are the cardinal findings that indicate superimposed infection. Loss of normal subcutaneous fat is best depicted on non-fat-suppressed T1-weighted images, while it may be obscured by nonspecific generalized soft tissue swelling of fluid sensitive images (Figure 27). Features favoring neuropathic osteoarthropathy without superimposed infection include periarticular cyst-like changes, intra-articular bodies and preservation of subcutaneous fat deep to the ulcer (Figure 28) [95].
Figure 27.

Osteomyelitis in a 42-year-old diabetic man who previously un- derwent transmetatarsal amputation and currently presented with sepsis and soft tissue ulcer over the lateral aspect of the midfoot. There is replace- ment of a normal fatty marrow signal at the bases of the third and fourth metatarsals on coronal T1-weighted magnetic resonance (MR) image (aster- isks in A) and bone marrow edema-like signal on short TI inversion recovery MR image (asterisks in B), indicative of osteomyelitis. Loss of a normal sub- cutaneous fat signal is observed deep near the ulcer (black arrowhead in A) in continuity with bone marrow abnormality; compared to the area of pre- served subcutaneous fat (white arrowhead). Coronal gadolinium contrast enhanced fat-suppressed T1-weighted MR image (C) demonstrates intense bone marrow enhancement (asterisks in C) and depicts non-enhancing si- nus tract (curved arrows) extending from the ulcer to infected bone
Figure 28.
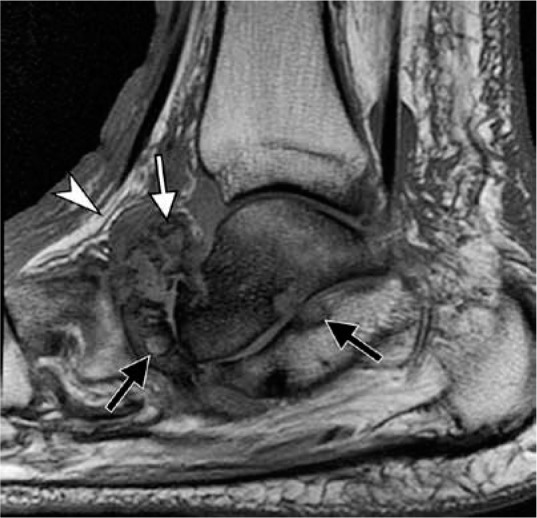
Neuropathic osteoarthropathy without infection in a 64-year- old diabetic man. Sagittal T1-weighted magnetic resonance image demon- strates characteristic articular-centered abnormalities with fragmentation of the navicular bone and intra-articular bone fragments (white arrow), subchondral cyst-like changes (black arrows), preservation of normal sub- cutaneous fat signal (arrowhead) near bone marrow signal abnormality, and absence of skin ulcer. Loss of normal marrow fat signal on T1-weighted images may be related to sclerosis, frequently seen in the setting of Charcot arthropathy without superimposed infection
Conclusions
Interpretation of the MRI of the ankle and foot can be challenging due to complex regional anatomy and a wide range of traumatic and pathologic conditions. Acute and chronic traumatic injuries to the bones, ligaments and tendons, as well as a spectrum of degenerative changes and inflammatory conditions must be recognized. Understanding the biomechanical role of key ligaments and tendons is essential for accurate diagnosis. This review article provides a synopsis of MRI of normal anatomy and pathologic conditions affecting the ankle and foot that are commonly encountered in clinical practice.
Conflict of interest
The author reports no conflict of interest.
References
- 1.Pathria MN, Chung CB, Resnick DL. Acute and stress-related injuries of bone and cartilage: pertinent anatomy, basic biomechanics, and imaging perspective. Radiology 2016; 280: 21-38. [DOI] [PMC free article] [PubMed] [Google Scholar]
- 2.Gorbachova T, Amber I, Beckmann NM, et al. Nomenclature of subchondral nonneoplastic bone lesions. Am J Roentgenol 2019; 213: 963-982. [DOI] [PubMed] [Google Scholar]
- 3.Palmer WE, Levine SM, Dupuy DE. Knee and shoulder fractures: Association of fracture detection and marrow edema on MR images with mechanism of injury. Radiology 1997; 204: 395-401. [DOI] [PubMed] [Google Scholar]
- 4.Mandell JC, Khurana B, Smith SE. Stress fractures of the foot and ankle, part 1: biomechanics of bone and principles of imaging and treatment. Skeletal Radiol 2017; 46: 1021-1029. [DOI] [PubMed] [Google Scholar]
- 5.Mandell JC, Khurana B, Smith SE. Stress fractures of the foot and ankle, part 2: site-specific etiology, imaging, and treatment, and differential diagnosis. Skeletal Radiol 2017; 46: 1165-1186. [DOI] [PubMed] [Google Scholar]
- 6.Rios AM, Rosenberg ZS, Bencardino JT, et al. Bone marrow edema patterns in the ankle and hindfoot: distinguishing MRI features. Am J Roentgenol 2011; 197: W720-W729. [DOI] [PubMed] [Google Scholar]
- 7.Griffith JF, Yi Lau DT, Wai Yeung DK, et al. High-resolution MR imaging of talar osteochondral lesions with new classification. Skeletal Radiol 2012; 41: 387-399. [DOI] [PubMed] [Google Scholar]
- 8.Looze CA, Capo J, Ryan MK, et al. Evaluation and Management of Osteochondral Lesions of the Talus. Cartilage 2017; 8: 19-30. [DOI] [PMC free article] [PubMed] [Google Scholar]
- 9.Elias I, Jung JW, Raikin SM, et al. Osteochondral lesions of the talus: change in MRI findings over time in talar lesions without operative intervention and implications for staging systems. Foot Ankle Int 2006; 27: 157-166. [DOI] [PubMed] [Google Scholar]
- 10.Edmonds EW, Polousky J. A review of knowledge in osteochondritis dissecans: 123 years of minimal evolution from könig to the ROCK study group general. Clin Orthop Relat Res 2013; 471: 1118-1126. [DOI] [PMC free article] [PubMed] [Google Scholar]
- 11.Laor T, Zbojniewicz AM, Eismann EA, et al. Juvenile osteochondritis dissecans: is it a growth disturbance of the secondary physis of the epiphysis? Am J Roentgenol 2012; 199: 1121-1128. [DOI] [PubMed] [Google Scholar]
- 12.Kijowski R, Blankenbaker DG, Shinki K, et al. Juvenile versus adult osteochondritis dissecans of the knee: appropriate MR imaging criteria for instability. Radiology 2008; 248: 571-578. [DOI] [PubMed] [Google Scholar]
- 13.De Smet AA, Ilahi OA, Graf BK. Reassessment of the MR criteria for stability of osteochondritis dissecans in the knee and ankle. Skeletal Radiol 1996; 25: 159-163. [DOI] [PubMed] [Google Scholar]
- 14.Gorbachova T, Melenevsky Y, Cohen M, et al. Osteochondral lesions of the knee: differentiating the most common entities at MRI. Radiographics 2018; 38: 1478-1495. [DOI] [PubMed] [Google Scholar]
- 15.Perrich KD, Goodwin DW, Hecht PJ, et al. Ankle ligaments on MRI: appearance of normal and injured ligaments. Am J Roentgenol 2009; 193: 687-695. [DOI] [PubMed] [Google Scholar]
- 16.Linklater JM, Hayter CL, Vu D. Imaging of acute capsuloligamentous sports injuries in the ankle and foot: sports imaging series. Radiology 2017; 283: 644-662. [DOI] [PubMed] [Google Scholar]
- 17.Akseki D, Pinar H, Yaldiz K, et al. The anterior inferior tibiofibular ligament and talar impingement: a cadaveric study. Knee Surg Sports Traumatol Arthrosc 2002; 10: 321-326. [DOI] [PubMed] [Google Scholar]
- 18.Bassett FH, Gates HS, Billys JB, et al. Talar impingement by the anterioinferior tibiofibular ligament. A cause of chronic pain in the ankle after inversion sprain. J Bone Joint Surg Am 1990; 72: 55-59. [PubMed] [Google Scholar]
- 19.Nikolopoulos CE, Tsirikos AI, Sourmelis S, et al. The accessory anteroinferior tibiofibular ligament as a cause of talar impingement: a cadaveric study. Am J Sports Med 2004; 32: 389-395. [DOI] [PubMed] [Google Scholar]
- 20.Subhas N, Vinson EN, Lee Cothran R, et al. MRI appearance of surgically proven abnormal accessory anterior-inferior tibiofibular ligament (Bassett’s ligament). Skeletal Radiol 2008; 37: 27-33. [DOI] [PubMed] [Google Scholar]
- 21.Rosenberg ZS, Cheung YY, Beltran J, et al. Posterior intermalleolar ligament of the ankle: normal anatomy and MR imaging features. Am J Roentgenol 1995; 165: 387-390. [DOI] [PubMed] [Google Scholar]
- 22.Oh C-S, Won H-S, Hur M-S, et al. Anatomic variations and MRI of the intermalleolar ligament. Am J Roentgenol 2006: 186: 943-947. [DOI] [PubMed] [Google Scholar]
- 23.Hermans JJ, Beumer A, de Jong TAW, et al. Anatomy of the distal tibiofibular syndesmosis in adults: a pictorial essay with a multimodality approach. J Anat 2010; 217: 633-645. [DOI] [PMC free article] [PubMed] [Google Scholar]
- 24.Hunt KJ, Phisitkul P, Pirolo J, et al. High ankle sprains and syndesmotic injuries in athletes. J Am Acad Orthop Surg 2015; 23: 661-673. [DOI] [PubMed] [Google Scholar]
- 25.Brown KW, Morrison WB, Schweitzer ME, et al. MRI findings associated with distal tibiofibular syndesmosis injury. Am J Roentgenol 2004; 182: 131-136. [DOI] [PubMed] [Google Scholar]
- 26.Mengiardi B, Pinto C, Zanetti M. Medial collateral ligament complex of the ankle: MR imaging anatomy and findings in medial instability. Semin Musculoskelet Radiol 2016; 20: 91-103. [DOI] [PubMed] [Google Scholar]
- 27.Mengiardi B, Zanetti M, Schöttle PB, et al. Spring ligament complex: MR imaging-anatomic correlation and findings in asymptomatic subjects. Radiology 2005; 237: 242-249. [DOI] [PubMed] [Google Scholar]
- 28.Mengiardi B, Pinto C, Zanetti M. Spring ligament complex and posterior tibial tendon: MR anatomy and findings in acquired adult flatfoot deformity. Semin Musculoskelet Radiol 2016; 20: 104-115. [DOI] [PubMed] [Google Scholar]
- 29.Flores DV, Gómez CM, Hernando MF, et al. Adult acquired flatfoot deformity: anatomy, biomechanics, staging, and imaging findings. Radiographics 2019; 39: 1437-1460. [DOI] [PubMed] [Google Scholar]
- 30.Melão L, Canella C, Weber M, et al. Ligaments of the transverse tarsal joint complex: MRI-anatomic correlation in cadavers. Am J Roentgenol 2009; 193: 662-671. [DOI] [PubMed] [Google Scholar]
- 31.Resnick D, Kang HS, Pretterklieber ML. Internal derangements of joints. Saunders/Elsevier, 2007.
- 32.Rosenberg ZS, Cheung Y, Jahss MH, et al. Rupture of posterior tibial tendon: CT and MR imaging with surgical correlation. Radiology 1988; 169: 229-235. [DOI] [PubMed] [Google Scholar]
- 33.Fox JM, Blazina ME, Jobe FW, et al. Degeneration and rupture of the Achilles tendon. Clin Orthop 1975; 107: 221-224. [DOI] [PubMed] [Google Scholar]
- 34.Nabil J, Ei-Khoury GY, Saltzman CL, et al. Rupture of the anterior tibial tendon: diagnosis by MR imaging. Am J Roentgenol 1996; 167: 351-354. [DOI] [PubMed] [Google Scholar]
- 35.Pierre-Jerome C, Moncayo V, Terk MR. MRI of the Achilles tendon: a comprehensive review of the anatomy, biomechanics, and imaging of overuse tendinopathies. Acta Radiol 2010; 51: 438-454. [DOI] [PubMed] [Google Scholar]
- 36.Schweitzer ME, Karasick D. MR imaging of disorders of the Achilles tendon. Am J Roentgenol 2000; 175: 613-625. [DOI] [PubMed] [Google Scholar]
- 37.Pavlov H, Heneghan MA, Hersh A, et al. The Haglund syndrome: initial and differential diagnosis. Radiology 1982; 144: 83-88. [DOI] [PubMed] [Google Scholar]
- 38.Delgado GJ, Chung CB, Lektrakul N, et al. Tennis leg: clinical US study of 141 patients and anatomic investigation of four cadavers with MR imaging and US. Radiology 2002; 224: 112-119. [DOI] [PubMed] [Google Scholar]
- 39.Koulouris G, Ting AYI, Jhamb A, et al. Magnetic resonance imaging findings of injuries to the calf muscle complex. Skeletal Radiol 2007; 36: 921-927. [DOI] [PubMed] [Google Scholar]
- 40.Balius R, Alomar X, Rodas G, et al. The soleus muscle: MRI, anatomic and histologic findings in cadavers with clinical correlation of strain injury distribution. Skeletal Radiol 2013; 42: 521-530. [DOI] [PubMed] [Google Scholar]
- 41.Fernandes R, Aguiar R, Trudell D, et al. Tendons in the plantar aspect of the foot: MR imaging and anatomic correlation in cadavers. Skeletal Radiol 2007; 36: 115-122. [DOI] [PubMed] [Google Scholar]
- 42.Donovan A, Rosenberg ZS. Extraarticular lateral hindfoot impingement with posterior tibial tendon tear: MRI correlation. Am J Roentgenol 2009; 193: 672-678. [DOI] [PubMed] [Google Scholar]
- 43.Johnson KA, Strom DE. Tibialis posterior tendon dysfunction. Clin Orthop Relat Res 1989; 239:196-206. [PubMed] [Google Scholar]
- 44.Haddad SL, Myerson MS, Younger A, et al. Symposium: Adult acquired flatfoot deformity. Foot Ankle Int 2011; 32: 95-111. [DOI] [PubMed] [Google Scholar]
- 45.Hallinan JTPD, Wang W, Pathria MN, et al. The peroneus longus muscle and tendon: a review of its anatomy and pathology. Skeletal Radiol 2019; 48: 1329-1344. [DOI] [PubMed] [Google Scholar]
- 46.Sanal HT, Nico M, Chen L, et al. A slip connecting the peroneus longus and tibialis posterior tendons at the forefoot: MRI, anatomic, and histologic findings in a cadaver. Diagnostic Interv Radiol 2011; 17: 343–345. [DOI] [PubMed] [Google Scholar]
- 47.Da M, Gomes R, Pereira Pinto A, et al. Insertional anatomy of peroneal brevis and longus tendon–a cadaveric study. Foot Ankle Surg 2019; 25: 636-639. [DOI] [PubMed] [Google Scholar]
- 48.Taljanovic MS, Alcala JN, Gimber LH, et al. High-resolution US and MR imaging of peroneal tendon injuries. Radiographics 2015; 35: 179-199. [DOI] [PubMed] [Google Scholar]
- 49.Numkarunarunrote N, Malik A, Aguiar RO, et al. Retinacula of the foot and ankle: MRI with anatomic correlation in cadavers. AJR Am J Roentgenol 2007; 188: 348-354. [DOI] [PubMed] [Google Scholar]
- 50.Oden RR. Tendon injuries about the ankle resulting from skiing. Clin Orthop Relat Res 1987; 216: 63-69. [PubMed] [Google Scholar]
- 51.Khoury V, Cardinal E, Bureau NJ. Musculoskeletal sonography: a dynamic tool for usual and unusual disorders. AJR Am J Roentgenol 2007; 188: 63-73. [DOI] [PubMed] [Google Scholar]
- 52.Sobel M, Geppert MJ, Olson EJ, et al. The dynamics of peroneus brevis tendon splits: a proposed mechanism, technique of diagnosis, and classification of injury. Foot Ankle 1992; 13: 413-422. [DOI] [PubMed] [Google Scholar]
- 53.Costa CR, Morrison WB, Carrino JA, et al. MRI of an intratendinous ganglion cyst of the peroneus brevis tendon. Am J Roentgenol 2003; 181: 890-891. [DOI] [PubMed] [Google Scholar]
- 54.Sobel M, Pavlov H, Geppert MJ, et al. Painful Os peroneum syndrome: a spectrum of conditions responsible for plantar lateral foot pain. Foot Ankle Int 1994; 15: 112-124. [DOI] [PubMed] [Google Scholar]
- 55.Taneja AK, Simeone FJ, Chang CY, et al. Peroneal tendon abnormalities in subjects with an enlarged peroneal tubercle. Skeletal Radiol 2013; 42: 1703-1709. [DOI] [PubMed] [Google Scholar]
- 56.Brigido MK, Fessell DP, Jacobson JA, et al. Radiography and US of os peroneum fractures and associated peroneal tendon injuries: initial experience. Radiology 2005; 237: 235-241. [DOI] [PubMed] [Google Scholar]
- 57.Cheung Y. Normal variants: accessory muscles about the ankle. Magn Reson Imaging Clin N Am 2017; 25: 11-26. [DOI] [PubMed] [Google Scholar]
- 58.Sookur PA, Naraghi AM, Bleakney RR, et al. Accessory muscles: anatomy, symptoms, and radiologic evaluation. Radiographics 2008; 28: 481-499. [DOI] [PubMed] [Google Scholar]
- 59.Cheung Y, Rosenberg ZS. MR imaging of the accessory muscles around the ankle. Magn Reson Imaging Clin N Am 2001; 9: 465-473. [PubMed] [Google Scholar]
- 60.Cheung YY, Rosenberg ZS, Ramsinghani R, et al. Peroneus quartus muscle: MR imaging features. Radiology 1997; 202: 745-750. [DOI] [PubMed] [Google Scholar]
- 61.Wang XT, Rosenberg ZS, Mechlin MB, et al. Normal variants and diseases of the peroneal tendons and superior peroneal retinaculum: MR imaging features. Radiographics 2005; 25: 587-602. [DOI] [PubMed] [Google Scholar]
- 62.Cheung YY, Rosenberg ZS, Colon E, et al. MR imaging of flexor digitorum accessorius longus. Skeletal Radiol 1999; 28: 130-137. [DOI] [PubMed] [Google Scholar]
- 63.Donovan A, Rosenberg ZS, Cavalcanti CF. MR imaging of entrapment neuropathies of the lower extremity: part 2. The knee, leg, ankle, and foot. Radiographics 2010; 30: 1001-1014. [DOI] [PubMed] [Google Scholar]
- 64.Narváez JA, Narváez J, Ortega R, et al. Painful heel: MR imaging findings. Radiographics 2000; 20: 333-352. [DOI] [PubMed] [Google Scholar]
- 65.Yu JS. Pathologic and post-operative conditions of the plantar fascia: review of MR imaging appearances. Skeletal Radiol 2000; 29: 491-501. [DOI] [PubMed] [Google Scholar]
- 66.Newman E, Umans H, Elsinger E, et al. Not one of the usual suspects: MRI features of insertional lateral cord plantar fasciopathy. Am J Roentgenol 2018; 211: W252-W256. [DOI] [PubMed] [Google Scholar]
- 67.Lektrakul N, Chung CB, Lai YM, et al. Tarsal sinus: arthrographic, MR imaging, MR arthrographic, and pathologic findings in cadavers and retrospective study data in patients with sinus tarsi syndrome. Radiology 2001; 219: 802-810. [DOI] [PubMed] [Google Scholar]
- 68.Zember J, Rosenberg Z, Rossi I, et al. The frondiform ligament and pseudotenosynovitis of the extensor digitorum longus tendon: MRI evaluation with cadaveric correlation. Skeletal Radiol 2016; 45: 1089-1095. [DOI] [PubMed] [Google Scholar]
- 69.Hirschmann A, Rosenberg ZS. MRI evaluation of midtarsal (Chopart) sprain in the setting of acute ankle injury. Am J Roentgenol 2018; 210: 386-395. [DOI] [PubMed] [Google Scholar]
- 70.Ouellette H, Salamipour H, Thomas BJ, et al. Incidence and MR imaging features of fractures of the anterior process of calcaneus in a consecutive patient population with ankle and foot symptoms. Skeletal Radiol 2006; 35: 833-837. [DOI] [PubMed] [Google Scholar]
- 71.Walter WR, Hirschmann A, Alaia EF, et al. Normal anatomy and traumatic injury of the midtarsal (Chopart) joint complex: an imaging primer. Radiographics 2019; 39: 136-152. [DOI] [PubMed] [Google Scholar]
- 72.Petrover D, Schweitzer ME, Laredo JD. Anterior process calcaneal fractures: a systematic evaluation of associated conditions. Skeletal Radiol 2007; 36: 627-632. [DOI] [PubMed] [Google Scholar]
- 73.Hirschmann A, Walter WR, Alaia EF, et al. Acute fracture of the anterior process of calcaneus: does it herald a more advanced injury to chopart joint? Am J Roentgenol 2018; 210: 1123-1130. [DOI] [PubMed] [Google Scholar]
- 74.Gorbachova T, Wang PS, Hu B, et al. Plantar talar head contusions and osteochondral fractures: associated findings on ankle MRI and proposed mechanism of injury. Skeletal Radiol 2016; 45: 795-803. [DOI] [PubMed] [Google Scholar]
- 75.Siddiqui NA, Galizia MS, Almusa E, et al. Evaluation of the tarsometatarsal joint using conventional radiography, CT, and MR imaging. Radiographics 2014; 34: 514-531. [DOI] [PubMed] [Google Scholar]
- 76.Castro M, Melão L, Canella C, et al. Lisfranc joint ligamentous complex: MRI with anatomic correlation in cadavers. Am J Roentgenol 2010; 195: 447-455. [DOI] [PubMed] [Google Scholar]
- 77.Raikin SM, Elias I, Dheer S, et al. Prediction of midfoot instability in the subtle Lisfranc injury. Comparison of magnetic resonance imaging with intraoperative findings. J Bone Surg Am 2009; 91: 892-899. [DOI] [PubMed] [Google Scholar]
- 78.Preidler KW, Lajtai G, Seibert FJ, et al. Conventional radiography, CT, and MR imaging in patients with hyperflexion injuries of the foot: diagnostic accuracy in the detection of bony and ligamentous changes. Am J Roentgenol 1999; 173: 1673-1677. [DOI] [PubMed] [Google Scholar]
- 79.Crain JM, Phancao JP, Stidham K. MR Imaging of turf toe. Magn Reson Imaging Clin N Am 2008; 16: 93-103. [DOI] [PubMed] [Google Scholar]
- 80.Nery C, Baumfeld D, Umans H, et al. MR imaging of the plantar plate: normal anatomy, turf toe, and other injuries. Magn Reson Imaging Clin N Am 2017; 25: 127-144. [DOI] [PubMed] [Google Scholar]
- 81.Umans H, Srinivasan R, Elsinger E, et al. MRI of lesser metatarsophalangeal joint plantar plate tears and associated adjacent interspace lesions. Skeletal Radiol 2014; 43: 1361-1368. [DOI] [PubMed] [Google Scholar]
- 82.Bencardino J, Rosenberg ZS, Beltran J. Morton’s neuroma: is it always symptomatic? AJR Am J Roentgenol 2000; 175: 649-653. [DOI] [PubMed] [Google Scholar]
- 83.Zanetti M, Strehle JK, Zollinger H, et al. Morton neuroma and fluid in the intermetatarsal bursae on MR images of 70 asymptomatic volunteers. Radiology 1997; 203: 516-520. [DOI] [PubMed] [Google Scholar]
- 84.Zanetti M, Weishaupt D. MR imaging of the forefoot: Morton neuroma and differential diagnoses. Semin Musculoskelet Radiol 2005; 9: 175-186. [DOI] [PubMed] [Google Scholar]
- 85.Umans RL, Umans BD, Umans H, et al. Predictive MRI correlates of lesser metatarsophalangeal joint plantar plate tear. Skeletal Radiol 2016; 45: 969-975. [DOI] [PubMed] [Google Scholar]
- 86.Gimber LH, Melville DM, Bocian DA, et al. Ultrasound evaluation of morton neuroma before and after laser therapy. Am J Roentgenol 2017; 208: 380-385. [DOI] [PubMed] [Google Scholar]
- 87.Donovan A, Schweitzer ME. Current concepts in imaging diabetic pedal osteomyelitis. Radiol Clin North Am 2008; 46: 1105-1124. [DOI] [PubMed] [Google Scholar]
- 88.Cohen M, Cerniglia B, Gorbachova T, et al. Added value of MRI to X-ray in guiding the extent of surgical resection in diabetic forefoot osteomyelitis: a review of pathologically proven, surgically treated cases. Skeletal Radiol 2019; 48: 405-411. [DOI] [PubMed] [Google Scholar]
- 89.Johnson PW, Collins MS, Wenger DE. Diagnostic utility of T1-weighted MRI characteristics in evaluation of osteomyelitis of the foot. Am J Roentgenol 2009; 192: 96-100. [DOI] [PubMed] [Google Scholar]
- 90.Morrison WB, Schweitzer ME, Batte WG, et al. Osteomyelitis of the foot: relative importance of primary and secondary MR imaging signs. Radiology 1998; 207: 625-632. [DOI] [PubMed] [Google Scholar]
- 91.Sax AJ, Halpern EJ, Zoga AC, et al. Predicting osteomyelitis in patients whose initial MRI demonstrated bone marrow edema without corresponding T1 signal marrow replacement. Skeletal Radiol 2020; 49: 1239-1247. [DOI] [PubMed] [Google Scholar]
- 92.Duryea D, Bernard S, Flemming D, et al. Outcomes in diabetic foot ulcer patients with isolated T2 marrow signal abnormality in the underlying bone: should the diagnosis of “osteitis” be changed to “early osteomyelitis”? Skeletal Radiol 2017; 46: 1327-1333. [DOI] [PubMed] [Google Scholar]
- 93.Harish S, Chiavaras MM, Kotnis N, et al. MR imaging of skeletal soft tissue infection: Utility of diffusion-weighted imaging in detecting abscess formation. Skeletal Radiol 2011; 40: 285-294. [DOI] [PubMed] [Google Scholar]
- 94.Chun CW, Jung JY, Baik JS, et al. Detection of soft-tissue abscess: comparison of diffusion-weighted imaging to contrast-enhanced MRI. J Magn Reson Imaging 2018; 47: 60-68. [DOI] [PubMed] [Google Scholar]
- 95.Ahmadi ME, Morrison WB, Carrino JA, et al. Neuropathic arthropathy of the foot with and without superimposed osteomyelitis: MR imaging characteristics. Radiology 2006; 238: 622-631. [DOI] [PubMed] [Google Scholar]


