Abstract
Low back and neck pain are common and result in significant patient disability and health care expenditure. When conservative treatment fails or worrisome clinical findings are present, magnetic resonance imaging (MRI) is the imaging modality of choice to assess the cause and complicating features of spine pain. There are many potential aetiologies of spine pain with similar clinical presentation, including degenerative changes, infection, and insufficiency and pathologic fractures. MRI allows for the differentiation of these sources of spine pain and potential complicating features, permitting the appropriate direction of therapy.
Keywords: MRI, low back pain, neck pain, degenerative disc disease, spondylodiscitis, insufficiency fracture
Introduction
Low back pain is common and contributes significantly to patient morbidity and healthcare expenditure. The global prevalence of low back pain is 9.6%, and it is one of the most common reasons for visiting a primary health care provider, with almost all persons experiencing lower back pain at some time in their life [1,2]. Low back pain is the most common cause of years lived with disability and the third highest cause of disability-adjusted life years [3]. The third most demanding condition of health expenditure is low back and neck pain, after diabetes and ischaemic heart disease [4]. The imaging of these patients without red flags is being targeted by the Choosing Wisely campaign, due to its overuse, because investigating and surgically intervening in a patient with low back pain prior to conservative management contributes significantly to health care expenditure [5,6]. When conservative management of low back pain fails, magnetic resonance imaging (MRI) is the modality of choice for further evaluation. Imaging evaluation is valuable for patients with worrying clinical features, particularly those with prior surgery, the elderly, those on chronic steroid use, or with osteoporosis, low-velocity trauma, suspected or known cancer, infection, or immunosuppression [7]. MRI offers superior tissue contrast resolution over radiography and computed tomography (CT); imaging modalities that inadequately assess the spinal cord and use ionising radiation.
Spine anatomy
The spine is composed of seven cervical, 12 thoracic, five lumbar, five sacral, and four coccygeal vertebral segments. The differences in anatomy and physiology for each region of the spine are important for understanding the common locations of degenerative changes and when evaluating these different regions with MRI.
Spine and spinal cord development are closely intertwined despite arising from different progenitor cells. The vertebrae are composed of the vertebral body and the posterior elements or neural arch. The vertebral bodies of the cervical, thoracic, and lumbar spine are separated by intervertebral discs and together they are responsible for stability as well as weight transfer and distribution. The posterior elements, or neural arch, surround and protect the spinal cord.
Most vertebrae are derived from three primary ossification centres, with the constant exception being the second cervical vertebra. Primary ossification begins in utero during the first trimester and is usually complete by the first year of age. Secondary ossification centres include the endplate annular apophyses and the apophyses of the transverse and spinous processes. The secondary ossification centres for the first and second cervical vertebrae are variable. Secondary ossification begins during puberty and is usually complete by the third decade.
The first (atlas) and second (axis) cervical vertebrae are specialised in function and anatomy. The atlas is composed of an anterior and posterior arch with lateral masses that articulate superiorly and inferiorly with the head and axis, respectively. The elongated transverse processes of the atlas arise and extend laterally from the lateral masses. The odontoid process, or dens, is unique to the axis and is a superior extension of the body that facilitates rotation with the atlas. The axis body is heavily buttressed laterally for articulation superiorly with the atlas’s lateral masses and inferiorly with the C3 superior articular processes (Figure 1). Like all remaining vertebrae, the axis has posterior elements that are composed of (short) pedicles, (thick) laminae, and a (long) spinous process.
Figure 1.
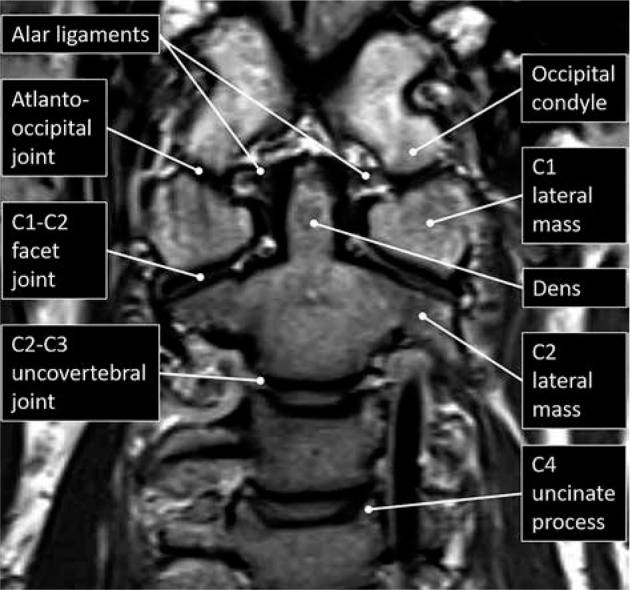
Craniocervical junction anatomy – coronal proton density mag- netic resonance image with labelled upper cervical spine and craniocervical junction anatomy
The remainder of the cervical vertebrae, C3 to C7, the thoracic vertebrae, and the lumbar vertebrae are composed of vertebral bodies and the posterior elements or neural arch. The first components of the neural arch extending posterolateral from the vertebral body are the pedicles. Extending laterally from the pedicles are the transverse processes. More posteriorly, the spinal canal is shielded by the laminae, where they meet at the midline origin of the spinous processes. Therefore, the osseous spinal canal is formed by the posterior margin of the vertebral body, bilateral pedicles, and bilateral laminae (Figure 2). The intervertebral or neural foramina convey the nerve roots for each spinal nerve at each level. These are bounded by the inferolateral corner of the posterior vertebral body and the intervertebral disc anteriorly (as well as by the uncinate processes in the cervical spine), by pedicles both superiorly and inferiorly, and by the facet joint (as well as by the articular pillar of the cervical spine) posteriorly. The zygapophyseal or facet joints, between superior and inferior articular processes on adjacent vertebra, are predominantly oriented in the coronal plane, except in the lumbar spine where they are oriented in an oblique sagittal plane.
Figure 2.
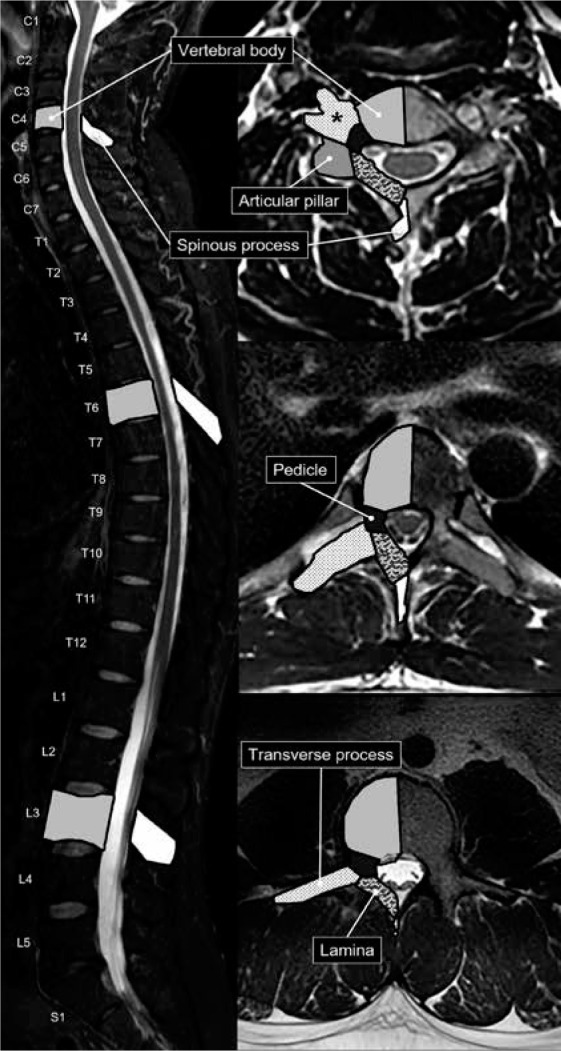
Vertebral anatomy – sagittal short-tau inversion recovery (A) magnetic resonance (MR) image with axial T2W MR images of the C4 cervi- cal (B), T6 thoracic (C), and L3 lumbar (D) vertebrae. The osseous anatomy of the vertebrae is labelled and shaded accordingly. The transverse processes of the cervical vertebrae contain transverse foramina (asterisk)
The C3 to C7 vertebrae are the only segments to have uncinate processes, which are hook-like superior projections at the posterolateral corners of the vertebral bodies. The transverse processes of the cervical vertebrae have transverse foramina through which the vertebral arteries course, typically entering at the level of C6. The cervical spine also has articular pillars that are osseous tiers that lie just posterior to the transverse processes and lateral to the pedicle-lamina junctions and provide support to the superior and inferior articular processes. The cervical vertebral spinous processes are bifid, unlike the thoracic and lumbar spinous processes. The cervical and thoracic vertebra spinous processes are also longer and more inferiorly angulated than the lumbar spinous processes.
The thoracic vertebrae articulate at two points with their corresponding ribs. The origins of the ribs articulate with shallow facets at the posterosuperior and posteroinferior margins of the thoracic vertebrae. The rib tubercles, small processes just distal to the rib heads, articulate with small articular facets on the thoracic vertebra transverse processes. The lumbar vertebral bodies and the lumbar transverse processes are the largest and longest, respectively. The lumbar articular processes that extend both superiorly and inferiorly from the pedicle-lamina junction form a tier that is referred to as the pars interarticularis. The laminae of the lumbar spine also shield the spinal canal posteriorly, but they do not overlap as much as the cervical and thoracic laminae.
The ligaments and paraspinal muscles stabilise the spine. The craniocervical junction is complex and consists of multiple stabilising ligaments. The ligaments unique to the craniocervical junction include the anterior atlanto-occipital membrane (AAOM), apical ligament, alar ligaments, cruciate ligament, and the posterior atlanto-occipital membrane (PAOM) (Figure 3).
Figure 3.
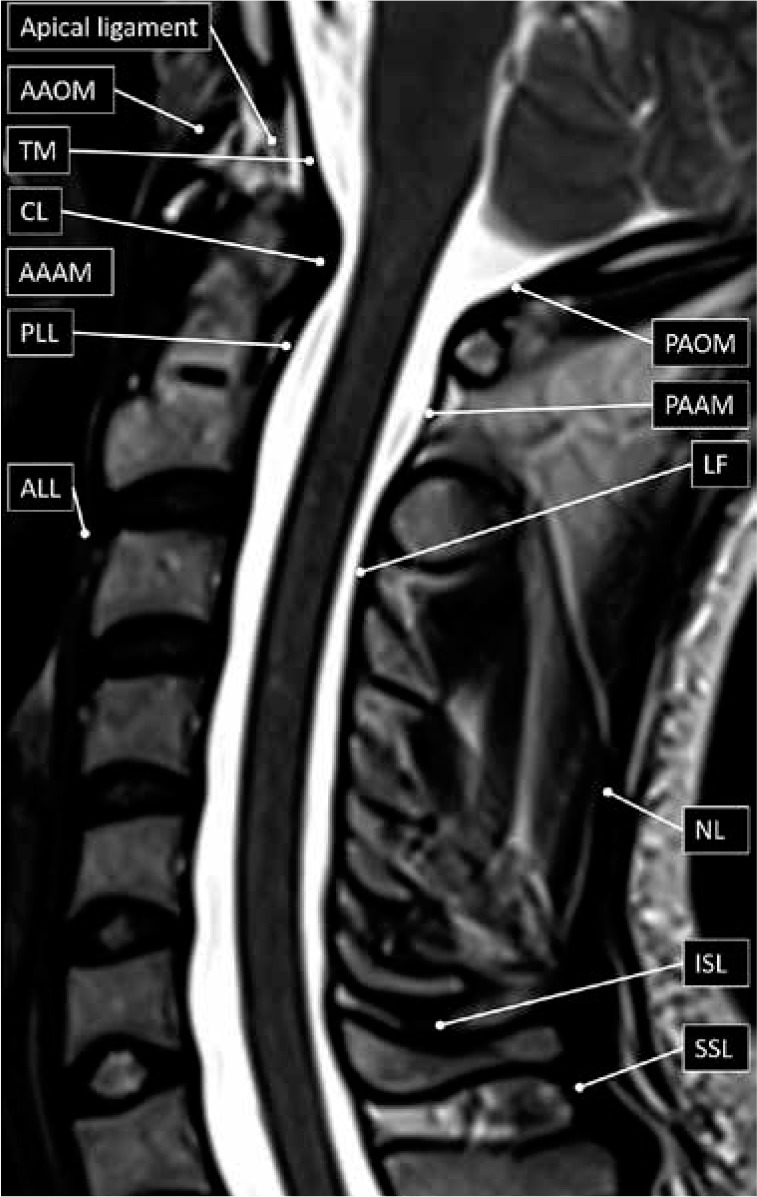
Spinal ligament anatomy – sagittal T2W magnetic resonance image with labelled ligaments of the cervical spine and craniocervical junction. AAAM – anterior atlanto-axial membrane, AAOM – anterior atlanto-occipital membrane, ALL – anterior longitudinal ligament, CL – cruciate ligament, ISL – interspinous ligament, LF – ligamentum fla- vum, NL – nuchal ligament, PAAM – posterior atlanto-axial membrane, PAOM – posterior atlanto-occipital membrane, PLL – posterior longitudinal ligament, SSL – supraspinous ligament, TM – tectorial membrane
The AAOM extends between the anterior margin of the clivus to the anterior arch of atlas before continuing inferiorly, first from the anterior arch of the atlas to the anterior margin of the axis as the anterior atlanto-axial membrane (AAAM), and then as the anterior longitudinal ligament (ALL). The apical ligament, extending from the tip of the clivus (basion) to the tip of the dens, is worth mentioning, but does not result in significant stabilisation. The alar ligaments extend from each of lateral curved margins at the tip of the dens and connect to the medial margins of both occipital condyles. The cruciate ligament lies immediately posterior to the dens with both horizontal and vertical bands. The thicker horizontal bands extend laterally and connect to tubercles at the medial margins of the atlas, whilst the vertical bands extend craniocaudally connecting to the posterior margins of the clivus and dens, respectively. The PAOM extends between the posterior lip of the foramen magnum (opisthion) to the posterior arch of atlas. The posterior atlantoaxial membrane (PAAM) then extends between the posterior arch of atlas to the laminae of the axis.
The posterior longitudinal ligament (PLL) lies along the posterior margin of the vertebral bodies. Superiorly, it is attached to the posterior margin of the axis body before broadening to continue as the tectorial membrane. The tectorial membrane then continues further superiorly to blend with the dura mater along the posterior margin of the clivus. The PLL is broader and more firmly attached to the intervertebral discs than the vertebral bodies, in contradistinction to the ALL, which is more firmly attached to the vertebral bodies than the intervertebral discs. The ALL lies along the anterior margin of the vertebral bodies. As described above, the ALL continues more superiorly, at the level of the body of the axis, as the AAAM and then as the AAOM. Inferiorly both the ALL and the PLL taper at their attachments to the anterior and posterior margins of the sacral body, respectively.
The ligamentum flava are similar to the PAAM (and PAOM), but they interconnect the laminae of the adjacent vertebra, from C2-C3 to L5-S1. The spinous processes are also interconnected by ligaments called the interspinous ligaments. The supraspinous (or supraspinal) ligament extends between the tips of the adjacent spinous processes from C7 to S1. More superiorly, above C7, the supraspinous ligament continues as the much thicker nuchal ligament that also has attachments to the remaining cervical spinous processes and the posterior tubercle of the atlas before it attaches to the inion or the midline of the (external) occipital protuberance.
The spinal cord is the caudal extension of the medulla oblongata below the foramen magnum, and it descends through the spinal canal prior to terminating as the conus medullaris (usually at the L1 level in adults). A thin strand of fibrous tissue, called the filum terminale, extends caudally from the apex of the conus medullaris and inserts into the first coccygeal segment. The nerve roots that extend caudally to the conus medullaris are collectively called the cauda equina.
There are eight cervical, 12 thoracic, five lumbar, five sacral, and one coccygeal paired nerve roots. The cervical nerve roots exit through the neural (or intervertebral) foramen which corresponds to the more caudal segment at the intervertebral disc level (e.g. the C5 nerve root exits through the C4-C5 neural foramen). The exception is the C8 nerve roots, which exit through the C7-T1 neural foramen. The thoracic, lumbar, and S1 to S4 nerve roots all exit through the neural foramen which corresponds to the more cranial segment at the intervertebral disc level (e.g. the L4 nerve roots exit through the L4-L5 neural foramen). The S5 and coccygeal nerve roots exit through the sacral hiatus.
Transitional lumbosacral vertebra
Appropriate labelling of vertebral levels and the identification of the transitional lumbosacral vertebra (TLV) is vital to accurately report and prevent spinal procedures being performed at the wrong level. TLV are hybrid vertebrae at the junction of the lumbar spine and sacrum. TLV are relatively common, with an overall prevalence of 18.1%, occurring more commonly in men (28.1%) than women (11.1%) [8]. Lumbarisation of the S1 vertebral body occurs less frequently than sacralisation of L5 [9]. Localisation of the L5 nerve root, which is the only lumbar nerve root without proximal branching, can help accurately label the L5 vertebra, even if sacralised, with 98% accuracy [10]. The iliolumbar ligament is present in 85.7% and extends from the L5 transverse process to the iliac wing in 96%, making it a useful landmark when labelling vertebral levels [11]. Although these methods are useful in accurately predicting the L5 vertebra, conveying the presence of TLV and reporting the method of lumbosacral segment labelling for the referring clinicians is paramount to prevent incorrect level surgery or procedure. The most accurate method of vertebral segment labelling is total spine imaging, either by utilising prior studies as a reference or by acquiring total spine radiographs.
When present, TLV can be classified according to the Castellvi classification (Table 1) [12]. Type I TLV have elongated transverse processes, type II TLV have transverse processes that pseudo-articulate with the sacrum, and type III TLV have transverse processes that are fused with the sacrum (Figure 4). Type I, type II, and type III can be subclassified as occurring unilaterally (a) or bilaterally (b). Type IV TLV are a combination of a type II on one side and a type III on the other. TLV may cause or contribute to low back (and buttock) pain. Bertolotti syndrome refers to the constellation of symptoms and the presence of TLV, most commonly prevailing during the third and fourth decades of life [13]. This may be a result of the pseudo-articulation between the transverse processes and the sacrum, because the prevalence occurs more frequently in those with Castellvi type II or type IV TLV.
Table 1.
Castellvi classification of transitional lumbosacral vertebra (TLV)
| Castellvi classification | TLV transverse process morphology |
|---|---|
| Type I | Elongated (Type Ia) unilateral (Type Ib) bilateral |
| Type II | Pseudo-articulating (Type IIa) unilateral (Type IIb) bilateral |
| Type III | Fused (Type IIa) unilateral (Type IIb) bilateral |
| Type IV | Combined – Type IIa and Type IIIa (one pseudo-articulating and one fused) |
Figure 4.
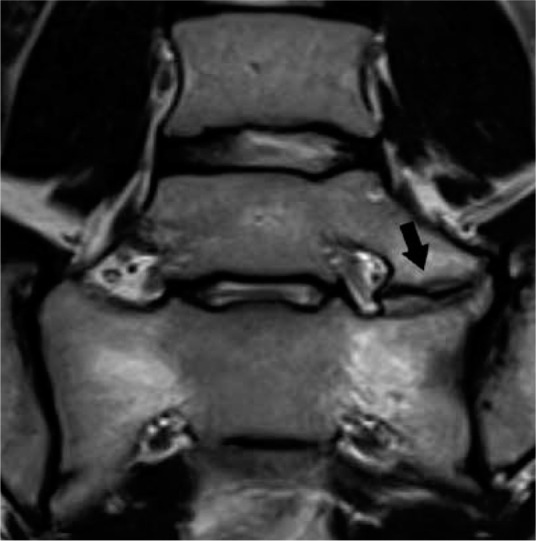
Transitional lumbosacral anatomy – coronal T2W magnetic res- onance image of the lumbosacral junction demonstrates Castellvi type IIa transitional lumbosacral anatomy with left pseudo-articulation between L5 and the sacrum (arrow). This pseudo-articulation may result in focal pain, termed Bertolotti syndrome
Intervertebral disc anatomy
The intervertebral discs are fibrocartilaginous structures between two adjacent vertebral bodies. The discs serve as fibrocartilaginous joints, allowing a small degree of bending motion in all directions (e.g. flexion, extension, lateral flexion, and torsion). The discs also serve as ligaments to hold the spine together, and as shock absorbers to mitigate axial loading to the spine. Structurally, the disc is composed of an outer annulus fibrosus and an inner nucleus pulposus, connected to the cartilaginous endplates of the adjacent vertebral bodies (Figure 5) [14]. The annulus fibrosus is composed of several lamellated layers of collagen that function as a tough circumferential peripheral exterior enclosing the nucleus pulposus and attaching to the vertebral endplates, providing tensile and radial strength to the disc. The nucleus pulposus is the gelatinous core of loose collagen, proteoglycans, and water, which functions as the shock absorber to provide compressive strength to the disc. The intervertebral disc is an avascular structure, which receives nutrients from capillaries within the vertebral endplates and relies on passive diffusion to supply the cells within the disc.
Figure 5.
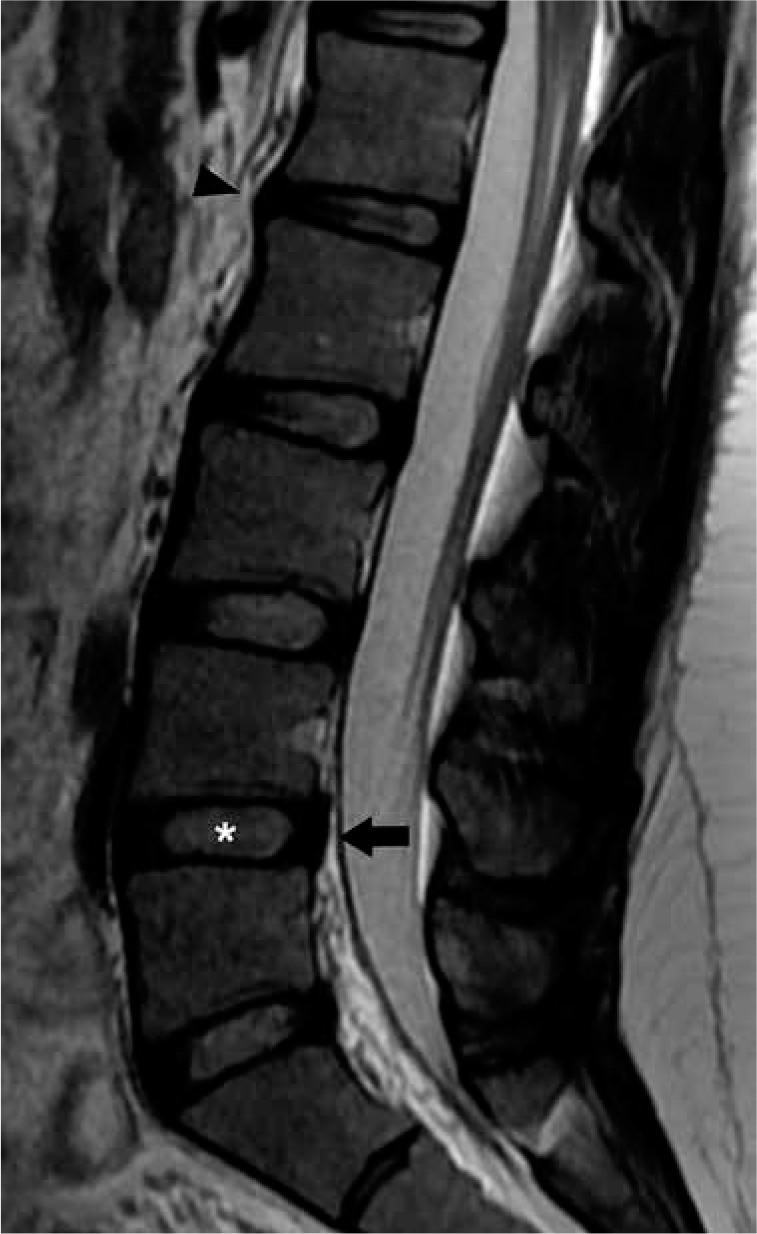
Normal intervertebral disc and mild disc degeneration – sagittal T2W magnetic resonance image of the lumbar spine demonstrates normal hyperintensity within the L4-L5 intervertebral disc with clear distinction between the nucleus pulposus (asterisk) and annulus fibrosus (arrow). Mild disc degeneration predominantly affects the L1-L2 intervertebral disc with anterior loss of hyperintensity, ill-definition of distinction between the nucleus pulposus and annulus fibrosus, linear horizontal band, and mild anterior disc height loss (arrowhead)
Disc degeneration
On MRI, the normal intervertebral disc demonstrates distinctness of the nucleus pulposus and annulus fibrosus with internal high T2W signal intensity of the nucleus pulposus and relatively lower T2W signal intensity within the peripheral annulus fibrosus, corresponding to the relative difference in water content (Figure 5). Disc degeneration describes a host of pathophysiological processes that result in loss of function of the intervertebral disc. The factors that affect disc degeneration include, but are not limited to, mechanical stress, aging, lifestyle factors (e.g. smoking), and genetic predisposition [15]. The consequences of these factors are loss of hydrophilic proteoglycans, and therefore water content, within the nucleus pulposus, which decreases the resistance to axial loading. Along with disc desiccation, disc degeneration encompasses a plethora of degenerative processes that affect the intervertebral disc and adjacent vertebral endplates including disc space narrowing, fibrosis, vacuum disc phenomenon, annular fissures, endplate cartilage erosion, marginal osteophytosis, and Modic degenerative endplate changes.
The MRI findings of disc degeneration are most sensitively detected on T2W sequences. These include decreased T2W signal within the intervertebral disc, loss of the normal distinctness between the nucleus pulposus and annulus fibrosus, and eventually loss of intervertebral disc height. A grading scheme of the morphological changes of the intervertebral disc on T2W sequences was created by Pfirrmann et al. and later revised by Griffith et al., predominantly for the purpose of standardisation across research studies [16,17].
Annular fissures are a frequent finding in disc degeneration, defined as disruption of the fibres of the annulus fibrosus, either within its substance or at its attachment to the vertebral body. On MRI, annular fissures demonstrate linear T2W signal hyperintensity and contrast enhancement within the disc as a result of fluid and ingrowth of vascularised granulation tissue. The absence of MRI findings can be used to determine acuity [18]. As such, the term annular tear is no longer recommended because annular fissures are a chronic degenerative process rather than an acute traumatic process implied by the word tear. Annular fissures can be subdivided by orientation and location into concentric, radial, and transverse fissures [19]. Concentric fissures parallel the peripheral contour of the intervertebral disc and are not typically visualised on MRI. Radial fissures are vertically, horizontally, or obliquely oriented disruptions of annular fibres extending from the periphery to the nucleus pulposus (Figure 6). Transverse fissures are disruptions of Sharpey’s fibres in the periphery of the annulus fibrosus at its attachment sites to the adjacent vertebral endplate.
Figure 6.
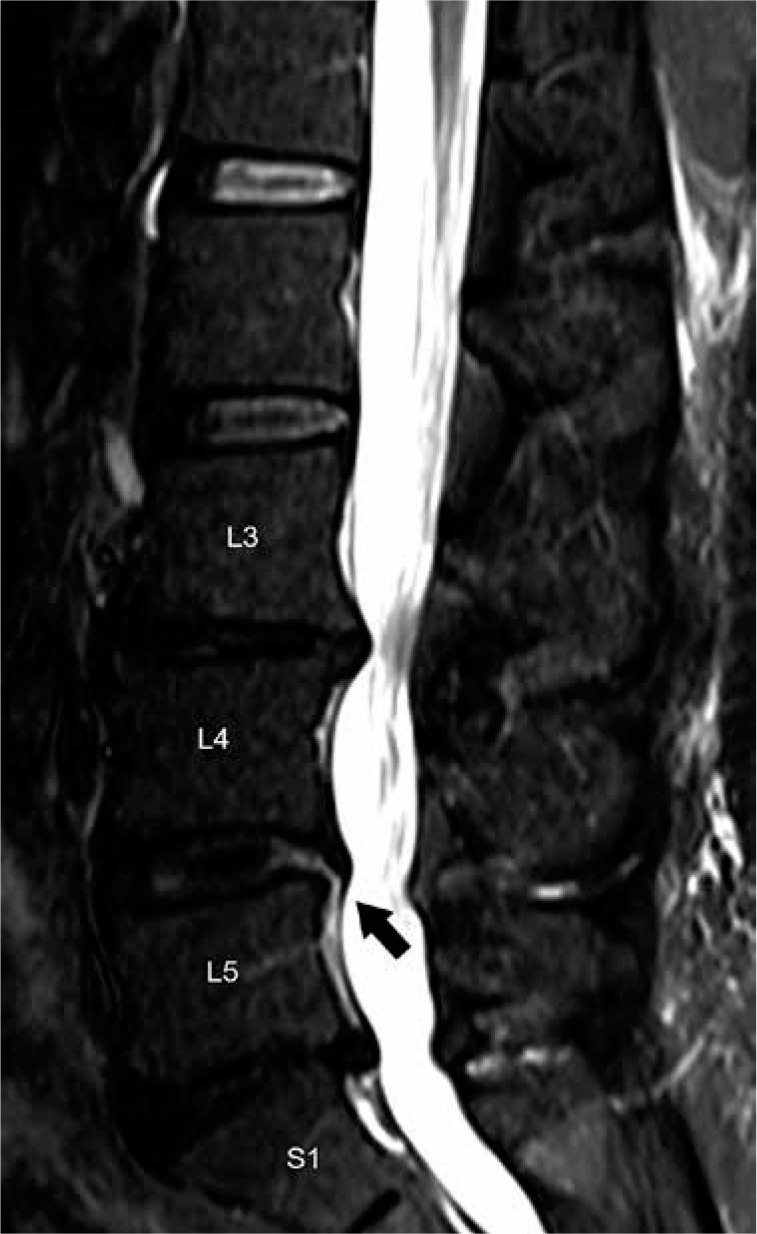
Disc degeneration and annular fissure – sagittal short-tau in- version recovery magnetic resonance image of the lumbar spine shows multilevel disc degeneration as evidenced by disc hypointensity and loss of intervertebral disc height most pronounced at L3-L4 and L5-S1. Linear hyperintensity extending from the nucleus pulposus to the margin of the annulus fibrosus at the L4–L5 level is characteristic for a radial annular fis- sure (arrow)
Modic degenerative marrow changes
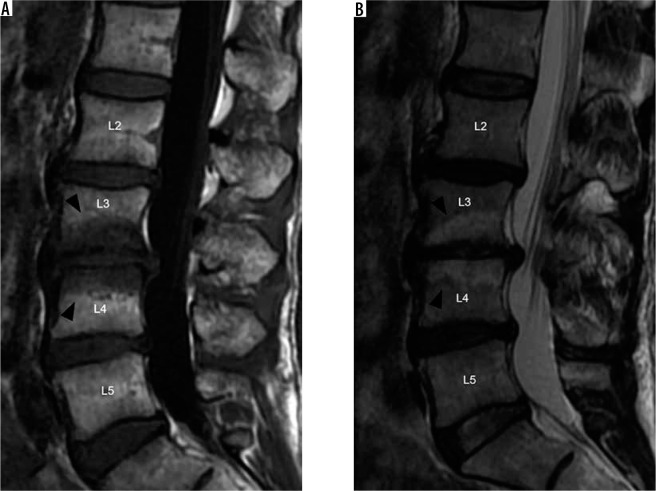
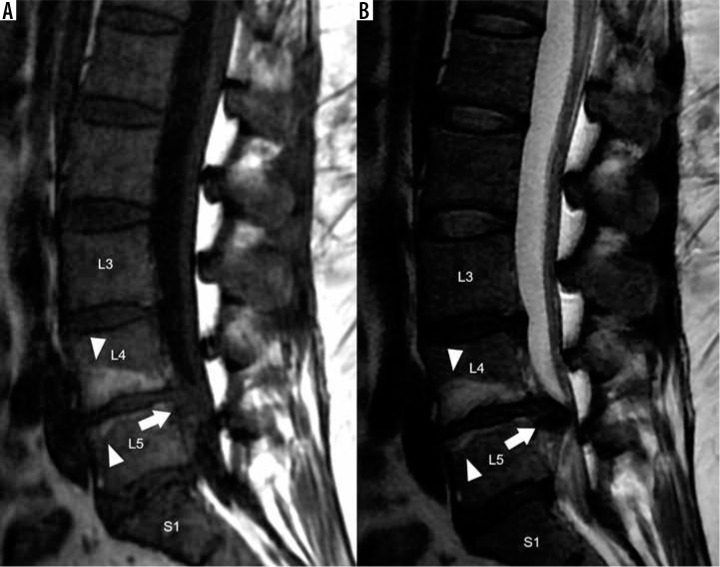
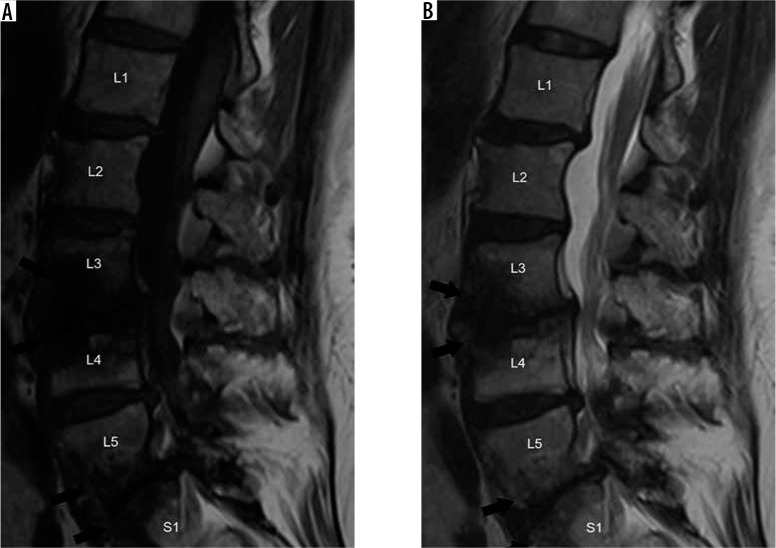
Modic degenerative marrow changes represent three distinct types of MRI marrow signal changes frequently encountered adjacent to degenerated discs (Table 2) [20]. Modic type I degenerative changes result in low T1W signal intensity, high T2 signal intensity, and postgadolinium contrast enhancement, corresponding to bone marrow oedema or inflammation (Figure 7). Modic type II degenerative changes result in high T1W signal intensity and high T2 signal intensity, representing replacement of the normal haematopoietic red marrow with fatty yellow marrow (Figure 8). Modic type III degenerative changes result in low T1W signal intensity and low T2W signal intensity as a result of osseous sclerosis (Figure 9).
Table 2.
Magnetic resonance imaging signal characteristics and pathobiology of endplate modic degenerative marrow changes
| Modic classification | T1 signal characteristics | T2 signal characteristics | Gadolinium contrast enhancement | Pathobiology |
|---|---|---|---|---|
| Type I | Low | High | (+) Present | Marrow oedema (or inflammation) |
| Type II | High | High | (–) Absent | Fatty marrow conversion |
| Type III | Low | Low | (–) Absent | Subchondral bone sclerosis |
Figure 7.
Modic type I degenerative marrow changes – sagittal T1W (A) and T2W (B) magnetic resonance images of the lumbar spine show low T1W and high T2W signal intensity within the bone marrow adjacent to L3-L4 disc degeneration, compatible with Modic type I degenerative marrow changes (black arrowheads). In addition, there are also disc desiccation at L2-L3, L3-L4, and L4-L5, disc bulges at L2-L3 and L4-L5, and disc extrusion at L3-L4
Figure 8.
Modic type II degenerative marrow changes – sagittal T1W (A) and T2W (B) magnetic resonance images of the lumbar spine demonstrate high T1W and T2W signal intensity adjacent to L4-L5 disc degeneration, consistent with Modic type II degenerative marrow changes (white arrowheads). There is a severe L4-L5 disc extrusion with caudal migration (white arrows). In addition, there are disc desiccation and disc bulges at L3-L4 and L5-S1
Figure 9.
Modic type III degenerative marrow changes – sagittal T1W (A) and T2W (B) magnetic resonance images of the lumbar spine display low T1W and T2W signal intensity along the L3-L4 and L5-S1 intervertebral discs, representing Modic type III degenerative marrow changes (black arrows). In addition, there is disc desiccation, disc height loss, and disc bulges at all lumbar intervertebral disc levels
These degenerative marrow changes typically progress from type I to type II to type III and may be an admixture of types (e.g. type I and II). Low back pain and persistence of symptoms despite conservative measures is most commonly associated with the presence of Modic type I degenerative endplate changes [21]. The causality of Modic type I degenerative endplate changes is a topic of ongoing debate, with probable contributions of mechanical stress, proinflammatory environment stimulated by degenerated disc, and/or infectious spondylodiscitis with low-virulence bacteria [22].
Disc bulge and disc herniation
In 2014, an update to the recommendations regarding lumbar disc nomenclature was produced by joint task forces from the North American Spine Society, the American Society of Spine Radiology, and the American Society of Neuroradiology [23]. These updated guidelines serve to standardise the terminology for radiology reporting of lumbar disc degeneration, because greater understanding provided by the medical literature has evolved since the original recommendations published in 2001 [24]. The following definitions of disc bulge, disc herniation, and location are based upon these 2014 lumbar disc nomenclature recommendations.
Disc bulge refers to a broad-based extension of the disc beyond the margins of the adjacent vertebral endplates. By definition, more than 90° of the disc’s circumference must extend beyond the margins of the vertebral endplates to be considered a disc bulge. When extending posteriorly into the spinal canal, disc bulges can project equally into the right and left halves of the spinal canal, termed symmetric. Alternatively, the disc bulge can be asymmetric, extending either more towards the right or left of the spinal canal (Figure 10). Anatomically, disc bulges contain only the annulus fibrosus.
Figure 10.
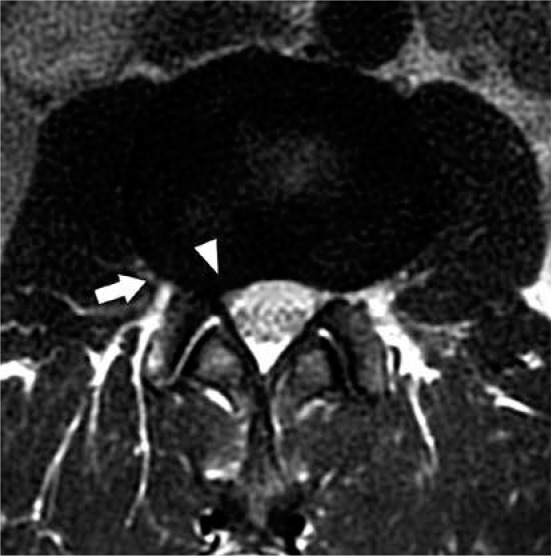
Disc bulge – axial T2W magnetic resonance image through the L2-L3 intervertebral disc demonstrates asymmetric right-sided disc bulge (arrow). This disc bulge results in mild narrowing of the right subar- ticular recess (arrowhead)
In contrast, disc herniation refers to more focal extension of the disc, affecting less than 90° of the circumference of the intervertebral disc beyond its normal confines. Disc herniations result from a tear in the annulus fibrosus allowing the nucleus pulposus to project into the defect. As opposed to disc bulges, herniations are more likely to cause symptoms because they typically extend further from the native disc to contact and irritate the spinal cord or nerve roots.
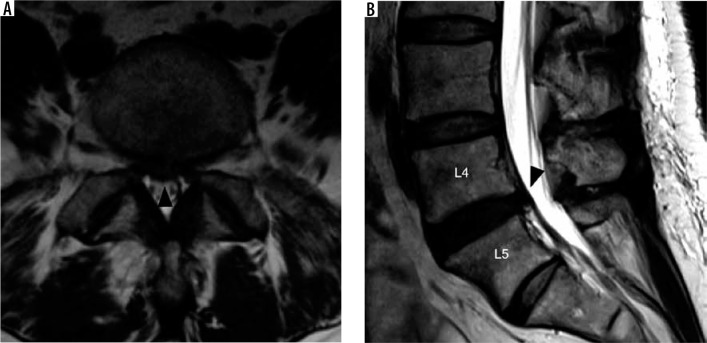
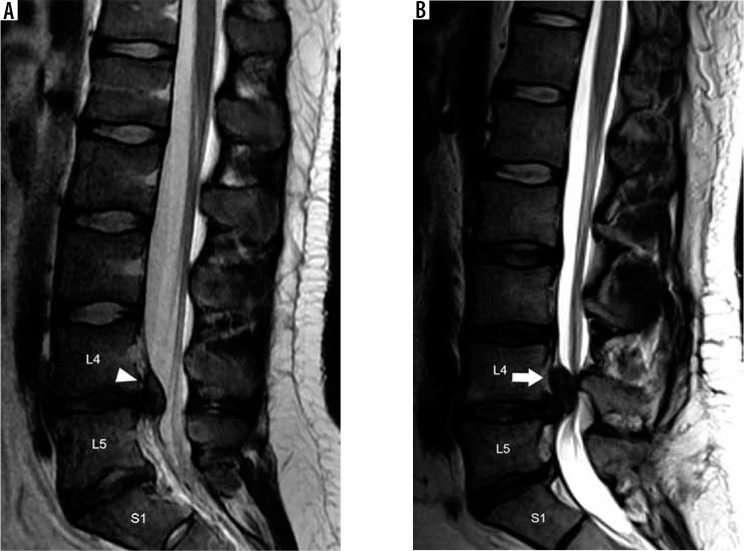
Disc herniations can be subdivided by their morphology into disc protrusions or disc extrusions. A disc protrusion is a broad-based herniation in which the width of the base is larger than any other part of the herniation (Figure 11). A disc extrusion is a herniation in which the width of the base is narrower than the remaining herniation in any plane (Figure 12A). This stalk-like attachment of the disc extrusion to the disc of origin may allow for superior or inferior extension of the herniation within the spinal canal, termed cranial or caudal migration, respectively. If the attachment of a disc extrusion with the disc of origin is disrupted, the result is a disc sequestration (Figure 12B). Disc sequestration therefore results in a free fragment of intervertebral disc within the spinal canal, separate from the disc of origin. Disc sequestrations may also demonstrate cranial or caudal migration in the spinal canal. It is crucial for the radiologist to detect and describe the location of these free intervertebral disc fragments because they may go undetected during surgical intervention.
Figure 11.
Disc protrusion – axial (A) and sagittal (B) magnetic resonance T2W images of the lumbar spine show a central disc protrusion (black arrowheads) with annular fissure at L4-L5
Figure 12.
Disc extrusion – sagittal T2W (A) magnetic resonance (MR) image of the lumbar spine demonstrates a disc extrusion with cranial migration at L4–L5 (white arrowhead). There is also disc desiccation at L5-S1. Sagittal T2W (B) MR image of the lumbar spine in a different patient shows a large disc extrusion with cranial migration of a free fragment at L4-L5 (arrow), confirmed to represent disc sequestration at surgery. In addition, there is a small disc extrusion with cranial migration and annular fissure at L5-S1
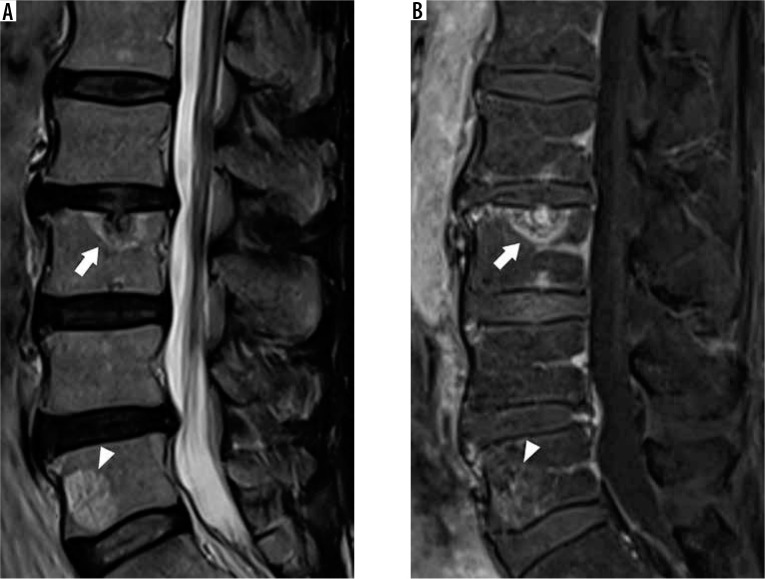
Schmorl nodes also represent a different type of disc herniation. Also termed intervertebral disc herniations, these disc herniations project superiorly or inferiorly through the vertebral endplate into the adjacent vertebral body. Schmorl nodes are often asymptomatic but may be associated with pain during the acute phase of development. Incidentally detected Schmorl nodes typically demonstrate T1W and T2W signal characteristics similar to those of the disc of origin with thin rim of low T1W and T2W hypointensity corresponding to osseous sclerosis. However, in the acute phase, the intervertebral herniation may demonstrate internal or peripheral contrast enhancement and T2W hyperintensity with surrounding marrow oedema, confusing them for an aggressive osseous lesion (Figure 13) [25]. Schmorl nodes are best diagnosed on sagittal imaging as the continuity of the intervertebral disc herniation for which the adjacent disc of origin can be established.
Figure 13.
Acute schmorl node – sagittal T2W (A) and postcontrast T1W fat suppressed (B) magnetic resonance images of the lumbar spine demonstrate hyperintense and contrast-enhancing intervertebral disc herniation involving the L3 superior endplate with surrounding bone marrow oedema (arrows), compatible with an acute Schmorl node. Incidental vertebral body haemangioma is present at L5 (arrowheads)
Spine location reporting
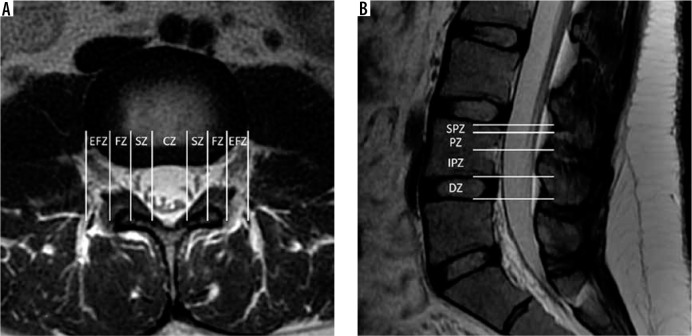
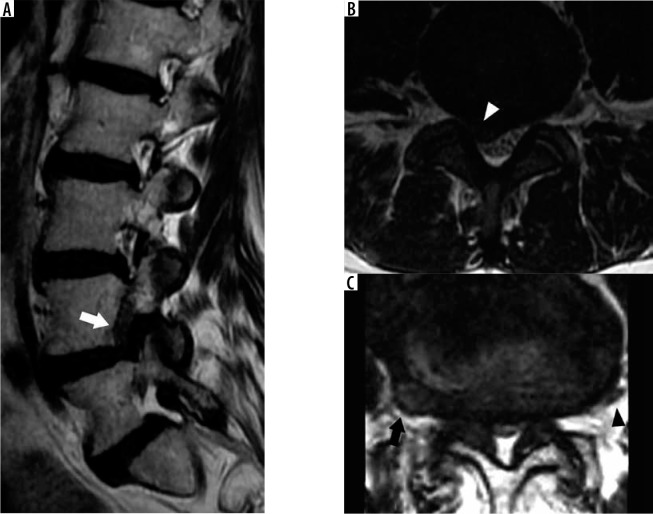
The location of a lumbar disc herniation determines which cauda equina nerve root(s) may be impinged upon. With respect to a transverse plane through the intervertebral disc, the location of lesions within the spinal canal can be described from medial to lateral as occupying the central, subarticular, foraminal, or extraforaminal zones (Figure 14A) [26]. The central zone is the medial aspect of the spinal canal situated between the medial margins of the facet joints. Central disc herniations can be perfectly midline or slightly off centre to the right or left, termed either right or left central herniations, respectively. Central herniations result in varying degrees of spinal canal stenosis, narrowing of the thecal sac, and posterior mass effect upon the cauda equina nerve roots; however, they infrequently impinge upon a single nerve root.
Figure 14.
Spine location reporting – axial T2W (A) magnetic resonance (MR) image through the L3-L4 intervertebral disc with locations partitioned into zones based on the medial margins of the facet joints, medial cortices of the pedicles, and lateral cortices of the pedicles from medial to lateral: central zone – CZ, subarticular zone – SZ, foraminal zone – FZ, and extraforaminal zone – EFZ. Sagittal T2W (B) MR image of the lower lumbar spine with locations partitioned into zones based on the margins of the disc, inferior cortices of the pedicles, and superior margins of the pedicles from inferior to superior: discal zone – DZ, infrapedicular zone – IPZ, pedicular zone – PZ, and suprapedicular zone – SPZ
The subarticular zone is lateral to the central zone of the spinal canal directly anterior to the facet joint, bounded medially by the medial margin of the facet joint and laterally by the medial cortex of the pedicle. This lateral aspect of the spinal canal, termed the subarticular or lateral recess, is occupied by the transiting cauda equina nerve roots, which then exit the next more caudal neural foramen (e.g. the L4 nerve root transits through the L3-L4 subarticular recess and exits the L4-L5 neural foramen). As such, subarticular disc herniations may impinge upon these transiting nerve roots resulting in a radiculopathy of the level inferior to the intervertebral disc level (e.g. L3-L4 subarticular disc herniation impinges upon the L4 nerve root resulting in L4 radiculopathy).
Lateral to the subarticular zone is the foraminal zone. Foraminal disc herniations project into the lumbar neural foramina, which are situated below the pedicle, anterior to the inferior articular pillar, and posterior to the inferolateral aspect of the vertebral body and adjacent intervertebral disc. Foraminal disc herniations can impinge upon the exiting nerve roots occupying the neural foramina. In contrast to subarticular disc extrusions, impingement of these nerve roots results in a radiculopathy of the level superior to the intervertebral disc level (e.g. L3-L4 foraminal disc herniation impinges upon the exiting L3 nerve roots, resulting in L3 radiculopathy).
Finally, the extraforaminal zone is situated lateral to the foraminal zone. Extraforaminal disc herniations project lateral to the neural foramina, and therefore lateral to the pedicle. These herniations also may impinge upon the nerves that have exited the adjacent neural foramen and will therefore result in a radiculopathy similar to a foraminal disc herniation at the same level (e.g. L3-L4 extraforaminal disc herniation impinges upon the recently exited L3 nerve, resulting in L3 radiculopathy).
In addition, lesions within the spinal canal can be described in their craniocaudal location with respect to the intervertebral disc and pedicle from inferior to superior as within the discal, infrapedicular, pedicular, or suprapedicular zones (Figure 14B). Along with length measurements, the craniocaudal location and extent of a disc extrusion or sequestration with or without migration can be described using these zones. This classification is best defined on sagittal imaging.
Facet and uncovertebral joint arthrosis
The facet joints, also known as zygapophyseal joints, are paired synovial joints between the articular processes of two adjacent vertebrae at each mobile spine segment. These joints facilitate, but also limit, motion at each spinal motion segment to protect the spine from excessive flexion, extension, anterior translation, and rotation. The uncovertebral joints, also known as Luschka joints, are paired synovial joints along the posterolateral margins of the intervertebral discs at the lower five cervical intervertebral disc levels (e.g. C2-C3 through C6-C7). These joints are formed by the superiorly projecting uncinate processes along the posterolateral margins of the vertebral body with the posterolateral margins of the adjacent cranial vertebral body and form a portion of the anteromedial wall of the neural foramen [27]. Uncovertebral joints guide flexion and extension of the cervical spine and limit lateral flexion. They also result in a physical barrier to prevent disc herniation into the cervical neural foramina.
Similar to the remaining synovial joints of the body, facet joints and uncovertebral joints may undergo degenerative changes associated with repetitive mechanical stress and aging, often in conjunction with disc degeneration. Facet arthrosis is indicated on MRI by variable degrees of joint space narrowing, articular surface irregularity, subarticular erosions or cyst-like changes, marginal osteophytosis, and/or facet hypertrophy (Figure 15) [28]. Osseous overgrowth and osteophytosis from facet arthrosis, and uncovertebral arthrosis in the cervical spine, result in narrowing of the adjacent neural foramen, which may be quantified on MRI (Figure 16). The normal synovial fluid within the facet joints is not visualised or only barely perceptible on MRI. Facet joint effusions constitute an increase in the amount of T2W hyperintense fluid within the widened joint space and are indicative of an abnormal greater degree of allowable motion of the facet joint [29]. Post-gadolinium enhancement of the joint and adjacent marrow indicates synovitis in the setting of facet arthrosis [30]. In addition, facet arthrosis is often associated with thickening and redundancy of the underlying ligamentum flavum, most commonly in the lumbar spine. Ligamentum flavum thickening appears as an increase in width of the T2W hypointense signal along the posterolateral margins of the spinal canal.
Figure 15.
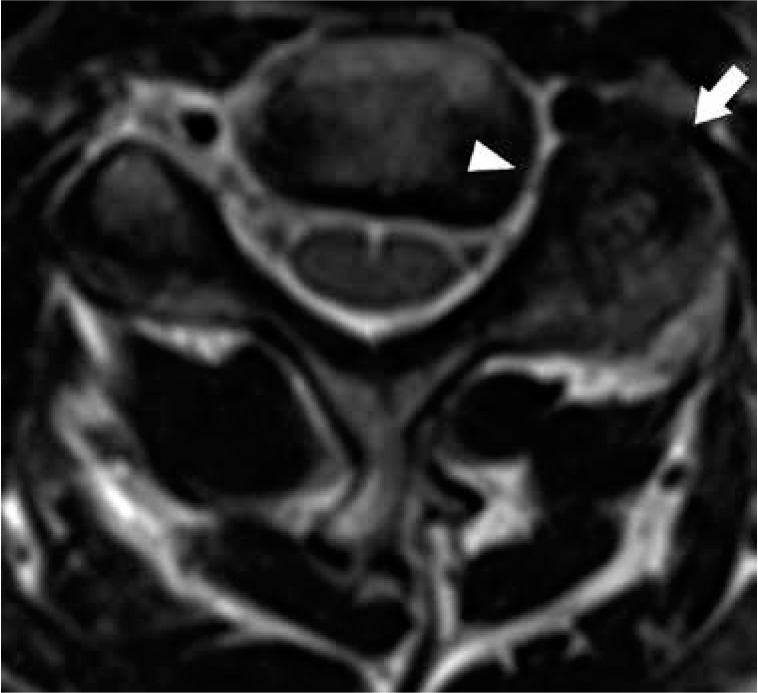
Facet arthrosis – axial T2W magnetic resonance image at the C4-C5 level demonstrates left facet hypertrophy (arrow) resulting in severe narrowing of the left C4-C5 neural foramen (arrowhead)
Figure 16.
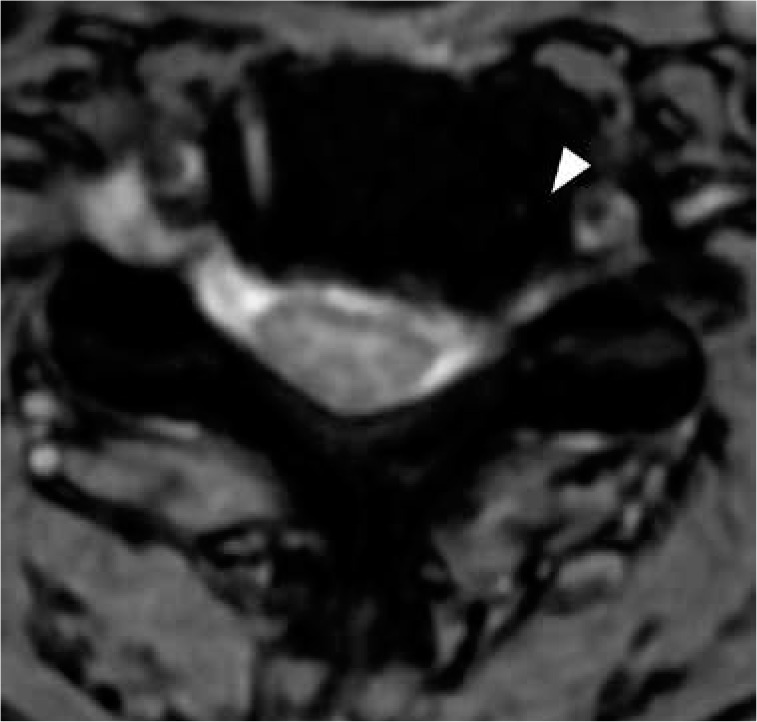
Uncovertebral joint arthrosis – axial T2 gradient-recalled echo magnetic resonance image at the C5-C6 level demonstrates left uncovertebral joint hypertrophy (arrowhead) contributing to left neural foraminal stenosis
Synovial cyst
Synovial cysts are encapsulated herniations of synovial fluid from degenerated facet joints outside of the joint space. These cysts are most frequently encountered in the lumbar spine, but they can occur at any facet joint. When the cysts extend anteriorly from the facet joint into the spinal canal, they may result in subarticular recess or spinal canal stenosis. In the lumbar spine, synovial cysts occupying the subarticular recess may impinge upon the transiting cauda equina nerve roots, which exit at the next most caudal neural foramen (e.g. L4-L5 synovial cyst impinges upon the L5 nerve root within the L4-L5 subarticular recess).
On MRI, synovial cysts are typically T2W hyperintense with a hypointense periphery immediately adjacent to the facet joint in the posterolateral aspects of the spinal canal (Figure 17) [31]. In the setting of prior haemorrhage, the cystic contents may demonstrate variable T1W and T2W signal characteristics [32]. Signal void and susceptibility within the cyst corresponding to gas is pathognomonic for a synovial cyst because it indicates continuity with the vacuum joint phenomenon of the adjacent facet joint. On post-gadolinium T1W imaging, synovial cysts demonstrate a variable degree of peripheral enhancement, and they are often associated with additional findings of facet arthrosis and joint effusion.
Figure 17.
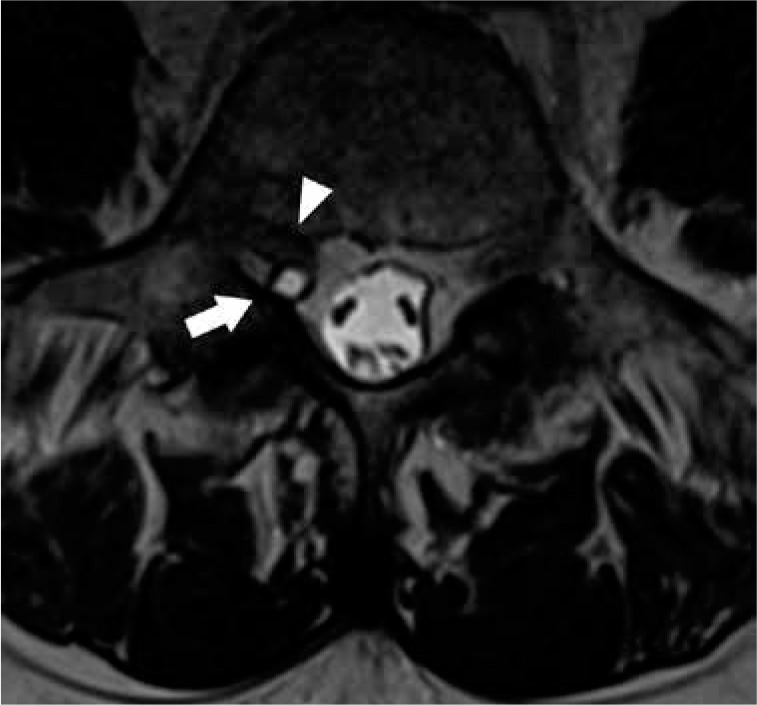
Synovial cyst – axial T2W magnetic resonance image at L4–L5 demonstrates a small hyperintense cystic lesion with hypointense rim adja- cent to the right L4–L5 facet joint, compatible with a synovial cyst (arrow). The synovial cyst impinges upon the right L5 nerve root traveling through the subarticular recess (arrowhead)
Spinal canal, subarticular recess, and neural foraminal narrowing
Aside from providing the mechanical functions of structural support for upright posture and flexible motion, the spine provides protection for the spinal cord and nerve roots. The spinal canal is the cavity within the vertebral column that contains the spinal cord, conus medullaris, and cauda equina nerve roots. The shape of the spinal canal varies, given the differences in anatomic configuration of the cervical, thoracic, and lumbar vertebrae; however, the boundaries of the spinal canal are relatively unchanged throughout the spine. The anterior margin of the spinal canal is created by the posterior margins of the vertebral body, intervertebral discs, and posterior longitudinal ligament. The posterior margin of the spinal canal is formed by the facet joints, laminae, and ligamentum flavum. The bilateral paired neural foramina allow for transit of the exiting nerve roots at each intervertebral level.
Degenerative changes of the spine may encroach upon the spinal canal or neural foramina and damage the spinal cord or nerve roots. There are many methods for quantifying spinal canal stenosis and spinal cord impingement using canal dimensions, cross-sectional area, and dimensional ratios [33]. Many of these methods are time-consuming and not practical for clinical application, but they may be employed in the future with the aid of computer automation. The average cervical spinal canal sagittal diameter on MRI is approximately 13.7-14.1 mm [34,35]. A cervical spinal canal sagittal diameter of < 13 mm is considered relatively narrowed, and < 10 mm as absolutely narrowed, based on measurements obtained from cervical spine radiographs with correlation of myelopathy symptoms [36]. MRI has the advantage over radiographs of detecting contributions from soft tissue structures narrowing of the thecal sac, such as disc herniations and ligamentum flavum thickening. Narrowing of the cervical thecal sac of ≤ 8 mm measured on midsagittal T2W images at the intervertebral disc level is associated with a higher likelihood of cervical spinal cord injury following minor trauma [37]. The average sagittal lumbar spinal canal diameter and thecal sac diameter on MRI is approximately 16.9-18.7 mm and 12.9-15.3 mm, respectively [38]. In clinical practice, a midsagittal diameter of the lumbar thecal sac on MRI of < 12 mm is considered stenotic [39].
For reporting purposes, a method for quantifying the degree of spinal canal compromise must be simple, objective, reproducible, and clinically relevant. One such method involves measuring the cross-sectional area in the transverse plane on axial images at the sites of most severe compromise and comparing these measurements to the expected normal canal dimensions. The degree of spinal canal compromise is then assigned the designation of mild, moderate, or severe narrowing if the narrowing constitutes less than one-third, greater than one-third but less than two-thirds, and greater than two-thirds of the spinal canal, respectively. An additional qualitative grading of lumbar spine stenosis is performed by assessing the degree of cauda equina nerve root aggregation [40]. In this method, mild stenosis is present if there is narrowing of the thecal sac, but separation of the cauda equina nerve roots. Moderate stenosis exists when there is some aggregation of cauda equina nerve roots. Severe stenosis is defined by lack of separation of the cauda equina nerve roots.
In addition to the degree of spinal canal compromise, degenerative changes of the spine may contact, result in mass effect upon, or impinge the spinal cord or nerve roots. In the cervical and thoracic spine, posterior disc-osteophyte complexes or disc herniations may result in less than severe spinal canal stenosis, but they can impinge upon the spinal cord resulting in myelopathy. In the lumbar spine, severe spinal canal stenosis impinges upon the cauda equina nerve roots, resulting in cauda equina syndrome. This condition results in low back pain, lower extremity weakness, bilateral lower extremity radiculopathy, loss of bowel and bladder function, saddle anaesthesia, sexual dysfunction, and loss of lower extremity reflexes.
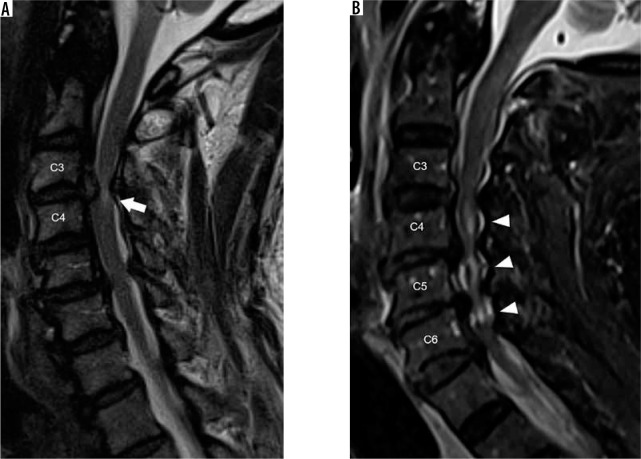
It is also crucial to detect and describe any associated spinal cord signal changes, because increased T2W signal intensity within the spinal cord suggests cord oedema or myelomalacia. Both cord oedema and myelomalacia will show increased T2W signal intensity within the spinal cord. Spinal cord oedema is an acute process with increased water content resulting in expansion of the cord volume with T2W hyperintensity often demonstrating ill-defined margins (Figure 18A). Whereas myelomalacia is irreversible damage resulting in gliosis with decreased spinal cord volume, often with discrete margins of the T2W hyperintensity (Figure 18B). When the signal abnormality is confined to the central grey matter, myelomalacia may result in a snake-eye appearance on axial images [41]. In the setting of severe spinal canal compromise resulting in severe compression of the spinal cord, the differentiation of cord oedema from myelomalacia may be impossible on imaging. Both cord oedema and myelomalacia may result in the clinical syndrome of myelopathy, a constellation of symptoms and signs including weakness, stiffness, pain, unsteady gait, hyperreflexia, and numbness affecting different portions of the body based upon the involved spinal cord level.
Figure 18.
Severe spinal canal narrowing, cord oedema, and myelomalacia – sagittal T2W (A) magnetic resonance (MR) image of the cervical spine demon- strates a large C3-C4 disc extrusion with cranial migration, resulting in severe spinal canal narrowing with hyperintense signal in the impinged spinal cord (arrow). The ill-definition of the spinal cord hyperintensity suggests cord oedema over myelomalacia. Sagittal short-tau inversion recovery (B) MR image of the cervical spine in a different patient shows multilevel severe spinal canal narrowing secondary to posterior disc-osteophyte complexes with resultant multilevel hyperintensity within the underlying spinal cord (arrowheads). The well-defined and central location of the spinal cord signal abnormality suggests myelomalacia over spinal cord oedema
A similar scheme for mild, moderate, and severe stenosis can be used for neural foraminal narrowing throughout the spine or subarticular recess narrowing for the lumbar spine. In the lumbar and thoracic spine, sagittal T2W imaging displays the cross-section of the neural foramina and is thus the best view for quantifying neural foraminal compromise (Figure 19A). The lumbar neural foramina normally appear as a keyhole configuration with nerve roots occupying the wider superior aspect of the foramen. In the cervical spine, the neural foramina are oriented in an oblique direction extending posteromedial to anterolateral, approximately 45° from the true sagittal and coronal planes. As such, axial T2W imaging gives a better approximation of neural foraminal stenosis than sagittal T2W imaging in the cervical spine. Acquiring bilateral sagittal oblique T2W imaging perpendicular to the oblique axis of the cervical neural foramina allows for viewing the cross-sectional area of the foramina, similar to sagittal T2W imaging of the lumbar spine, and it gives the most accurate view to evaluate neural foraminal stenosis in the cervical spine [42].
Figure 19.
Severe neural foraminal and subarticular recess narrowing – sagittal T2W (A) magnetic resonance (MR) image of the lumbar spine demonstrates complete effacement of normal fat signal in the right L4-L5 neural foramen from a combination of disc bulge, facet hypertrophy, and ligamentum flavum thickening which impinges upon the exiting L4 nerve root (white arrow). Note the normal keyhole configuration of the remaining lumbar neural foramina with fat surrounding the exiting nerve roots. Axial T2W (B) MR image through the L3-L4 intervertebral disc in another patient demonstrates a right subarticular disc herniation which effaces the right subarticular recess (white arrowhead) without clear delineation of the traversing right L4 nerve root. Axial T2W (C) MR image through the L4-L5 intervertebral disc in a different patient demonstrates a right extraforaminal zone disc herniation contacting the adjacent right L4 nerve (black arrow). Note the normal left L4 nerve in the left extraforaminal zone (black arrowhead)
Severe neural foraminal narrowing impinges upon the exiting nerve root. Damage to the exiting nerve root causes radiculopathy, resulting in pain along the dermatome supplied by the nerve root, muscle weakness, and sensory loss. In the cervical spine, the exiting nerve root corresponds to the more caudal segment at the intervertebral disc level (e.g. the C5 nerve root exits the C4-C5 neural foramen). The exception is the C8 nerve roots, which exit through the C7-T1 neural foramina. In the remaining thoracic and lumbar spine, the exiting nerve roots correspond to the more cranial segment at the intervertebral disc level (e.g. the L4 nerve root exits the L4-L5 neural foramen). In the lumbar spine, narrowing of the subarticular recess may also result in radiculopathy of the transiting nerve root (Figure 19B). The subarticular recess is occupied by the transiting nerve root, which exits the next more caudal neural foramen (e.g. L3 nerve root transits through the L2-L3 subarticular recess and exits the L3-L4 neural foramen). Finally, disc bulges and herniations can extend laterally into the extraforaminal zones to contact the exiting nerves (Figure 19C). These extraforaminal disc herniations can result in a radiculopathy similar to a foraminal disc extrusion at the same level (e.g. L3-L4 extraforaminal disc herniation contacts the L3 nerve root).
Spondylolysis and spondylolisthesis
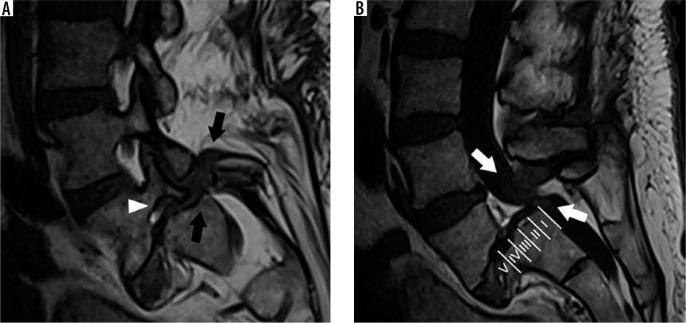
Spondylolysis (e.g. pars interarticularis defects) are stress fractures of the pars interarticularis, typically occurring in the lower lumbar spine. Although many patients may be asymptomatic, these defects may cause focal pain, particularly during activity or extension. MRI may demonstrate the osseous defects of the pars interarticularis, bone marrow oedema, and/or increased sagittal dimension of the spinal canal due to distraction of the posterior elements (Figure 20A) [43]. In addition, spondylolysis may cause malalignment of the spine in which the affected vertebra is anteriorly displaced with respect to the adjacent caudal vertebral segment, termed isthmic spondylolisthesis. These findings are best visualised on sagittal sequences.
Figure 20.
Spondylolysis and spondylolisthesis – sagittal T1W (A) magnetic resonance (MR) image of the lower lumbar spine through the neural foramina demonstrates discontinuity of the L5 pars interarticularis (black arrows), consistent with spondylolysis. Anterolisthesis of L5 on S1 with loss of intervertebral disc height results in severe neural foraminal narrowing with impingement upon the exiting L5 nerve root (arrowhead). Sagittal T1W (B) MR image of the lower lumbar spine through the midline demonstrates grade IV anterolisthesis of L5 on S1. The Meyerding grade of lumbar anterolisthesis is established by comparing the location of the inferoposterior margin of the L5 vertebral body with respect to the superior endplate of S1, which is divided into quarters (labels). Facet hypertrophy and ligamentum flavum thickening results in severe spinal canal narrowing (white arrows)
In the medical literature, the accuracy of MRI for the diagnosis of spondylolysis is wide-ranging, from 36 to 97% [44,45]. This variation is probably multifactorial. When compared to CT, MRI is less sensitive for the detection of abnormalities in cortical bone, leading to false negative exams. False positive exams are probably a consequence of thinning of the pars interarticularis, osseous sclerosis, or partial volume averaging of adjacent marginal osteophytes in the setting of facet arthrosis [46]. Bone scintigraphy with single photon emission computed tomography (SPECT) fused with CT is the most sensitive study for the detection of symptomatic spondylolysis. The CT portion of the exam detects the osseous defects within the pars interarticularis, while single-photon emission computed tomography identifies the physiological result of increased bone turnover at the site of stress fracture [47].
Aside from malalignment caused by spondylolysis, spondylolisthesis may be a consequence of facet arthrosis and subsequent loss of the normal motion-limiting function of the facet joints, termed degenerative spondylolisthesis. Spondylolisthesis can be classified by the direction in which the more cranial vertebral segment is translated in reference to the adjacent caudal vertebral segment into anterolisthesis, retrolisthesis, and laterolisthesis. The Meyerding classification is a severity grading of lumbar spine anterolisthesis defined by the degree of slippage of the posterior margin of the inferior endplate of the translated vertebral body with respect to the adjacent caudal vertebra’s superior endplate, which is subdivided into four quarters (Figure 20B) [48]. The Meyerding grade is then defined by the percentage of uncovering of the superior endplate, as follows: Grade I 0-25%, grade II 26-50%, grade III 51-75%, grade IV 75-100%, and grade V > 100% with complete uncovering to the superior endplate (e.g. spondyloptosis). Although a similar grading system could be employed for cervical spondylolisthesis or lumbar retrolisthesis, a direct length measurement of the spondylolisthesis and resultant degree of spinal canal stenosis gives more useful information to clinicians. For instance, even a grade I anterolisthesis at C6-C7 potentially results in severe spinal canal narrowing and spinal cord impingement. The degree of spondylolisthesis is measured from the posterior margin of the cranial vertebral body with respect to the posterior margin of the adjacent caudal vertebral body, where more than 3 mm of degenerative anterolisthesis in the cervical spine is considered abnormal [49].
Baastrup syndrome and intraspinal posterior epidural cyst
Baastrup syndrome (e.g. kissing spine syndrome) is a painful condition resulting from contact between adjacent spinous processes of the lumbar spine with subsequent pseudo-articulations and degenerative changes. This condition causes focal midline pain that is relieved with flexion and accentuated by extension. On MRI, Baastrup syndrome is suggested by hypertrophy of the lumbar spinous processes, contact between these spinous processes, T2 hyperintense bursal fluid between the spinous processes, irregularity and sclerosis of the affected osseous cortex, and bone marrow oedema underlying the pseudo-articulations (Figure 21) [50].
Figure 21.
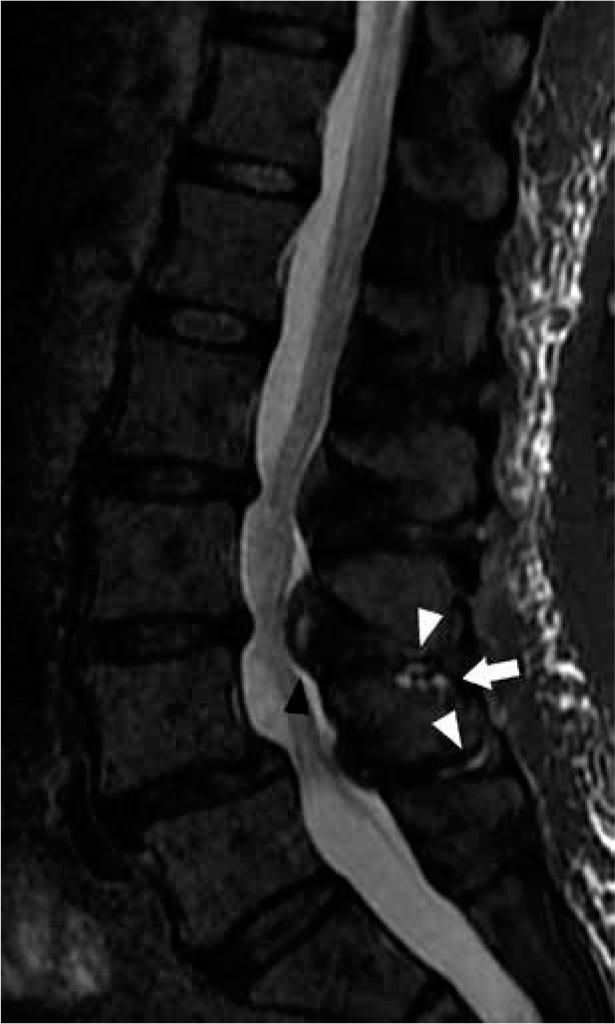
Baastrup syndrome and intraspinal posterior epidural cyst – sagittal short-tau inversion recovery magnetic resonance image of the lumbar spine shows thin hyperintense bursal fluid in the L3-L4 and L4-L5 interspinous spaces (white arrowheads) and L4 spinous process subcortical cyst-like changes (arrow), findings compatible with Baastrup syndrome. In addition, there is a hyperintense cystic lesion in the posterior midline spinal canal anterior to the L3-L4 interspinous space (black arrowhead), consistent with an intraspinal posterior epidural cyst
A potential complication of Baastrup syndrome is the development of an intraspinal posterior epidural cyst.
This cyst is an anterior extension of bursa formation between the lumbar spinous processes, which results in a mass effect upon the posterior epidural space and variable degrees of spinal canal stenosis [51]. Unlike synovial cysts, which extend from the adjacent facet joint into the posterolateral aspect of the spinal canal, intraspinal posterior epidural cysts project into the midline posterior epidural space.
Spine infection
Acute pyogenic spondylodiscitis
To recognise the MRI characteristics of acute pyogenic spondylodiscitis (e.g. discitis-osteomyelitis), it is important to understand the underlying pathophysiology of this infectious process. The intervertebral discs do not have a direct blood supply and rely on the rich end arteries within the metaphyseal regions underlying the vertebral endplates to obtain nutrients [52]. These end arteries of the metaphyseal arcade along the vertebral endplates are the site of haematogenous seeding of bacteria from septic microthrombi during states of bacteraemia. Following the initial vertebral endplate osteomyelitis, the proteolytic enzymes produced by bacteria allow infection to spread contiguously into the adjacent intervertebral disc and eventually to the contralateral vertebral endplate, resulting in both discitis and osteomyelitis [53].
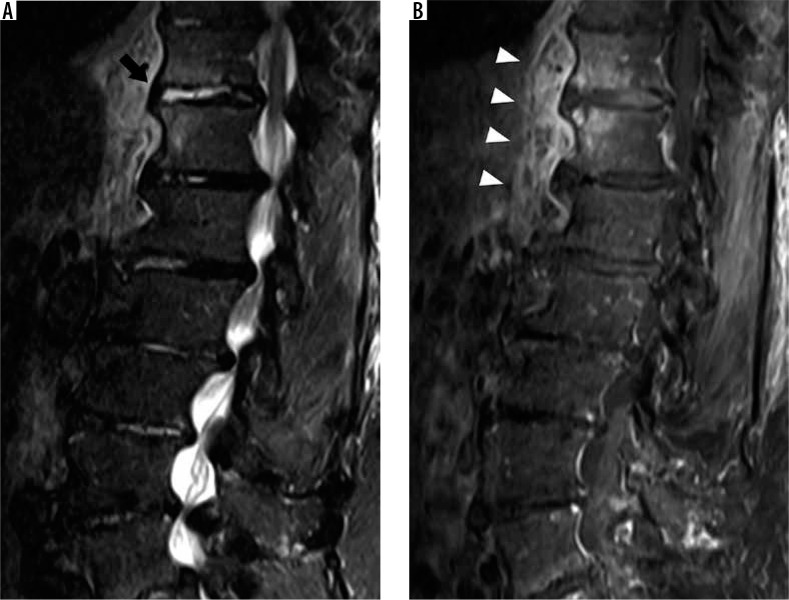
The earliest MRI findings of acute pyogenic spondylodiscitis are bone marrow signal changes and destruction of a single vertebral endplate [54]. The cortex of the vertebral endplate appears as a thin dark edge on T1W and T2W imaging. In the setting of osteomyelitis, loss of this dark edge is indicative of cortical destruction. Bone marrow inflammation results in T1W hypointensity, with marrow having signal less than adjacent muscle T1W signal intensity, along with T2W hyperintensity and post-gadolinium enhancement. Additional early MRI findings include inflammatory enhancement and T2W hyperintensity within the paravertebral soft tissues or epidural space. As infection progresses, MRI findings of both discitis and osteomyelitis affecting the intervertebral disc and both adjacent vertebral endplates will exist. Concomitant discitis results in T2W hyperintensity, similar to water signal intensity, with post-gadolinium enhancement (Figure 22). As proteolytic enzymes break down the intervertebral disc, loss of intervertebral disc height occurs (Figure 23). The imaging findings with the highest sensitivity for pyogenic spondylodiscitis include the presence of paraspinal or epidural inflammation, fluid signal within the intervertebral disc, and vertebral endplate erosion [55]. These MRI findings can be accentuated by utilising fat suppression sequences, such as short-tau inversion recovery (STIR) or T1W post-gadolinium with chemical fat saturation.
Figure 22.
Acute pyogenic spondylodiscitis – sagittal short-tau inversion recovery (STIR) (A) and T1W post-contrast fat-suppressed (B) magnetic resonance images of the lumbar spine demonstrate STIR hyperintensity within the T11-T12 intervertebral disc (black arrow) with adjacent bone marrow oedema and prevertebral inflammatory changes (white arrowheads) in this case of acute pyogenic spondylodiscitis
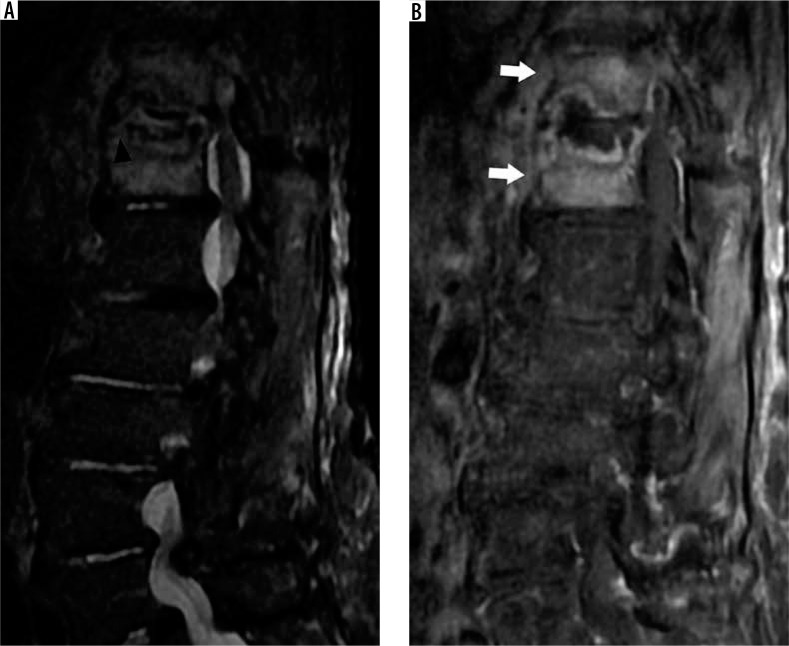
Figure 23.
Acute pyogenic spondylodiscitis (two months later) – sagittal short-tau inversion recovery (A) and T1W post-contrast fat-suppressed (B) mag- netic resonance (MR) images of the lumbar spine of the same patient in Figure 22 show loss of intervertebral disc height and endplate destruction (black arrowhead) at T11-T12 with increase in bone marrow oedema (white arrows) as this infection progresses two months after the MR imaging in Figure 22
Rim-enhancing T2W hyperintense fluid collections within the intervertebral disc, adjacent paraspinal soft tissues, or in the epidural space, correspond to abscess formation. Diffusion-weighted imaging (DWI) is also helpful in the detection of abscesses because the purulent material within the abscess restricts the free diffusion of water molecules, resulting in high diffusion trace and low apparent diffusion coefficient (ADC) map signal intensity [56]. DWI is particularly useful in helping to detect abscesses when post-gadolinium T1W imaging cannot be performed, such as in patients with end-stage renal disease.
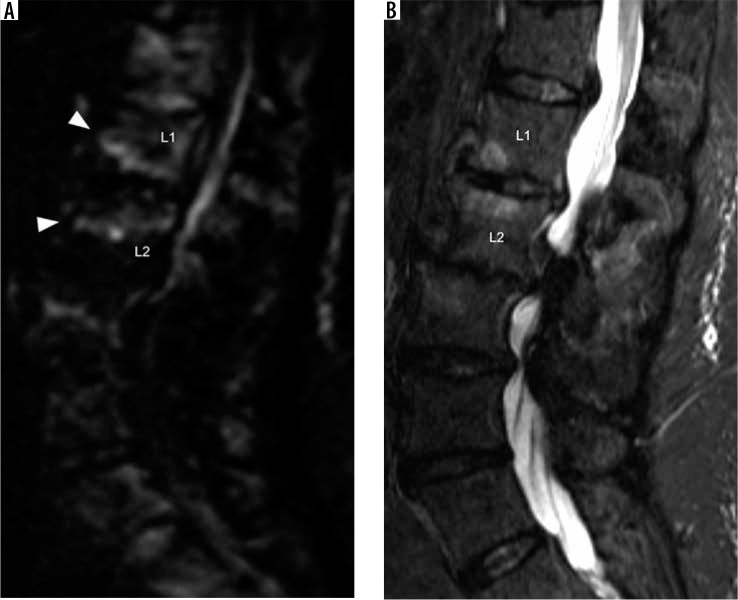
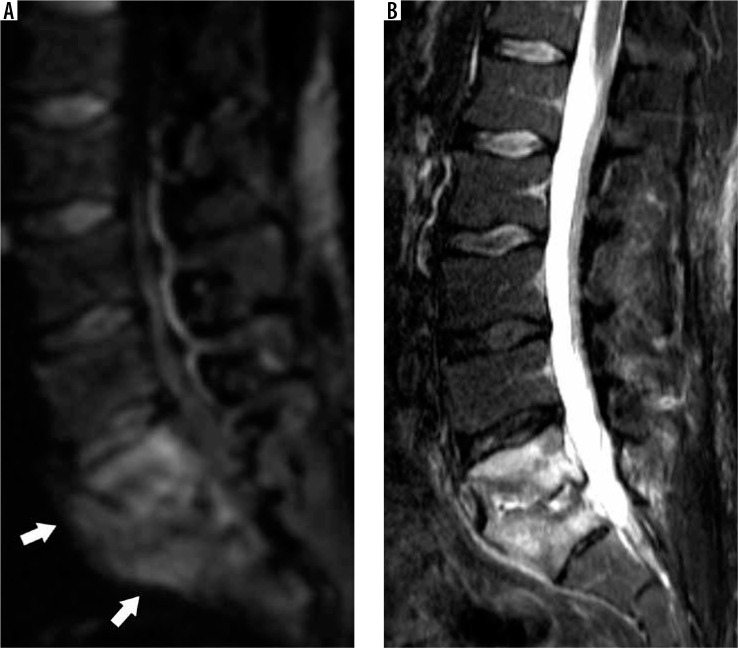
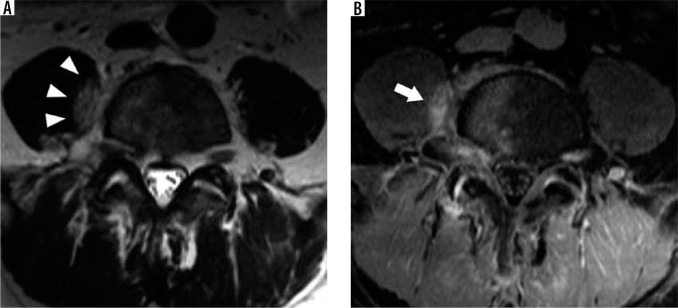
Acute pyogenic spondylodiscitis can have a similar MRI appearance to degenerative disc disease with Modic type I degenerative marrow signal changes. The claw sign on sagittal DWI can be helpful in differentiating pyogenic spondylodiscitis from Modic type I degenerative changes [57]. A positive claw sign in which there is a discrete edge of diffusion hyperintensity involving the peripheral region of bone marrow oedema is consistent with Modic type I degenerative endplate changes (Figure 24). Whereas a negative claw sign, in which there are diffuse and ill-defined margins of diffusion hyperintensity within the corresponding bone marrow signal abnormality, corresponds to discitis-osteomyelitis (Figure 25). In addition, the imaging psoas sign, T2W hyperintensity within the adjacent psoas musculature, corresponds to focal myositis, resulting from contiguous spread of infection, and is highly specific for adjacent spondylodiscitis (Figure 26) [58].
Figure 24.
Positive diffusion claw sign – sagittal diffusion trace (A) and short-tau inversion recovery (B) magnetic resonance images of the lumbar spine show well-defined linear diffusion hyperintensity (arrowheads) along the margins of bone marrow short-tau inversion recovery hyperintensity along the anterior aspect of the L1-L2 intervertebral disc, compatible with positive diffusion claw sign associated with Modic type I degenerative marrow changes
Figure 25.
Negative diffusion claw sign – sagittal diffusion trace (A) and short-tau inversion recovery (STIR) (B) magnetic resonance images of the lumbar spine demonstrate ill-defined marrow diffusion hyperintensity (white arrows) with corresponding STIR hyperintensity about the L5-S1 intervertebral disc, compatible with a negative claw sign. There is STIR hyperintensity and collapse of the L5-S1 intervertebral disc with adjacent endplate destruction in this case of acute pyogenic spondylodiscitis
Figure 26.
Imaging psoas sign – axial T2W (A) magnetic resonance (MR) image through the lower lumbar spine demonstrates hyperintensity within the medial aspect of the right psoas muscle adjacent to the L4-L5 intervertebral disc (arrowheads), compatible with the imaging psoas sign in this case of L4-L5 acute pyogenic spondylodiscitis. Axial T1W post-contrast fat-suppressed (B) MR image at the same level shows similar inflammatory enhancement within the right psoas muscle (arrow) and enhancing bone marrow oedema
Epidural abscess
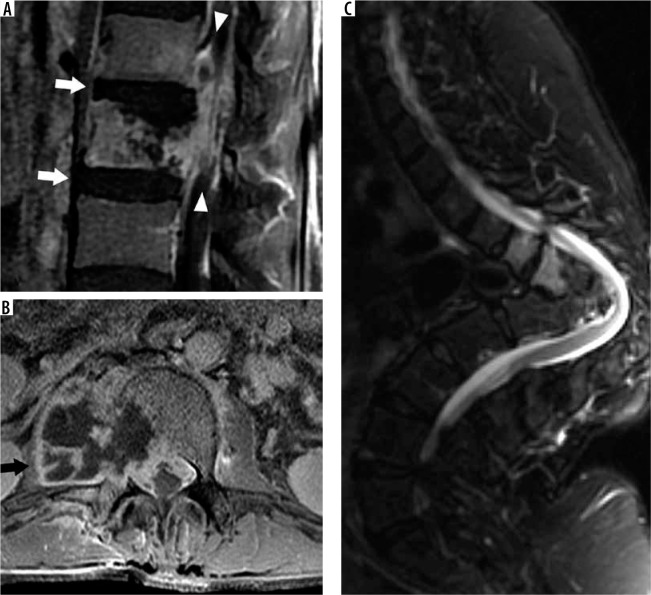
Spinal epidural abscess is a life-threatening infection of the epidural space resulting in a purulent collection that may result in mechanical compression or vascular compromise of the spinal cord or cauda equina. The infection is most commonly pyogenic, typically caused by Staphylococcus aureus followed by coagulase-negative staphylococci (e.g. S. epidermidis), Escherichia coli, and Pseudomonas aeruginosa, but it may also be mycobacterial, fungal, or parasitic in aetiology [59]. Spinal epidural abscesses may be caused by direct inoculation during recent surgery or spinal intervention, contiguous spread from concomitant discitis-osteomyelitis, or haematogenous spread.
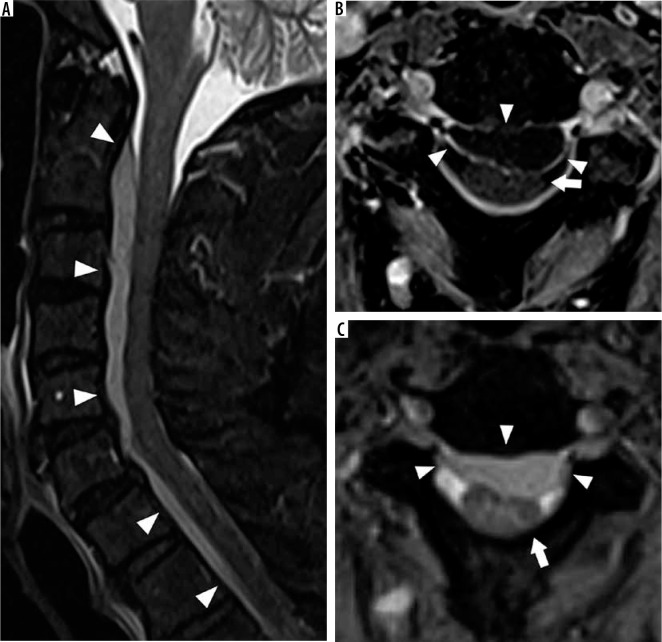
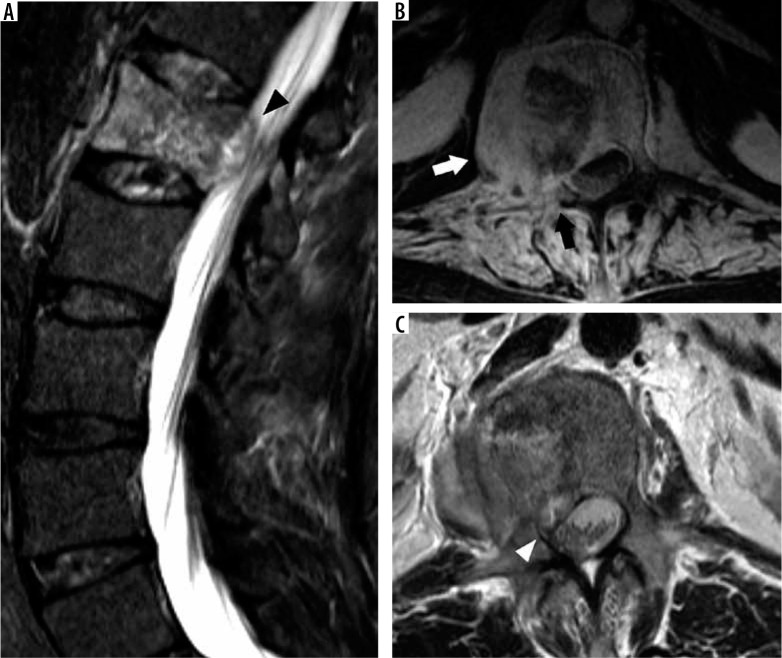
MRI is the most effective imaging modality for the detection of spinal epidural phlegmon and abscess. Epidural phlegmon corresponds to mass-like epidural inflammatory tissue without discernible drainable purulent material. On MRI, epidural phlegmon is characterised by homogeneous or mildly heterogenous enhancement and T2W hyperintense material in the epidural space. In comparison, epidural abscess appears as peripherally enhancing T2 hyperintense fluid collection(s) within the epidural space (Figure 27). The non-enhancing purulent material will also demonstrate restricted diffusion on diffusion-weighted imaging. It is imperative to document abscess length, enhancement pattern, degree of resultant spinal canal stenosis, mass effect upon the thecal sac and spinal cord, and presence or absence of spinal cord oedema, because these factors may be used for prognostication [60]. The MRI findings of inciting discitis-osteomyelitis or septic facet arthritis may also be present.
Figure 27.
Epidural abscess – sagittal short-tau inversion recovery (STIR) (A), axial T1W post-contrast fat-suppressed (B), and axial T2 gradient-recalled echo (C) magnetic resonance images of the cervical spine demonstrate an anterior epidural fluid collection (arrowheads) with mildly hypointense STIR signal intensity with respect to cerebrospinal fluid and peripheral enhancement, compatible with epidural abscess. This abscess results in posterior mass effect upon the cervical spinal cord (arrows)
Tuberculous spondylodiscitis
Spinal tuberculosis (e.g. tuberculous spondylodiscitis, Pott disease) is a common form of extrapulmonary osseous tuberculosis in which the vertebrae are infected with Mycobacterium tuberculosis. The infection is typically a result of hematogenous spread but may occur from contiguous or lymphatic spread from the adjacent lungs and pleura [61]. Hematogenous spread can occur by the arterial route or through the valve-less Batson paravertebral venous plexus. As M. tuberculosis lacks the proteolytic enzymes responsible for early discogenic infection in acute pyogenic spondylodiscitis, early spinal tuberculosis often spares the intervertebral disc. Spread of infection to contiguous vertebral bodies results from either further haematogenous spread through Batson paravertebral venous plexus or subligamentous spread, in which infection spreads deep to the ALL along the anterior margins of the vertebral bodies and intervertebral discs. Hematogenous spread through the valve-less veins of the venous plexus of Batson may also result in spinal osteomyelitis involving non-contiguous vertebrae.
On MRI, spinal tuberculosis first results in vertebral body osteomyelitis, with T1W hypointensity, T2W/STIR hyperintensity, and post-gadolinium enhancement within the vertebral marrow (Figure 28A). The osteomyelitis may be solitary or multifocal, with multifocal infection involving contiguous or non-contiguous vertebral segments. The intervertebral disc may be spared in single vertebral involvement [62]. However, if contiguous vertebral segments are involved, resultant loss of nutrients to the intervertebral disc may result in necrosis with disc collapse. Vertebral osteomyelitis may also lead to vertebral body collapse, resulting in vertebra plana or anterior compression deformity.
Figure 28.
Tuberculous spondylodiscitis – sagittal T1W post-contrast fat-suppressed (A) magnetic resonance (MR) image of the lumbar spine demonstrates osteomyelitis of the L2 vertebral body with partial collapse of the superior endplate and extensive adjacent epidural phlegmon (white arrowheads) in this patient with spinal tuberculosis. The adjacent intervertebral discs do not exhibit inflammatory changes (white arrows), a finding more frequently encountered in spinal tuberculosis as opposed to pyogenic spondylodiscitis. Axial T1W post-contrast fat-suppressed (B) MR image through the L2 vertebra shows a well-defined rim-en- hancing collection extending into the right psoas muscle without significant adjacent inflammatory changes consistent with cold abscess (black arrow). Sagittal short-tau inversion recovery (C) MR image of the thoracolumbar spine in a different patient demonstrates multilevel severe anterior wedge compression deform- ities of the thoracolumbar junction with resultant severe focal kyphosis compatible with gibbus deformity in this patient with history of prior spinal tuberculosis
Spinal tuberculosis is frequently associated with thin-walled rim-enhancing fluid collections within the adjacent prevertebral, paraspinal, or epidural spaces (Figure 28B). These cold abscesses are infected fluid collections that lack the robust peripheral inflammatory stranding typical for pyogenic abscesses. Subligamentous spread of infection appears as inflammatory changes or rim-enhancing fluid collections tracking in the craniocaudal direction between the ALL and anterior margins of the vertebral bodies and intervertebral discs.
MRI findings that differentiate tuberculous spondylodiscitis from pyogenic spondylodiscitis include well-defined paraspinal abnormal signal, thin and smooth abscess walls, subligamentous spread of more than three vertebral levels, involvement of multiple vertebral bodies, and thoracic spine involvement [63]. It is also more common to have severe vertebral destruction, epidural abscess, and meningeal enhancement associated with tuberculous spondylodiscitis [64]. Tuberculous spondylodiscitis is a common cause of gibbus deformity, a severe focal kyphosis resulting from anterior compression deformities of one or more vertebral bodies, typically at the thoracolumbar junction, which may compromise the spinal canal (Figure 28C).
Septic facet arthritis
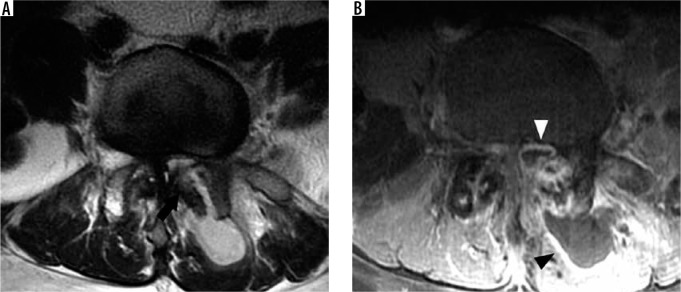
The facet or zygapophysial joints of the spine are paired synovial joints between the articular processes of adjacent vertebrae that guide and limit spinal motion. Septic facet arthritis results from bacterial or fungal infection of the facet joint resulting from either direct inoculation, such as in the setting of therapeutic facet joint injections, or haematogenous spread [65]. Septic facet arthritis is typically unilateral; however, infection can occasionally spread to the contralateral facet joint through the retrodural space of Okada [66].
There is a lot of overlap between the imaging findings of septic facet arthritis and active synovitis associated with degenerative facet arthrosis, including joint effusions, enhancement of the synovial lining of the joint, articular surface erosions, subchondral marrow oedema, and periarticular inflammation (Figure 29) [67]. Therefore, correlation with patient history, clinical evaluation, and serum inflammatory markers are helpful in suggesting the diagnosis of septic facet arthritis. Restricted diffusion of the facet effusions would confirm purulent material occupying the joint space in the setting of septic facet arthritis. Adjacent posterior epidural inflammatory changes, epidural abscess, or paraspinal abscess are also findings that suggest septic facet arthritis as opposed to facet arthrosis.
Figure 29.
Septic facet arthritis – axial T2W (A) and T1W post-contrast fat-suppressed (B) magnetic resonance images through the L4-L5 intervertebral disc demonstrate a left facet effusion with indistinctness of the articular surfaces with underlying bone marrow oedema (arrow) in this case of septic facet arthritis. Extension of rim-enhancing collection into the epidural space (white arrowhead) contributes to severe spinal canal narrowing. There is also a large paraspinal fluid collection (black arrowhead) with adjacent inflammation
Insufficiency and pathologic fractures
Stress fractures occur when there is an imbalance between the mechanical load and the strength of the osseous architecture. Fatigue fractures are a type of stress fracture that occurs when the osseous architecture of the bone is normal, but the mechanical load is increased, through repetition, duration, or intensity. The microtrauma induced cannot be repaired or remodelled prior to further microtrauma and fatigue fractures pursue. Insufficiency fractures are also a type of stress fracture that occur when the mechanical load is normal, but the underlying osseous architecture is weakened, either by imbalances in bone remodelling pathways or due to an underlying osseous lesion. Pathologic fractures occur as a result of an underlying osseous lesion, either benign or malignant.
Osteoporosis, as defined by the World Health Organisation, is a reduction in the bone mineral density, based on dual-energy X-ray absorptiometry, of more than 2.5 standard deviations below the mean (of an average 30-year-old with the same gender and of the same ethnicity). Patients with osteopaenia and osteoporosis are prone to insufficiency fractures and preventative treatment with bisphosphonates (or non-bisphosphonate therapies –denosumab, teriparatide, abaloparatide, romosozumab or various hormonal regimes) is recommended. Common locations for insufficiency fractures include the vertebrae, pelvis (sacrum, iliac wing, ilium, supra-acetabular, parasymphyseal and pubic rami), femur (neck of femur and proximal femoral shaft), sternum, fibula, and tibia. Osteoporosis is the most common cause of vertebral insufficiency fracture, but there are many pathological states that can disrupt the homeostasis of bone metabolism and lead to various insufficiency fractures (Table 3).
Table 3.
Aetiology of insufficiency fractures
| Osteoporosis |
| Hyperparathyroidism (primary, secondary: renal osteodystrophy and either dietary or malabsorption vitamin D or calcium deficiency, and tertiary) |
| Osteomalacia or rickets |
| Skeletal dysplasia or collagen diseases (including osteogenesis imperfecta, osteopetrosis, fibrous dysplasia, Marfan syndrome, Ehlers-Danlos syndrome) |
| Paget disease |
| Radiation therapy |
| Chemotherapy (including ifosfamide, methotrexate) |
| Steroid therapy |
| Chronic diseases (diabetes mellitus, alcoholism, Cushing syndrome, rheumatoid arthritis, spondyloarthropathies) |
| Inactivity |
Please note crossover exists between most of the above causes, i.e. between hyperparathyroidism and osteomalacia.
Magnetic resonance imaging differentiation of vertebral insufficiency fracture from malignant pathologic fracture
Elderly patients are prone to the development of both vertebral insufficiency fracture (VIF) and pathologic fracture from underlying malignancy [68]. As clinical features of both VIF and malignant pathologic fracture (MPF) are similar, imaging is often necessary to distinguish between these types of fractures. Differentiation is obviously important because detection of MPF necessitates tissue sampling to establish pathological diagnosis, requires additional clinical and imaging workup, and directs appropriate therapy.
The presence of additional osseous metastases or mass-like (enhancing) soft tissue in the epidural compartment or paravertebral soft tissues is most consistent with MPF. MRI is superior for the evaluation of bone marrow replacement processes when compared to CT, and may help identify additional osseous lesions that are not readily seen on CT. Within a fractured vertebral body, if normal bone marrow signal is replaced completely, it is more frequently associated with MPF. Conversely, when the bone marrow signal is entirely normal or preserved, it is more frequently associated with VIF [69]. Unfortunately, there is often a spectrum of both normal and abnormal bone marrow within either VIFs or MPFs, making distinction difficult or less precise. The distinction between the two processes can be further hindered by diffusely infiltrative haematological malignancies that demonstrate homogeneous bone marrow signal abnormality, which may be inadvertently interpreted as normal. In addition, in a review of vertebral fractures in patients with multiple myeloma, many of the MPF appeared similar to VIF [70,71].
VIF more frequently demonstrate a cleft of fluid or fluid sign interposed between the fracture and the endplate with the fracture or trabecular injury defined by an uninterrupted linear defect that is low signal on both T1W and T2W sequences (Figure 30) [72]. Pedicle and posterior element MRI signal abnormality are more common with MPF. This signal abnormality is a result of marrow tumour involvement in MPF and extension of marrow oedema in VIF. If the pedicle is expanded, this is consistent with tumoural infiltration of MPF [73].
Figure 30.
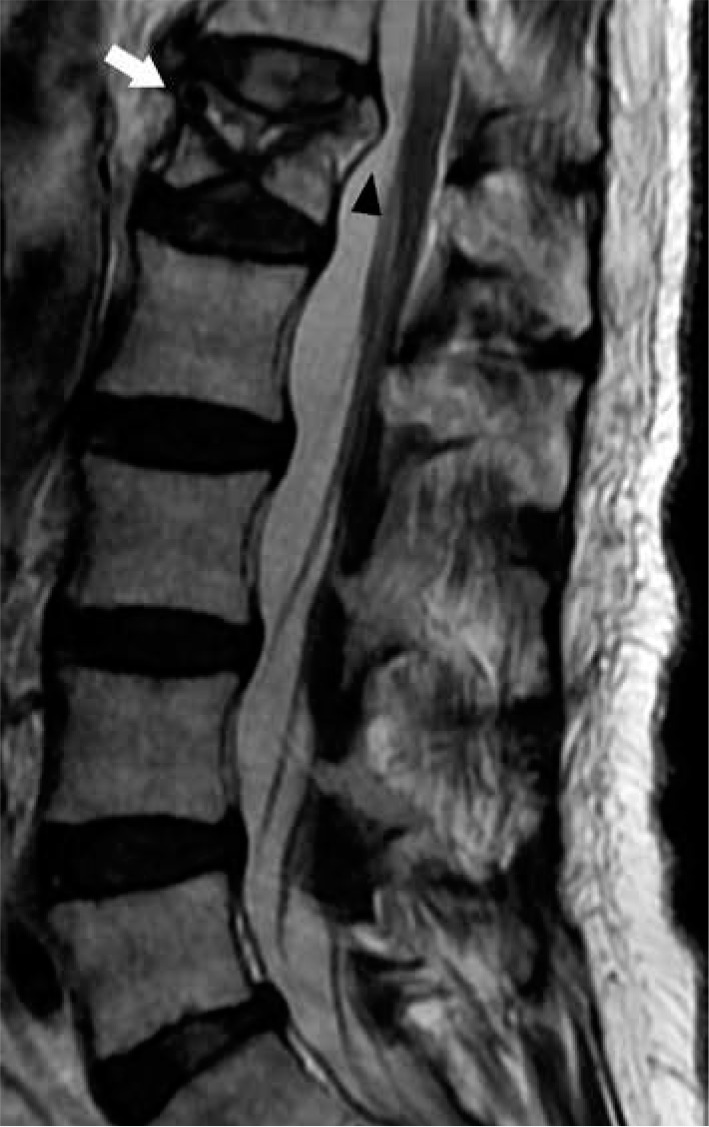
Vertebral insufficiency fracture – sagittal T2W magnetic resonance image of the lumbar spine demonstrates compression fractures of the L1 supe- rior and inferior endplates with hyperintensity situated between the superior endplate and curvilinear hypointense fracture line, compatible with fluid sign of VIF (arrow). There is retropulsion of the posterior vertebral body (arrow- head) but without convex posterior margin of the vertebral body
The mass effect of an underlying tumour may expand the posterior vertebral body resulting in a convex posterior margin (Figure 31). The posterior convex margin is highly suggestive of MPF; however, VIF with retropulsion may also demonstrate this morphology [74]. The anterior epidural space contains multiple epidural ligaments, and the central septum is usually preserved in the presence of malignant extra-osseous soft tissue extension [75]. This results in a bilobed contour of anterior epidural space soft-tissue penetrance. By comparison, VIF often results in central septum disruption due to involvement of the posterior cortex and epidural haematoma.
Figure 31.
Malignant pathologic fracture – sagittal (A), axial (B) T1W post-contrast fat-suppressed, and axial T2W (C) magnetic resonance images through the lumbar spine demonstrate a mild compression fracture of L1 with posterior convex margin of the vertebral body (arrowhead). In addition, there is ex- tension of marrow enhancement into the right posterior elements with cortical destruction (black arrow), epidural soft tissue tumour narrowing of the right subarticular recess (white arrowhead), and abnormal enhancing soft tissue in the right prevertebral soft tissues (white arrow), compatible with malignant pathologic fracture in this patient with metastatic squamous cell carcinoma
The enhancement pattern associated with MPF is variable, from intensely homogeneous to heterogeneous enhancement, and may be similar to VIF [76]. Post-gadolinium T1W imaging is most useful in differentiating subacute or chronic VIF from MPF. During the acute phase of VIF, enhancement is often present. Follow-up imaging to assess for temporal reduced enhancement may be used as an indicator of VIF [77]. More recently, perfusion parameters obtained from dynamic contrast enhanced MRI are showing promise in differentiating VIF from MPF [78]. Of the multiple perfusion parameters available, plasma volume (Vp) and vessel permeability (Ktrans) are probably the best discriminators, with MPF demonstrating higher perfusion parameters compared to VIF.
Finally, DWI has also been applied to aid in the differentiation of vertebral insufficiency fractures from malignant vertebral fractures [79]. The magnitude of diffusion can be quantified by the ADC value from a region of interest for a designated b value. MPF demonstrates restricted diffusion and lower ADC values than VIF, due to the hypercellularity of tumour cells. Other advanced MRI techniques that show promise in differentiating VIF from MPF include quantitative assessment of T2* relaxation times and intravoxel incoherent motion MRI [80,81].
Conclusions
Back and neck pain are ubiquitous in today’s society, a common cause of disability, and a large burden to healthcare costs. When conservative management of low back or neck pain fails, MRI is the imaging modality of choice to assess for underlying abnormality. Knowledge of spine anatomy and imaging features of degenerative changes allow for appropriate reporting and directs appropriate patient management. MRI is also useful in detecting non-degenerative spine conditions, such as infection or insufficiency fractures, which may have a similar clinical presentation.
Conflict of interest
The authors report no conflict of interest.
References
- 1.Hoy D, March L, Brooks P, et al. The global burden of low back pain: estimates from the global burden of disease 2010 study. Ann Rheum Dis 2014; 73: 968-974. [DOI] [PubMed] [Google Scholar]
- 2.Maher C, Underwood M, Buchbinder R. Non-specific low back pain. Lancet 2017; 389: 736-747. [DOI] [PubMed] [Google Scholar]
- 3.Murray CJ, Lopez AD. Measuring the global burden of disease. N Engl J Med 2013; 369: 448-457. [DOI] [PubMed] [Google Scholar]
- 4.Dieleman JL, Baral R, Birger M, et al. US spending on personal health care and public health, 1996-2013. JAMA 2016; 316: 2627-2646. [DOI] [PMC free article] [PubMed] [Google Scholar]
- 5.Rao VM, Levin DC. The overuse of diagnostic imaging and the Choosing Wisely initiative. Ann Intern Med 2012; 157: 574-576. [DOI] [PubMed] [Google Scholar]
- 6.Kim LH, Vail D, Azad TD, et al. Expenditures and health care utilization among adults with newly diagnosed low back and lower extremity pain. JAMA Netw Open 2019; 2: e193676. [DOI] [PMC free article] [PubMed] [Google Scholar]
- 7.Patel ND, Broderick DF, Burns J, et al. ACR appropriateness criteria: lower back pain. Available at: https://acsearch.acr.org/docs/69483/Narrative/ (Accessed: 29.03.2020).
- 8.Nardo L, Alizai H, Virayavanich W, et al. Lumbosacral transitional vertebrae: association with low back pain. Radiology 2012; 265: 497-503. [DOI] [PMC free article] [PubMed] [Google Scholar]
- 9.Konin GP, Walz DM. Lumbosacral transitional vertebrae: classification, imaging findings, and clinical relevance. AJNR Am J Neuroradiol 2010; 31: 1778-1786. [DOI] [PMC free article] [PubMed] [Google Scholar]
- 10.Peckham ME, Hutchins TA, Stilwill SE, et al. Localizing the L5 vertebra using nerve morphology on MRI: an accurate and reliable technique. AJNR Am J Neuroradiol 2017; 38: 2008-2014. [DOI] [PMC free article] [PubMed] [Google Scholar]
- 11.Carrino JA, Campbell PD Jr, Lin DC, et al. Effect of spinal segment variants on numbering vertebral levels at lumbar MR imaging. Radiology 2011; 259: 196-202. [DOI] [PubMed] [Google Scholar]
- 12.Castellvi AE, Goldstein LA, Chan DP. Lumbosacral transitional vertebrae and their relationship with lumbar extradural defects. Spine 1984; 9: 493-495. [DOI] [PubMed] [Google Scholar]
- 13.Quinlan JF, Duke D, Eustace S. Bertolotti’s syndrome. A cause of back pain in young people. J Bone Joint Surg Br 2006; 88: 1183-1186. [DOI] [PubMed] [Google Scholar]
- 14.Raj PP. Intervertebral disc: anatomy–physiology–pathophysiology–treatment. Pain Pract 2008; 8: 18-44. [DOI] [PubMed] [Google Scholar]
- 15.Choi YS. Pathophysiology of degenerative disc disease. Asian Spine J 2009; 3: 39-44. [DOI] [PMC free article] [PubMed] [Google Scholar]
- 16.Pfirrmann CW, Metzdorf A, Zanetti M, et al. Magnetic resonance classification of lumbar intervertebral disc degeneration. Spine 2001; 26: 1873-1878. [DOI] [PubMed] [Google Scholar]
- 17.Griffith JF, Wang YX, Antonio GE, et al. Modified Pfirrmann grading system for lumbar intervertebral disc degeneration. Spine 2007; 32: E708-12. [DOI] [PubMed] [Google Scholar]
- 18.Munter FM, Wasserman BA, Wu HM, et al. Serial MR imaging of annular tears in lumbar intervertebral disks. AJNR Am J Neuroradiol 2002; 23: 1105-1109. [PMC free article] [PubMed] [Google Scholar]
- 19.Yu SW, Sether LA, Ho PS, et al. Tears of the anulus fibrosus: correlation between MR and pathologic findings in cadavers. AJNR Am J Neuroradiol 1988; 9: 367-370. [PMC free article] [PubMed] [Google Scholar]
- 20.Modic MT, Steinberg PM, Ross JS, et al. Degenerative disk disease: assessment of changes in vertebral body marrow with MR imaging. Radiology 1988; 166: 193-199. [DOI] [PubMed] [Google Scholar]
- 21.Jenson RK, Leboeuf-Yde C, Wedderkopp N, et al. Is the development of modic changes associated with clinical symptoms? A 14-month cohort study wih MRI. Eur Spine J 2012; 21: 2271-2279. [DOI] [PMC free article] [PubMed] [Google Scholar]
- 22.Crockett MT, Kelly BS, van Baarsel S, et al. Modic type 1 vertebral endplate changes: injury, inflammation, or infection? AJR Am J Roentgenol 2017; 209: 167-170. [DOI] [PubMed] [Google Scholar]
- 23.Fardon DF, Williams Al, Dohring EJ, et al. Lumbar disc nomenclature: version 2.0: recommendations of the combined task forces of the North American Spine Society, the American Society of Spine Radiology and the American Society of Neuroradiology. Spine J 2014; 14: 2525-2545. [DOI] [PubMed] [Google Scholar]
- 24.Fardon DF, Milette PC. Combined task forces of the North American Spine Society, American Society of Spine Radiology, and American Society of Neuroradiology. Nomenclature and classification of lumbar disc pathology. Recommendations of the combined task forces of the North American Spine Society, American Society of Spine Radiology, and American Society of Neuroradiology. Spine 2001; 26: E93-113. [DOI] [PubMed] [Google Scholar]
- 25.Diehn FE, Maus TP, Morris JM, et al. Uncommon manifestations of intervertebral disk pathologic conditions. Radiographics 2016; 36: 801-823. [DOI] [PubMed] [Google Scholar]
- 26.Wiltse LL, Berger PE, McCulloch JA. A system for reporting the size and location of lesions in the spine. Spine 1997; 22: 1534-1537. [DOI] [PubMed] [Google Scholar]
- 27.Hartman J. Anatomy and clinical significance of the uncinate process and uncovertebral joint: a comprehensive review. Clin Anat 2014; 27: 431-440. [DOI] [PubMed] [Google Scholar]
- 28.Weishaupt D, Zanetti M, Boos N, et al. MR imaging and CT in osteoarthritis of the lumbar facet joints. Skeletal Radiol 1999; 28: 215-219. [DOI] [PubMed] [Google Scholar]
- 29.Lattig F, Fekete TF, Grob D, et al. Lumbar facet joint effusion in MRI: a sign of instability in degenerative spondylolisthesis? Eur Spine J 2012; 21: 276-81. [DOI] [PMC free article] [PubMed] [Google Scholar]
- 30.Czervionke LF, Fenton DS. Fat-saturated MR imaging in the detection of inflammatory facet arthropathy (facet synovitis) in the lumbar spine. Pain Med 2008; 9: 400-406. [DOI] [PubMed] [Google Scholar]
- 31.Liu SS, Williams KD, Drayer BP, et al. Synovial cysts of the lumbosacral spine: diagnosis by MR imaging. AJR Am J Roentgenol 1990; 154: 163-166. [DOI] [PubMed] [Google Scholar]
- 32.Apostolaki E, Davies AM, Evans N, et al. MR imaging of lumbar facet joint synovial cysts. Eur Radiol 2000; 10: 615-623. [DOI] [PubMed] [Google Scholar]
- 33.Nouri A, Martin AR, Mikulis D, et al. Magnetic resonance imaging assessment of degenerative cervical myelopathy: a review of structural changes and measurement techniques. Neurosurg Focus 2016; 40: E5. [DOI] [PubMed] [Google Scholar]
- 34.Lee MJ, Cassinelli EH, Riew KD. Prevalence of cervical spine stenosis. Anatomic study in cadavers. J Bone Joint Surg Am 2007; 89: 376-380. [DOI] [PubMed] [Google Scholar]
- 35.Morishita Y, Naito M, Hymanson H, et al. The relationship between the cervical spinal canal diameter and the pathological changes in the cervical spine. Eur Spine J 2009; 18: 877-883. [DOI] [PMC free article] [PubMed] [Google Scholar]
- 36.Edwards VC, LaRocca H. The developmental segmental sagittal diameter of the cervical spinal canal in patients with cervical spondylosis. Spine 1983; 8: 20-27. [DOI] [PubMed] [Google Scholar]
- 37.Aebli N, Rüegg TB, Wicki AG, et al. Predicting the risk and severity of acute spinal cord injury after a minor trauma to the cervical spine. Spine J 2013; 13: 597-604. [DOI] [PubMed] [Google Scholar]
- 38.Pierro A, Cilla S, Maselli G, et al. Sagittal normal limits of lumbosacral spine in a large adult population: a quantitative magnetic resonance imaging analysis. J Clin Imaging Sci 2017; 7: 35. [DOI] [PMC free article] [PubMed] [Google Scholar]
- 39.Mamisch N, Brumann M, Hodler J, et al. Radiologic criteria for the diagnosis of spinal stenosis: results of a Delphi survey. Radiology 2012; 264: 174-179. [DOI] [PubMed] [Google Scholar]
- 40.Lee GY, Lee JW, Choi HS, et al. A new grading system of lumbar central canal stenosis on MRI: an easy and reliable method. Skeletal Radiol 2011; 40: 1033-1039. [DOI] [PubMed] [Google Scholar]
- 41.You JY, Lee JW, Lee E, et al. MR classification system based on axial images for cervical compressive myelopathy. Radiology 2015; 276: 553-561. [DOI] [PubMed] [Google Scholar]
- 42.Park HJ, Kim SS, Lee SY, et al. A practical MRI grading system for cervical foraminal stenosis based on oblique sagittal images. Br J Radiol 2013; 86: 20120515. [DOI] [PMC free article] [PubMed] [Google Scholar]
- 43.Ulmer JL, Mathews VP, Elster AD, et al. MR imaging of lumbar spondylolysis: the importance of ancillary observations. AJR Am J Roentgenol 1997; 169: 233-239. [DOI] [PubMed] [Google Scholar]
- 44.Yamaguchi KT Jr, Skaggs DL, Acevedo DC, et al. Spondylolysis is frequently missed by MRI in adolescents with back pain. J Child Orthop 2012; 6: 237-240. [DOI] [PMC free article] [PubMed] [Google Scholar]
- 45.Ganiyusufoglu AK, Onat L, Karatoprak O, et al. Diagnostic accuracy of magnetic resonance imaging versus computed tomography in stress fractures of the lumbar spine. Clin Radiol 2010; 65: 902-907. [DOI] [PubMed] [Google Scholar]
- 46.Johnson DW, Farnum GN, Latchaw RE, et al. MR imaging of the pars interarticularis. AJR Am J Roentgenol 1989; 152: 327-332. [DOI] [PubMed] [Google Scholar]
- 47.Trout AT, Sharp SE, Anton CG, et al. Spondylolysis and beyond: value of SPECT/CT in evaluation of low back pain in children and young adults. Radiographics 2015; 35: 819-834. [DOI] [PubMed] [Google Scholar]
- 48.Meyerding HW. Spondyloptosis. Surg Gynaecol Obstet 1932; 54: 371-377. [Google Scholar]
- 49.Dean CL, Gabriel JP, Cassinelli EH, et al. Degenerative spondylolisthesis of the cervical spine: analysis of 58 patients treated with anterior cervical decompression and fusion. Spine J 2009; 9: 439-446. [DOI] [PubMed] [Google Scholar]
- 50.Filippiadis DK, Mazioti A, Argentos S, et al. Baastrup’s disease (kissing spines syndrome): a pictorial review. Insights Imaging 2015; 6: 123-128. [DOI] [PMC free article] [PubMed] [Google Scholar]
- 51.Chen CK, Yeh L, Resnick D, et al. Intraspinal posterior epidural cysts associated with Baastrup’s disease: report of 10 patients. AJR Am J Roentgenol 2004; 182: 191-194. [DOI] [PubMed] [Google Scholar]
- 52.Ratcliffe JF. Anatomic basis for the pathogenesis and radiologic features of vertebral osteomyelitis and its differentiation from childhood discitis. A microarteriographic investigation. Acta Radiol Diagn 1985; 26: 137-143. [DOI] [PubMed] [Google Scholar]
- 53.Mavrogenis AF, Megaloikonomos PD, Igoumenou VG, et al. Spondylodiscitis revisited. EFFORT Open Rev 2017; 2: 447-461. [DOI] [PMC free article] [PubMed] [Google Scholar]
- 54.Yeom JA, Lee IS, Suh HB, et al. Magnetic resonance imaging findings of early spondylodiscitis: interpretive challenges and atypical findings. Korean J Radiol 2016; 17: 565-580. [DOI] [PMC free article] [PubMed] [Google Scholar]
- 55.Ledermann HP, Schweitzer ME, Morrison WB, et al. MR imaging findings in spinal infections: rules or myths? Radiology 2003; 228: 506-514. [DOI] [PubMed] [Google Scholar]
- 56.Moritani T, Kim J, Capizzano AA, et al. Pyogenic and non-pyogenic spinal infections: emphasis on diffusion-weighted imaging for the detection of abscesses and pus collections. Br J Radiol 2014; 87: 20140011. [DOI] [PMC free article] [PubMed] [Google Scholar]
- 57.Patel KB, Poplawski MM, Pawha PS, et al. Diffusion-weighted MRI claw sign improves differentiation of infectious from degenerative modic type 1 signal changes of the spine. AJNR Am J Neuroradiol 2014; 35: 1647-1652. [DOI] [PMC free article] [PubMed] [Google Scholar]
- 58.Ledbetter LN, Salzman KL, Shah LM. Imaging psoas sign in lumbar spinal infections: Evaluation of diagnostic accuracy and comparison with established imaging characteristics. AJNR Am J Neuroradiol 2016; 37: 736-741. [DOI] [PMC free article] [PubMed] [Google Scholar]
- 59.Darouiche RO. Spinal epidural abscess. N Engl J Med 2006; 355: 2012-2020. [DOI] [PubMed] [Google Scholar]
- 60.Tung GA, Yim JW, Mermel LA, et al. Spinal epidural abscess: correlation between MRI findings and outcome. Neuroradiology 1999; 41: 904-909. [DOI] [PubMed] [Google Scholar]
- 61.Trecarichi EM, Di Meco E, Mazzotta V, et al. Tuberculous spondylodiscitis: epidemiology, clinical features, treatment, and outcome. Eur Rev Med Pharmacol Sci 2012; 16: 58-72. [PubMed] [Google Scholar]
- 62.Smith AS, Weinstein MA, Mizushima A, et al. MR imaging characteristics of tuberculous spondylitis vs vertebral osteomyelitis. AJR Am J Roetngenol 1989; 153: 399-405. [DOI] [PubMed] [Google Scholar]
- 63.Jung NY, Jee WH, Ha KY, et al. Discrimination of tuberculous spondylitis from pyogenic spondylitis on MRI. AJR Am J Roentgenol 2004; 182: 1405-1410. [DOI] [PubMed] [Google Scholar]
- 64.Frel M, Białecki J, Wieczorek J, et al. Magnetic resonance imaging in differential diagnosis of pyogenic spondylodiscitis and tuberculous spondylodiscitis. Pol J Radiol 2017; 82: 71-87. [DOI] [PMC free article] [PubMed] [Google Scholar]
- 65.Rajeev A, Choudhry N, Shaikh M, et al. Lumbar facet joint septic arthritis presenting atypically as acute abdomen–a case report and review of the literature. Int J Surg Case Rep 2016; 25: 243-245. [DOI] [PMC free article] [PubMed] [Google Scholar]
- 66.Murthy NS, Maus TP, Aprill C. The retrodural space of Okada. AJR Am J Roentgenol 2011; 196: W784-9. [DOI] [PubMed] [Google Scholar]
- 67.Doita M, Nishida K, Miyamoto H, et al. Septic arthritis of bilateral lumbar facet joints: report of a case with MRI findings in the early stage. Spine 2003; 28: E198-202. [DOI] [PubMed] [Google Scholar]
- 68.Burton EC, Troxclair DA, Newman WP 3rd. Autopsy diagnoses of malignant neoplasms: how often are clinical diagnoses incorrect? JAMA 1998; 280: 1245-1248. [DOI] [PubMed] [Google Scholar]
- 69.Yuh WT, Zachar CK, Barloon TJ, et al. Vertebral compression fractures: distinction between benign and malignant causes with MR imaging. Radiology 1989; 172: 215-218. [DOI] [PubMed] [Google Scholar]
- 70.Lecouvet FE, Vande Berg BC, Maldague BE, et al. Vertebral compression fractures in multiple myeloma. Part I. Distribution and appearance at MR imaging. Radiology 1997; 204: 195-199. [DOI] [PubMed] [Google Scholar]
- 71.Lecouvet FE, Malghem J, Michaux L, et al. Vertebral compression fractures in multiple myeloma. Part II. Assessment of fracture risk with MR imaging of spinal bone marrow. Radiology 1997; 204: 201-205. [DOI] [PubMed] [Google Scholar]
- 72.Baur A, Stäbler A, Arbogast S, et al. Acute osteoporotic and neoplastic vertebral compression fractures: fluid sign at MR imaging. Radiology 2002; 225: 730-735. [DOI] [PubMed] [Google Scholar]
- 73.Shih TT, Huang KM, Li YW. Solitary vertebral collapse: distinction between benign and malignant causes using MR patterns. J Magn Reson Imaging 1999; 9: 635-642. [DOI] [PubMed] [Google Scholar]
- 74.Cuénod CA, Laredo JD, Chevret S, et al. Acute vertebral collapse due to osteoporosis or malignancy: appearance on unenhanced and gadolinium-enhanced MR images. Radiology 1996; 199: 541-549. [DOI] [PubMed] [Google Scholar]
- 75.Kim DH, Rosenblum JK, Panghaal VS, et al. Differentiating neoplastic from nonneoplastic processes in the anterior extradural space. Radiology 2011; 260: 825-830. [DOI] [PubMed] [Google Scholar]
- 76.Rupp RE, Ebraheim NA, Coombs RJ. Magnetic resonance imaging differentiation of compression spine fractures or vertebral lesions caused by osteoporosis or tumor. Spine 1995; 20: 2499-2504. [DOI] [PubMed] [Google Scholar]
- 77.Mauch JT, Carr CM, Cloft H, et al. Review of the imaging features of benign osteoporotic and malignant vertebral compression fractures. AJNR Am J Neuroradiol 2018; 39: 1584-1592. [DOI] [PMC free article] [PubMed] [Google Scholar]
- 78.Arevalo-Perez J, Peck KK, Lyo JK, et al. Differentiating benign from malignant vertebral fractures using T1-weighted dynamic contrast-enhanced MRI. J Magn Reson Imaging 2015; 42: 1039-1047. [DOI] [PMC free article] [PubMed] [Google Scholar]
- 79.Sung JK, Jee WH, Jung JY, et al. Differentiation of acute osteoporotic and malignant compression fractures of the spine: use of additive qualitative and quantitative axial diffusion-weighted MR imaging to conventional MR imaging at 3.0 T. Radiology 2014; 271: 488-498. [DOI] [PubMed] [Google Scholar]
- 80.Schmeel FC, Luetkens JA, Feißt A, et al. Quantitative evaluation of T2* relaxation times for the differentiation of acute benign and malignant vertebral body fractures. Eur J Radiol 2018; 108: 59-65. [DOI] [PubMed] [Google Scholar]
- 81.Chen Y, Yu Q, La Tegola L, et al. Intravoxel incoherent motion MR imaging for differentiating malignant lesions in spine: a pilot study. Eur J Radiol 2019; 120: 108672. [DOI] [PubMed] [Google Scholar]


