



Abstract
Recently we showed the reduction and oxidation of six natural 2’-deoxynucleosides in the presence of the ambient oxygen using the very broad potential window of a pyrolytic graphite electrode (PGE). Using the same procedure, 2’-deoxynucleoside analogs (dNs) that are parts of an artificially expanded genetic information system (AEGIS) were analyzed. Seven of the eight tested AEGIS dNs provided specific signals (voltammetric redox peaks). These signals, described here for the first time, will be used in future work to analyze DNA built from expanded genetic alphabets, helping to further develop AEGIS technology and its applications. Comparison of the electrochemical behavior of unnatural dNs with the previously documented behaviors of natural dNs also provides insights into the mechanisms of their respective redox processes.
Keywords: electrochemistry, electrochemical oxidation, electrochemical reduction, pyrolytic graphite, unnatural DNA
1. Introduction
A new frontier in life science recognizes that the core processes in biology, including information storage, information transfer, and information translation, can be executed on molecular platforms different from those that emerged on Earth from prebiotic chemistry followed by four billion years of Darwinian evolution [1]. Information storage and transfer is possible with 6-letter [2] and 8-letter [3] genetic alphabets, supporting higher information density than possible from the four letter DNA and RNA that is universal in terran biology. Modes of information storage include the size-complementarity of Watson-Crick pairs joined by standard hydrogen bonding [4], fat and skinny pairs joined by hydrogen bonding [5], and pairs not involving hydrogen bonds at all [6–8]. These support diagnostics applications having over $1 billion in sales, as well as a range of biotechnology applications. The expanded genetic alphabets also encode expanded protein lexicons; Synthorx, which adopted expanded genetic alphabets developed by the Romesberg group, was recently sold to Sanofi Aventis for $2.4 billion. The possibility that life elsewhere in the cosmos uses as non-terran genetic and catalytic molecules is driving NASA missions to seek alien life. Last, synthetic genetic systems now evolve in vitro to give new ligands, receptors, and catalysts [9–12], some of which now see applications in medicine [13].
Exploring this frontier requires new generations of analytical tools. The first generation has already emerged, including enzymes that replicate artificial genetic systems, tools to sequencing alternative genetic systems, and methods for enzymatic analysis of artificial genetic systems. These are in many cases closely analogous to the tools that are used for natural DNA.
However, a panoply of second generation tools await to be developed. Here, the diversity of the chemistry in artificial genetic systems gives an unexplored range of opportunities. For example, the nucleobases of standard DNA and RNA can accept or release electrons in electrochemical processes [14]. However, the heterocycles used in expanded, alternative, and orthogonal genetic systems have a wide range of electrochemical behaviors. Further, since different heterocycles having different redox properties can perform analogous roles in artificial genetic systems, the experimentalist has the opportunity to select heterocycles for their specific electrochemical behavior.
Recently, the team in the Czech Republic showed that standard nucleobases found in natural DNA can give clear electrochemical signals, both oxidative and reductive, on pyrolytic graphite electrodes (PGE) both as isolated 2’-deoxynucleosides (dN) [15] and within oligomeric DNA [16]. These results were significant in their context. Previously, it was assumed that solid carbon electrodes could not be used to observe DNA reduction signals at highly negative potentials, as only mercury based electrodes had been used for this purpose [14]. Products of electrochemical (usually irreversible) oxidation or reduction generally also show electrochemical activity. This provides a second level of valuable redox signals in cyclic voltammetry during an opposite voltammetric scan [16]. This two-level electrochemical analysis was applied to the six natural 2’-deoxynucleosides. Surprisingly, unlike with mercury based electrodes, removal of oxygen from the electrolyte is not necessary for nucleobase reduction signals to be seen [15]. This feature opens the possibility that this electrochemistry would be valuable in routinely used DNA sensors, where rigorous exclusion of oxygen is impractical.
We lay the foundations here for electrochemical analysis of DNA that contains as many as 12 different nucleotides forming as many as 6 independently replicable nucleobase pairs. As discussed below, such analysis is key to the application of expanded DNA in diagnostics, synthetic biology, and xenobiology.
2. Experimental
Following dNs were analyzed: dX: 1-(1’-β-D-2’-deoxyribofuranosyl)-1H-pyrazolo[3,4-d]pyrimidine-4,6(5H,7H)-dione (Fig. 2A), dP: 2-amino-8-(1’-β-D-2’-deoxyribofuranosyl)-imidazo-[1,2a]-1,3,5-triazin-[8H]-4-one (Fig. 2B), damA: 2-amino-2’-deoxyadenosine (Fig. 2C), disoC: 5-methyl-2-aminopyrimidin-4-one (Fig. 3), dS: 3-methyl-6-amino-5-(1’-β-D-2’-deoxyribofuranosyl)-pyrimidin-2-one, dV: 2-amino-3-(1’-β-D-2’-deoxyribofuranosyl)-5-nitro-1H-pyridin-6-one (Fig. 4A), dK: 5-nitro-2,6-diamino-3-(1’-β-D-2’-deoxyribofuranosyl)-pyridine (Fig. 4B), and dZ: 6-amino-3-(1’-β-D-2’-deoxy ribofuranosyl)-5-nitro-1H-pyridin-2-one (Fig. 4C).
Fig. 2.
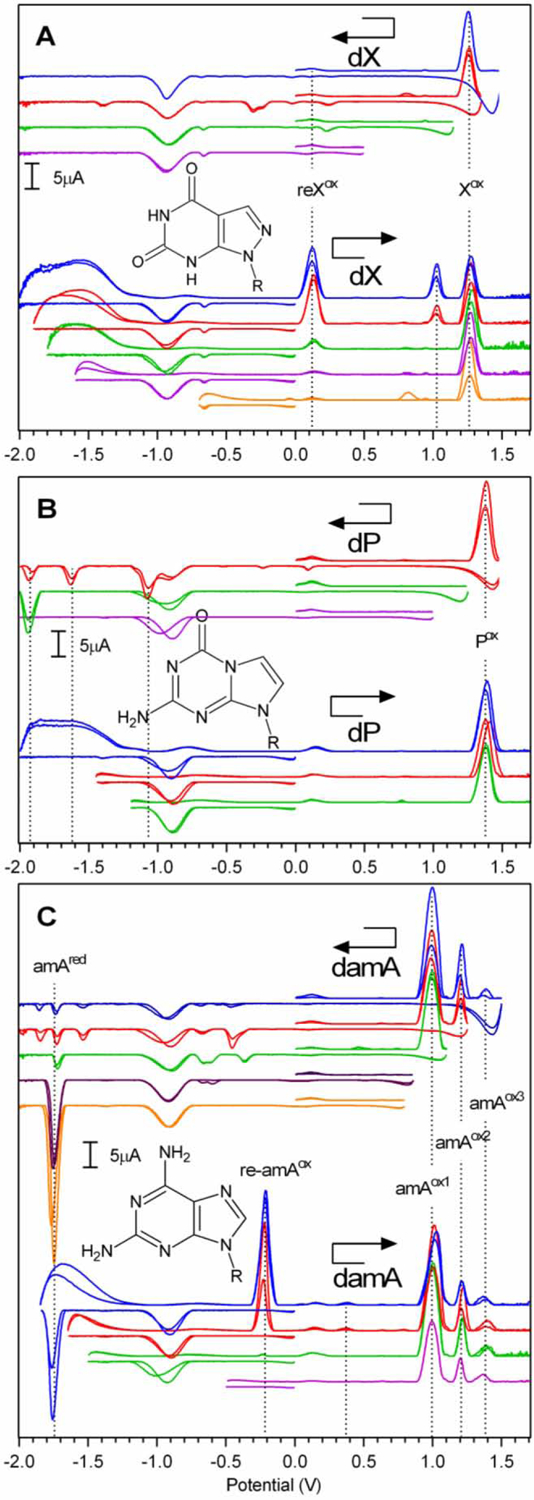
Baseline corrected successive LSVs of dX (A), dP (B) and damA (C). Scanning order is indicated by the arrows. In the case of dX LSV scans were performed from 0 V to +1.50, +1.35, +1.15 or +0.50 V, followed by scan from the vertex to −2.00 V (A top) or from 0 V to −2.00, −1.90, −1.80 or −0.70 V, followed by scan from the vertex to +1.7 (A bottom). In the case of dP from 0 V to +1.50, +1.25 or +1.00 V followed by scan from the vertex to −2.00 V (B top) or from 0 V to – 2.00, −1.45 or −1.20 V, followed by scan from the vertex to +1.7 (B bottom). In the case of damA LSVs were performed from 0 V to +1.50, +1.25 or +1.10 V followed by scan from the vertex to −2.00 V (A top) or from 0 V to −1.85, −1.65, −1.50 or −0.50 V, followed by scan from the vertex to +1.7 (A bottom) in case of damA. Insets: structure of the damA (A), dX (B) and dP (C). R=2’-deoxyribosyl moiety.
Fig. 3.
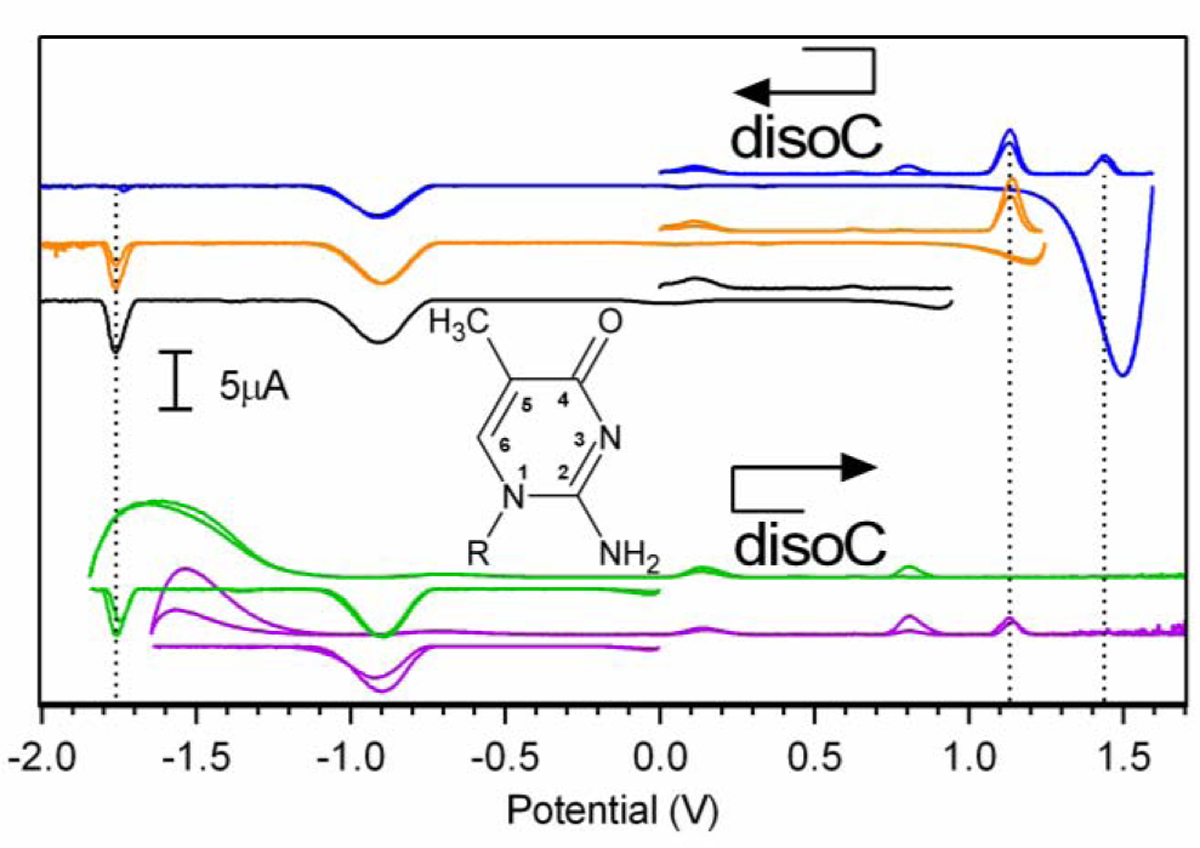
Baseline corrected successive LSVs of disoC. Scanning order is indicated by the arrows. LSVs were performed from 0 V to +1.60, +1.25 or +0.95 V followed by scan from the vertex to −2.00 V (top) or from 0 V to −1.85 or −1.65 V, followed by scan from the vertex to +1.7 (bottom). Inset: structure of the disoC with numbered atoms in aromatic ring. R=2’-deoxyribosyl moiety.
Fig. 4.
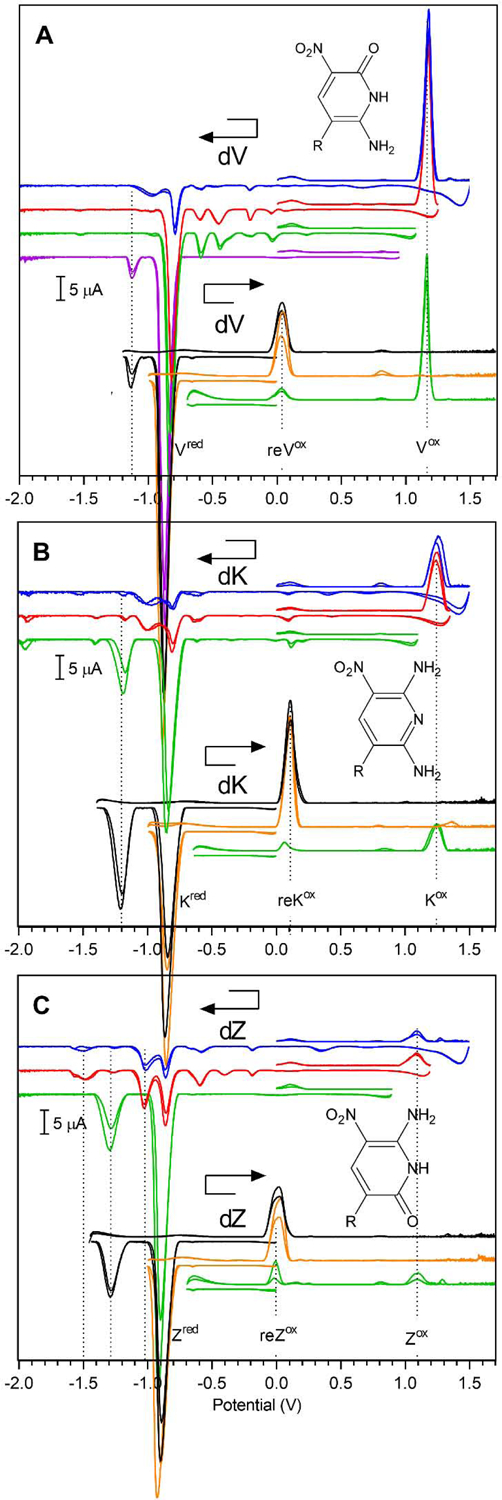
Baseline corrected successive LSVs of dV (A), dK (B) and dZ (C). Scanning order is indicated by the arrows. LSVs were performed from 0 V to +1.50, +1.25, +1.08 or +0.95 V followed by scan from the vertex to −2.00 V (A top) or from 0 V to −1.20, −1.00 or −0.65 V, followed by scan from the vertex to +1.7 (A bottom) in case of dV. In case of dK scans were performed from 0 V to +1.50, +1.40 or +1.10 V followed by scan from the vertex to −2.00 V (B top) or from 0 V to −1.50, −1.40 or −1.10 V, followed by scan from the vertex to +1.7 (B bottom) and in case of dZ from 0 V to +1.50, +1.20, +0.90 V followed by scan from the vertex to −2.00 V (C top) or from 0 V to – 1.45, −1.00 or −0.70 V, followed by scan from the vertex to +1.7 (C bottom). Insets: structure of the damA (A), dX (B) and dP (C). R=2’-deoxyribosyl moiety.
Except for damA, which was purchased form Alfa Aesar (USA), the other 2’-deoxynucleosides (dNs) studied here are products of and were gifts from Firebird Biomolecular Sciences LLC (www.firebirdbio.com). Pyrolytic graphite was purchased from Momentive USA.
All nucleosides were prepared as solutions in milli-Q water. All other chemicals were of analytical grade. Freshly peeled surface of a homemade basal plane oriented PGE with surface area of approximately 4 mm2 was used as a working electrode [15,16].
These nonstandard dNs were adsorbed to freshly cleaved (peeled) PGE surfaces from drops (2 μl) of their 1 mM solution. After adsorbing material from the drop for five minutes, the PGE surface was rinsed in milli-Q water and the PGE was transferred to an electrochemical cell. Here, the material was analyzed in 0.2 M acetate buffer (pH 5) as electrolyte. Unless stated otherwise, measurements were performed without removing ambient oxygen from the electrolyte. Cyclic voltammetry (CV) was performed by combining two (or more) subsequent linear sweep voltammetry (LSV) scans in the opposite directions. The moving average procedure from Nova 1.11 (window size 1) was used for baseline correction. After the measurement, the potential was cycled between +2.0 and −2.0 V (1 V/sec) until the current was stabilized and all adsorbed electroactive residues were inactivated (five cycles). The electrodes were then dried with paper tissue, and their surfaces were renewed using adhesive tape, completely removing the top layers of the pyrolytic graphite (Fig. 1). Adhesive tape approach has been shown to be very efficient way how to exfoliate the highly oriented pyrolytic graphite as was documented by graphene manufacturing [17]. Adhesive tape cleavage is very efficient way of the PGE surface renewal as well. It is much faster than polishing, typically used with other types of solid electrodes. After the above described renewal, the cycle was repeated with the next sample. Other experimental details were taken from our prior work [15,16].
Fig. 1.
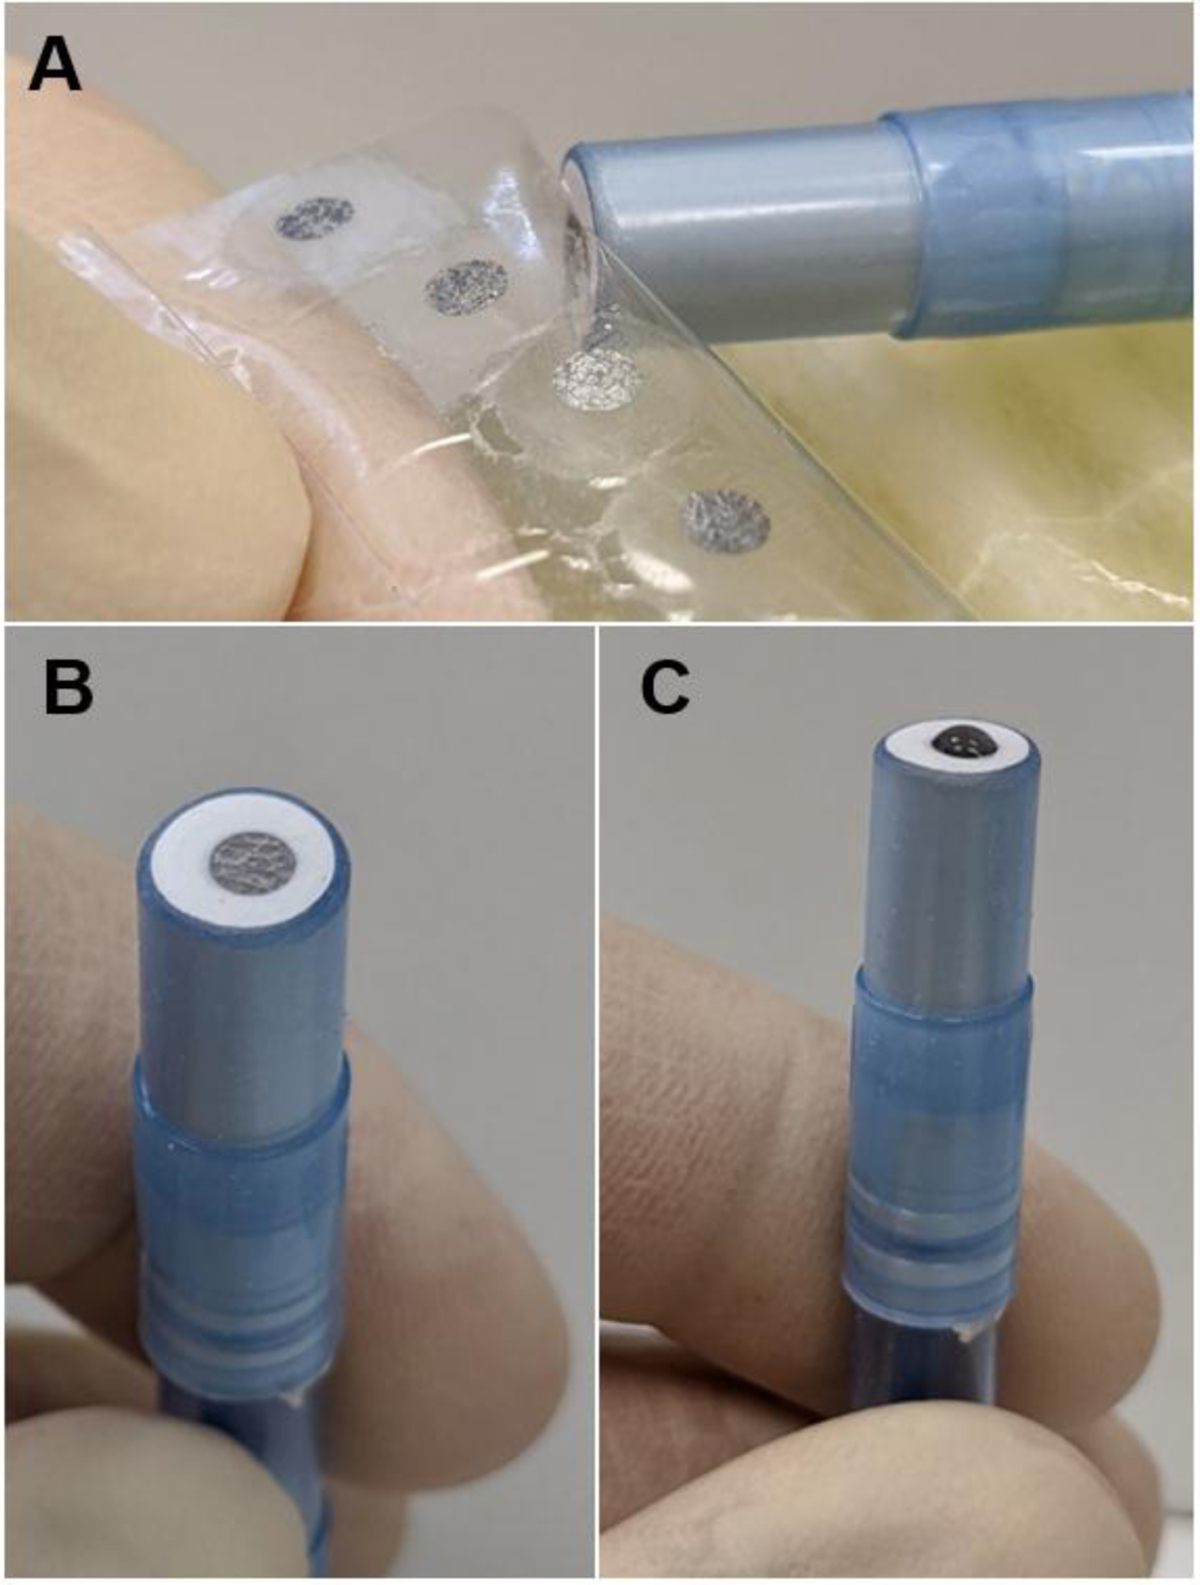
PGE surface renewal with an adhesive tape (A). Freshly peeled basal plane-oriented PGE surface (B) and sample adsorption from a drop of an analyte (C).
3. Results
All nucleosides were subjected to ex situ voltammetric measurements using the same settings as in our previous work in which six naturally occurring nucleosides were studied [15] (see Experimental for details). To mitigate the variability of the electrochemical response provided by the inherently variable PGE surface (discussed before [15,16]), each measurement was twice independently replicated. Both resulting baseline-corrected voltammograms are presented for each measurement conditions and settings. As we have shown previously, [15] deaeration had negligible impact on the electrochemical signals observed of the set of natural dNs. Therefore, deaeration was not done for most of the experiments presented here. The measurement settings and other conditions were selected based on previously optimized conditions for DNA analysis [16].
The electrochemical cycling after each measurement served two purposes: (1) it ensured that all electrochemically active material adsorbed onto the PGE surface was inactivated and it reduced the chance of accidental cross-contamination between the samples; and (2) the potential cycling facilitated the electrode surface renewal. Detailed analysis of the effects of this cycling on the electrode surface properties is currently underway. Nonetheless, measurements in this work were always performed on the peeled, freshly prepared, structurally unmodified bare PGE.
We name signals (“peaks”) using previously used nomenclature [15,16]. The prefix “re” or “ox” indicate that the signal arises from the formation of a reduction product or an oxidation product of the indicated nucleobase (amA, X, P, isoC, V, K, or Z); the superscript index “red” or “ox” indicates electron transfer process that gives rise to the given signal (reduction or oxidation respectively). Numbers in the index are given in order of the direction of the scan, when multiple signals must be distinguished.
3.1. Redox Behavior of dX
dX provides a single oxidation Xox peak at +1.26 V (Fig. 2A). This peak was of similar size and position as second Gox peak due to products of dG polymerization upon its primary oxidation [15]. Compared to purine nucleobases, the nitrogen atom in dX is moved from position 7 to position 8; thus, its oxidation cannot form an 8-oxopurine analog, as is typical for purines [18]. On the other hand, if its oxidation proceeds through radical intermediate species, as with 2’-deoxyadenine (dA), 2’-deoxyguanine (dG) [15], the observed Xox peak could be due to the polymerization reaction only. In that case, Xox peak could be similar to the secondary Gox oligomerization peak(s) [15,16] and be sensitive to its surrounding bases in DNA sequence as is the case of G in DNA sequences [16]. Placing the upper (positive) vertex of the CV just after the Xox peak leads to production of several reduction peaks in the following cathodic scan. The most prominent peaks are at +0.23, −0.29 (overlapped with peak at −0.30 V) and at −1.40 V.
With the upper vertex placed at +1.15 V, before the Xox peak, reduction peak at +0.23 V appeared in the subsequent cathodic scan (Fig. 2A top). That indicates some chemical changes are happening to the analyte even before the oxidation peak at +1.25 V is scanned. Similar reduction signals generated before the observable peak has been scanned were documented with dA and dG [15].
All of these reduction peaks provided by electrochemically oxidized dX are diminished or disappear when the vertex is placed at +1.50 V. This indicates further oxidation of dX at higher potentials to give an electrochemically inactive product. The oxidation peak responsible for this further oxidation is either hidden in the slope of the electrolyte oxygen evolution (as is the case with oxidation of dC, dmC or dT on PGE [15]) or nonexistent, because of these oxidations occurs chemically through reactions with radicals generated during the electrolyte oxidation.
Direct reduction of dX yields only single small reduction peak at −0.66 V. This peak could be switched off by prior scan to positive potentials higher than +1.35 V (Fig. 2A bottom).
As was the case with dA and dG [15], an oxidation peak close to 0 V potential can be “switched on” by a prior scan to sufficiently high negative potentials (Fig. 2A bottom). This reXox peak, at +0.12 V, is switched on by scanning sufficiently negative potentials, despite the absence of any observable reduction peak that might be correlated with the switching on of the reXox peak. Instead the reXox peak was increased gradually with the shifting of the vertex to more negative potentials; a small sized reXox peak appeared with vertex placed at −1.60 V and was biggest with the vertex placed at −1.90 or −2.00 V. These results are consistent with hypothesis that the C7–N8 double bond is reduced chemically by electrochemically generated hydrogen radicals, analogously to reduction of the N7–C8 bond in standard guanine in DNA [19] and other purine nucleosides, [15] as well as with damA (see below). The fact that Xox peaks appeared at the same potential (+1.25 V) in the reverse scan of CV, despite prior reduction of dX at far negative potentials, could indicate that the oxidation process manifested as the reXox peak (Fig. 2A bottom) comprises a reversion of the reduced compound back to dX. The fact that the Xox peak was smaller after the cycle to −2.00 V, and that new peak at +1.04 V appeared, could indicate that the reversion back to dX during the process producing reXox peak was not complete.
3.2. Redox Behavior of dP
Nucleoside dP provides a single large oxidation Pox peak at +1.38 V. Scanning the Pox peak (vertex at +1.50 V) switches on five isolated reduction peaks in the subsequent cathodic scan, with the most prominent being seen at −1.07, −1.61 and −1.92 V. The most negative reduction peak showed an interesting behavior: When the upper vertex was placed before the Pox peak (vertex placed at +1.25 V), the peak at −1.92 V was the only peak appearing in the reverse scan. This peak became smaller when the upper vertex was placed at more positive potentials (Fig. 2B top).
Aside from minor signal at −1.40 V (which might be due to an unknown contaminant in the sample of dP used here), no signal was associated with direct reduction of dP. Further, scanning to negative potentials did not affect the subsequent oxidation (Fig. 2B bottom).
Due to its position, the Pox peak in a heterosequence oligonucleotide would overlap with the Aox peak arising from electrochemical oxidation of A within DNA [16]. Nevertheless, contributions of the two bases to the collective signal can be distinguished by switching off the Aox peak by prior scanning Ared peak, done by placing lower (negative) vertex at −1.85 V [16]. Here, Pox peak cannot be switched off by prior reduction, not even when the lower vertex is placed at −2 V. Compared to all other analyzed bicyclic bases dP is very resistant towards reduction. This could be caused by absence of N at position either of 7 (as in purines) or 8 (as in dX). This resistance towards reduction provides unique opportunity for detection of the unnatural base P from a mixture and therefore could be unmasked by switching off Aox peak [16] prior the P analysis in DNA. We have experimentally confirmed that P detection in DNA is possible by prior switching off the natural DNA oxidation signals, (results will be published elsewhere).
Natural dNs derived from purines [15] or here studied dX (see above, Fig. 2A) have been shown to give the peak close to 0 V arising from oxidation of product of their chemical reduction by nascent hydrogen. In contrast, no such signal was observed with dP suggesting that analogous reduction product of dP was not generated under the same conditions. This accords with the facts, in dP, the N atom at position 7 (or 8) and thus the reducible N7=C8 (or C8=N7) moiety is missing. Similarly, no peak analogous to reGox was previously observed with 7-deazaguanine in corresponding dNTP or DNA [20].
3.3. Redox Behavior of damA
Nucleobase analogue 2,6-diaminopurine (also 2-aminoadenine) acts as a cell growth inhibitor [21]. It has been found to completely substitute adenine in the genomes of some cyanobacterial phages [22]. Its electrochemical activity was studied previously using pyrolytic graphite electrode. The electrochemical oxidation of 2-aminoadenine depends on its concentration. At low concentrations (10 μM), 2-aminoadenine gives a single oxidation peak; at high concentrations (above 500 μM), as many as four oxidation peaks are observed between +0.5 and +1.0 V (in 0.5 M phosphate buffer at pH 7). Upon scan reversal, multiple reduction peaks are observed [23]. These findings are consistent with our observations in electrochemistry experiments with damA.
Nucleoside damA gave 3 oxidation peaks (amAox1, amAox2, amAox3) at +0.98, +1.20 and +1.37 V respectively (Fig. 2C top). When the upper vertex of the CV was placed after amAox3, a series of eight peaks was observed in the subsequent cathodic scan. The most prominent of these were detected at potentials −0.47, −0.68, −1.54, −1.74, and −1.86 V. These peaks were also present when the upper vertex of the CV was placed behind amAox2 at +1.25 V, with the peak at −0.47 V being increased in size. With the CV upper vertex placed at +1.10 V, after amAox1, the subsequent cathodic voltammogram showed new peak at −0.36 V, two partially overlapping peaks at −0.61, −0.66 V and only peak at −1.74 V was remaining at far negative potentials. The peak at −1.74 V corresponded to direct reduction of damA (amAred). Placing the upper vertex of the CV at more positive potentials leads to irreversible oxidation of damA, hence there was less of the unaltered damA available during the subsequent cathodic scan, which led to decrease of magnitude of the amAred peak (Fig. 2C top).
Aside from the amAred peak, electrochemically unaltered damA did not provide any other reduction peaks. All other reduction peaks in Fig. 2C arose from oxidized species resulting from electrochemical oxidation of the damA (Fig. 2C bottom). Structures were assigned to several of these oxidation products in the previous study [22]. Thus, oxidation of the free nucleobase 2-aminoadenine gave 2,6-diamino-8-purinol, which in the CV gave two reduction peaks around +0.5 V [23]. Such reduction peaks near that potential have not been observed with the nucleoside damA. By analogy with similar nucleosides dA, dG [15] and guanosine [18], we believe that oxidation of damA occurs through radical intermediates, likely including 8-hydroxy intermediate, analogous to 2,6-diamino-8-purinol identified during 2-aminoadenine oxidation [23]. This gives multiple products, including base-to-base linked polymers [18]. These heterogeneous products of radical oxidation could be responsible for the complex behavior in the subsequent cathodic scan.
When the potential was scanned over the amAred peak (with lower vertex of the CV placed at −1.85 V), a well-defined oxidation peak, re-amAox, appears at −0.21 V (Fig. 2C bottom). We believe that this peak arises by a mechanism similar to that described previously for dG (reGox peak) [15,16] and dA (reAox0 peak) [15] involving chemical reduction of the N7=C8 double bond by electrochemically generated hydrogen radicals [19] and electrooxidation of the reduction products back to the original purine nucleobases (Fig. 2C bottom). The hypothesis that processes responsible for the re-amAox peak involve oxidation of 7,8-dihydro damA back to the original damA was supported by observation of the multiple amAox peaks at ≥ +1.0 V, present at potentials regardless of the lower vertex potential value applied. As was the case of peak reGox [15], the height of the peak re-amAox could be correlated with the lower vertex potential placement. It started to appear when the lower vertex was placed at −1.5 V, far before the damA reduction peak, and was dramatically increased with placing the vertex just before the amAred peak. Placing the lower CV vertex at −1.85 V, after the peak amAred, had no further effect on the re-amAox peak (Fig. 2C bottom). Thus, appearance of the oxidation peak at −0.21 V could be better corelated with the background hydrogen evolution than with other observable (i.e., electrochemical) reduction processes of damA. This further supports the above described hypothesis for the mechanism behind this peak generation.
When the lower vertex of the CV was placed at −1.65 or −1.85 V, there was an additional minor peak appearing at +0.37 V (Figure 2C bottom). This may indicate that reduction at 7,8-purine position is not the only reaction taking place under such conditions. These peaks could be analogical to previously described signals reAox1 and reAox2 provided by natural dA [15].
3.4. Redox Behavior of disoC and dS
As noted above, very often similar nucleobase pairing is obtained in DNA by two different heterocycles. For example, the hydrogen bond acceptor-acceptor-donor pattern on a 6-ring needed to complement isoguanosine can be implemented on two pyrimidine nucleoside analogs, disoC (2’-deoxy-5-methylisocytidine, numbered structure in Fig. 3) and dS (2’-deoxy-pseudocytidine, with the positions of N1 and C5 atoms exchanged). Interestingly, these two bases show different electrochemical behaviors.
The disoC gave two minor oxidation peaks at +1.18 and +1.43 V (Fig. 3 top). The studied disoC was methylated at C5, at the same positions as 2’-deoxy-5-methylcytosine (dmC) and thymidine (dT). Both of these provided oxidation signals in DNA around +1.5 V [15], close to the second oxidation peak of disoC. In cathodic scan, disoC gave a reduction peak isoCred at −1.67 V, a potential similar to that seen for peaks Cred or mCred [15], but less than half in height compared to the latter two peaks. Peak isoCred could be switched off by scanning over the potential of the second disoC oxidation peak, but remained unchanged when the upper vertex of the CV was placed after the first disoC oxidation peak (Fig. 3 top).
When the lower vertex of the CV was placed after the isoCred peak (at −1.85 V), both disoC oxidation peaks were switched off in the subsequent anodic scan and no additional peaks appeared (peak at +0.8 V appeared randomly and was not related to the isoC presence). Interestingly with the lower vertex placed before the isoCred peak, only the second oxidation peak was switched off, while the first was about halved (Fig. 3 bottom).
Curiously, even with the same acceptor-acceptor-donor hydrogen bonding pattern, dS did not provide any redox signals during anodic or cathodic scan (data not shown). The absence of the signals due to dS could be due to poorer adsorption of dS onto the electrode surface, or its desorption before analysis. However, these explanations seem unlikely, since all of the other tested purine [15] and purine analogue nucleosides (Fig. 2 and 3) were adsorbed and provided observable signals. The lack of redox signals associated with dS does not necessarily translate to electrochemical inactivity of dS incorporated into the DNA. For example, while dU nucleoside was apparently electrochemically inactive [15], U when present in the DNA provided reduction signals [16].
3.5. Redox Behavior of dV, dK, and dZ
Three of the AEGIS components carry a nitro group at their C5 positions. Extensive studies show that for dV and dZ, this substituent is required for stability against epimerization [24]. It is not, however, required for the donor-acceptor-donor hydrogen bonding pattern, which is also supported by diaminopyrimidine (Fig. 4B). Interestingly, the electrochemical behavior of all tested dNs based on a nitropyridine skeleton was similar, and dominated by signals due to irreversible four-electron reduction of their respective nitro groups (Fig. 4). dV, dK and dZ are therefore described in a group to support an analysis of their similarities and differences.
3.5.1. Direct Oxidation of dV, dK, and dZ
Each of dV, dK, and dZ provided a single peak during its direct oxidation. dV provided a sharp peak at +1.21 V which was the highest of all three nitropyridines. dK provided a broader, less intense peak of intermediate size at +1.30 V. Finally, dZ provided the lowest peak at +1.10 V. Interestingly, potential scanning over the nitro group reduction peaks (see below) completely switched off these oxidation peaks (Fig. 4).
3.5.2. Direct Reduction of dV, dK, and dZ
Direct reduction all three nitropyridine AEGIS components gave very well-developed symmetrical peaks Vred, Kred, and Zred at −0.88, −0.85 and −0.89 V respectively. These peaks were likely caused by irreversible reduction of the respective nitro groups [25] (in detail discussed in the section 3.5.5). In all three cases, at more negative potentials smaller additional reduction peaks were observed at −1.12, −1.20, and 1.28 V for dV, dK, and dZ respectively. In all three cases, these secondary reduction peaks were switched off or significantly diminished by prior anodic scans: with dV, the secondary reduction peak was completely switched off after anodic scan to +1.08 V (upper vertex placed before the dV oxidation peak). The respective oxidation peaks for dK and dZ had to be scanned-over to significantly diminish the second reduction peaks of these nucleosides.
3.5.3. Reduction of Oxidized dV, dK, and dZ
As in the cases of dA, dG [15], damA, dX, and dP (Fig. 2), the oxidation of dV, dK and dZ led to a complex behavior in the following cathodic scan as well (Fig. 4). Scanning the dV oxidation peak gave rise to four new reduction peaks between +0.03 and −0.65 V. The Vred peak was smaller and shifted by 80 mV to less negative potential, compared to peak Vred arising from direct reduction of dV, and the secondary peak of dV reduction was lost. Similar results were observed when the upper vertex was placed immediately before the dV oxidation peak at +1.08 V (Fig. 4A). Scanning the oxidation peak of dK (upper vertex of the CV at +1.30 V) significantly diminished the dK reduction signals; also, new reduction signals appeared at +0.12, −0.8 and −1.38 and −1.95 V. Reverting the scan before the dK oxidation peak (upper vertex at +1.10 V) had only minor effects on the subsequent cathodic voltammogram (Fig. 4B). Scanning of the small dZ oxidation peak (upper vertex at +1.20 V), resulted in several new reduction peaks at −0.18, −0.40, −0.60, −1.13 V and broad signal at −1.49 V. Both peaks observed during direct reduction of dZ were significantly diminished, but present (Fig. 4C).
When the upper vertex was placed at +1.50 V with dV and dZ, far beyond their respective oxidation peaks, different, less complex cathodic voltammograms were obtained. This indicates further oxidation of these dNs at higher potentials, resulting in products with different electrochemical properties.
The overall complex behavior of the nitropyridine dNs oxidation products could point towards production of multiple oxidation products potentially generated through radical oxidation. However, this remains a hypothesis.
3.5.4. Oxidation of Reduced of dV, dK, and dZ
Potential scanning over the nitro reduction peaks provided by dV, dK, and dZ switched off their signals observed during their direct oxidation (peaks Vox, Kox, and Zox). On the other hand, reduction of the nitro group resulted in appearance of peaks reVox, reKox, and reZox, at +0.04, +0.11 and +0.03 V respectively (Fig. 4A, B and C respectively and Fig. 5). Placing the lower vertex to more negative potentials to scan-over the secondary reduction peaks of dV, dK, and dZ did not gave rise in any new peaks. The only observed change in the subsequent anodic scan was a ca. 5-μA (30–50 %) decrease of the reVox, reKox, and reZox peak heights, compared to an experiment when only the nitro reduction peaks were scanned (Fig. 4A, B and C respectively). We assume that these oxidation peaks at potentials close to 0 V are due to oxidation of hydroxylamino group (reduction product of the nitro group) to nitroso group (discussed below).
Fig. 5.
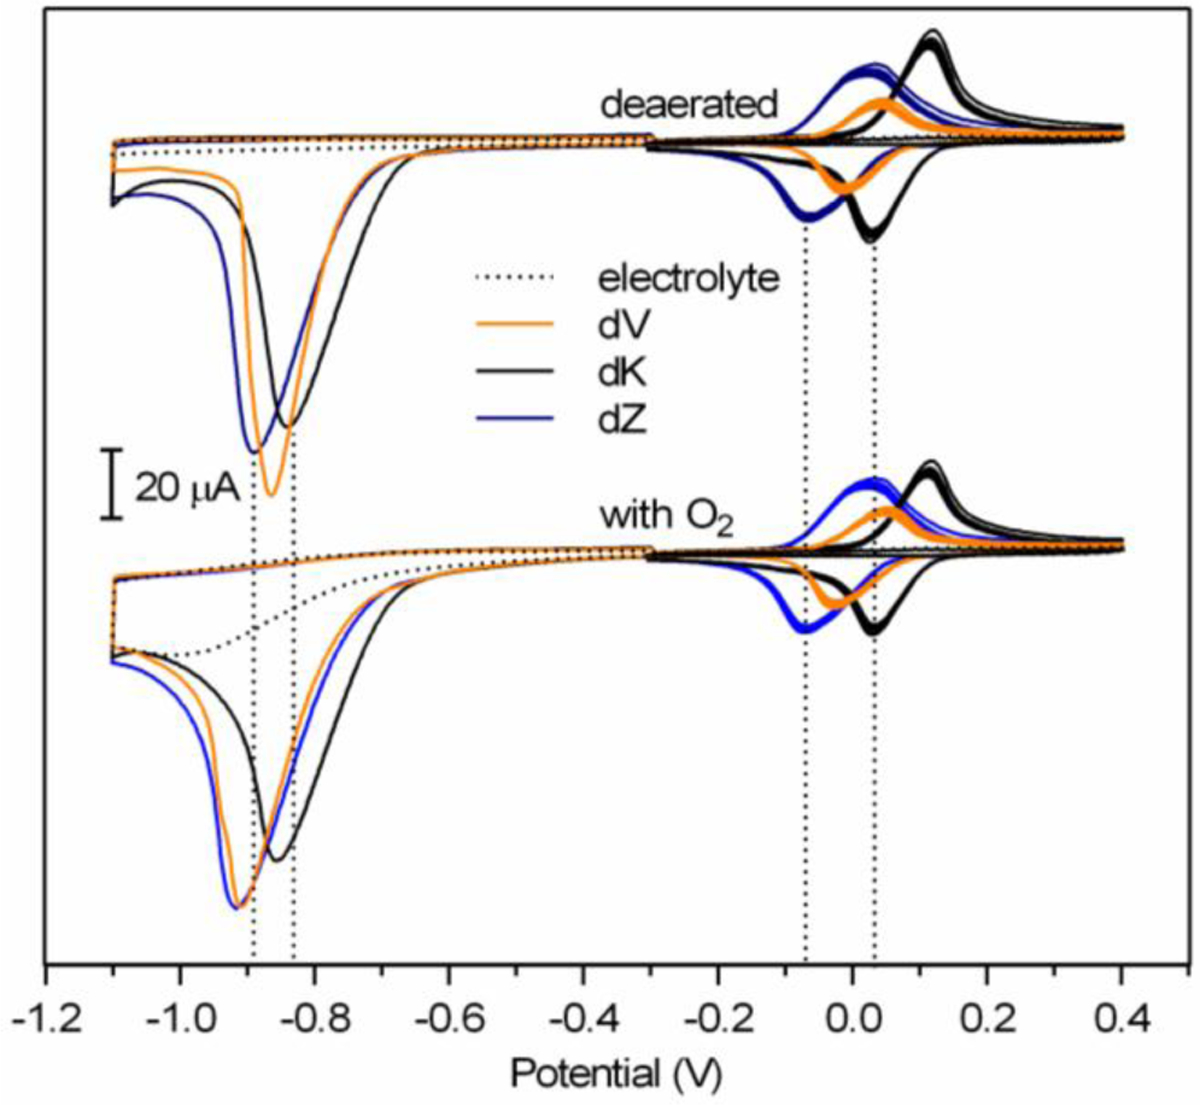
Recordings of two successive CVs after single adsorption of indicated 1 mM nucleoside: −0.3 to −1.1 V and back to −0.3 V, followed by 5 CV cycles between −0.3 and +0.4 V – starting at −0.3 V. Measurements performed in deaerated electrolyte (top) or in the presence of the ambient oxygen (bottom).
3.5.5. Electrochemical Conversion of Nitro Moieties in dV, dK, and dZ
Among all direct oxidation or direct reduction signals provided by natural nucleosides studied previously [15] or the AEGIS nucleosides presented here, reduction peaks near −0.8 V given by dV, dK and dZ were the largest (for a given nucleoside concentration) and positioned at potentials closest to 0 V. This makes them excellent signals for analytical purposes. Based on the analogy with previously studied aromatic nitro compounds, we assume that the mechanism behind these reduction signal involves four-electron reduction of the nitro group to give corresponding hydroxylamine derivative. The hydroxylamino group can then be oxidized close to 0 V potential to give the nitroso group, which in turn can be at similar potential reduced back to hydroxylamino group [25,26]. These signals (oxidation of hydroxylamino and reduction of nitroso groups) formed a quasi-reversible redox system which was stable over multiple cycles of cyclic voltammetry (Fig. 5).
This facile conversion of the nitro group has remarkable analytical value. First, the nitro group reduction occurred at potentials where no other natural or AEGIS nucleoside provided reduction peaks. Hence, the nitro reduction does not overlap with any other signal provided by any other components of natural DNA. It should be kept in mind that the nitro reduction takes place at similar potential values as the reduction of oxygen dissolved in the electrolyte (Fig. 5 bottom). Nevertheless, when dV, dK, or dZ nucleosides were adsorbed from 1 mM solutions, their nitro reduction peaks were significantly higher (approximately 80 μA) than peaks arising from dioxygen reduction in electrolytes kept in equilibrium with air (about 20 μA at potential −0.85 V).
Naturally, overlapping potentials of the nitro group and dioxygen reduction could hinder detection of smaller amounts of nitro compounds at the electrode surface via recording the nitro reduction signal. On the other hand, the presence of dioxygen had no observable effect on signals due to the hydroxylamino-nitroso redox system. Thus, even if the detection of nitro group was hindered by the presence of dioxygen (for example in a sensor application), detection of V, K, or Z nitro containing nucleobase could be achieved through recording the hydroxylamino-nitroso signals. Due to their reversible nature, use of pulse techniques (e. g. differential pulse voltammetry or square wave voltammetry) can be applied to enhance them (data not shown).
4. Conclusion
Previously described [15] adsorption transfer cyclic voltammetry technique was used to gather qualitative information on oxidation and reduction processes of eight AEGIS 2’-deoxynucleosides at the PGE applied over a very wide potential window from −2.0 to +1.7 V, which could be in future work applied for identification of these bases in mixed nucleoside or DNA samples. Seven of these nucleosides provided potentially analytically useful redox signals. Removal of ambient dioxygen was not essential under conditions used in this work. Deaeration of the electrolyte can be done in applications demanding high sensitivity; however, its robustness predestines electrochemical sensing to be used particularly in routine use where electrolyte deaeration would be impractical. We have demonstrated again that detection of reduction processes at far negative potentials on the morphologically unmodified and unpretreated basal plane-oriented PGE is as easy as the more commonly used oxidations in far positive potential regions. Long potential sweeps across the potential window between highly negative and highly positive potentials opens completely new opportunities for the analysis of both natural and artificially modified DNA or its components.
In addition to signals arising from redox processes within the nitrogenous heterocycles of individual nucleosides, dV, dK, and dZ were found to provide particularly well-developed peaks corresponding to reduction of their nitro groups, which in turn switched on a reversible peak pair due to hydroxylamino/nitroso redox processes close to potential of 0 V. Yet not disclosed results from experiments with DNA containing AEGIS nucleobases indicate that both nitro reduction and the reversible peak pairs could be used for highly specific identification and quantification of these bases in single stranded or double stranded DNA (results will be published elsewhere).
The existence of multiple peaks in the cathodic scan of the CV when returning from highly positive potentials, observed previously for dA, dG [15] and guanosine [27], was tentatively attributed to reduction of multiple products arising due to the oxidation through radical intermediates. Analogous explanations may be proposed for the complex behavior of damA, dX, dV, dK, and dZ studied here. However, more detailed analytical work is needed to confirm this hypothesis.
The existence of oxidation peaks re-amAox and reXox appearing after reduction of corresponding species (that proceeds without appearance of any obvious cathodic peaks) further supports previously described hypothesis behind the mechanism of reGox peak generation [19]. We believe that all of these bases are reduced chemically by hydrogen radicals generated at sufficiently negative potentials. The hydrogen radicals are added to N7=C8 (in purines) or C7=N8 (in the dX purine isomer) double bond [19]. Absence of such peak in dP, where the C=N moiety is missing, indirectly supports the same hypothesis (in analogy to the absence of the peak when 7-deazaG is subjected to the CV [20]).
Electrochemistry has repeatedly been shown to be an excellent platform in studies of modified nucleic acids bearing diverse extrinsic redox moieties attached to their components. In the analysis of nucleotides containing AEGIS nucleobase analogs, lectrochemically active moieties inherently present within these unnatural nucleosides (and nucleic acids) can be used without the need to introduce any labels or tags, and without in vitro enzymatic nucleic acid reprocessing. Moreover, electrochemistry can not only detect and quantify these unnatural bases and base pairs, but can also provide means for identification of these bases to confirm that they were not chemically altered when incorporated into DNA, in vitro or in vivo. Electrochemistry either alone or together with other tools can help with further the development of AEGIS technology.
Highlights.
Electroanalysis of Artificially Expanded Genetic Information System (AEGIS).
Electroactivity of 8 AEGIS 2’-deoxynucleosides was described of which 1 was inactive.
Pyrolytic graphite electrode was used for reductions at highly negative potentials.
Pyrolytic graphite electrode was used for oxidations at highly positive potentials.
Newly described peaks will be later used for AEGIS base identification in DNA.
Acknowledgements
This work was supported by the by the SYMBIT project reg. no. CZ.02.1.01/0.0/0.0/15_003/0000477 financed from the ERDF, by the Czech Science Foundation (grant No. 20-03187S), by the Ministry of Education, Youth and Sports of the Czech Republic under the project CEITEC 2020 (LQ1601) and by the CAS (No. 68081707). Research reported in this publication was also supported by UCSD Center of Wearable Sensors and in part by the National Institutes of Health under the Director’s Award Number R01GM128186. The content is solely the responsibility of the authors and does not necessarily represent the official views of the National Institutes of Health.
Footnotes
Publisher's Disclaimer: This is a PDF file of an unedited manuscript that has been accepted for publication. As a service to our customers we are providing this early version of the manuscript. The manuscript will undergo copyediting, typesetting, and review of the resulting proof before it is published in its final form. Please note that during the production process errors may be discovered which could affect the content, and all legal disclaimers that apply to the journal pertain.
Declaration of interests
The authors declare that they have no known competing financial interests or personal relationships that could have appeared to influence the work reported in this paper.
References
- [1].Benner SA, Karalkar NB, Hoshika S, Laos R, Shaw RW, Matsuura M, Fajardo D, Moussatche P, Alternative Watson-Crick synthetic genetic systems, Cold Spring Harb. Perspect. Biol 8 (2016). 10.1101/cshperspect.a023770. [DOI] [PMC free article] [PubMed] [Google Scholar]
- [2].Yang Z, Chen F, Chamberlin SG, Benner SA, Expanded genetic alphabets in the polymerase chain reaction, Angew. Chemie - Int. Ed 49 (2010) 177–180. 10.1002/anie.200905173. [DOI] [PMC free article] [PubMed] [Google Scholar]
- [3].Hoshika S, Leal NA, Kim MJ, Kim MS, Karalkar NB, Kim HJ, Bates AM, Watkins NE, SantaLucia HA, Meyer AJ, DasGupta S, Piccirilli JA, Ellington AD, SantaLucia J, Georgiadis MM, Benner SA, Hachimoji DNA and RNA: A genetic system with eight building blocks, Science (80-. ). 363 (2019) 884–887. 10.1126/science.aat0971. [DOI] [PMC free article] [PubMed] [Google Scholar]
- [4].Piccirilli JA, Benner SA, Krauch T, Moroney SE, Benner SA, Enzymatic incorporation of a new base pair into DNA and RNA extends the genetic alphabet, Nature. 343 (1990) 33–37. 10.1038/343033a0. [DOI] [PubMed] [Google Scholar]
- [5].Hoshika S, Singh I, Switzer C, Molt RW, Leal NA, Kim MJ, Kim MS, Kim HJ, Georgiadis MM, Benner SA, “Skinny” and “fat” DNA: Two New Double Helices, J. Am. Chem. Soc 140 (2018) 11655–11660. 10.1021/jacs.8b05042. [DOI] [PubMed] [Google Scholar]
- [6].Loakes D, Gallego J, Pinheiro VB, Kool ET, Holliger P, Evolving a polymerase for hydrophobic base analogues, J. Am. Chem. Soc 131 (2009) 14827–14837. 10.1021/ja9039696. [DOI] [PMC free article] [PubMed] [Google Scholar]
- [7].Feldman AW, Romesberg FE, Expansion of the Genetic Alphabet: A Chemist’s Approach to Synthetic Biology, Acc. Chem. Res 51 (2018) 394–403. 10.1021/acs.accounts.7b00403. [DOI] [PMC free article] [PubMed] [Google Scholar]
- [8].Yamashige R, Kimoto M, Takezawa Y, Sato A, Mitsui T, Yokoyama S, Hirao I, Highly specific unnatural base pair systems as a third base pair for PCR amplification, Nucleic Acids Res. (2012). 10.1093/nar/gkr1068. [DOI] [PMC free article] [PubMed] [Google Scholar]
- [9].Sefah K, Yang Z, Bradley KM, Hoshika S, Jiménez E, Zhang L, Zhu G, Shanker S, Yu F, Turek D, Tan W, Benner SA, In vitro selection with artificial expanded genetic information systems, Proc. Natl. Acad. Sci. U. S. A (2014). 10.1073/pnas.1311778111. [DOI] [PMC free article] [PubMed] [Google Scholar]
- [10].Zhang L, Yang Z, Sefah K, Bradley KM, Hoshika S, Kim MJ, Kim HJ, Zhu G, Jiménez E, Cansiz S, Teng IT, Champanhac C, Mclendon C, Liu C, Zhang W, Gerloff DL, Huang Z, Tan W, Benner SA, Evolution of functional six-nucleotide DNA, J. Am. Chem. Soc 137 (2015) 6734–6737. 10.1021/jacs.5b02251. [DOI] [PMC free article] [PubMed] [Google Scholar]
- [11].Zhang L, Yang Z, Le Trinh T, Teng I-T, Wang S, Bradley KM, Hoshika S, Wu Q, Cansiz S, Rowold DJ, McLendon C, Kim M-S, Wu Y, Cui C, Liu Y, Hou W, Stewart K, Wan S, Liu C, Benner SA, Tan W, Aptamers against Cells Overexpressing Glypican 3 from Expanded Genetic Systems Combined with Cell Engineering and Laboratory Evolution, Angew. Chemie Int. Ed 55 (2016) 12372–12375. 10.1002/anie.201605058. [DOI] [PMC free article] [PubMed] [Google Scholar]
- [12].Biondi E, Lane JD, Das D, Dasgupta S, Piccirilli JA, Hoshika S, Bradley KM, Krantz BA, Benner SA, Laboratory evolution of artificially expanded DNA gives redesignable aptamers that target the toxic form of anthrax protective antigen, Nucleic Acids Res. (2016). 10.1093/nar/gkw890. [DOI] [PMC free article] [PubMed] [Google Scholar]
- [13].Zhang L, Wang S, Yang Z, Hoshika S, Xie S, Li J, Chen X, Wan S, Li L, Benner SA, Tan W, An Aptamer‐Nanotrain Assembled from Six‐Letter DNA Delivers Doxorubicin Selectively to Liver Cancer Cells, Angew. Chemie (2020). 10.1002/ange.201909691. [DOI] [PMC free article] [PubMed] [Google Scholar]
- [14].Palecek E, Bartosik M, Electrochemistry of nucleic acids, Chem Rev. 112 (2012) 3427–3481. 10.1021/cr200303p. [DOI] [PubMed] [Google Scholar]
- [15].Špaček J, Fojta M, Wang J, Electrochemical Reduction and Oxidation of Six Natural 2′-Deoxynucleosides at a Pyrolytic Graphite Electrode in the Presence or Absence of Ambient Oxygen, Electroanalysis. 31 (2019) 2057–2066. 10.1002/elan.201900417. [DOI] [Google Scholar]
- [16].Špaček J, Daňhel A, Hasoň S, Fojta M, Label-free detection of canonical DNA bases, uracil and 5-methylcytosine in DNA oligonucleotides using linear sweep voltammetry at a pyrolytic graphite electrode, Electrochem Commun. 82 (2017) 34–38. 10.1016/j.elecom.2017.07.013. [DOI] [Google Scholar]
- [17].Novoselov KS, Geim AK, Morozov SV, Jiang D, Zhang Y, Dubonos SV, Grigorieva IV, Firsov AA, Electric field in atomically thin carbon films, Science (80-. ). 306 (2004) 666–669. 10.1126/science.1102896. [DOI] [PubMed] [Google Scholar]
- [18].Subramanian P, Dryhurst G, Electrochemical Oxidation of Guanosine - Formation of Some Novel Guanine Oligonucleosides, J. Electroanal. Chem 224 (1987) 137–162. 10.1016/0022-0728(87)85089-1. [DOI] [Google Scholar]
- [19].Daňhel A, Havran L, Trnková L, Fojta M, Hydrogen Evolution Facilitates Reduction of DNA Guanine Residues at the Hanging Mercury Drop Electrode: Evidence for a Chemical Mechanism, Electroanalysis. 28 (2016) 2785–2790. 10.1002/elan.201600242. [DOI] [Google Scholar]
- [20].Dudova Z, Spacek J, Tomasko M, Havran L, Pivonkova H, Fojta M, Electrochemical behavior of 7-deazaguanine- and 7-deazaadenine-modified DNA at the hanging mercury drop electrode, Monatshefte Fur Chemie. 147 (2016) 3–11. 10.1007/s00706-015-1584-7. [DOI] [Google Scholar]
- [21].Astwood D, Lippincott T, Deysher M, D’Amico C, Szurley E, Brajter-Toth A, Electrochemical and enzymatic oxidation of 2,6-diaminopurine, J. Electroanal. Chem 159 (1983) 295–312. 10.1016/S0022-0728(83)80629-9. [DOI] [Google Scholar]
- [22].Khudyakov IY, Kirnos MD, Alexandrushkina NI, Vanyushin BF, Cyanophage S-2L contains DNA with 2,6-diaminopurine substituted for adenine, Virology. (1978). 10.1016/0042-6822(78)90104-6. [DOI] [PubMed] [Google Scholar]
- [23].Astwood D, Lippincott T, Deysher M, D’Amico C, Szurley E, Brajter-Toth A, Electrochemical and enzymatic oxidation of 2,6-diaminopurine, J. Electroanal. Chem 159 (1983) 295–312. 10.1016/S0022-0728(83)80629-9. [DOI] [Google Scholar]
- [24].Kim HJ, Chen F, Benner SA, Synthesis and properties of 5-cyano-substituted nucleoside analog with a donor-donor-acceptor hydrogen-bonding pattern, J. Org. Chem (2012). 10.1021/jo300230z. [DOI] [PubMed] [Google Scholar]
- [25].Vosáhlová J, Koláčná L, Daňhel A, Fischer J, Balintová J, Hocek M, Schwarzová-Pecková K, Fojta M, Voltammetric and adsorption study of 4-nitrophenyl-triazole-labeled 2′-deoxycytidine and 7-deazaadenosine nucleosides at boron-doped diamond electrode, J. Electroanal. Chem 821 (2018) 111–120. 10.1016/j.jelechem.2018.01.003. [DOI] [Google Scholar]
- [26].Laviron E, Vallat A, Meunier-Prest R, The reduction mechanism of aromatic nitro compounds in aqueous medium. Part V. The reduction of nitrosobenzene between pH 0.4 and 13, J. Electroanal. Chem 379 (1994) 427–435. 10.1016/0022-0728(94)87167-1. [DOI] [Google Scholar]
- [27].Subramanian P, Tyagi SK, Dryhurst G, Electrochemical oxidations of some purine nucleosides. formation of some novel purine oligonucleosides., Nucleosides and Nucleotides. 6 (1987) 25–42. 10.1080/07328318708056177. [DOI] [Google Scholar]