

Abstract
This study estimates cumulative infection rates from Covid-19 in Great Britain by local authority districts (LADs) and council areas (CAs) and investigates spatial patterns in infection rates. We propose a model-based approach to calculate cumulative infection rates from data on observed and expected deaths from Covid-19. Our analysis of mortality data shows that 7% of people in Great Britain were infected by Covid-19 by the last third of June 2020. It is unlikely that the infection rate was lower than 4% or higher than 15%. Secondly, England had higher infection rates than Scotland and especially Wales, although the differences between countries were not large. Thirdly, we observed a substantial variation in virus infection rates in Great Britain by geographical units. Estimated infection rates were highest in the capital city of London where between 11 and 12% of the population might have been infected and also in other major urban regions, while the lowest were in small towns and rural areas. Finally, spatial regression analysis showed that the virus infection rates increased with the increasing population density of the area and the level of deprivation. The results suggest that people from lower socioeconomic groups in urban areas (including those with minority backgrounds) were most affected by the spread of coronavirus from March to June.
Keywords: Covid-19, Infectious diseases, Infection rates, Mortality, Statistical modelling, Spatial analysis
1. Background
The Covid-19 pandemic has become a major public health threat in many countries. Observed infections are well documented - they vary across countries and across regions within countries (John Hopkins, 2020). However, observed cases significantly underestimate the actual number of infected individuals and they cannot be easily compared across countries as they depend on the scale of testing, which varies substantially across countries. Little is still known about the actual number of infected people in Europe and other industrialised regions and their proportion of the population. This has led to speculation as to how widely the virus is spread and has caused debate in the media on whether the worst is over or is yet to come in the form of a second (and subsequent) wave. For example, Lourenco et al. argued that the majority of the population in the UK might have already been infected by mid-March (Lourenco et al., 2020). Others have shown that the virus is not widely spread, although the infected numbers are much higher than reported cases. In a US study Benavid et al. estimated some 54 thousand infected individuals in Santa Clara County (California), which was much higher than the reported cases in the country by early April (approximately one thousand). However, the estimated infection rate was still only 2.8% of the population (Bendavid et al., 2020). A study on Gangelt, a small German community, by Streeck et al. reported the proportion of infected individuals to be 15.5%, which was 5 times higher than reported cases (Streeck et al., 2020). However, the area is one of the worst-affected areas in Germany, where the virus spread rapidly and widely during the carnival season. Most estimates of the virus prevalence from other locations lie somewhere between these limits.1
National Statistical Offices provide information on individuals who have died from Covid-19. Normally the data include deaths from Covid-19 by age, sex and geographical region (ONS, 2020a; NRS, 2020a). An increasing number of studies from various countries also provide information on the infection fatality rates. Although the estimated infection fatality rates vary, most studies report estimates of between 0.4% and 1.3% (Streeck et al., 2020; Rinaldi and Paradisi, 2020; Roques et al., 2020; Ferguson et al., 2020; Verity et al., 2020). It is widely known that data on the likelihood of dying from Covid-19 exhibit a clear age pattern with the infection fatality rates low among young and middle-aged populations. They increase by age and are at their highest among those in their eighties and nineties. Mortality data by age and sex support these patterns - for example, in England and Wales 84% of people who had died by 3rd July were aged 70 and older (this includes registered deaths by 3/7/20) (ONS, 2020a). Therefore, by bringing together information on the infection fatality rates and data on the number of deaths from Covid-19 the virus infection rate can be estimated with a high degree of accuracy for countries, for various regions within countries and, increasingly, for population subgroups.
The aims of this study are fourfold. Firstly, to propose a model-based approach to calculate cumulative infection rates from mortality data. Secondly, to estimate cumulative infection rates from Covid-19 in Great Britain by local authority districts (England and Wales) and council areas (Scotland). Thirdly, to investigate spatial patterns in infection rates and finally, to examine determinants of geographical variation in infection rates. To the best of our knowledge this is one of the first studies to estimate infection rates within a country. Previous studies have either estimated infection rates in one region or town or at the country level (Streeck et al., 2020; Bohk-Ewald et al., 2020). There is a rapidly growing number of studies that investigate the spatial patterns of Covid-19 outbreaks within countries and worldwide. However, they use information on observed infections, which significantly underestimate actual infections (Franch-Pardo et al., 2020; Clin et al., 2020; Scarpone et al., 2020; Roy et al., 2020; Paez et al., 2020; Ram, 2020; Zhang, 2020; Mollalo and Vahedi, 2020; Miller and Miller, 2020; Gatto et al., 2020). To date no study has estimated cumulative infection rates using a statistical model. Research has shown that the spread of infectious diseases follows spatial patterns - they normally spread from a few places (often big cities) to other settlements and areas (He et al., 2013; Langford, 2002; Trilla et al., 2008; Harris, 2020). Therefore, determining spatial patterns in infection rates and detecting affected areas is important in order to gain a better insight into how widely and where the virus has spread. In Great Britain mortality data published by the Office for National Statistics (for England and Wales) and the National Records of Scotland provide indirect evidence of significant variation in the virus prevalence rate across the regions (ONS, 2020c).
2. Methods
2.1. Estimation of infection rates
We can estimate the true infection rate from Covid-19 for each local authority district and council area using the following formula:
| (1) |
where IR i is the estimated infection rate for geographical unit i, D i is the number of observed deaths in a geographical unit, P x,g,i is the number of individuals aged x in sex g in a geographical unit, F x,g is the infection fatality rate (IFR) in age x by sex, which is the same for all spatial units. Essentially, this is a conventional formula for the Standardised Mortality Ratio (SMR) where we calculate the ratio of observed and expected deaths, which we find by applying external (i.e. ‘standard’) mortality rates by age and sex to our study population. Here the expected deaths are the deaths from Covid-19 assuming that the infection rate is 1 (or everyone is infected). If we can estimate how many people would die if everyone was infected by the virus and we know the observed number of deaths at time moment t, we can interpret the ratio of the observed and expected deaths as the Covid-19 infection rate at time t, minus two to three weeks, which is normally the time from infection to death.
The approach raises some questions about its underlying assumptions. Firstly, what infection fatality rates should be used? Currently, the most reliable estimates come from a study by Verity et al. which are based on the analysis of Covid-19 mortality in China with infection fatality rate of 0.66% [95% CI: 0.39–1·33] (Verity et al., 2020). Ferguson et al. have adjusted these estimates to the UK's context - they received an overall infection fatality rate of 0.9% (Ferguson et al., 2020) We have used the age-specific estimates provided by Ferguson et al. in our baseline model. However, we also examined how much the results would change for Great Britain with higher or lower infection fatality rates using the estimates provided by Verity et al. (2020). Secondly, can we assume the same IFRs across geographical units? Studies show a significant variation in health and mortality in the UK across regions (Popham, 2006; Allan et al., 2019). Hence, a 75-year old individual living in a region with relatively low life expectancy is more likely to have an underlying health condition and so to die from Covid-19 rather than a 75-year living in a region with high life expectancy (as this individual is more likely to be healthy). There are several ways of adjusting IFRs to regional differences in mortality and health. We can use estimated life expectancy at age 50 or 65 by region if the data are available and the spatial units are not too small (to avoid a bias because of a small number of deaths); use age-adjusted information on self-reported health by region; or estimate an adjustment factor using a statistical model on deaths and some explanatory factors (e.g. deprivation) on lower level units if data are available. We calculated the age-standardised illness rate for individuals aged 60 and over for each geographical unit and used this as a multiplicative factor for infection fatality rates. We thus slightly modified formula 1 to adjust it to regionally varying mortality and health:
| (2) |
where h i is an age-standardised coefficient to adjust infection fatality rates for geographical unit i. We used the 2011 census data on self-reported limiting long-term illness for the population aged 60 and over (UK Data Service, 2020).
Finally, can we assume that all deaths from Covid-19 are recorded? Although this will not influence our estimates on regional differences in the Covid-19 infection rate (assuming that the same death recording practice is followed across Great Britain), it has potentially an effect on the estimated infection rate at the country level. Clearly, the Great Britain's official statistics reported an excess of deaths from causes other than Covid-19 in spring and early summer (ONS, 2020a). This was likely the so-called indirect effect of the pandemic (people with underlying health conditions postponed their visits to hospitals due to the Covid-19 pandemics); however some increase might still be directly related to Covid-19 mortality (e.g. multiple causes of deaths etc). We thus also estimated the Covid-19 infection rate in Great Britain assuming that some excess mortality from other causes is directly linked to deaths from Covid-19.
We can use formula 2 to estimate the Covid-19 infection rate by geographical units and also calculate other relevant measures, e.g. standard errors and confidence intervals for the estimates. However, we propose to estimate infection rate using the modern regression approach. As we used deaths from Covid-19 in our estimation we can apply a Poisson regression model, which is an appropriate method for count data. The general form of the Poisson regression model without any covariates is as follows:
| (3) |
where is infection rate. Since (see formula 3), then
| (4) |
where D is the observed number and E is the expected number of deaths (or an offset). In order to estimate the Covid-19 infection rates by geographical units we stratified the analysis by spatial units to obtain strata-specific estimates for and their standard errors. There are several advantages in using a regression framework to estimate the Covid-19 infection rates. Firstly, the model will provide an estimate for infection rate and its standard errors and confidence intervals can be easily calculated. Secondly, infection rates can be estimated for different strata, e.g. for geographical units. Further stratification is straightforward (e.g. by education, occupation or ethnic origin) provided that the data are available. Thirdly, the variation in infection rates by strata (e.g. geographical units) can be modelled including explanatory factors (e.g. population density). Finally, the model can be extended to also account for spatial autocorrelation, which is an ingredient of modelling any geographical data.
2.2. Spatial patterns in infection rates
We used Moran's I statistics to describe the spatial clustering of infection rates. Moran's I is calculated using the following formula (Fotheringham and Brunsdon, 2010; Rogerson, 2014):
| (5) |
where n is the number of spatial units, i and j are log infection rates for geographical units i and j, is the country's log infection rate and w ij is a measure of the spatial proximity between spatial units i and j. We used a binary connectivity definition where w ij = 1 if spatial units i and j share a common boundary, and w ij = 0 otherwise. The interpretation of Moran's I is straightforward - the value 1 shows the perfect spatial clustering of similar values, whereas the value 0 shows no spatial autocorrelation in the variable of interest.
2.3. Modelling spatial variation in infection rates
A Poisson regression model (4) can be extended to also include explanatory variables to investigate why infection rates vary across geographical units. For example, infection rates are likely to depend on the population density or the level of deprivation present in the area. However, conventional regression models, when applied to spatial data, violate the assumption of independence of observations. The residuals of such models are spatially autocorrelated. In order to control for spatial autocorrelation we need to apply a spatial regression model. The simplest way of extending an aspatial Poisson regression model to a spatial one would be to include the spatial lag term in the model (Besag, 1974). However, the auto-Poisson model suffers from severe shortcomings and its application should be avoided. A number of suggestions have been made on how to overcome these shortcomings (Lambert et al., 2010), but none of the suggested improvements or models has become widely accepted by the wider research community. For the sake of simplicity we applied a spatial linear model. This approach has several advantages - firstly, it is easy to understand as it is an extension of a conventional OLS regression model. Secondly, sophisticated models have been developed in this research area in the past decade, which allow the measurement not only of direct, but also indirect effects of explanatory variables (Golgher and Voss, 2016; Elhorst, 2010). We applied a spatial lag model, which is as follows:
| (6) |
where w ij is a spatial weight (see formula 6) and ρ is a spatial autocorrelation parameter to measure the effect of the dependent variable λ of neighbouring regions; X is an explanatory variable (e.g. population density or deprivation level). The spatial effects are thus included in the model as a weighted sum of the values of neighbouring regions. For the sake of simplicity and interpretation we used rate as an outcome variable.
2.4. Data
Information on deaths from Covid-19 come from the weekly mortality statistics provided by the Office for National Statistics (England and Wales) and the National Records of Scotland. We used mortality data from weeks 10 until week 27 (3rd July). The number of registered deaths from Covid-19 were 47,608 in England, 2,455 in Wales and 4,173 in Scotland (ONS, 2020b; NRS, 2020a). Data on mid-year population by age and sex (one-year intervals) in England, Wales and Scotland by local authority or council areas come from 2018. This is the latest year in which we have detailed information on population age-sex structure by geographical units (ONS, 2020g; NRS, 2020b). We applied the age-specific fatality rates provided by Ferguson et al. to calculate the number of expected deaths by geographical units Ferguson et al., 2020). We multiplied these estimates by 1.2 and 0.8 to obtain age-specific fatality rates for males and females, accordingly.2 In order to adjust our estimated number of deaths to regionally varying health conditions we used the 2011 census individual-level data on (self-reported) limiting long-term illness for the population aged 60 and over (UK Data Service, 2020). Although the UK's population health has improved over the last ten years, we used rich individual-level data from 2011 to calculate an adjustment factor assuming that regional differences in health have persisted. We also used deaths from Covid-19 by middle super output areas (MSOAs) in England and Wales (ONS, 2020c), population by age and sex (one-year intervals) by MSOA in mid-2018 and information on MSOA-level deprivation to calculate an alternative adjustment factor for regionally varying health conditions (see Table A1 in Appendix). All analyses were performed using (R Project, 2020; Kassambara, 2020; Arnold, 2020; Tiedemann, 2020; Pebesma, 2018; Wickham et al., 2019).
3. Results
3.1. Country level
We have estimated the cumulative Covid-19 infection rates in Britain based on deaths that occurred between 2nd March and 3rd July (weeks 10 to 27). With our baseline infection fatality rate about 4.5 million people had been infected by Covid-19 in Britain by the last third of June (assuming that the time between infection and death is 2 to 3 weeks). This is 7% of Britain's population [95% confidence interval: 6.9–7.0] (Table 1 ). This estimated number depends on the assumptions we make on the actual infection fatality rate; if we used a higher infection fatality rate the number of infected people would be 2.7 million, which is 4.2% of the population [95% CI: 4.2–4.3]. The number of infected cases is smaller because with higher death rates from Covid-19 fewer people are needed to observe the same death counts. With a lower infection fatality rate the number of infected individuals would be 9.6 million or 14.9% of Britain's population [95% CI: 14.8–15.1]. Which ever estimate we take these figures are many times higher than reported cumulative Covid-19 cases in Britain by the last third of June (e.g. 275,970 or 0.4% in 17/6/20 (John -)).
Table 1.
Estimated cumulative infection rates (IR) from Covid-19 in Great Britain.
|
Baseline scenario |
Low scenario |
High scenario |
|||||||
|---|---|---|---|---|---|---|---|---|---|
| Country | IR | Lower CI | Upper CI | IR | Lower CI | Upper CI | IR | Lower CI | Upper CI |
| England | 7.1 | 7.1 | 7.2 | 4.3 | 4.3 | 4.4 | 15.3 | 15.2 | 15.5 |
| Scotland | 6.2 | 6.0 | 6.4 | 3.7 | 3.6 | 3.9 | 13.3 | 12.9 | 13.7 |
| Wales | 5.5 | 5.3 | 5.7 | 3.4 | 3.2 | 3.5 | 11.8 | 11.4 | 12.3 |
| Great Britain | 7.0 | 6.9 | 7.0 | 4.2 | 4.2 | 4.3 | 14.9 | 14.8 | 15.1 |
Notes: Baseline scenario: Ferguson et al., Table 1 (Ferguson et al., 2020), Low scenario: Verity et al., Table 1 (Verity et al., 2020), Upper CI; High scenario: Verity et al. (2020), Lower CI; 95% Confidence Intervals.
Table 1 shows the Covid-19 infection rate by the Great Britain's constituent countries with the IFR of 1.2%, which is our baseline scenario.3 We see that England has an infection rate of 7.1% [95% CI: 7.1–7.2], which is the highest among the three countries. The infection levels in Scotland and Wales are lower, 6.2% [95% CI: 6.0–6.4] and 5.5% [95% CI: 5.3–5.7], correspondingly. However, the differences between countries are not substantial, suggesting that the virus has spread to all of Great Britain's constituent countries. The (small) variation between countries persists if we use a lower or higher infection fatality rate to calculate infection rates.
3.2. Local authority level
We have estimated the cumulative Covid-19 infection rates in Great Britain by local authorities. We observe a clear spatial pattern in the spread of the virus (Fig. 1 ). The estimated infection fatality rates are highest in the capital city of London, where between 11 and 12% of the population had likely been infected by the last part of June. Infection rates are also higher than average in other major British cities and their surrounding areas, i.e. Birmingham, Manchester, Liverpool, Cardiff and Glasgow. The infection rates in other major urban areas varied between 10 and 11% by the last third of June. Unsurprisingly, the virus is relatively little spread outside the main urban areas, i.e. in small towns and rural areas. These are large areas of South-West England (Cornwall, Devon, Somerset and Dorset); coastal areas of South-East and Eastern England; Northern England and Central and North Wales; Southern Scotland (Scottish Borders, South Ayrshire, Dumfries and Galloway) and the North West of Scotland (Highlands and Islands). The estimated infection rate in most of these areas is below the average for Great Britain. However, there are also a few clusters outside the main cities. For example, the virus has also spread in the Lake District where the infection rate is higher than the average for Great Britain.
Fig. 1.

Estimated cumulative infection rates from Covid-19 in Great Britain by local authority districts and council areas.
Next, we calculated the values of Moran's I, a global measure of spatial autocorrelation using the local authority level data for England and Wales and council areas for Scotland. The value of the index is 0.44 (with p<0.01), which indicates a substantial spatial clustering of infection rates in Britain, which is not surprising. Fig. 2 shows the estimated infection rates for selected Great Britain regions to illustrate variation within regions and the local clusters of high infection rates. The estimated infection rates in most areas of the capital city of London are above the national average (Fig. 2a). The highest infection rates are observed in the Northwestern part of the city including Brent and surrounding areas. Another cluster is in the Central-Eastern part of the city extending from the North to the South with the highest estimated infection rates in Newham. By contrast, lower infection levels are observed in several boroughs on the edge of the city region including Bexley and Bromley in the Southeast and Kingston, Richmond upon Thames and Sutton in the Southwest. Interestingly, infection rates are also relatively low in some boroughs in the city centre.
Fig. 2.


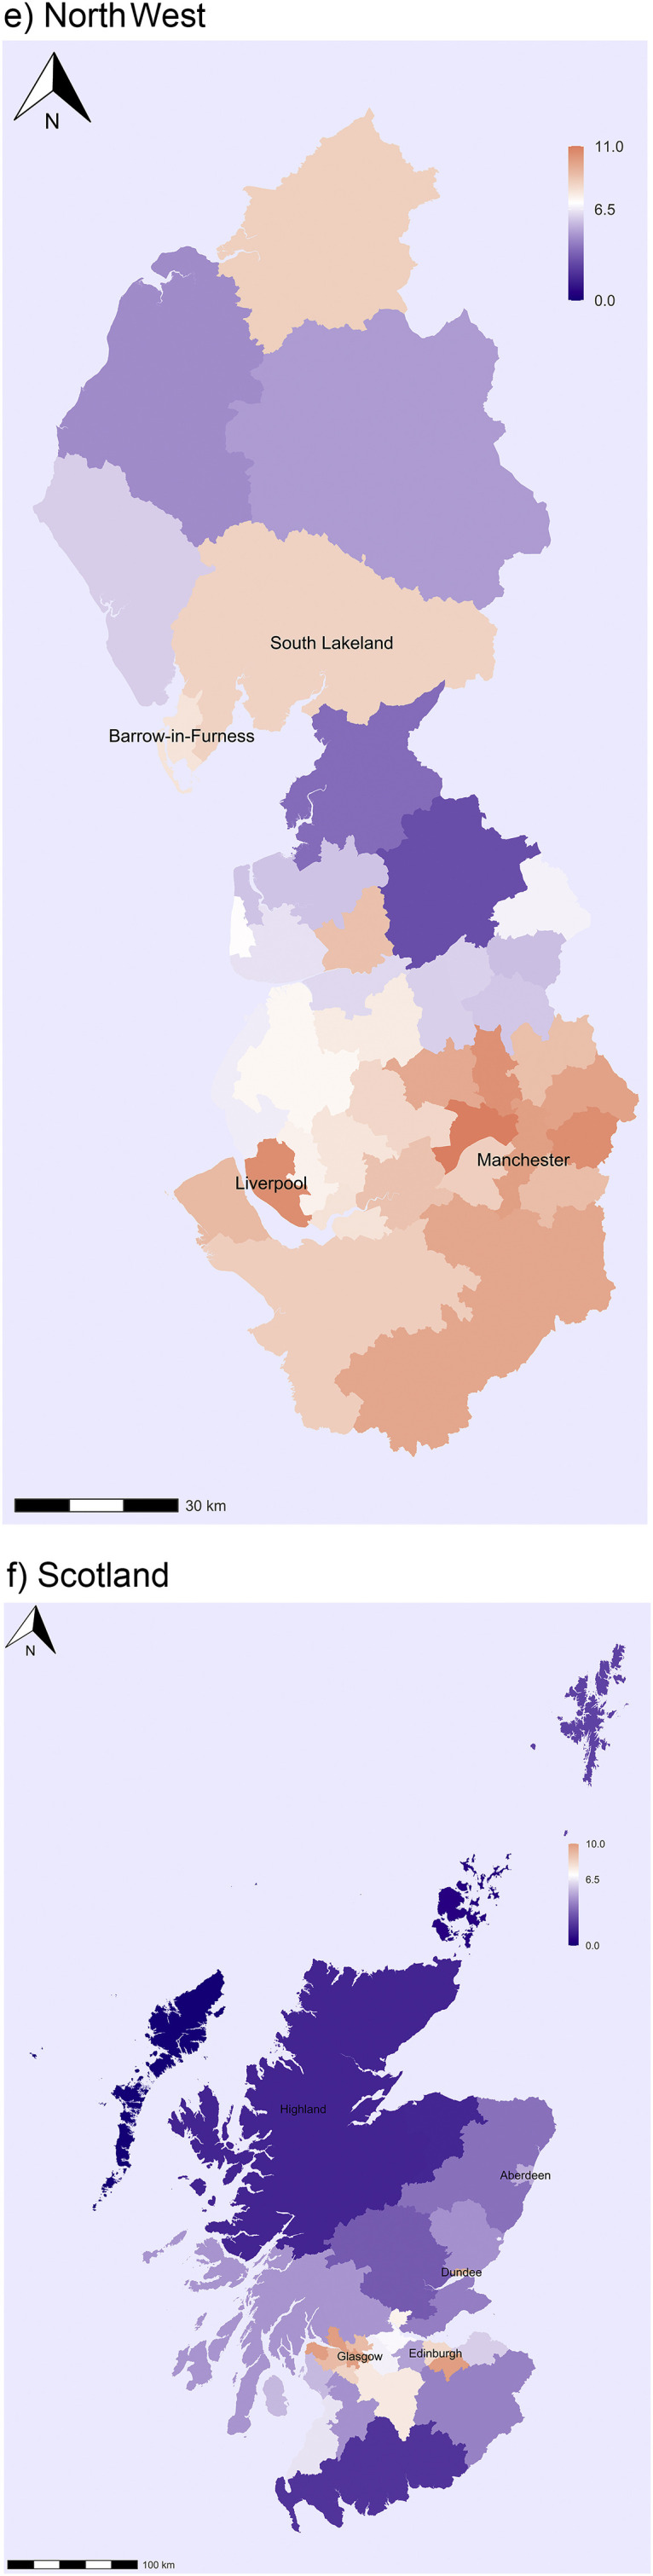
Estimated cumulative infection rates from Covid-19 in the UK for selected regions.
In the Midlands the highest infection rates are observed in Birmingham and its surrounding areas (Sandwell and Walsall), but also in East Staffordshire and Derby (Fig. 2b). Infection rates are low in Lincolnshire, Rutland and Herefordshire in the Eastern and Western corners of the Midlands accordingly. In South West England the highest levels are observed in Gloucestershire; infection rates are slightly higher in Bristol, but perhaps not as high as one would expect for a large city (Fig. 2c). By contrast, infection rates are low in large areas of Cornwall and Devon, and also Dorset and Somerset. In Wales the highest levels are observed in Cardiff and Newport, the largest and third largest city of the country. They are located in the proximity of the English border and thus also helps to explain the high infection levels observed in Gloucestershire (Fig. 2d). Estimated infection rates are still low in large areas of Southwestern Wales especially in Ceredigion and also in the Isle of Anglesey in North Wales.
In North West England the areas mainly affected by the virus are Merseyside and Greater Manchester and, as expected, the infection rates are highest in Liverpool and Manchester (Fig. 2e). Interestingly, there is also a region with higher-than-average infection rates in Cumbria including the districts of Barrow-in-Furness and South Lakeland. This indicates that the virus had also spread to parts of the Lake District before the lockdown was introduced in late March. Significant spatial clustering and regional variation are also observed in Scotland. The highest infection rates are found in the Glasgow region, with the highest levels in Inverclyde (Fig. 2f). The infection rates are also above the national average in other main cities including Edinburgh and Dundee. By contrast, the virus has not spread much to the Southern part of Scotland or the North West of Scotland (Highlands and Islands). Interestingly, the infection levels are also low in Aberdeen.
Finally, we have estimated the Covid-19 infection rates by area-type for England and Wales using the ONS urban-rural classification of local authority districts. We have modified the ONS classification by also distinguishing Inner and Outer London. Although the classification is based on local authority districts rather than lower (i.e. LSOA or MSOA) level area classification, and it does not capture all regional variation observed in the UK, it does provide a good summary of the spread of the virus in the country. The analysis reveals a clear urban-rural gradient in the spread of Covid-19. The highest levels are observed in Inner and Outer London where the infection rate is 10.9% [95% CIs: 10.5–11.3] and 11.6% [95% CIs: 11.3–11.9], accordingly, followed by other major cities with an infection rate of 8.8% [95% CIs: 8.7–9.0]. The lowest levels are observed in the areas classified as largely and mainly rural, 5.5% [95% CIs: 5.4–5.7] and 4.1% [95% CIs: 4.0–4.3], respectively.
3.3. Regression analysis
Finally, we have fitted a regression model to explain spatial variation in infection rates across local authority districts and council areas. We included in analysis the following explanatory variables: population density (persons per square km) and the level of deprivation measured by the Index of Multiple Deprivation (between 0 and 100). The rationale for choosing these variables is as follows. Infection rates vary significantly between urban and rural areas, and population density is a good measure of the level of urbanicity. Further, more densely populated areas are more likely to bring together different people and thus promote the spread of infectious diseases. Deprivation is believed to be associated with increased infection rates; this may be related to poorer housing conditions (e.g. living in flats) and overcrowding. Furthermore, it is also an indicator of social class and occupation. People from lower socioeconomic groups are more likely to work in occupations exposed to infections (e.g. bus drivers, shop assistants) and are also less able to protect themselves than those from higher socioeconomic groups who can often work from home. In preliminary analysis we also examined the percentage of ethnic minorities (or non-white population). However, the variable has a strong correlation with the level or deprivation and population density so we decided to exclude it because of the issue of multicollinearity.
In a first model we included in analysis population density and the level of deprivation separately (not shown). Both variables showed a significant relationship with the Covid-19 infection rates. In a second model we included both variables simultaneously (Table 2, Table 3 ). The coefficient changed only slightly for population density but reduced for the level of deprivation indicating that part of the deprivation effect is explained by population density. Nevertheless, both variables display a significant effect on the virus infection rate and they explain a significant share of spatial variation in infection rates (for a linear regression model without a spatial lag variable the value of R-Squared was 0.59). Clearly, infection rates increase with increasing levels of population density and deprivation (Table 3 reports the coefficients of a spatial lag model. The direct, total and indirect effects, which are required to calculate the exact effect of explanatory variables are displayed in Table A2 in Appendix.). We also observed a significant impact of the spatially lagged dependent variable. The estimate for rho is 0.58 (i.e. it is significantly different from zero) suggesting that infection rates of neighbouring areas are closely related. In substantive terms, the results are largely consistent with the idea of the spread of a virus as a spatial process where spatial proximity and spillover effects play an important role.
Table 2.
Estimated cumulative infection rates from Covid-19 in England and Wales by area type.
| Urban-Rural Classification | Population (%) | IR | Lower CI | Upper CI |
|---|---|---|---|---|
| Inner London | 6 | 10.9 | 10.5 | 11.3 |
| Outer London | 10 | 11.6 | 11.3 | 11.9 |
| Urban with Major Conurbation | 20 | 8.8 | 8.7 | 9.0 |
| Urban with Minor Conurbation | 4 | 7.5 | 7.2 | 7.9 |
| Urban with City and Town | 26 | 6.8 | 6.7 | 7.0 |
| Urban with Significant Rural | 13 | 6.6 | 6.4 | 6.7 |
| Largely Rural | 12 | 5.5 | 5.4 | 5.7 |
| Mainly Rural | 9 | 4.1 | 4.0 | 4.3 |
Notes: Baseline scenario.
Table 3.
Results of a spatial lag model on the Covid-19 infection rate.
| Variable | Coefficient | Std. Error | p-value | |
|---|---|---|---|---|
| Intercept | −0.04138 | 0.00772 | <0.01 | |
| Log Population Density | 0.00599 | 0.00107 | <0.01 | |
| Index of Multiple Deprivation | 0.00033 | 0.00011 | <0.01 | |
| Rho | 0.57768 | 0.10580 | <0.01 | |
| N = 365 | Residuals | |||
| Min | Q1 | Median | Q3 | Max |
| −0.06224 | −0.01192 | −0.00238 | 0.01162 | 0.06441 |
4. Conclusions
The aim of this study was to estimate cumulative infection rates from Covid-19 in Great Britain by local authority districts (England and Wales) and council areas (Scotland). To the best of our knowledge this is one of the first studies to estimate spatial variation in Covid-19 infection rates. We proposed an integrated model-based approach to estimate cumulative infection rates by geographical units and to study determinants of spatial variation in the spread of the virus. Statistical agencies provide data on the number of deaths from Covid-19 in countries by geographical units and the research community has provided reliable information on infection fatality rates by age, which may vary across geographical units. Our study demonstrates how the cumulative virus infection rates can be estimated with a high degree of accuracy by applying a statistical model to existing mortality data.
Our analysis showed the following. Firstly, based on mortality data up to 3rd July we estimated that about 4.5 million people might have been infected by Covid-19 in Britain by the last part of June, which is 7% of the population [95% CIs: 6.9–7.0] and much higher than the observed infection rate of 0.4%. Secondly, England exhibited a higher infection rate than Scotland or especially Wales, although the variation between the countries was relatively small. Thirdly, we observed a significant variation in the virus infection rates by geographical units, especially by the level of urbanicity. Estimated infection rates were highest in London and surrounding areas, followed by other major British cities. By contrast, virus infection rates were below average for Great Britain in small towns and rural areas, which included large areas of South-West England, coastal areas of the South-East and East of England, Northern England, Central and North Wales, Southern Scotland and the North West of Scotland. Finally, regression analysis showed a significant effect of population density and levels of deprivation on Covid-19 infection rates. The virus infection rates were higher in areas with higher population densities and deprivation levels.
How much uncertainty is there in our estimates? We quantified uncertainty by using different scenarios and confidence intervals around the estimates for each scenario. In our baseline scenario we used the infection fatality rate of 1.2%, which is an adjusted estimate for Great Britain based on the analysis of Chinese data (Ferguson et al., 2020; Verity et al., 2020). We also used lower and higher infection fatality rates based on uncertainty in the Great Britain estimate and on the recent studies from Germany, Italy and France (Streeck et al., 2020; Rinaldi and Paradisi, 2020; Roques et al., 2020). Our baseline scenario provided the cumulative infection rate of 7.0%; our low and high scenario gave estimates of 4.2% [95 CIs: 4.2–4.3] and 14.9% [95% CIs: 14.8–15.1] (see also Table A3 in Appendix). How likely are the lower or higher estimates? Lower or higher estimates for infection rates in Great Britain are possible only if our current knowledge of infection fatality rates by age is seriously biased. We also assumed that some excess deaths from causes other than the disease in Great Britain in recent months are actually deaths from Covid-19 (e.g. the actual number of deaths from Covid-19 was 10% higher than the reported number); however, the infection levels increased only by a percent point. But equally it is possible that some deaths from causes other than the virus have been recorded as Covid-19 deaths. Research shows that the number of deaths from seasonal flu and pneumonia are below the five-year average. From a geographical point of view, regional differences persist whatever infection rate we use.
Our study shows that Covid-19 is still not as widely spread in Great Britain as some believe, supporting research based on testing for antibodies in the UK and elsewhere in Europe.4 On the one hand, this may not be such good news to those who hope that ‘herd immunity’ will be achieved rapidly (without a heavy death toll). On the other hand, if the virus is not widely spread then its suppression and control is still possible with various public health measures before a cure and vaccine become available. Our analysis showed that the virus is mostly spread in big cities with a younger-than-average population. This may have reduced the number of deaths in comparison with what would have happened if the virus had spread widely in areas with an older population, although, as we know, Covid-19 has hit hard some pockets of elderly population in cities (e.g. care homes). Our analysis also showed that the virus has hit harder in areas of higher deprivation in cities, exacerbating existing social and spatial inequalities in Great Britain. Many of these areas have an above-average share of ethnic minorities. Although various factors related to living conditions may explain higher infection rates (poor housing conditions, overcrowding, etc.) we believe that the main reason is occupational structure. Many people from lower socioeconomic groups and minority backgrounds work in occupations directly exposed to infections (e.g. bus drivers, shop assistants). These are less able to protect themselves than those from higher socioeconomic groups who can often work from home. An analysis by the ONS of deaths from Covid-19 by occupation and ethnicity seems to provide indirect support for this argument (ONS, 2020a; ONS, 2020e; ONS, 2020f).
It is needless to emphasise that policy-makers should learn from these findings. Firstly, to mitigate the effects that Covid-19 has already had among people in the cities from lower socioeconomic and ethnic minority backgrounds. And secondly, to ensure that people who are exposed to virus infections due to their employment are properly protected, including those in occupations outside the National Health Services. Looking ahead it is also important to ensure that after easing the lockdown the virus should not spread rapidly from the cities to rural areas and small towns with older populations (cf. Zhang, 2020). If the virus spreads rapidly and widely in Great Britain (e.g. during a possible second wave) the effects could be devastating to remote rural communities with an elderly population (Kulu and Dorey, 2020). Some of these areas in England, Wales and Scotland are strongholds of minority languages and cultures.
Funding
This research was supported by Economic and Social Research Council grant ES/K007394/1 and carried out in the ESRC Centre for Population Change (CPC).
5. Transparency declaration
HK, the lead author, affirms that the manuscript is an honest, accurate, and transparent account of the study being reported; no important aspects of the study have been omitted; any discrepancies from the study as planned (and, if relevant, registered) have been explained.
CRediT authorship contribution statement
Hill Kulu: conceptualised the study, designed the study and prepared a manuscript. Peter Dorey: designed the study, conducted data analysis, and revised the manuscript.
Declaration of competing interest
HK and PD have nothing to declare.
Footnotes
Here we refer to the end of our study period, which was late June or early July 2020, i.e. when infection levels had significantly declined in most European countries after they had peaked in spring.
The UK experienced 54,236 registered deaths from Covid-19 by 3/7/20. The deaths of males formed 55% of the total number of deaths and those of females 45%. Multiplying the age-specific fatality rates provided by Ferguson et al. by 1.2 and 0.8, respectively, and applying the obtained rates to the UK's population will lead approximately to a 55/45 split.
An overall IFR for our baseline scenario is 1.2%, which is higher than the IFR reported by Ferguson et al. which is 0.9%. We received this estimate by applying ASFRs provided by Ferguson et al. to GB's population by age and sex from 2018. We adjusted these age-specific fatality rates for males and females (see footnote 2).
An ONS survey (N = 3,298) reports that 6.3% [95 CIs: 4.7–8.1] of individuals aged 16 and over tested positive for antibodies in England between 26th April to 27th June 2020 (ONS, 2020d).
Supplementary data to this article can be found online at https://doi.org/10.1016/j.healthplace.2020.102460.
Appendix A. Supplementary data
The following is the Supplementary data to this article:
References
- Allan R., Williamson P., Kulu H. Gendered mortality differentials over the rural-urban continuum: the analysis of census linked longitudinal data from England and Wales. Soc. Sci. Med. 2019:68–78. doi: 10.1016/j.socscimed.2018.10.005. Available from. 221. [DOI] [PubMed] [Google Scholar]
- Arnold JB. 2020. Extra Themes, Scales and Geoms for “Ggplot2” [R package ggthemes version 4.2.0].
- Bendavid E., Mulaney B., Sood N., Shah S., Ling E., Bromley-Dulfano R., et al. COVID-19 antibody seroprevalence in Santa Clara county, California. medRxiv. 2020 doi: 10.1093/ije/dyab010. https://www.medrxiv.org/content/10.1101/2020.04.14.20062463v1?fbclid=IwAR3NrK8oRFFOVulmb1_4hMJpOUvKUgC6MuS7vi7jPvNyy2xeTPlZoaYmlxA 04.14.20062463. Available from. [DOI] [PMC free article] [PubMed] [Google Scholar]
- Besag J. Spatial interaction and the statistical analysis of lattice systems. J R Stat Soc Ser B. 1974;36(2):192–225. [Google Scholar]
- Bohk-Ewald C., Dudel C., Myrskyla M. A demographic scaling model for estimating the total number of COVID-19 infections. medRxiv. 2020 doi: 10.1093/ije/dyaa198. https://www.medrxiv.org/content/10.1101/2020.04.23.20077719v2 Available from. [DOI] [PMC free article] [PubMed] [Google Scholar]
- Clin A., Antimicrob M., Martellucci C.A., Sah R., Rabaan A.A., Dhama K., et al. Changes in the spatial distribution of COVID - 19 incidence in Italy using GIS - based maps. Ann. Clin. Microbiol. Antimicrob. 2020:1–4. doi: 10.1186/s12941-020-00373-z. Available from. [DOI] [PMC free article] [PubMed] [Google Scholar]
- Elhorst J.P. Relever le niveau de l’économetrie spatial appliquée. Spatial Econ. Anal. 2010;5(1):9–28. [Google Scholar]
- Ferguson N.M., et al. COVID-19 reports, Faculty of Medicine Imperial College London. 2020. https://www.imperial.ac.uk/mrc-global-infectious-disease-analysis/news-wuhan-coronavirus/ Available from. 2020.
- Fotheringham S.A., Brunsdon C. Quantitative geography: perspectives on spatial data analysis. 2020. https://uk.sagepub.com/en-gb/eur/quantitative-geography/book207480 Available from. 13 April 2020.
- Franch-Pardo I., Napoletano B.M., Rosete-Verges F., Billa L. Science of the total environment spatial analysis and GIS in the study of COVID-19 . A review. Sci. Total Environ. 2020;739 doi: 10.1016/j.scitotenv.2020.140033. Available from. [DOI] [PMC free article] [PubMed] [Google Scholar]
- Gatto M., Bertuzzo E., Mari L., Miccoli S., Carraro L., Casagrandi R. Spread and dynamics of the COVID-19 epidemic in Italy : Effects of emergency containment measures. Proc. Natl. Acad. Sci. Unit. States Am. 2020 doi: 10.1073/pnas.2004978117. [DOI] [PMC free article] [PubMed] [Google Scholar]
- Golgher A.B., Voss P.R. In: How to interpret the coefficients of spatial models: spillovers, direct and indirect effects. Spatial Demography. 2016;4:175–205. [Google Scholar]
- Harris R. Exploring the neighbourhood-level correlates of Covid-19 deaths in London using a difference across spatial boundaries method. Health & Place. 2020;66:102446. doi: 10.1016/j.healthplace.2020.102446. [DOI] [PMC free article] [PubMed] [Google Scholar]
- He D., Dushoff J., Day T., Ma J., Earn D.J.D. Inferring the causes of the three waves of the 1918 influenza pandemic in England and Wales. Proc R Soc B Biol Sci. 2013;(1766):280. doi: 10.1098/rspb.2013.1345. [DOI] [PMC free article] [PubMed] [Google Scholar]
- John Hopkins University Coronavirus resource center [internet] 2020. https://coronavirus.jhu.edu/ Available from.
- Kassambara A. 2020 “ggplot2” Based Publication Ready Plots [R package ggpubr version 0.2.5].
- Kulu H., Dorey P. The contribution of age structure to the number of deaths from covid-19 in the UK by geographical units. medRxiv. 2020 http://medrxiv.org/content/early/2020/04/22/2020.04.16.20067991.abstract [Internet] 04.16.20067991. Available from. [Google Scholar]
- Lambert D.M., Brown J.P., Florax R.J.G.M. A two-step estimator for a spatial lag model of counts: theory, small sample performance and an application. Reg. Sci. Urban Econ. 2010;40(4):241–252. doi: 10.1016/j.regsciurbeco.2010.04.001. Available from. [DOI] [Google Scholar]
- Langford C. The age pattern of mortality in the 1918-19 influenza pandemic: an attempted explanation based on data for England and Wales. Med. Hist. 2002;46(1):1–20. [PMC free article] [PubMed] [Google Scholar]
- Lourenco J., Paton R., Ghafari M., Kraemer M., Thompson C., Simmonds P., et al. Fundamental principles of epidemic spread highlight the immediate need for large-scale serological surveys to assess the stage of the SARS-CoV-2 epidemic. medRxiv. 2020 https://www.medrxiv.org/content/10.1101/2020.03.24.20042291v1 Available from. [Google Scholar]
- Miller L.E., Miller A.L. Spatial analysis of global variability in covid-19. Risk Manag. Healthc. Pol. 2020;3 doi: 10.2147/RMHP.S255793. [DOI] [PMC free article] [PubMed] [Google Scholar]
- Mollalo A., Vahedi B.R.K. GIS-based spatial modeling ofCOVID-19 incidence rate in the continental United States. Sci. Total Environ. J. 2020;728 doi: 10.1016/j.scitotenv.2020.138884. [DOI] [PMC free article] [PubMed] [Google Scholar]
- NRS Deaths involving coronavirus (COVID-19) in Scotland. [Internet] 2020. https://www.nrscotland.gov.uk/covid19stats Available from.
- NRS Population estimates. 2020. https://www.nrscotland.gov.uk/statistics-and-data/statistics/statistics-by-theme/population/population-estimates Available from:
- ONS Deaths registered weekly in England and Wales. provisional. 2020 https://www.ons.gov.uk/peoplepopulationandcommunity/birthsdeathsandmarriages/deaths/datasets/weeklyprovisionalfiguresondeathsregisteredinenglandandwales [Internet] Available from. [Google Scholar]
- ONS Death registrations and occurrences by local authority and health board. [Internet] 2020. https://www.ons.gov.uk/peoplepopulationandcommunity/healthandsocialcare/causesofdeath/datasets/deathregistrationsandoccurrencesbylocalauthorityandhealthboard Available from.
- ONS Deaths involving COVID-19 by local area and deprivation. 2020. https://www.ons.gov.uk/peoplepopulationandcommunity/birthsdeathsandmarriages/deaths/datasets/deathsinvolvingcovid19bylocalareasanddeprivation Available from.
- ONS Coronavirus (COVID-19) infection survey. [Internet] 2020. https://www.ons.gov.uk/peoplepopulationandcommunity/healthandsocialcare/conditionsanddiseases/datasets/coronaviruscovid19infectionsurveydata Available from.
- ONS Coronavirus (COVID-19) related deaths by occupation. England and Wales. 2020 https://www.ons.gov.uk/peoplepopulationandcommunity/healthandsocialcare/causesofdeath/datasets/coronaviruscovid19relateddeathsbyoccupationenglandandwales [Internet] Available from. [Google Scholar]
- ONS Odds ratios for risk of coronavirus-related deaths by ethnic group. England and Wales. 2020 https://www.ons.gov.uk/peoplepopulationandcommunity/birthsdeathsandmarriages/deaths/datasets/oddsratiosforriskofcoronavirusrelateddeathsbyethnicgroupenglandandwales [Internet] Available from. [Google Scholar]
- ONS Population estimates. 2020. https://www.ons.gov.uk/peoplepopulationandcommunity/populationandmigration/populationestimates Available from:
- Paez A., Lopez F.A., Menezes T., Cavalcanti R., Galdino M. A spatio-temporal analysis of the environmental correlates of COVID-19 incidence in Spain. Geogr. Anal. 2020:1–25. doi: 10.1111/gean.12241. [DOI] [PMC free article] [PubMed] [Google Scholar]
- Pebesma E. Simple features for R: standardized support for spatial vector data. R J. 2018;10(1):439–446. [Google Scholar]
- Popham F. Is there a “Scottish effect” for self reports of health? Individual level analysis of the 2001 UK census. BMC Publ. Health. 2006;6(1):191. doi: 10.1186/1471-2458-6-191. http://bmcpublichealth.biomedcentral.com/articles/10.1186/1471-2458-6-191 Available from. [DOI] [PMC free article] [PubMed] [Google Scholar]
- R Project The R project for statistical computing [Internet] 2020. https://www.r-project.org/ [cited 2020 Apr 16]. Available from.
- Ram I.J. COVID-19 emergence and social and health determinants in Colorado : a rapid spatial analysis. Int. J. Environ. Res. Publ. Health. 2020 doi: 10.3390/ijerph17113856. [DOI] [PMC free article] [PubMed] [Google Scholar]
- Rinaldi G., Paradisi M. An empirical estimate of the infection fatality rate of COVID-19 from the first Italian outbreak. medRxiv. 2020;2020 04.18.20070912. [Google Scholar]
- Rogerson P.A. SAGE Publications Ltd; 2014. Statistical Methods for Geography.https://uk.sagepub.com/en-gb/eur/statistical-methods-for-geography/book243249 Available from. [Google Scholar]
- Roques L., Klein E., Papaix J., Sar A., Soubeyrand S. Using early data to estimate the actual infection fatality ratio from COVID-19 in France. medRxiv. 2020 doi: 10.3390/biology9050097. http://medrxiv.org/content/early/2020/04/07/2020.03.22.20040915.abstract 2020.03.22.20040915. Available from. [DOI] [PMC free article] [PubMed] [Google Scholar]
- Roy S., Sankar G., Pravat B., Shit K. Spatial prediction of COVID - 19 epidemic using ARIMA techniques in India. Model Earth Syst Environ. 2020 doi: 10.1007/s40808-020-00890-y. Available from. [DOI] [PMC free article] [PubMed] [Google Scholar]
- Scarpone C., Brinkmann S.T., Große T., Sonnenwald D., Fuchs M., Walker B.B. A multimethod approach for county - scale geospatial analysis of emerging infectious diseases : a cross - sectional case study of COVID - 19 incidence in Germany. Int. J. Health Geogr. 2020:1–17. doi: 10.1186/s12942-020-00225-1. Available from. [DOI] [PMC free article] [PubMed] [Google Scholar]
- Streeck H., Schulte B., Kümmerer B.M., Richter E., Höller T., Fuhrmann C., et al. 2020. Infection Fatality Rate of SARS-CoV-2 Infection in a German Community with a Super-spreading Event. [DOI] [PMC free article] [PubMed] [Google Scholar]
- Tiedemann F. 2020. Visualizing Social Science Data with “Ggplot2” [R package ggpol version 0.0.6] [Google Scholar]
- Trilla A., Trilla G., Daer C. The 1918 “Spanish flu” in Spain. Clin. Infect. Dis. 2008;47(5):668–673. doi: 10.1086/590567. [DOI] [PubMed] [Google Scholar]
- UK Data Service Census microdata. [Internet] 2020. https://census.ukdataservice.ac.uk/get-data/microdata.aspx Available from. 2020.
- Verity R., Okell L.C., Dorigatti I., Winskill P., Whittaker C., Imai N., et al. Estimates of the severity of coronavirus disease 2019 : a model-based analysis. Lancet Infect. Dis. 2020;3099(20):1–9. doi: 10.1016/S1473-3099(20)30243-7. [DOI] [PMC free article] [PubMed] [Google Scholar]
- Wickham H., Averick M., Bryan J., Chang W., D’ L., Mcgowan A., et al. RStudio 2 cynkra 3 redbubble 4 erasmus university rotterdam 5 flatiron health 6 department of integrative biology. J Open Source Softw. 2019;4(43):1686. [Google Scholar]
- Zhang C.H. Spatial disparities in coronavirus incidence and mortality in the United States : an ecological analysis as of may 2020. J. Rural Health. 2020;36(May):433–445. doi: 10.1111/jrh.12476. [DOI] [PMC free article] [PubMed] [Google Scholar]
Associated Data
This section collects any data citations, data availability statements, or supplementary materials included in this article.