Abstract
Purpose:
Although advancements in cancer treatments using radiation therapy (RT) have led to improved outcomes, radiation-induced heart disease (RIHD) remains a significant source of morbidity and mortality in survivors of cancers in the chest. Currently, there are no diagnostic tests in clinical use due to a lack of understanding of the natural history and mechanisms of RIHD development. Few studies have examined the utility of using metabolomics to prospectively identify cancer survivors who are at risk of developing cardiotoxicity.
Methods:
We analyzed plasma and left ventricle heart tissue samples collected from a cohort of male Sprague Dawley (SD) rats that were either sham irradiated or received fractionated doses (9 Gy per day x 5 days) of targeted X-ray radiation to the heart. Metabolomic and lipidomic analyses were utilized as a correlative approach for delineation of novel biomarkers associated with radiation-induced cardiac toxicity. Additionally, we used high-resolution mass spectrometry to examine the metabolomic profiles of plasma samples obtained from patients receiving high dose thoracic RT for esophageal cancer.
Results:
Metabolic alterations in the rat model and patient plasma profiles, showed commonalities of radiation response that included steroid hormone biosynthesis and vitamin E metabolism. Alterations in patient plasma profiles were used to develop classification algorithms predictive of patients at risk of developing RIHD.
Conclusion:
Herein, we report the feasibility of developing a metabolomics-based biomarker panel that is associated with adverse outcomes of cardiac function in patients who received RT for the treatment of esophageal cancer.
Keywords: plasma biomarkers, radiation therapy, cardiac toxicity, metabolomics
Introduction
Radiation therapy (RT) is frequently used for the management of esophageal cancer in the definitive, preoperative, and adjuvant settings [1]. A recent large randomized study demonstrated that over 40% of patients were alive at 5 years following multimodality treatment [2]. Due to the improved outcomes with advancements in therapy, it has become increasingly necessary to assess treatment-related short- and long-term toxicity in this patient population. Since the heart typically receives a large portion of the dose due to its proximity to the esophagus, cardiac toxicity is a significant concern. The crude risk of cardiac complications following RT for esophageal cancer is estimated to be 10.8% (range, 5 - 44%), with most events occurring within 2 years [3]. Nonetheless, few prospective studies have assessed the impact of RT on cardiac function in patients with esophageal cancer.
Manifestations of radiation-induced heart disease (RIHD) include pericarditis, ischemic cardiovascular disease, cardiomyopathy, valvular dysfunction, clinical heart failure and arrhythmias [4]. Currently, there are no biomarkers that would allow early identification of patients who may develop clinically significant radiation induced cardiac toxicity. We have previously shown that local heart irradiation in rat models induces alterations in mitochondrial morphology and function that lasts for several months after radiation exposure [5]. Since mitochondria play a central role in carbon, nitrogen and lipid metabolism, utilization of a metabolomics approach to assess cellular and mitochondrial activity and relate this to myocardial remodeling in response to radiation is likely to strengthen our understanding of cardiotoxicity. In addition, there are well-known changes in major metabolic pathways and redox status that are associated with cardiovascular events. Therefore, multiple studies have used metabolite profiles to identify risk of cardiovascular disease [6, 7]. Fischer et al used high-throughput metabolite profiling to identify phenylalanine and 3 fatty acids as independent biomarkers for future cardiovascular events [8]. While these are common markers of heart disease, no biomarker panel was described to predict RIHD in cancer patients receiving RT. In summary, minimally invasive biomarkers represent a potentially useful tool for predicting cardiac injury during or following thoracic RT, however, there are currently no validated markers in routine use.
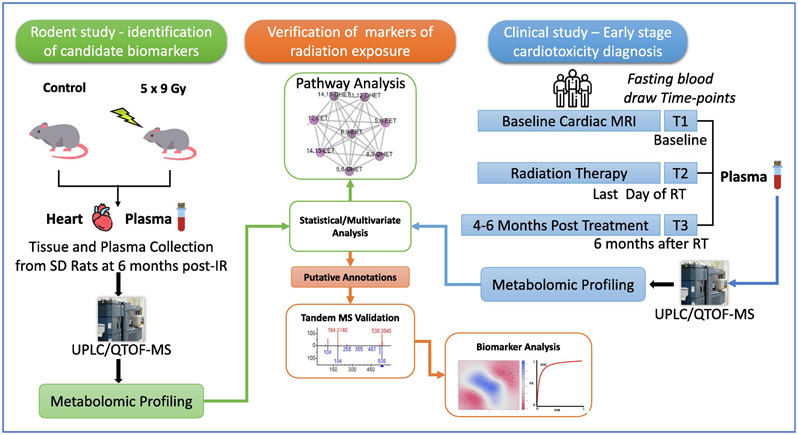
The goal of this exploratory study was to test the feasibility of developing a classification algorithm for predicting early-onset radiation-induced cardiac injury. We hypothesized that metabolomic and lipidomic bio-signatures are informative of normal tissue toxicity, preceding clinical presentation. We used metabolomics and lipidomics analyses to provide information on biological perturbations based on relative changes in the tissue and plasma levels of endogenous metabolites for a retrospective study. We profiled banked plasma and cardiac tissue samples from groups of male Sprague Dawley (SD) rats that were either sham irradiated or received fractionated doses (9 Gy per day x 5 days) of targeted X-ray radiation to the heart [9] to delineate long term metabolic pathway perturbations. Separately, as a part of a prospective clinical trial, serial blood samples and cardiac MRI data was collected in patients treated with RT for locally advanced esophageal cancer (n = 11 patients x 3 time points). We identified a subset of patients who developed new onset radiation related heart ischemia and fibrosis in the inferior/basal segment of the heart, as well as associated cardiac functional impairments at a median 4 months following RT. Plasma metabolic profiles were analyzed at baseline (T1), immediately following RT (3-5 weeks) (T2) and 3 - 6 months after RT (T3), to develop biomarker panels predictive of cardiac toxicity by comparing plasma small molecule profiles of patients who developed cardiotoxicity with those who maintained normal heart function. The overall study design is illustrated in Figure 1.
Figure 1.
Overall experimental design integrating a clinical cardiotoxicity study with a rat radiation study to determine biomarkers of radiation exposure.
Methods
Animal Irradiation and Sample Collection:
Rat local heart irradiation was performed as described previously [9]. In short, male SD rats were obtained from Charles River Laboratories and maintained on a 12:12 light-to-dark cycle with free access to food and water. At a weight of 250-290 g (about 9 weeks of age), rats received local heart irradiation using an image-guided X-ray machine (Small Animal Conformal RT Device, SACRTD). Rats were anesthetized with 3% isoflurane and placed vertically in a cylindrical Plexiglas holder that was cut out such that no Plexiglas material was in between the radiation beam and the chest. The heart was localized using the X-ray detector onboard the SARRP (70 kV, 5 mA, <1 cGy) and then exposed in three 19 mm-diameter fields (anteriorposterior and two lateral fields), given immediately after each other to a total dose of 9 Gy (225 kV, 13 mA, 0.5 mm Cu-filtration, resulting in 1.92 Gy/min at 1 cm tissue depth). This procedure was repeated for 5 consecutive days, to obtain a 5x9 Gy local heart irradiation. Each radiation fraction consisted of three subsequent radiation beams. The imaging procedure to identify the heart was performed prior to each of the three fields in each of the daily fractions. All procedures in this study were approved by the Institutional Animal Care and Use Committee of the University of Arkansas for Medical Sciences. In the Linear Quadratic model, and assuming an α/β of 3 for the heart, the biological equivalent dose (BED) to the heart in the rat study was twice the BED delivered to the target volume in the human subjects (see also Patient Recruitment and Measurement of Clinical Parameters). In our experience, in rats, delivering the same BED as in thoracic RT of humans does not lead to significant changes in cardiac function or pathology. Moreover, cardiac toxicity in the clinical study may have been enhanced by chemotherapy, not administered to the rats. In our experience, in male SD rats, a dose of 5x9 Gy induces myocardial fibrosis and changes in cardiac function when measured at 6 months after radiation [9].
Six months after irradiation, rats were anesthetized by 3% isoflurane inhalation. The abdomen was opened, and a blood sample was drawn from the inferior vena cava, using a winged infusion set (23G) and into an EDTA coated tube. The blood sample was immediately spun down (1,000 x g, 15 minutes at 5°C, supernatant spun down at 10,000 x g, 5 minutes at 5°C), and supernatant snap-frozen and stored at −80°C. Immediately after blood collection, the thorax was opened, the heart was collected and dissected into atria, right ventricle, and left ventricle, and each was snap-frozen and stored at −80°C. Plasma samples and specimens of left ventricle were used for metabolomics analysis described below.
Patient Recruitment and Measurement of Clinical Parameters:
Patients with distal esophageal cancer (n=11), who were treated with neoadjuvant chemoradiation to 50.4 Gy with concurrent carboplatin and paclitaxel followed by esophagectomy at Medstar-Georgetown University Hospital were recruited for the study. Ten patients who completed all follow-ups were included in the analysis. Subjects underwent cardiac MRI prior to the initiation of RT (T1) and 4-6 months following RT (T3). Cardiac MRI (CMR) was used to determine left ventricular and right ventricular function, valvular function, late gadolinium enhancement, first-pass perfusion at rest and post-stress, and T2 signal intensity. Quantitative measurements included ejection fraction (EF), end-diastolic volume (EDV), end-systolic volume (ESV), cardiac output (CO) and myocardial mass. Additionally, fasting blood draws were performed at T1, T2 (last day of RT) and T3. Plasma markers of cardiac function including brain natriuretic peptide (BNP), C-reactive protein (CRP), and troponin were measured with commercial ELISA assays.
Sample Preparation for Liquid Chromatography Mass Spectrometry (LC-MS):
Twenty-five microliter (μL) of each plasma sample was combined with 75 μL of an extraction solution consisting of 35% water, 25% methanol and 40% isopropanol containing internal standards (debrisoquine and 4-nitrobenzoic acid). Samples were vortexed and incubated on ice for 20 minutes. Next, a volume of 100 μL of acetonitrile (ACN) was added to the vials. Samples were vortexed and incubated at −20°C for 15 minutes. Finally, samples were centrifuged at 15,493 x g for 20 minutes at 4°C and the supernatant was transferred to mass spectrometry vials for analysis using UPLC-QTOF-MS. Pooled quality control (QC) samples were created by combining 5 μL of each sample and was injected every 10 samples during batch acquisition on the LC-MS.
For the heart tissue samples, a volume of 150 μL of a chilled mixture of 35% water, 25% methanol, and 40% isopropanol containing the same internal standards was added to about 10 mg of tissue. The internal standards were prepared by adding 10 μL of Debrisoquine (1 mg/mL in ddH20) and 50 μL of 4-NBA (1 mg/mL in methanol) for every 10 mL of extraction solution. The tissue samples were homogenized and 150 μL of acetonitrile was added to each; the samples were then vortexed and maintained at −20°C for 20-30 minutes to allow for protein precipitation. Samples were centrifuged at 17,968 x g for 15 min at 4°C and the supernatant was transferred to LC-MS vials.
Heart and Plasma analysis by Liquid Chromatography Mass Spectrometry (LC-MS):
For metabolomic analysis of the heart tissue, a volume of 2 μL of each sample was injected onto a reverse-phase 50 × 2.1 mm Acquity 1.7-μm BEH C18 column at 40°C column temperature (Waters Corp, Milford, MA) using an Acquity UPLC system (Waters) with a gradient mobile phase consisting of 100% water containing 0.1% formic acid (Solvent A), 100% acetonitrile containing 0.1% formic acid (Solvent B), and 90/10 isopropanol/acetonitrile containing 0.1% formic acid (Solvent D) and resolved for 13 min at a flow rate of 0.4 mL/min. The gradient started with 95% A and 5% B for 0.5 min with a ramp of curve 6. At 8 minutes, the gradient reached 2% A and 98% B. At 9 minutes, the gradient shifted to 2% B and 98% D for one minute before starting its return to the initial gradient. The metabolomic analysis of plasma samples were also injected onto a BEH C18 column, but at a column temperature of 60°C. The solvent system and run time were the same, however, the flow rate was set to 0.5 mL/min. The initial conditions for the gradient were 98% A and 2% B and were held for 0.5 minutes. The gradient shifted to 40% A and 60% at 4 minutes before reaching 2% A and 98% B at 8 minutes. At 9.5 minutes, the gradient was 2% B and 98% D and was held for 1.5 minutes. After 0.5 minutes, the composition was 50% A and 50% B. Finally, at 12 minutes, the gradient returned to initial conditions at 98% A and 2% B and was held for 1 minute to reequilibrate the column.
The LC method for the lipidomic analysis for both the heart and the plasma samples were the same. The samples were injected onto a 100 x 2.1 mm Acquity 1.7 μm CSH C18 column. The solvents consisted of 50/50 acetonitrile/water (Solvent C) and 90/10 isopropanol/acetonitrile (Solvent D). Both solvents contained 0.1% formic acid and 10mM ammonium formate. The gradient flowed at 0.45 mL/min and began at 60°C. After being held for 0.5 minutes, the gradient shifted to 100% D at 8 minutes for 0.5 minutes before returning to starting gradient.
The column eluent was introduced directly into the mass spectrometer by electrospray. Mass spectrometry was performed on a Waters Xevo G2 QToF MS, operating in either negative (ESI-) or positive (ESI+) electrospray ionization modes with a capillary voltage of 3 kV for positive mode and 2.75 kV for negative mode and a sampling cone voltage of 30 V in the positive mode and 20 V in the negative mode. The source offset for negative mode was at 80. The desolvation gas flow was 600 liters/hour and the temperature was set to 500°C. Cone gas flow was 25 liters/hour, and the source temperature was 100°C. Accurate mass was maintained by the introduction of LockSpray interface of Leucine Enkephalin (556.2771 [M+H]+ or 554.2615 [M-H]−) at a concentration of 2 ng/μL in 50% aqueous ACN and a rate of 20 μL/min, Data were acquired in centroid mode from 50 to 1200 m/z. Pooled QC (quality control samples) were run throughout the batch to monitor data reproducibility.
GC-MS sample preparation and derivatization:
A volume of 250 μL of ice-cold methanol containing an internal standard (4-nitrobenzoic acid) was added to 25 μL of plasma and mixed for 2 minutes. Samples were then centrifuged at 15,493 x g for 20 minutes at 4°C. The supernatant was separated, and the residue was further extracted with an additional 250 μL of ice-cold methanol. Next, 250 μL of 1 M KOH solution in methanol was added to each sample and samples were mixed for 30 minutes. Sample pH was brought to 5 with 1M HCl solution in distilled water and 1 mL of isooctane was added to each sample before being mixed for 5 minutes. Finally, samples were centrifuged at 15,493 x g for 20 minutes at 4°C. The isooctane supernatant layer was then combined with the methanol extracts from the previous steps. Samples were placed in GC vials and evaporated under vacuum using a speedvac (Savant, USA). Derivatization was accomplished by adding 20 μL of methoxyamine (20 mg/mL) to the dried samples and heating in an agitator at 60°C for 30 minutes. Subsequently, 100 μL of N-Methyl-N-(trimethylsilyl) trifluoroacetamide (MSTFA) was added. Vials were then again placed into an agitator at 60°C for 30 minutes. Finally, vials were capped, and data were acquired on an Agilent 7890B GC coupled to a Leco Pegasus HT GC/ToF-MS.
GC-MS profiling:
A volume of 1.5 μL of each derivatized sample was injected in a splitless mode into an Agilent 7890 B GC system (Agilent Technologies, Santa Clara, CA) coupled to a Pegasus HT TOF-MS (LECO Corporation, St. Joseph, MI). The separation was achieved on a Rtx-5 w/Integra-Guard capillary column (30 m × 0.25 mm ID, 0.25 μm film thickness; Restek Corporation, Bellefonte, PA) with helium as the carrier gas, at a constant flow rate of 1 mL/minute. The temperatures of injection, transfer interface, and ion source were 150°C, 270°C and 320°C, respectively. GC temperature programming was set to 0.2 minutes of isothermal heating at 70°C, followed by 6°C /minute oven temperature, ramping to 300°C, 4 minutes of isothermal heating of 270°C, 20°C/minute to 320°C and 2 minutes of isothermal heating of 320°C. Electron impact ionization (70 eV) at full scan mode (40-600 m/z) was used, with an acquisition rate of 20 spectra per second in the TOF/MS setting. Mass spectra were compared to literature spectra available in the NIST database as well as the Fiehn library of compounds.
BC A kit-based protein quantification was performed for normalization purposes (Thermo Fisher Scientific, USA), according to the manufacturer’s protocol.
Data Processing and Statistical Analysis:
For analysis of untargeted metabolomics data, raw MS data files were converted to NetCDF format using Databridge. NetCDF files were processed using an in-house implementation of the XCMS (Scripps Institute, La Jolla, CA) R package. XCMS was used for peak detection and retention time correction. Initially, the ion peaks were filtered and detected using the matched filter algorithm. The peak detection algorithm allows data to be binned into parts with predefined widths and mass, and it is then compared to known peaks of similar distributions. Retention time correction was performed using the Ordered Bijective Interpolated Warping (OBI-Warp) algorithm [10]. All parameters for the matched filter and OBI-Warp algorithm were optimized by IPO (Isotopologue Parameter Optimization) R package [11]. XCMS outputs results in m/z’s, retention times and ion intensities. Data were then normalized to intensities of internal standards. Tissue data were also normalized to total protein concentration. Multivariate statistical analyses were then performed using Metaboanalyst (Xia lab, McGill University, Montreal Canada) implemented in R, with log transformation and Pareto scaling. The tandem MS spectra of marker candidates were acquired by UPLC-QToF-MS/MS and validated using TandemQuery (Li et al., unpublished) and an in-house R package “msmsr” (Li et al., unpublished) with the NIST 2017 MS/MS standard spectra database. The fragmentation information of the validated metabolites that were significantly dysregulated for different comparisons in rat tissue, rat plasma and patient plasma are detailed in Supplementary Table 1A-C, respectively.
In order to evaluate dysregulated metabolic pathways in heart tissue and plasma, we used Mummichog v2.0, a Python package designed for testing pathway enrichment patterns in untargeted metabolomics datasets. Additionally, metabolomics and lipidomics data were integrated in Reactome [12] to reveal combined pathway changes. To predict CT, Linear SVM (support vector machines) were used as the classification algorithm. We then applied an elastic net logistic regression (ELR) [13] model, which combines the penalties of ridge and lasso regression models to gain the performance benefits of each [14], in order to do feature selection among all metabolites and clinical factors. All features are log-transformed and pareto-scaled. Grid search using tenfold cross-validation was used to optimize hyperparameters α and λ.
Results:
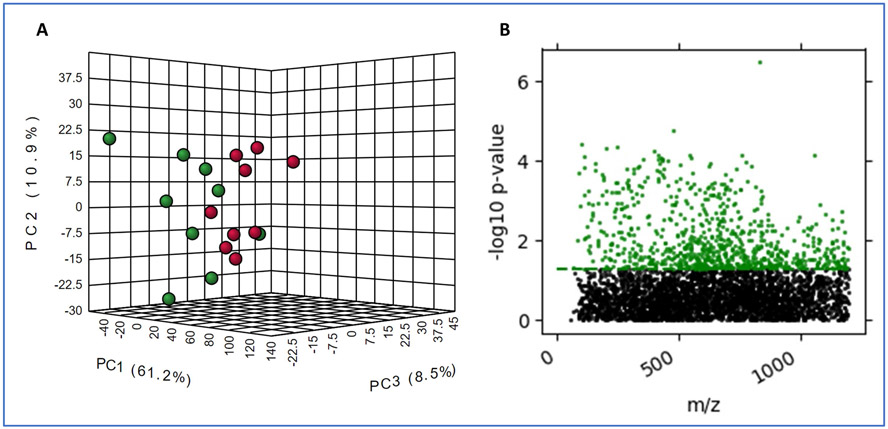
Exposure to ionizing radiation causes long-term changes in metabolic profiles of rat heart and plasma. We have previously reported on radiation-induced alterations in mitochondria in the heart of adult male SD rats, either after a single dose of X-rays to the heart [5] or after five oncea-day fractions of 9 Gy (5 x 9 Gy) [9], At 6 months after 5 x 9 Gy local heart irradiation, small but statistically significant changes in cardiac function and a small increase in cardiac collagen deposition were observed in irradiated rats compared to age-matched sham controls (5 x 0 Gy) [9], We studied the metabolic and lipidomic changes in the left ventricle tissue to delineate the tissue-specific response to RT and correlate these changes with those in plasma. The untargeted LC-MS analysis resulted in detection of a total of 8,793 and 12,806 features for both ionization modes and for both metabolomics and lipidomics acquisitions in heart tissue and plasma respectively. Partial least squares discriminant analysis of plasma metabolome profiles indicated a reasonable separation of irradiated rats compared to sham irradiated rats (n=8 per group) (Figure 2 Panel A).
Figure 2.
Exposure to ionizing radiation induces long term changes in plasma and tissue metabolic profiles in SD rats. Panel A. PCA plot showing intergroup separation on the X-axis and intra-group variability on the Y-axis based on plasma profiles. Panel B. Manhattan plot of heart tissue metabolites that change significantly post-IR (in green).
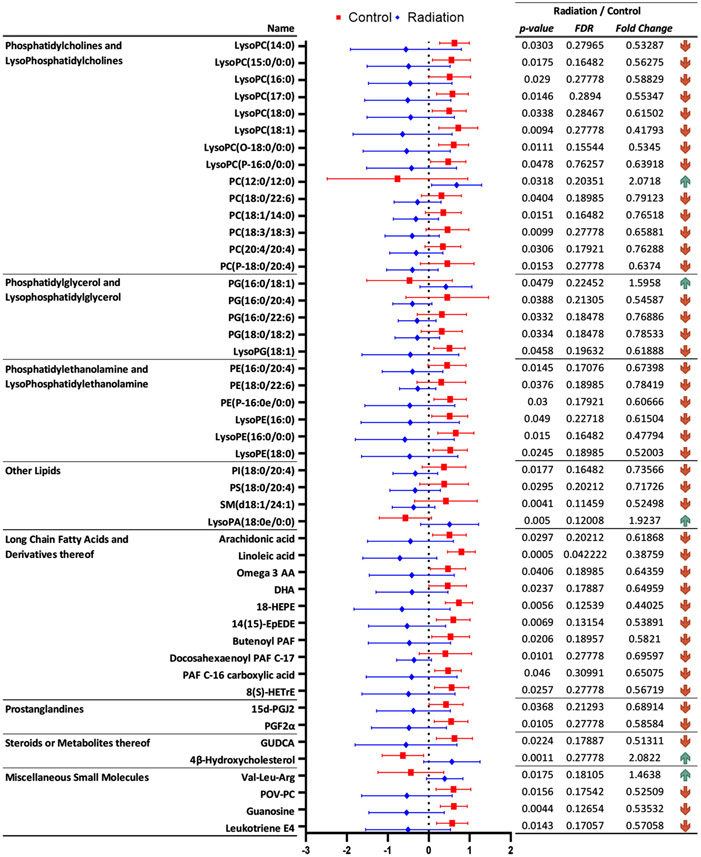
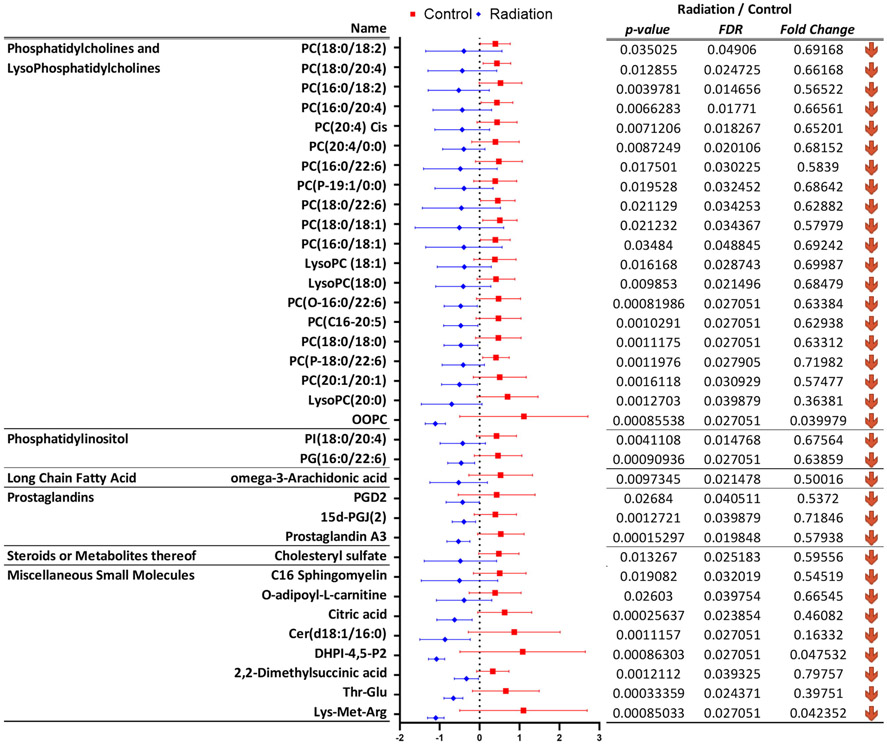
The differentially abundant metabolites in heart tissue for the same comparison were visualized as a Manhattan plot over the entire mass range (50-1200 m/z) (Figure 2, Panel B). We detected ~2,100 m/z that were significantly altered in heart tissue and plasma from irradiated rats compared to sham-irradiated rats six months post-IR. Using tandem MS, TandemQuery, and the NIST-MS/MS-17 mass spectral standard library database, we validated 24 metabolites, which were significantly altered upon irradiation (Supplementary Table 2A and 2B). Subsets of dysregulated metabolites were visualized as box plots for plasma and heart (Figures 3 and 4, respectively).
Figure 3.
Significantly dysregulated metabolites in rat heart tissue, six months after irradiation, that were annotated using tandem mass spectrometry.
Figure 4.
Significantly dysregulated metabolites in rat plasma six months after irradiation, that were annotated using tandem mass spectrometry.
We observed dyslipidemia in the heart tissue as a delayed effect of radiation exposure; several classes of lipids including glycerophosphocholines (GPC), sphingomyelins, phosphatidylinositols and acylcarnitines were downregulated six months after rats received radiation to the heart (Figure 3 and Supplementary Table 2A). These included changes in the endogenous levels of LysoPE(16:0/0:0), LysoPC(15:0/0:0), LysoPE(18:0), PC(18:0/22:6), PC(18:1/14:0), PC(20:4/20:4), and LysoPC(O-18:0/0:0), which have been implicated in heart dysfunction [15]. Several metabolites of GPCs including LysoPA(18:0), platelet activating factor (PAF), and PG(16:0/18:0) were also found to be significantly altered in the heart tissue; dysregulation of GPC metabolism has direct implications on the risk of cardiovascular disease [16]. Interestingly, there was a decrease in the tissue levels of omega-3 fatty acids including docosahexaenoic acid and linolenic acid in the heart tissue, suggesting a chronic inflammation endophenotype; alterations in these classes of metabolites have been implicated in the regulation of membrane fluidity and integrity [17].
A similar evaluation of rat plasma profiles also showed a significant dysregulation of GPCs, prostaglandins, phosphatidylinositol, long-chain fatty acids and metabolites of steroid metabolism (Figure 4 and Supplementary Table 2B). Additionally, we observed dysregulation in acetylcarnitine, citric acid and dimethylsuccinic acid in the plasma of irradiated rats. Taken together, these findings suggest that exposure to ionizing radiation has a long-term impact on metabolic and lipidomic profiles which are apparent in both cardiac tissue and the circulation. The localized changes in the heart are valuable in understanding how changes in lipids and metabolites could impact structure and function, while changes in plasma could be leveraged as biomarkers of radiation exposure and extent of radiation injury.
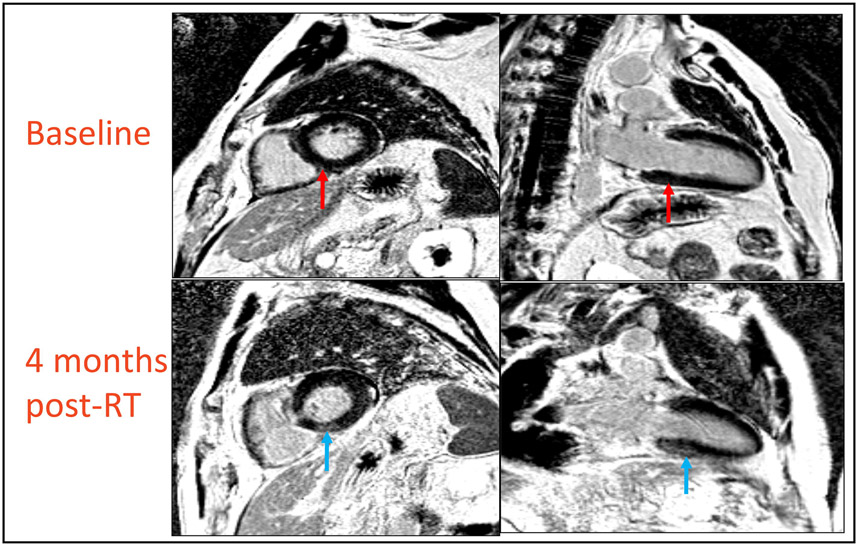
RT results in cardiac toxicity in a subset of esophageal cancer patients. Eleven patients with esophageal cancer were enrolled in a prospective trial at MedStar Georgetown University Hospital under a prospective IRB approved study that ran from 2016-2018. The eligibility criteria included locally advanced non-metastatic distal esophageal cancer, and candidacy for trimodality therapy with Concurrent Chemoradiation RT (CCRT) followed by esophagectomy. Cohort characteristics are detailed in Table 1. All patients received carboplatin and paclitaxel and a cumulative radiation dose of 50.4 Gy in 28 fractions. The mean heart dose was 21.9 Gy (range, 6.0 – 26.7 Gy) and the mean volume of heart receiving 30 Gy was 21.4% (range, 10.0 – 30.2%). One patient showed complete response to CCRT and did not undergo esophagectomy. We performed fasting blood draw at baseline (T1), final day of RT (T2) and 4-6 months post-RT (T3) to measure CRP, NT-proBNP and Troponin-I and for metabolomics/lipidomics analyses. Ten patients completed trimodality therapy and received baseline and post-treatment CMR and blood draws. One patient refused post-treatment CMR and blood draw and was excluded from the analysis. Median time from completion of RT to post-RT CMR was 3.9 months (range 3-5 months). Three out of 10 patients had new structural findings of myocardial fibrosis and/or reversible ischemia involving mid and basal inferior and inferoseptal walls while 2 out of 10 patients had areas of late gadolinium enhancement on their post-radiation scans. In the three patients who showed signs of myocardial injury on MRI, the left ventricle end systolic volume (LVESV) was significantly increased from baseline following radiation (Figure 5). Changes in CRP, NT-proBNP and Troponin-I were not associated with the development of cardiotoxicity (Supplementary Table 3).
Table 1.
Distribution of patient characteristics at baseline.
| Patient Characteristics | |
|---|---|
| Age – years | |
| Median | 69 |
| Range | 37–80 |
| Sex – no. (%) | |
| Male | 9 (82) |
| Female | 2 (18) |
| Tumor type – no. (%) | |
| Adenocarcinoma | 10 (91) |
| Squamous cell carcinoma | 1 (9) |
| Clinical T stage – no. (%) | 2 (18) |
| cT2 | 9 (82) |
| cT3 | |
| Clinical N stage – no. (%) | |
| N0 | 3 (27) |
| N1 | 8 (73) |
| Stage group – no. (%) | |
| IIA | 2 (18) |
| III | 9 (82) |
| Cardiac comorbidities | |
| Diabetes | 4 (36) |
| Hypertension | 6 (55) |
| Hyperlipidemia | 4 (36) |
| Coronary artery disease | 1 (9) |
Figure 5.
MRI scans of esophageal cancer patients obtained pre and 3-5 months post RT. Three out of ten patients showed areas of late gadolinium enhancement on their post-radiation scans. The blue arrows show hyperintense signals in the basal inferoseptal segment representing the presence of fibrosis in the subepicardial and mid-wall portion of the myocardium in regions receiving mean dose of 16.3 – 30.5 Gy. Red arrows on point to the same region at baseline, showing an absence of these signals in-patient’s initial scan.
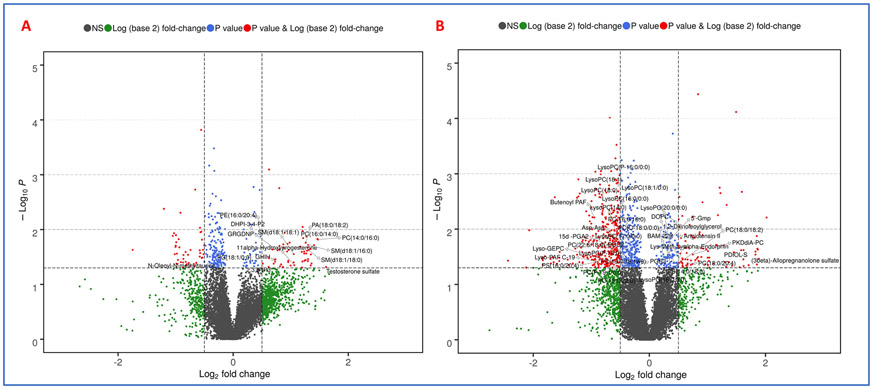
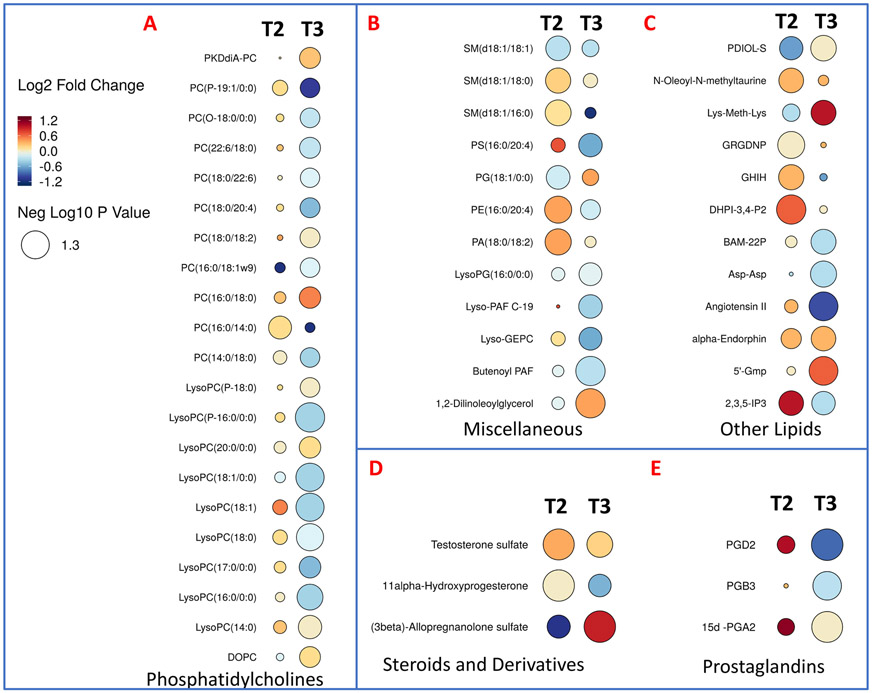
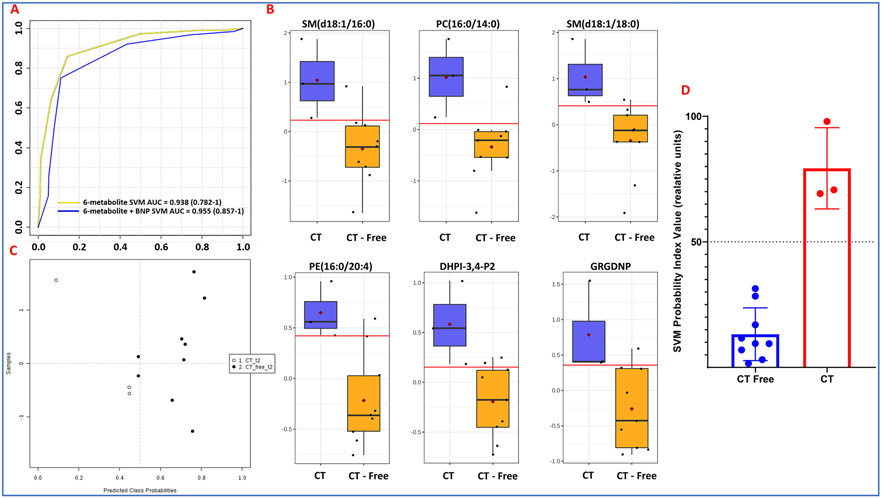
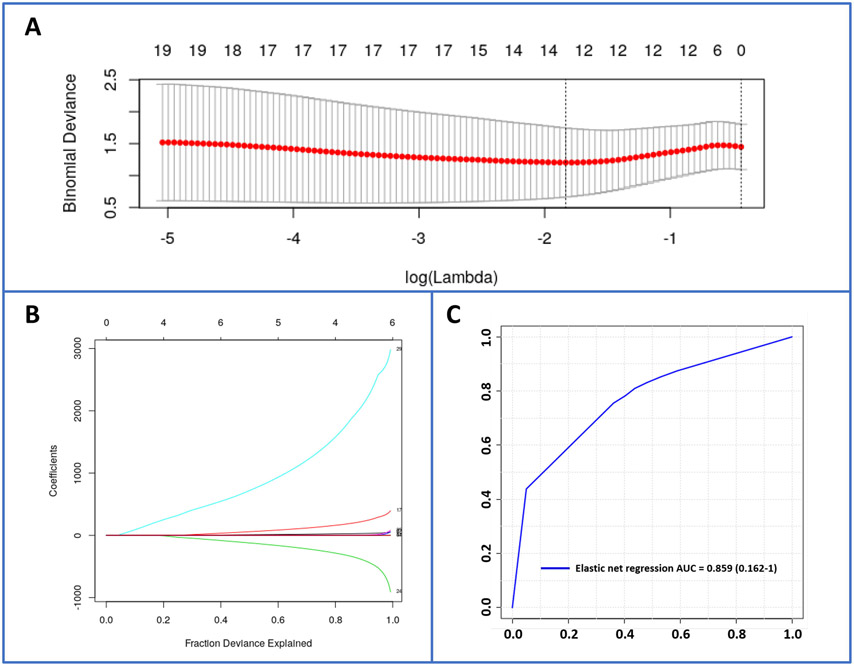
Metabolomic profiles are predictive of cardiac toxicity in esophageal cancer patients. Next, we asked if alterations in plasma metabolite or lipid profiles could be leveraged for developing correlative markers of radiation-induced heart dysfunction. To address this, we compared plasma profiles of patients who developed symptoms of cardiac toxicity with those who did not at the final day of RT (T2) and 4-6 months post-RT (T3). The changes were visualized as volcano plots (Figures 6A and 6B respectively) that showed lipid dysregulation to be a major determinant of cardiac toxicity in these patients. The full list of annotated metabolites and lipids is in Supplementary Table 4. Specifically, these included glycerophosphocholines (PCs and LysoPCs), sterols (testosterone sulfate, allopregnalone sulfate), sphingomyelins, prostaglandins, and other lipids such as butenoyl platelet activating factor (PAF), Lyso PAF C-19, diacyclglycerol (DAG), and N-oleolylmethyltaurine, among others (Figure 7). Our aim was to develop a high accuracy classification algorithm for prediction of radiation-induced heart dysfunction; to this goal, we used linear SVM to identify metabolite changes that correlated with cardiac toxicity. To ensure independence between training and testing sets, 10-fold cross-validation was performed, which yielded a six-metabolite panel that was predictive of cardiac toxicity in a subset of esophageal cancer patients at 4-weeks post-RT (T2). The receiver operator characteristic (ROC) curve yielded an area under the curve (AUC) of 0.938 (95% CI: 0.782-1) (Figure 8, Panel A). The six metabolite panel consisted of SM(d18:1/16:0), PC(16:0/14:0), SM(d18:1/18:0), PE(16:0/20:4), 1-(1,2-Dihexanoylphosphatidyl) inositol-4,5-bisphosphate and Gly-Arg-Gly-Asp-Asn-Pro, all of which were upregulated in plasma of patients who later developed cardiotoxicity (Figure 8, panel B). Other clinical factors were also taken into consideration. BNP was found to improve the prediction performance of the six metabolite panel which yielded an AUC of 0.955 (95% CI: 0.857-1). The efficiency of classification was examined on an uncertainty plot, which showed clustering of patients with cardiac complications; interestingly two patients who did not show any structural or functional changes in the heart classified closer to those with cardiac toxicity and may warrant a closer follow up (Figure 8, panel C). A plasma metabolite probability index value was calculated for each patient based on this trained linear SVM algorithm, and a score of 50 was set as the cutoff point to classify the two sub-sets of patients (Figure 8, panel D). Hyperparameters for elastic net regression (ELR) were visualized as a cross-validation curve (Figure 9, Panel A) and the percentage deviance explained was visualized by Figure 9, panel B. ELR selected a twelvemetabolite biomarker panel to predict cardiac toxicity with an AUC of 0.859 (95% CI: 0.162-1) (Figure 9, Panel C). Out of the twelve selected metabolites, SM(d18:1/16:0), PC(16:0/14:0), PE(16:0/20:4), DHPI-3,4-P2, and GRGDNP overlapped with the previous SVM model. The selected metabolites unique to the ELR model were PG(18:1/0:0), N-Oleoyl-N-methyltaurine, 2,3,5-IP3, GHIH, PC(14:0/16:0), testosterone sulfate, and SM(d18:1/18:0). There were no clinical or demographic factors selected in this model since they did not improve the performance of the biomarker panel. Taken together, these results underscore the value of using a metabolomics approach for the development of predictive biomarkers of radiation injury in susceptible individuals who may then elect for additional clinical surveillance and/or intervention.
Figure 6.
A. Volcano plot showing comparison of patient plasma profiles at two weeks post-RT (T2). B. Volcano plot showing comparison of patient plasma profiles at 3-5 months post-RT (T3). All metabolites have a significant p-value (< 0.05) comparing patients with cardiac toxicity versus no toxicity and were annotated by tandem mass spectrometry.
Figure 7.
Rain drop plot illustration showing altered lipids and metabolites at 2 weeks (T2) and 4-5 months (T3) post-RT, in patients who developed cardiac toxicity.
Figure 8.
Biomarker panel predictive of radiation induced cardiac toxicity 2 weeks post-RT. Panel A. ROC curve of a six-metabolite biomarker SVM panel with AUC = 0.938 (0.782-1); six-metabolite plus BNP biomarker SVM panel with AUC = 0.955 (0.857-1). Panel B. Uncertainty matrix showing distribution of patients based on the biomarker pane. Panel C. Pattern of abundance for the six-metabolite panel in patients who developed cardiac toxicity as compared to those who did not. Panel D. The linear SVM model that distinguishes the two patient groups.
Figure 9.
Elastic net regression for evaluation of biomarker performance. Panel A. Cross-validation curve (red dotted line) and corresponding upper and lower SD curves along the λ sequence (error bars). Selected λs are indicated by the vertical dotted lines. Panel B. Percent deviance explained on the dataset: Variable path of each coefficient against the fraction deviance explained. Panel C. ROC curve of an elastic net regression selected 12-metabolite biomarker panel with AUC = 0.859 (0.162-1).
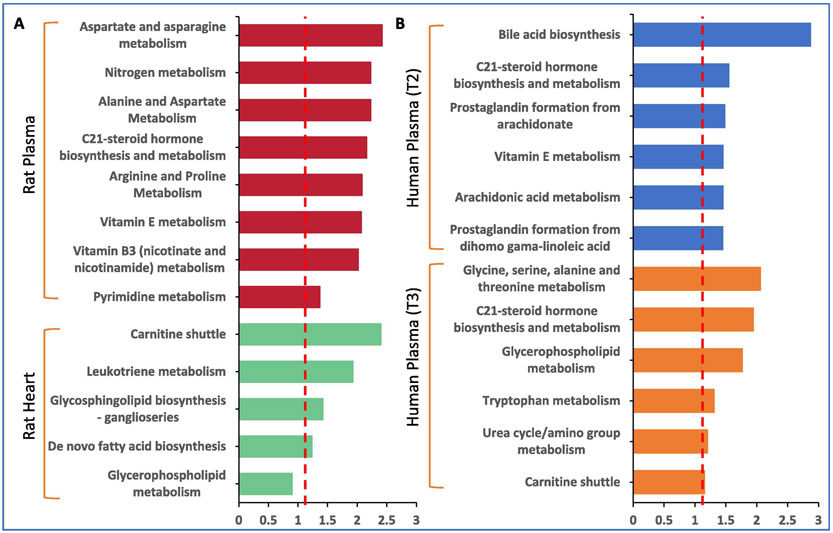
Pathway perturbations correlate with radiation injury. We used the Mummichog Python package to determine pathway perturbations in response to radiation treatment [18]. Aspartate and arginine metabolism, steroid hormone biosynthesis and vitamin B3 and E were significantly dysregulated in rat plasma profiles, while rat heart showed perturbations in carnitine shuttle and leukotriene metabolism implicating dyslipidemia and tissue fibrosis due to defects in arachidonic acid metabolism (Figure 10, Panel A). Similar interrogation of patient plasma profiles showed bile acid biosynthesis, steroid hormone biosynthesis vitamin E metabolism as well as arachidonic acid and glycerophospholipid metabolism pathways (Figure 10, Panel B). Reactome pathway analysis was then performed for a combined interrogation of metabolomics and lipidomics results in both the rat model and the patients (Supplementary Table 5-8). This pathway analysis revealed changes in ceramide signaling and synthesis of PS in rat plasma and heart respectively, as well as in the synthesis of PC and in phospho-PLA2 pathway in human plasma at T2 and T3 respectively. Since perturbations in the steroid hormone biosynthesis and metabolism overlapped between the rat and human plasma profiles (at both time points evaluated), we next used GC-MS analysis to validate these analytes (Supplementary Table 9). As shown in Table 2, rat tissue showed downregulation of a number of omega-3 fatty acids including alpha-linolenic acid, eicosadienoic acid and docosatetraenoic acid. Rat plasma showed increased levels of myristic acid, 3-hydroxybutyric acid, hexadecenoic acid that are substrates for steroid hormone biosynthesis, while patient plasma showed decreased levels of glucocorticoid steroid hormones including 11-deoxycortisol, epitestosterone and corticosterone, which have important biological and functional roles. For example, corticosterone is the precursor molecule to the mineralocorticoid aldosterone, which is one of the major homeostatic modulators of sodium and potassium levels in vivo [19]. Glucocorticoids also inhibit eicosanoid synthesis primarily by interfering with phospholipase A2 thus attenuating a range of prodromal, acute and chronic effects of radiation. As such, depletion of these hormones could therefore result in adverse responses of normal tissues and organs to radiation [20].
Figure 10.
Comparative pathway analysis in: A. rat model and B. patient plasma, 6 months post-IR.
Table 2.
List of the most significantly different metabolites based on GC-MS data.
| Type | Name | p-value | FDR | Fold Change | up/down |
|---|---|---|---|---|---|
| Rat Tissue | L-Tryptophan | 3.65E-02 | 0.269 | 1.1304 |  |
| 2-Propenoic acid | 1.43E-02 | 0.196 | 1.7002 |  |
|
| L-5-Oxoproline | 9.53E-04 | 0.056 | 0.41891 |  |
|
| Cholesterol | 6.75E-03 | 0.196 | 0.64807 |  |
|
| cis-7,10,13,16-Docosatetraenoic acid | 1.56E-02 | 0.196 | 0.29234 |  |
|
| alpha-Linolenic acid | 1.66E-02 | 0.196 | 0.29748 |  |
|
| Heptadecanoic acid | 2.12E-02 | 0.209 | 0.3131 |  |
|
| 11,14-Eicosadienoic acid | 3.50E-02 | 0.269 | 0.38938 |  |
|
| L-Isoleucine | 4.38E-02 | 0.287 | 0.55425 |  |
|
| Rat Plasma | Ethanolamine | 2.73E-05 | 0.002 | 4.7755 |  |
| Myristic acid | 7.97E-03 | 0.225 | 1.6276 |  |
|
| R-3-Hydroxybutyric acid | 1.01E-02 | 0.225 | 1.8504 |  |
|
| Benzenepropanoic acid | 2.17E-02 | 0.343 | 1.6845 |  |
|
| 9-Hexadecenoic acid | 4.18E-02 | 0.369 | 2.2355 |  |
|
| Human Plasma | Retroretinol | 8.99E-03 | 0.079 | 1.6279 |  |
| 5á-Androst-1-en-17á-ol-3-one | 1.41E-02 | 0.079 | 1.5643 |  |
|
| Pregnenolone | 3.89E-02 | 0.117 | 1.155 |  |
|
| DHA | 2.68E-03 | 0.056 | 0.30321 |  |
|
| 11-Deoxycortisol | 1.80E-02 | 0.079 | 0.69897 |  |
|
| Epitestosterone | 1.88E-02 | 0.079 | 0.66572 |  |
|
| Corticosterone | 2.71E-02 | 0.095 | 0.49542 |  |
Discussion
Exposure of the heart to radiation leads to significant morbidity and mortality in survivors of cancer. The risk of cardiac events increases in a dose-dependent manner [21]. Elevated risk begins within the first few years and continues for decades after RT [22]. Current practices for diagnosis and prediction of patients at risk for RT related cardiac events are not yet developed. Commonly available testing such as echocardiogram and nuclear medicine studies are not used routinely and do not detect early cardiac structural and functional changes. CMR is ideal for assessing ventricular volume and function, but more uniquely, can visualize myocardium and can potentially detect early cardiac injury [23, 24]. However, it is impractical for routine screening of cardiac injury in large patient cohorts outside of clinical studies. Biomarker discovery and utilization is thus a critical unmet need in cardio-oncology according to practice guidelines published by the American Society of Clinical Oncology [25]. Moreover, with recent advances in therapy, patients with advanced disease are often candidates for curative therapy and experience extended survivals, thus requiring additional study into the acute and long-term adverse implications of therapy [2, 26].
We performed an exploratory study to investigate the utility of a molecular phenotyping approach for identification of biomarkers that correlate with tissue injury. We have previously reported on a study using a rat model that received fractionated doses of radiation (5x9 Gy) to the heart [9]. At 6 months after irradiation, changes in cardiac function coincided with adverse cardiac tissue remodeling as shown by increased cardiac collagen deposition, increased mast cell numbers and reduced microvascular density. In addition, mitochondria isolated from irradiated hearts showed reduced expression of electron transport chain complex II and an increased susceptibility to swelling. Plasma and left ventricular tissue obtained from these animals at 6 months after irradiation or sham treatment were used in the current study for characterization of metabolomic and lipidomic profiles. Our results suggest that lipid dysregulations as well as changes in sterol and vitamin E metabolism correlated well with cardiac injury in rat plasma while long-term changes in profiles of heart tissue indicated changes in arachidonic acid pathway suggestive of radiation induced tissue injury and fibrosis [27]. We also performed integrative pathway analysis of lipidomics and metabolomics data using Reactome software and found dysregulation of multiple pathways including ceramide signaling and synthesis of PS in rat plasma and heart respectively (Supplementary Tables 5-8).
We also performed metabolomic and lipidomic analyses of a cohort of esophageal cancer patients who received RT. Three of 11 patients developed reversible ischemia and/or myocardial fibrosis 3-5 months post RT in the mid and basal inferior and inferoseptal regions. Given that these changes occurred in the same anatomic region of the heart, it is likely that they are related to RT as opposed to other therapeutic or patient-related factors.
Qualitative changes were associated with significant increases in LVESV but no change in EF, consistent with early myocardial dysfunction. An increase in LVESV was not observed in the remaining 7 of 10 patients, and no structural cardiac changes were noted on post-RT CMR. LVESV has been shown to predict the future development of heart failure in patients with ischemic heart disease [28]. While we did not observe clinical symptoms of heart disease coinciding with increased LVESV, further follow up will be necessary to determine if these patients develop symptomatic cardiac. Notably, conventional serum biomarkers did not correlate with early structural changes. However, a six-metabolite panel assessed at 4 weeks post-RT was able to stratify patients with cardiac toxicity with >90% predictive accuracy.
Findings from our study, for the first time, help answer an important outstanding question in cardio-oncology: how can we utilize small molecule biomarkers either as standalone or in conjunction with other clinical measures, to identify sub-clinical cardiac remodeling and define cardio-oncology risk that would inform effective and safe management strategies? While our cohort included esophageal cancer patients, we believe the cardiac toxicities detailed herein are applicable to other patient populations receiving high dose thoracic RT. We believe this area of study is of significant interest to the scientific community since there are critical gaps in knowledge related to mechanisms of cardiac injury, clinical prediction, screening, prevention, and treatment.
The main limitations of this study include a small sample size, especially in the patient cohorts and lack of long-term patient follow up. However, the esophageal cancer patients received a relatively uniform treatment, and despite the small numbers, similar cardiac abnormalities were detected. Additionally, it is likely that biomarker profiles in the human subjects may have been altered by chemotherapy administered in addition to RT. Moreover, the rat study involved only male animals, and the human study did not have a large enough number of female patients to make a comparison between genders. The rats received a higher biological equivalent dose (BED) of radiation than the human subjects thus limiting extrapolation of results with those obtained from clinical samples. Although we demonstrated commonalities in the radiation response in the patient and animal cohorts, further validation is necessary to confirm these findings, given the inherent differences in the study populations and treatment regimens. Finally, metabolomics/lipidomics was performed at only one post-radiation time point in the rat study; future studies will utilize longitudinal sample collection for a systematic characterization of host response to radiation.
Our study, although exploratory, is among the first to provide information on the correlation between metabolomic changes and cardiac structural and functional alterations from RT before the appearance of clinical symptoms. Metabolomics of all “omics” approaches has several advantages as a novel translational approach to biomarker discovery due to its ability to perform high throughput, cost effective analysis of bio-fluids and hence has a “real” promise as a routine clinical test. Thus, data obtained from similar but larger scale clinical and analytical validation studies will help predict late effects of combined therapy. Such a test would have utility in identifying patients at risk prior to clinical manifestations of cardiac injury. Patients at risk may then be assigned to monitoring and potential early interventions to improve cardiac health. For instance, such an early detection and intervention strategy has been successfully employed in breast cancer patients treated with potentially cardiotoxic HER2 targeted therapies. These patients undergo frequent imaging surveillance and early intervention for treatment related cardiotoxicity, which have led to improved safety of HER2 targeted therapy [29]. While we cannot exclude that radiation-induced cardiac toxicity turns out irreversible, recent progress has been made in developing interventions in RIHD [30]. Thus, surveillance and monitoring with imaging and circulating biomarkers of cardiac injury has potential to reduce the burden of treatment related toxicity in a variety of cancer types.
Supplementary Material
Supplementary Table 1A. Tandem MS annotations for dysregulated metabolites in rat heart.
Supplementary Table 1B. Tandem MS annotations for dysregulated metabolites in rat plasma.
Supplementary Table 1C. Tandem MS annotations for dysregulated metabolites in plasma samples from the esophageal cancer patient cohort.
Supplementary Table 2 A. List of rat heart tissue metabolites and lipids showing significant change at 6 months after local heart irradiation.
Supplementary Table 2B. List of rat plasma metabolites and lipids showing significant change at 6 months after local heart irradiation.
Supplementary Table 3. Dysregulated metabolites in esophageal cancer patients who developed radiation induced cardiotoxicity at T2 and T3.
Supplementary Table 4. Dysregulated metabolites in esophageal cancer patients who developed radiation induced cardiotoxicity at T2 and T3.
Supplementary Table 5. Reactome multi omics pathway analysis for rat heart radiation effects.
Supplementary Table 6. Reactome multi omics pathway analysis for rat plasma radiation effects.
Supplementary Table 7. Reactome multi-omics pathway analysis for human plasma radiation effects in T2.
Supplementary Table 8. Reactome multi-omics pathway analysis for human plasma radiation effects in T3.
Supplementary Table 9. GC-MS validations of dysregulated metabolites in patient plasma at T2.
Highlights:
This study for the first time uses a metabolomics approach for the development of biomarkers predictive of Radiation-induced heart disease (RIHD) using a combination of rat model and clinical cohort study
Metabolic alterations in a rat model were compared to patient plasma profiles, assessing the overlap in radiation response
We developed a biomarker panel that is predictive of adverse cardiac function outcomes in patients who received RT for the treatment of esophageal cancer
Acknowledgments
This work was supported by CCSG Developmental funding LCCC-AWD413088 to KU and AKC and 1U01AI133561-01 funding from NIH/NIAID to MB and AKC. The authors would like to acknowledge the Metabolomics Shared Resource in Georgetown University (Washington, DC, USA) which is partially supported by NIH/NCI/CCSG grant P30-CA051008.
Footnotes
Competing interests
The author(s) declare no competing interests.
Data availability
The datasets generated and/or analyzed during the current study are available from the corresponding author on reasonable request.
Publisher's Disclaimer: This is a PDF file of an unedited manuscript that has been accepted for publication. As a service to our customers we are providing this early version of the manuscript. The manuscript will undergo copyediting, typesetting, and review of the resulting proof before it is published in its final form. Please note that during the production process errors may be discovered which could affect the content, and all legal disclaimers that apply to the journal pertain.
References:
- [1].Rustgi AK, El-Serag HB. Esophageal carcinoma. The New England journal of medicine. 2014;371:2499–509. [DOI] [PubMed] [Google Scholar]
- [2].Shapiro J, van Lanschot JJB, Hulshof M, van Hagen P, van Berge Henegouwen MI, Wijnhoven BPL, et al. Neoadjuvant chemoradiotherapy plus surgery versus surgery alone for oesophageal or junctional cancer (CROSS): long-term results of a randomised controlled trial. Lancet Oncol. 2015;16:1090–8. [DOI] [PubMed] [Google Scholar]
- [3].Beukema JC, van Luijk P, Widder J, Langendijk JA, Muijs CT. Is cardiac toxicity a relevant issue in the radiation treatment of esophageal cancer? Radiother Oncol. 2015;114:85–90. [DOI] [PubMed] [Google Scholar]
- [4].Taunk NK, Haffty BG, Kostis JB, Goyal S. Radiation-induced heart disease: pathologic abnormalities and putative mechanisms. Front Oncol. 2015;5:39-. [DOI] [PMC free article] [PubMed] [Google Scholar]
- [5].Sridharan V, Aykin-Burns N, Tripathi P, Krager KJ, Sharma SK, Moros EG, et al. Radiation-induced alterations in mitochondria of the rat heart. Radiat Res. 2014;181:324–34. [DOI] [PMC free article] [PubMed] [Google Scholar]
- [6].Wurtz P, Havulinna AS, Soininen P, Tynkkynen T, Prieto-Merino D, Tillin T, et al. Metabolite profiling and cardiovascular event risk: a prospective study of 3 population-based cohorts. Circulation. 2015;131:774–85. [DOI] [PMC free article] [PubMed] [Google Scholar]
- [7].Rankin NJ, Preiss D, Welsh P, Burgess KE, Nelson SM, Lawlor DA, et al. The emergence of proton nuclear magnetic resonance metabolomics in the cardiovascular arena as viewed from a clinical perspective. Atherosclerosis. 2014;237:287–300. [DOI] [PMC free article] [PubMed] [Google Scholar]
- [8].Fischer K, Kettunen J, Wurtz P, Haller T, Havulinna AS, Kangas AJ, et al. Biomarker profiling by nuclear magnetic resonance spectroscopy for the prediction of all-cause mortality: an observational study of 17,345 persons. PLoS Med. 2014;11:e1001606. [DOI] [PMC free article] [PubMed] [Google Scholar]
- [9].Sridharan V, Seawright JW, Antonawich FJ, Garnett M, Cao M, Singh P, et al. Late Administration of a Palladium Lipoic Acid Complex (POLY-MVA) Modifies Cardiac Mitochondria but Not Functional or Structural Manifestations of Radiation-Induced Heart Disease in a Rat Model. Radiat Res. 2017;187:361–6. [DOI] [PMC free article] [PubMed] [Google Scholar]
- [10].Prince JT, Marcotte EM. Chromatographic alignment of ESI-LC-MS proteomics data sets by ordered bijective interpolated warping. Anal Chem. 2006;78:6140–52. [DOI] [PubMed] [Google Scholar]
- [11].Libiseller G, Dvorzak M, Kleb U, Gander E, Eisenberg T, Madeo F, et al. IPO: a tool for automated optimization of XCMS parameters. BMC Bioinformatics. 2015;16:118. [DOI] [PMC free article] [PubMed] [Google Scholar]
- [12].Fabregat A, Jupe S, Matthews L, Sidiropoulos K, Gillespie M, Garapati P, et al. The Reactome Pathway Knowledgebase. Nucleic Acids Res. 2018;46:D649–D55. [DOI] [PMC free article] [PubMed] [Google Scholar]
- [13].Zou H, Hastie T. Regularization and variable selection via the elastic net (vol B 67, pg 301, 2005). J R Stat Soc B. 2005;67:768-. [Google Scholar]
- [14].Pavlou M, Ambler G, Seaman SR, Guttmann O, Elliott P, King M, et al. How to develop a more accurate risk prediction model when there are few events. BMJ. 2015;351:h3868. [DOI] [PMC free article] [PubMed] [Google Scholar]
- [15].Sansbury BE, DeMartino AM, Xie Z, Brooks AC, Brainard RE, Watson LJ, et al. Metabolomic analysis of pressure-overloaded and infarcted mouse hearts. Circ Heart Fail. 2014;7:634–42. [DOI] [PMC free article] [PubMed] [Google Scholar]
- [16].Syme C, Czajkowski S, Shin J, Abrahamowicz M, Leonard G, Perron M, et al. Glycerophosphocholine Metabolites and Cardiovascular Disease Risk Factors in Adolescents: A Cohort Study. Circulation. 2016;134:1629–36. [DOI] [PubMed] [Google Scholar]
- [17].Calder PC. Omega-3 fatty acids and inflammatory processes. Nutrients. 2010;2:355–74. [DOI] [PMC free article] [PubMed] [Google Scholar]
- [18].Li S, Park Y, Duraisingham S, Strobel FH, Khan N, Soltow QA, et al. Predicting network activity from high throughput metabolomics. PLoS Comput Biol. 2013;9:e1003123. [DOI] [PMC free article] [PubMed] [Google Scholar]
- [19].Gomez-Sanchez EP. Mineralocorticoid receptors in the brain and cardiovascular regulation: minority rule? Trends Endocrinol Metab. 2011;22:179–87. [DOI] [PMC free article] [PubMed] [Google Scholar]
- [20].Michalowski AS. On radiation damage to normal tissues and its treatment. II. Anti-inflammatory drugs. Acta Oncol. 1994;33:139–57. [DOI] [PubMed] [Google Scholar]
- [21].Darby SC, Ewertz M, McGale P, Bennet AM, Blom-Goldman U, Bronnum D, et al. Risk of ischemic heart disease in women after radiotherapy for breast cancer. The New England journal of medicine. 2013;368:987–98. [DOI] [PubMed] [Google Scholar]
- [22].Yusuf SW, Venkatesulu BP, Mahadevan LS, Krishnan S. Radiation-Induced Cardiovascular Disease: A Clinical Perspective. Front Cardiovasc Med. 2017;4:66. [DOI] [PMC free article] [PubMed] [Google Scholar]
- [23].Chun SG, Hu C, Choy H, Komaki RU, Timmerman RD, Schild SE, et al. Impact of Intensity-Modulated Radiation Therapy Technique for Locally Advanced Non-Small-Cell Lung Cancer: A Secondary Analysis of the NRG Oncology RTOG 0617 Randomized Clinical Trial. J Clin Oncol. 2017;35:56–62. [DOI] [PMC free article] [PubMed] [Google Scholar]
- [24].Thavendiranathan P, Wintersperger BJ, Flamm SD, Marwick TH. Cardiac MRI in the assessment of cardiac injury and toxicity from cancer chemotherapy: a systematic review. Circ Cardiovasc Imaging. 2013;6:1080–91. [DOI] [PubMed] [Google Scholar]
- [25].Armenian SH, Lacchetti C, Barac A, Carver J, Constine LS, Denduluri N, et al. Prevention and Monitoring of Cardiac Dysfunction in Survivors of Adult Cancers: American Society of Clinical Oncology Clinical Practice Guideline. J Clin Oncol. 2017;35:893–911. [DOI] [PubMed] [Google Scholar]
- [26].Denton E, Conron M. Improving outcomes in lung cancer: the value of the multidisciplinary health care team. J Multidiscip Healthc. 2016;9:137–44. [DOI] [PMC free article] [PubMed] [Google Scholar]
- [27].Levick SP, Loch DC, Taylor SM, Janicki JS. Arachidonic Acid Metabolism as a Potential Mediator of Cardiac Fibrosis Associated with Inflammation. The Journal of Immunology. 2007;178:641. [DOI] [PubMed] [Google Scholar]
- [28].White HD, Norris RM, Brown MA, Brandt PW, Whitlock RM, Wild CJ. Left ventricular end-systolic volume as the major determinant of survival after recovery from myocardial infarction. Circulation. 1987;76:44–51. [DOI] [PubMed] [Google Scholar]
- [29].Barish R, Lynce F, Unger K, Barac A. Management of Cardiovascular Disease in Women With Breast Cancer. Circulation. 2019;139:1110–20. [DOI] [PubMed] [Google Scholar]
- [30].van der Veen SJ, Ghobadi G, de Boer RA, Faber H, Cannon MV, Nagle PW, et al. ACE inhibition attenuates radiation-induced cardiopulmonary damage. Radiother Oncol. 2015;114:96–103. [DOI] [PubMed] [Google Scholar]
Associated Data
This section collects any data citations, data availability statements, or supplementary materials included in this article.
Supplementary Materials
Supplementary Table 1A. Tandem MS annotations for dysregulated metabolites in rat heart.
Supplementary Table 1B. Tandem MS annotations for dysregulated metabolites in rat plasma.
Supplementary Table 1C. Tandem MS annotations for dysregulated metabolites in plasma samples from the esophageal cancer patient cohort.
Supplementary Table 2 A. List of rat heart tissue metabolites and lipids showing significant change at 6 months after local heart irradiation.
Supplementary Table 2B. List of rat plasma metabolites and lipids showing significant change at 6 months after local heart irradiation.
Supplementary Table 3. Dysregulated metabolites in esophageal cancer patients who developed radiation induced cardiotoxicity at T2 and T3.
Supplementary Table 4. Dysregulated metabolites in esophageal cancer patients who developed radiation induced cardiotoxicity at T2 and T3.
Supplementary Table 5. Reactome multi omics pathway analysis for rat heart radiation effects.
Supplementary Table 6. Reactome multi omics pathway analysis for rat plasma radiation effects.
Supplementary Table 7. Reactome multi-omics pathway analysis for human plasma radiation effects in T2.
Supplementary Table 8. Reactome multi-omics pathway analysis for human plasma radiation effects in T3.
Supplementary Table 9. GC-MS validations of dysregulated metabolites in patient plasma at T2.


