Abstract
The knee menisci are comprised of two orthogonal collagenous networks – circumferential and radial – that combine to enable efficient load bearing by the tissue in adults. Here, we assessed how the structural and functional characteristics of these networks developed over the course of skeletal maturation and determined the role of these fiber networks in defect tolerance with tissue injury. Imaging of the radial tie fiber (RTF) collagen structure in medial bovine menisci from fetal, juvenile, and adult specimens showed increasing heterogeneity, anisotropy, thickness, and density with skeletal development. Mechanical analysis showed that the tensile modulus in the radial direction did not change with skeletal development, though the resilience (in the radial direction) increased and the tolerance to defects in the circumferential direction decreased, in adult compared to fetal tissues. This loss of defect tolerance correlated with increased order in the RTF network in adult tissue. These data provide new insights into the role of the radial fiber network in meniscus function, will lead to improved clinical decision-making in the presence of a tear, and may improve engineering efforts to reproduce this critical load-bearing structure in the knee.
Keywords: meniscus, matrix proteins
INTRODUCTION
The menisci are semi-lunar shaped fibrocartilaginous wedges located between the femur and the tibial plateau that enable efficient mechanical function of the knee joint1-3. Because of its unique wedge shape, a portion of the forces transmitted from the femur are re-directed radially through the meniscus. To resist these loads, the meniscus has a well-developed circumferential collagen fiber bundle network3-6, which results in a high tensile modulus (ranging from 50-250 MPa) in the circumferential direction7. In addition to these circumferential collagen bundles, the meniscus also contains a sub-population of collagen-rich radial tie fibers (RTFs). This RTF network originates at the meniscus periphery and extends arboreally throughout, interdigitating with and surrounding the circumferential fiber network as discrete fibers and/or sheets1,3,5,8,9. Comprised of types I, II, and VI collagen1, RTFs have different properties and density5,8,10 based on location, and contribute to location dependent radial tensile properties of the meniscus (which ranges from 5-70 MPa)5,11.
RTFs are an integral part of the meniscus and are thought to bind circumferential fiber bundles together and prevent their longitudinal splitting5,12,13. This likely contributes to the normal functioning of the tissue (holding collagen bundles together under compressive loading) and may play a role in the context of injury as well. For instance, one recent study reported that a partial-width radial tear had little effect on load transfer across the joint, despite the severing of a substantial portion of the circumferential collagen bundles14. This suggests that menisci may have a built-in tolerance to interruption of circumferential fibers, which might be mediated by the RTF network. Indeed, we recently showed, in a biomaterial model, that the introduction of a disorganized fiber element in an otherwise aligned network could restore strain transfer close to focal defects that interrupted the aligned fiber network15. It is possible that the RTF network of the knee meniscus plays a similar role.
Despite the potentially important roles that the RTF network may play in the knee meniscus, the origin and remodeling of this network has not been studied as a function of tissue maturation. Moreover, the contribution of the RTF network to meniscus function in the context of interruption of the circumferential fiber network has not been directly investigated. We used bovine meniscus to address these questions. First, we used second harmonic generation (SHG) imaging8,16,17 to quantify RTF network density and spatial attributes (size, organization) with respect to postnatal maturation stage and anatomic location. Second, we measured circumferential and radial tensile properties of the meniscus, as well as change in properties when circumferential collagen bundles were severed to assess defect tolerance across maturational stages. Our findings show a dramatic structural reorganization of the RTF network through post-natal maturation and identify functional contributions of the RTF network that increase tolerance to local interruption of circumferential fiber bundles. Together, these data provide new insights into the role of the RTF network in meniscus function, will lead to improved clinical decision-making in the presence of meniscus tears, and may improve engineering efforts to reproduce this critical load-bearing structure in the knee.
METHODS
Menisci collection and sample preparation – structural assays
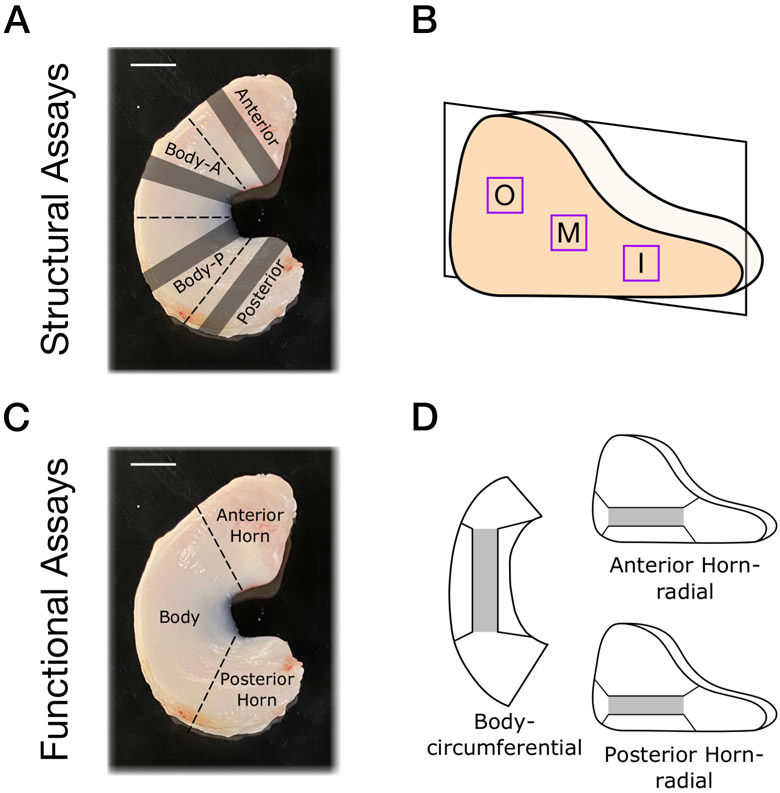
Medial menisci (n=6/age) were harvested from fetal (mid-gestation, 2nd and 3rd trimester), juvenile (14 days) and adult (skeletally mature, 20-30 months) cows of both sexes. Multiple donors were used to verify that observed characteristics were consistent across the donor pool. Menisci were stored in 1x Phosphate Buffered Saline (Sigma-Aldrich, St. Louis, MO) at −20 °C until subsequent sectioning and imaging. Prior to sectioning, fetal menisci were bisected into anterior and posterior regions. Juvenile and adult menisci were divided into four equal regions: anterior horn, anterior body (Body-A), posterior body (Body-P), and posterior horn (Figure 1A). Each region was then embedded in Optimal Cutting Temperature (OCT) media and cryosectioned into 10 μm and 35 μm thick radial sections (n=10/region) using a cryostat (model HM500, Microm International GmbH, Waldorf, Germany). Sections were fixed in 4% paraformaldehyde overnight. For each cross section, three zones of interest were examined at high magnification: the outer (O), middle (M), and inner (I) zones (Figure 1B). Slides were used for both histological and SHG analysis.
Figure 1 –
(A) Illustration of meniscal regions for structural analysis superimposed on a healthy juvenile bovine meniscus with dashed lines indicating location of scalpel cut and shaded regions indicating areas of sectioning for histological and second harmonic generation analysis. (B) Outer (O) middle (M) and inner (I) zones in the sectioning and imaging plane. (C) Illustration of meniscal regions for functional assays superimposed on a juvenile bovine meniscus. (D) Schematic of circumferential body sections and radial horn sections used for testing (grey denotes gauge region, black lines indicate dogbone shape). Scale bar = 1 cm
Histological staining and analysis
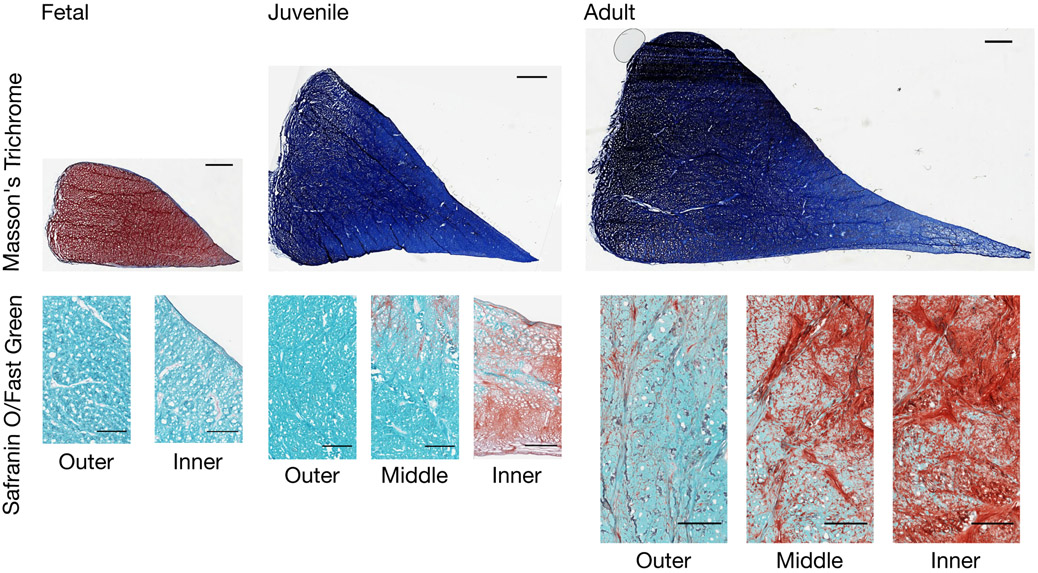
Cryosectioned 10 μm thickness radial meniscal sections were stained with 0.2% Safranin O (Sigma-Aldrich, St. Louis, MO) and 0.02% Fast Green (Thermo Fisher Scientific, Waltham, MA) to visualize proteoglycans and fibrous tissue, respectively. Additionally, sections were stained with Masson’s Trichrome stain (Polysciences Inc., Warrington, PA) to visualize collagen (Figure 2). Sections were imaged on a digital slide scanner (Aperio, Leica Biosystems, Wetzlar, Germany).
Figure 2 –
Histological staining of fetal, juvenile, and adult bovine medial menisci. Top row: Masson's Trichrome (red: cytoplasm, blue: collagen) staining of posterior horn sections, Scale bar = 2 mm. Bottom row: Safranin O/Fast Green (red: proteoglycans, green: fibrous tissues) staining of anterior horn sections in specific zones (outer-inner), Scale bar = 500 μm.
Second Harmonic Generation (SHG) imaging
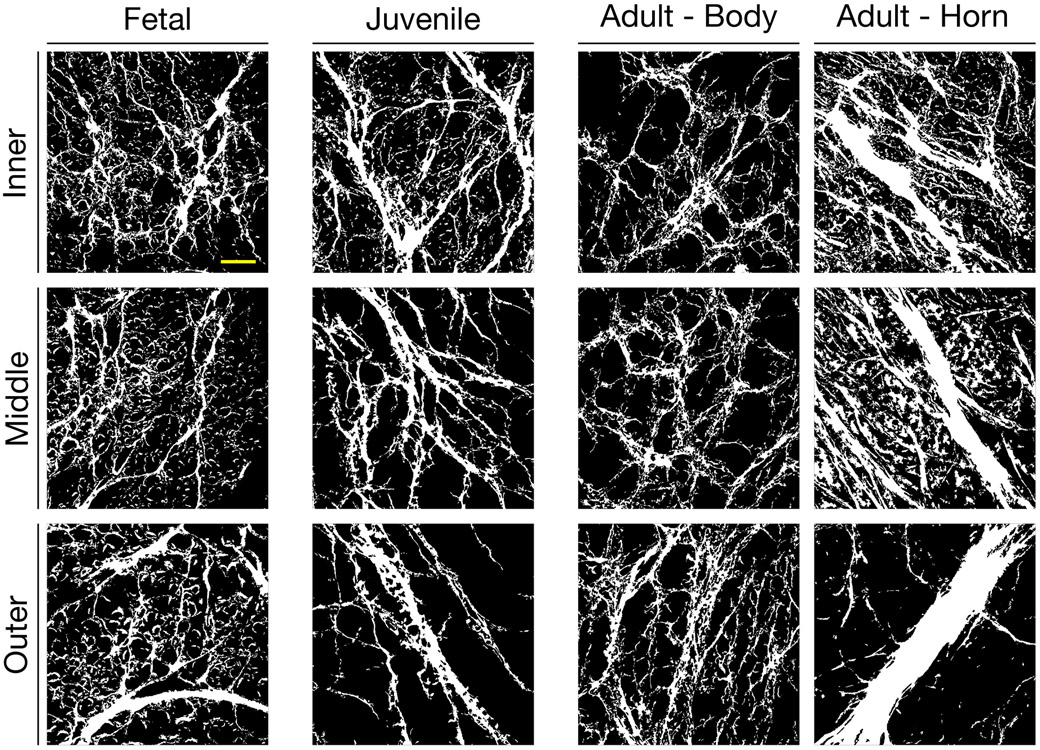
Second Harmonic Generation (SHG) imaging was performed to visualize fibrillar collagen in 35 μm thick radial sections. Images (1272.8 × 1272.8 × 2.6 μm), were captured at 10x magnification with a multi-photon microscope at an excitation wavelength of 840 nm (model: LSM 510 NLO/META, Carl Zeiss MicroImaging, Inc., Thornwood, NY; Ti:Sapphire Chameleon Laser) to visualize radial tie fiber networks in unstained radial sections (Figure 3). Maximum projections spanning 28.6 ± 5.2 μm of the tissue depth were generated in each zone and region.
Figure 3 –
Representative thresholded images of radial fibers in fetal, juvenile, adult body, and adult horn tissues across inner, middle, and outer zones. Images in each column are from the same section and adult images are from the same tissue, though different regions. The left side of each image corresponds with the outermost meniscus region shown, while the right side of each image correspond with the innermost region of the meniscus. Scale bar = 200 μm.
SHG image analysis – areal density
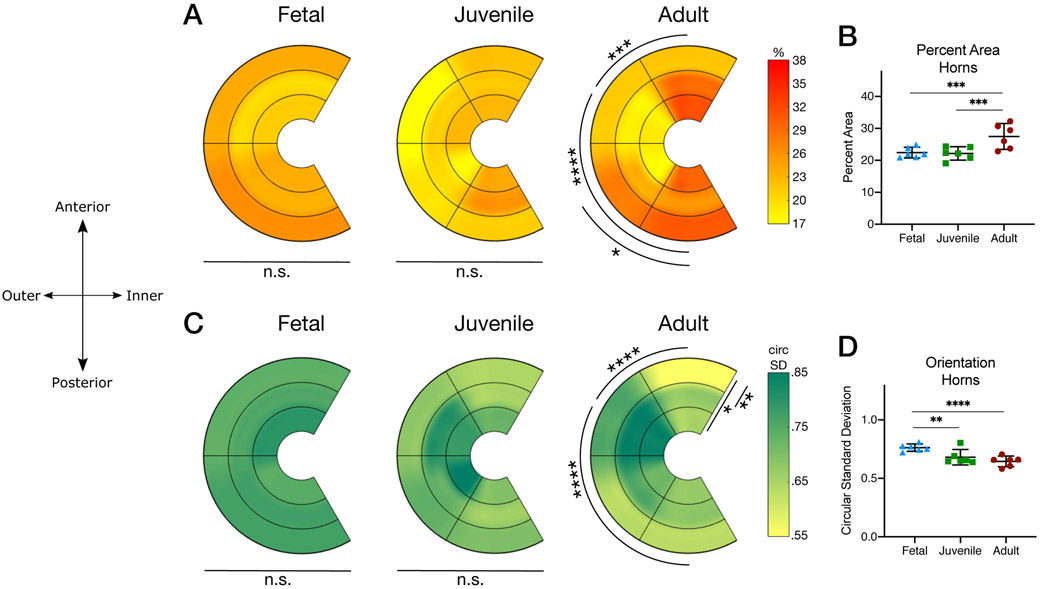
To determine areal density, maximum projections were filtered using a custom macro employing the Integral Image Filter (IIF) prior to analysis (ImageJ / FIJI, open source). Images underwent grayscale morphology dilation prior to binarization, despeckling, and filling in to enhance contrast and reduce noise. The areal density of each image was defined as the area fraction with positive SHG signal computed using the native FIJI Analyze Particle toolbar, with no limits on pixel size or circularity. Data are reported as the mean value and standard deviation and presented graphically as the mean value in each A-P region and inner-outer zone (Figure 4A) and as scatter dot plots (mean ± 95% confidence interval) of the pooled anterior and posterior horns (Figure 4B).
Figure 4 –
(A) Graphical representations of the percent areal density of radial fibers. Data shown for fetal, juvenile, and adult tissues in each region and zone of interest. Significance denoted within each developmental age group for differences with respect to anterior–posterior region and inner–outer zone. (B) Scatter dot plots indicating areal density of radial fiber network (averaged for all zones and regions for each biological sample; anterior and posterior horns only) in fetal, juvenile, and adult tissues. (C) Graphical representations of the circular standard deviation (larger numbers correspond to increased isotropy). Data shown for fetal, juvenile, and adult tissues in each region and zone of interest. Significance denoted within developmental age groups for differences with respect to anterior–posterior region and inner–outer zone. (D) Scatter dot plots indicating circular standard deviation of radial fiber network (averaged for all zones and regions for each biological sample; anterior and posterior horns only) in fetal, juvenile, and adult tissues. (mean ± 95% confidence interval,* = p<0.05, ** = p<0.01, *** = p<0.001, **** = p<0.0001, n=6/group*region*zone).
SHG image analysis – network isotropy
RTF fiber anisotropy was assessed from SHG images using the native Directionality plugin, with bounds at 0 and 180 degrees. Angular data were exported into MATLAB and the circular standard deviation of each sample was calculated using the CircStat package18 as a proxy for the measurement of circular spread, such that a value of 0 represents a highly aligned (anisotropic) data set while a value of infinity would indicate random orientations (isotropy). Data are reported as the mean value and standard deviation and are presented graphically as the mean value in each A-P region and inner-outer zone (Figure 4C) and as scatter dot plots (mean ± 95% confidence interval) of the pooled anterior and posterior horns (Figure 4D).
SHG image analysis – fiber thickness distribution
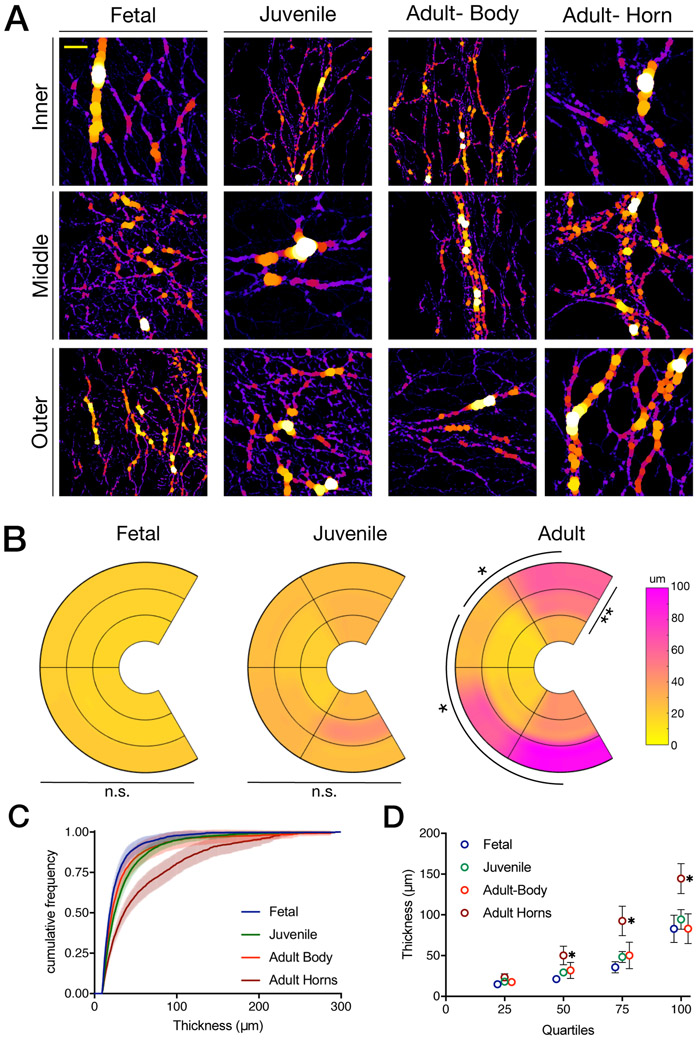
RTF fiber thickness was calculated from SHG images using the FIJI plugin BoneJ19, which fits spheres to each location in an image that exhibits positive signal (Figure 5A). In addition to the mean and maximum thickness of the fit spheres, a custom FIJI macro was used to determine the distribution of fiber thickness in each image, using a 10 μm minimum and 300 μm maximum threshold for fit sphere diameters. Distributions were exported into R and both quartile and cumulative density frequency graphs were generated for all groups. Data are presented graphically as the mean value in each A-P region and inner-outer zone (Figure 5B), cumulative density frequency plots with error bars (mean ± 95% confidence interval) and as quartiles (mean ± 95% confidence interval) (Figure 5C,D).
Figure 5 –
(A) Representative images of thickness mapping in fetal, juvenile, adult body, and adult horn tissues across inner, middle, and outer zones, with thicker elements shown in white and yellow and thinner elements shown in purple. The left side of each image corresponds with the outermost meniscus region shown, while the right side of each image correspond with the innermost region of the meniscus. (B) Graphical representations of the mean fiber thickness of radial fibers. Data shown for fetal, juvenile, and adult tissues in each region and zone of interest. Significance denoted within each developmental age group for differences with respect to anterior–posterior region and inner–outer zone. (C) Quantified cumulative frequency density plots of pooled fiber thickness in fetal, juvenile, adult body, and adult horn tissues. Plots shown with standard error bars (lighter hue). (D) Quartile measurements of fiber thickness in fetal, juvenile, adult horn, and adult body pooled regions. Error bars shown if large enough to be visible. (mean ± 95% confidence interval, * = p<0.01, n=6/group*region*zone). Scale bar = 200 μm.
Menisci collection and sample preparation – functional assays
Medial menisci (n=8-14/age) were harvested from fetal (mid-gestation, 2nd and 3rd trimester), juvenile (14 days) and adult (skeletally mature, 20-30 months) cows of both sexes. Multiple donors were used to verify that observed characteristics were consistent across donors. Menisci were cut at the junction of the anterior and posterior horns and body to produced three segments (Figure 1C). Segments were stored in 1x Phosphate Buffered Saline at −20 °C until subsequent sectioning and testing. The horn regions were cryosectioned to 350 μm thick radial sections spanning the entirety of the meniscal cross section, yielding one or two samples per region with identifiable tibial and femoral sides (Figure 6A). The body region was embedded in OCT media and cryosectioned to 350 μm thick circumferential sections from the middle third of the tissue of the tissue, yielding two to four sections. Sections had a uniform thickness with visible circumferential fibers (Figure 7A). In both directions, a thickness of 350 μm was chosen so as to obtain more than one section per donor and to improve sample gripping within clamps. Each of these multiple sections was treated as a separate sample given that inter-meniscus variability is similar to intra-meniscus variability20. All samples were stored in 1x Phosphate Buffered Saline for 24-48 hours at 4 °C prior to testing. Immediately prior to testing, sections were further trimmed to a dogbone shape21. All samples were measured using a custom, laser based measurement device to determine cross sectional area prior to testing22.
Figure 6 –
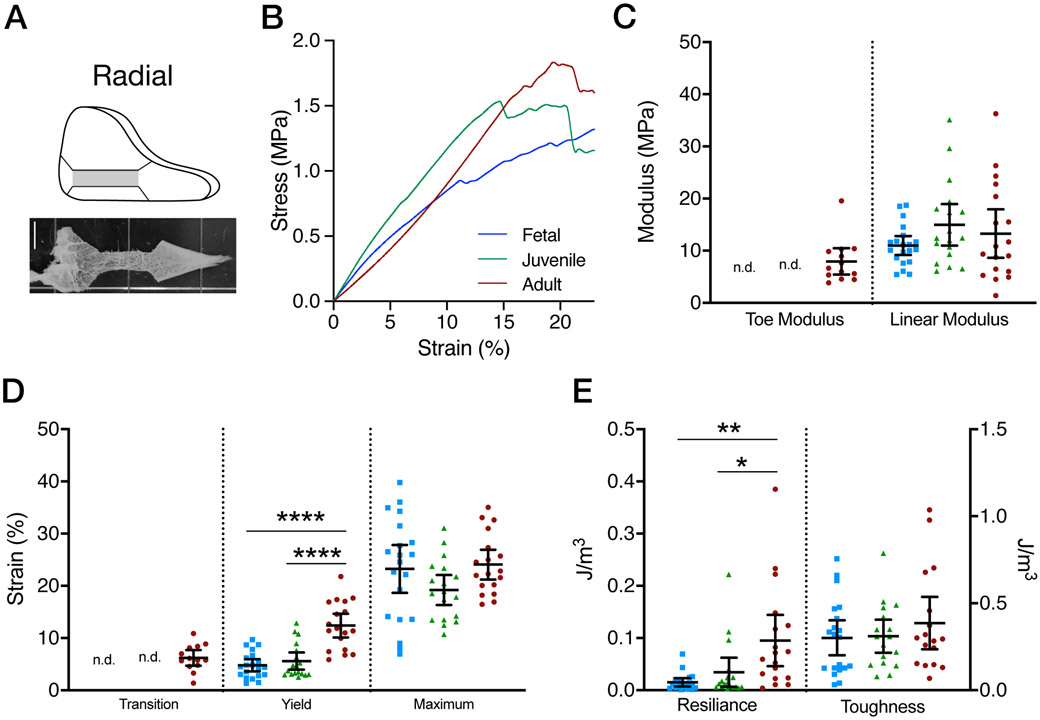
(A) Schematic of radial sections from which specimens were cut for testing and example image of radially oriented tensile testing sample. (B) Average stress-strain curves for Fetal, Juvenile, and Adult specimens. (C) Toe and Linear moduli for fetal, juvenile, and adult tissues when radially tested. (D) Transition, yield, and maximum strains for fetal, juvenile, and adult tissues when radially tested. (E) Resilience and toughness for fetal, juvenile, and adult tissues when radially tested. All data presented as mean and 95% confidence interval. (mean ± 95% confidence interval,* = p<0.05, ** = p<0.01, **** = p<0.0001, n=16-20/age)
Figure 7 –
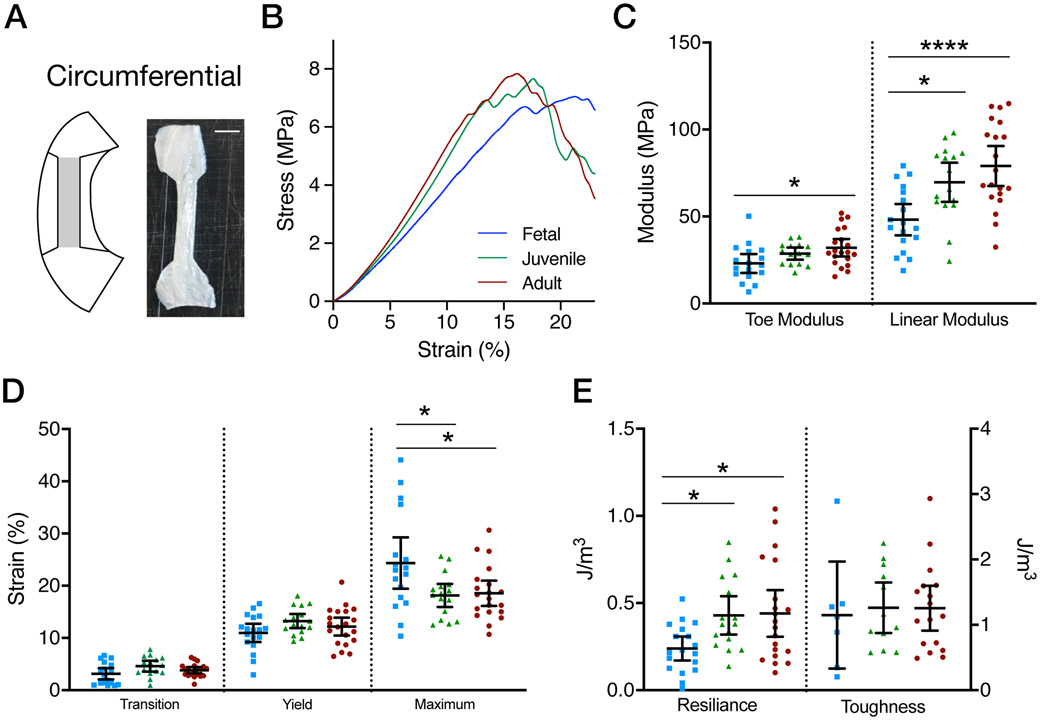
(A) Schematic of circumferential sections from which specimens were cut for testing and example image of circumferentially oriented tensile testing sample. (B) Average stress-strain curves for Fetal, Juvenile, and Adult specimens. (C) Toe and Linear moduli for fetal, juvenile, and adult tissues when radially tested. (D) Transition, yield, and maximum strains for fetal, juvenile, and adult tissues when radially tested. (E) Resilience and toughness for fetal, juvenile, and adult tissues when radially tested. All data presented as mean and 95% confidence interval. (mean ± 95% confidence interval,* = p<0.05, *** = p<0.0001, n=16-20/age)
Mechanical testing of radial samples
At least one sample from each donor (n=16-20/age) was tested in the radial direction. Tensile testing was carried out on an electromechanical testing system (Instron 5848, Instron, Canton, MA) outfitted with a PBS bath to ensure tissue hydration. Samples were mounted into serrated grips, preloaded to 0.25 N, and underwent 10 cycles of preconditioning (0.5%−2%) followed by a ten minute rest. Samples were then ramped to failure in tension at a rate of 0.1%/s. The transition point and linear modulus were calculated via a smooth exponential-linear function fitted to the stress-strain curve23-25 to define the toe and linear moduli of the specimens (Figure 6B, 7B). The yield point was defined as the divergence of the stress-strain curve from a linear fit (r ≤ 0.97). Resilience was calculated as the integral of the stress-strain function until the yield point. Toughness was calculated as the integral of the stress-strain function until material failure. Data are reported as the mean value with 95% confidence intervals (Figure 6C-E).
Mechanical testing of circumferential samples
Tensile testing was carried out in the body in the circumferential direction with the same parameters as above, though the initial preload was 0.5 N. Toe and linear modulus, as well as transition, yield, and maximum strains were calculated as above. Data are reported as the mean value with 95% confidence intervals (Figure 7C-E). To evaluate loss of functional properties in the presence of a radial meniscal tear, at least one sample from each donor (n=16-20/age) was tested intact, while at least one other sample received a 50% radial notch defect26 (Figure 8). The notch defect was created on the meniscus’ anatomical inner side in the sample. Toe and linear moduli, as well as transition and yield strains, were calculated as above, using the original cross-sectional area of the sample (that is, disregarding the notch defect). Intact and defect linear moduli are presented as mean ± 95% confidence interval. Change in properties due to the defect was calculated relative to the average mechanical properties of each age (change = [defect specimen − intact mean for specimen’s age] / intact mean for specimen’s age), given that inter-meniscus variability is similar to intra-meniscus variability for sections such as these20. Immediately following testing, a subset (n = 4, fetal; n = 7, juvenile; n = 7, adult), pooled for correlative analysis) of notch defected samples were embedded in OCT, cryosectioned to 35 μm thickness in the radial plane (within 3 mm of the defect) and SHG image analysis was used to quantify the local RTF network.
Figure 8 –
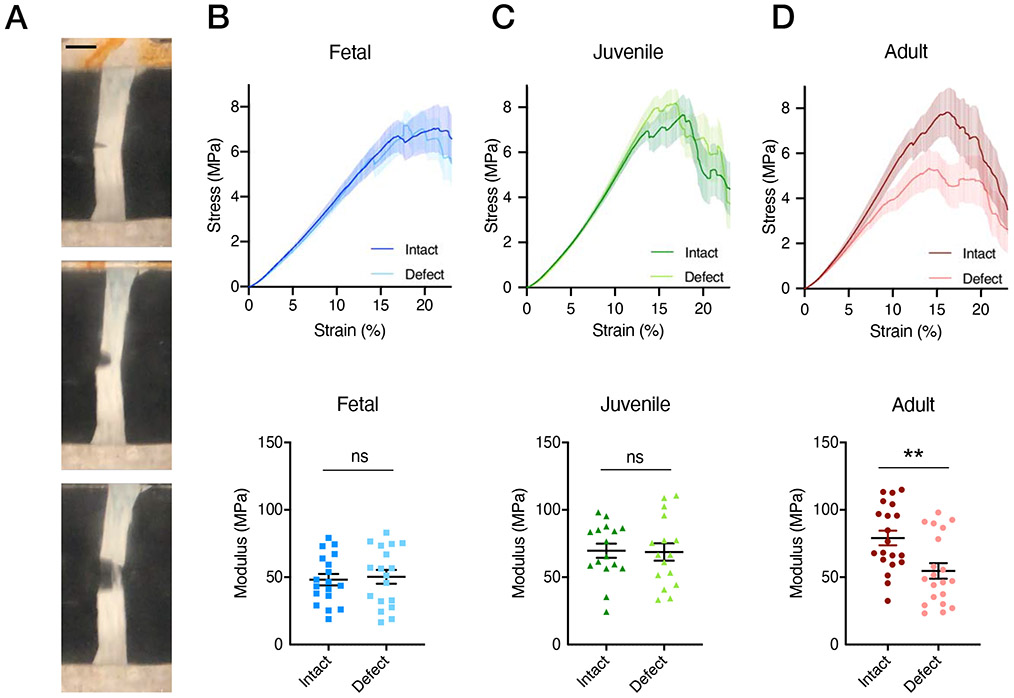
(A) Representative circumferentially oriented tensile test of a notch defect specimen (A, scale bar = 4 mm) and average stress-strain curves for each developmental state (B-C) in intact and notch-defect conditions (mean ± SEM) and corresponding linear moduli in intact and defect conditions (mean ± 95% confidence interval, ** = p<0.01, n=16-20/age). Stress and moduli were calculated using original cross-sectional area.
Statistical methods
RTF structural properties (fiber area fraction and circular standard deviation) were compared across regions, zones, and maturational states using 3-way and 2-way ANOVAs where applicable, with Tukey’s HSD post-hoc tests (R, open source). Properties were additionally compared across developmental states by pooling all data from anterior and posterior horns using 1-way ANOVA with Tukey’s HSD post-hoc tests or Kruskal-Wallis test with Dunn’s post hoc testing for non-normal data sets (Graphpad Prism) since anterior and posterior horns were assessed at each age. Quartiles were used as proxy measurements for thickness distributions and compared across regions, zones, and maturational states using 3-way and 2-way ANOVAs where applicable, with Tukey’s HSD post-hoc tests (R, open source). Functional properties in radial and circumferential testing directions were compared across maturational states using 1-way ANOVAs with Tukey’s HSD post-hoc tests (Graphpad Prism). Paired t-tests were performed to assess differences between toe and linear moduli in each maturational state. Unpaired t-tests were performed to assess differences between circumferential intact and defected samples for a given maturational state. Spearman’s correlations (Figure 9) were performed to determine if a correlation exists between RTF structural attributes (structure) and a change in mechanical properties (function).
Figure 9 –
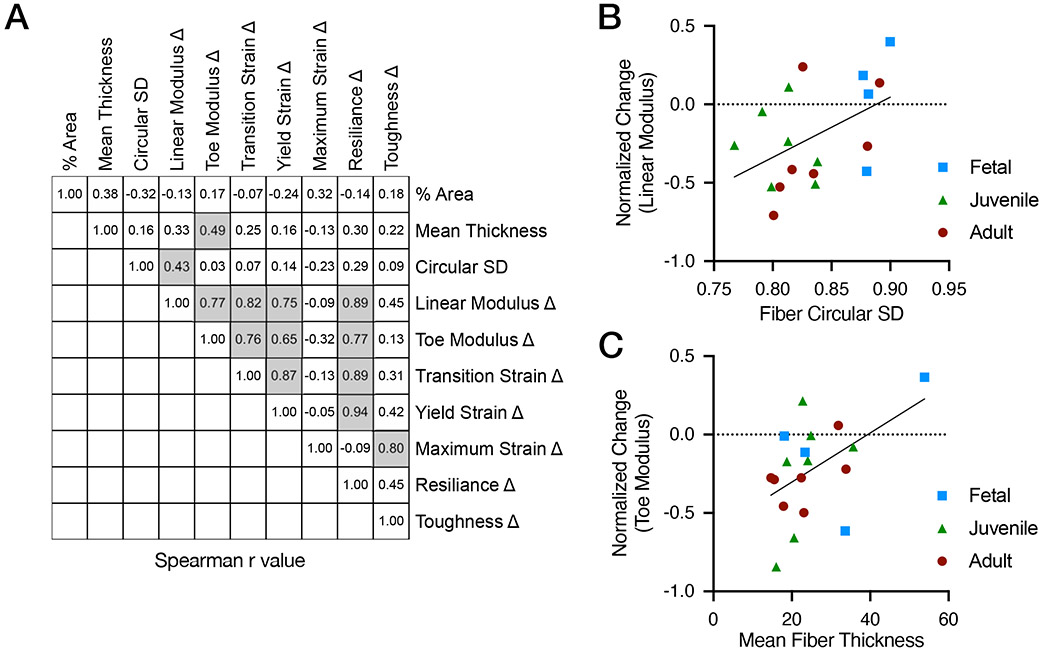
(A) Spearman’s correlations of structural and functional metrics with significant correlations highlighted with grey boxes. (B) Correlation of linear modulus change and fiber circular standard deviation and (C) correlation of toe modulus change and mean fiber thickness. Modulus change is change due to introduction of the notch (n = 4, fetal; n = 7, juvenile; n = 7, adult), pooled for correlative analysis).
RESULTS
Structural attributes of the maturing RTF network
We first investigated the structural features of the meniscus as a function of maturation. As expected, menisci increased in size as a function of age (Figure 2, top row). Safranin O staining showed increased proteoglycan content from the inner to the outer zone with increasing age (Figure 2, bottom row).
SHG imaging of radial sections showed marked qualitative differences in radial fiber area, thickness, and orientation across regions (anterior – posterior), zones (inner – outer) and maturation (Figure 3). Specifically, RTF area ranged from 8.4% (Juvenile, Body-A, inner) to 42.9% (Adult, Posterior, outer), with both donor age and region being significant factors (p=0.0034 and p<0.0001). Within a given maturational stage, both fetal and juvenile menisci showed no differences as a function of A–P region (Anterior Horn, Body-A, Body-P, Posterior Horn regions; p=0.14 and p=0.14 respectively) or within inner–outer zone (inner, middle, outer zones; p=0.33 and p=0.37 respectively). Conversely, adult menisci showed significant differences in RTF fiber area by A-P region (p<0.0001), though not with respect to inner-outer zone (p=0.71). In adult menisci, the body regions showed lower RTF area than the anterior or posterior horns, with the Body-A region being lower than the anterior and posterior (p<0.001) horns, and Body-P region less than the posterior (p=0.019) horn (Figure 4A). When analyzing horns specifically, adult menisci (27.5±3.9%) had significantly greater RTF area vs. fetal (22.4±1.6%) and juvenile (22.1±2.0%) menisci (p<0.001). Fetal and juvenile menisci had RTF area similar to one another regardless of location (p=0.97, Figure 4B).
Along with a change in fiber areal density, the organization of RTFs changed with post-natal maturation. Specifically, the RTF circular standard deviation (CSD) ranged from 1.01 (juvenile, Body-P, middle zone) to 0.39 (adult, anterior horn, outer zone) with age, inner-outer zone, and A-P region being significant factors (p=0.02, p=0.004, and p<0.0001, respectively). Within donor ages, fetal menisci showed no differences across A-P regions (p=0.93) or inner-outer zone (p=0.88). Juvenile menisci showed differences in CSD by A-P region (p=0.032) but not with respect to inner-outer zone (p=0.09). Adult tissues showed significant differences in CSD by A-P region (p<0.0001) and with respect to inner-outer zones (p=0.008). In adult tissues, the Body-A region had a higher CSD than all other regions (anterior horn: p<0.0001, posterior body: p=0.023 and posterior horn: p<0.001). Additionally, the outer zone in adult tissues had a decreased CSD (indicating more organization) compared to inner and middle zones (p=0.037 and p=0.001, respectively, Figure 4C). When analyzing horns specifically, fetal meniscal horns (0.76±.030) were significantly different from both juvenile (0.68±0.06) and adult (0.65±0.04; p=0.005, p<0.0001) whereas the CSD of adult and juvenile meniscal horns were similar to one another (p=0.33, Figure 4D).
In addition to changes in density and organization, thickness of RTF elements also changed with age. Fetal and juvenile menisci showed no differences in RTF thickness with respect to A-P region or inner-outer zones across all quartiles (p>0.31 and p>0.21, respectively) and therefore, all A-P regions and inner-outer zones were pooled for further analysis. Adult menisci, however, did show significant differences in RTF thickness with respect to both A-P regions (p=0.004) and inner-outer zones (p=0.003). Specifically, the outer zone in adult tissues had a thicker average fiber size compared to the inner zone (p=0.005), and the Body-A region showed thinner fiber thickness compared to both the anterior and posterior horns in adults (p<0.19, Figure 5B). Adult tissues were split into two groups – adult-horn (anterior and posterior horns) and adult-body (Body-A and Body-P segments for further analysis of thickness distributions. Fetal and juvenile menisci had similar thickness distributions to one another (p>0.27 at each quartile, Figure 5C,D). Adult-body sections were not different than fetal and juvenile tissues at any quartile level (p >0.27), whereas adult-horn sections had greater RTF thickness than fetal or juvenile sections in quartile 2 (p<0.01), and greater RTF thickness than fetal, juvenile, or adult-body sections in quartiles 3 and 4 (p<0.0001, Figure 5C,D).
Functional attributes of the maturing RTF network
Functional properties were similarly assessed across age groups using uniaxial tensile tests. In the radial direction, the majority of juvenile and fetal samples did not show a distinct toe region and so only the linear modulus is reported for these groups. Conversely, adult tissues showed an increase in the linear modulus compared to toe modulus (p=0.0007). There were, however, no differences in the linear moduli (p=0.26) across ages (Figure 6C). Despite no change in linear region moduli, yield strain was greater in adult specimens compared to fetal and juvenile specimens (p<0.0001). However, there was no difference in maximum strain across groups (p=0.12, Figure 6D). Covarying with yield strain, resilience increased with maturation stage (p=0.0012).Toughness was not different between groups (p = 0.50, Figure 6E).
Tests in the circumferential direction showed increases in both the toe (p=0.021) and linear (p=0.0002) moduli with age. The toe modulus of fetal specimens was not significantly different from juvenile specimens but was lower than adult specimens (p=0.016). There was no significant difference between juvenile and adult toe modulus (p=0.55). The linear modulus of fetal samples was significantly lower than both juvenile (p=0.015) and adult (p=0.0002) samples, with no differences found between adult and juvenile samples (p=0.40, Figure 7C). Transition and yield strains were not significantly different across groups (p=0.071 and p=0.15, respectively). Notably, fetal tissues had a slightly higher maximum strain compared to juvenile (p=0.027) and adult (p=0.029) tissues (Figure 7D). Covarying with linear modulus, resilience increased with maturation stage (p<0.05). Toughness did not change with maturation (p = 0.93, Figure 7E).
Since many meniscus injuries sever the circumferential fiber network, we assessed the tolerance of the tissue to such defects. Quite interestingly, we found that both fetal and juvenile intact and notch defected samples tested in the circumferential direction had similar linear moduli (p=0.75 and p=0.91, respectively) despite the half-width defect (Figure 8B,C). In contrast, when the same defect was applied to adult samples, a 30% decrease in effective modulus was observed compared to intact specimens (p=0.0038, Figure 8D).
Correlation between RTF Structural Characteristics and Tolerance to Circumferential Defects
To investigate the contribution of the RTF network to meniscus function in the context of interruption of the circumferential fiber network, RTF structural features (areal density, fiber thickness, and circular standard deviation (CSD, a measure of alignment) were measured in the same specimens used to measure the change in functional properties with a half-width notch defect. A correlation analysis was performed between the RTF structural features and the change in functional properties (Figure 9A). This analysis yielded several expected strong correlations in co-varying functional metrics (i.e., yield strain and resilience had a very high correlation, r = 0.94, p < 0.0001) while also identifying new correlations between structural and functional metrics (Figure 9A, boxed region). The strongest of these correlations were between the change in linear modulus and the RTF CSD (r=0.43, p=0.048, Figure 9B) and between change in toe modulus and RTF mean fiber thickness (r=0.49, p=0.041, Figure 9C). No other structure-function pairs showed significant correlations.
DISCUSSION
While it is well appreciated that distinct fiber networks (circumferential and radial) exist within the meniscus, the manner in which these elements change with maturation, and their functional implications, are not well studied. Here, we showed a dramatic structural reorganization of the meniscus radial tie fiber (RTF) network during post-natal tissue maturation. We further identified functional changes in the direction-dependent tissue properties over this same time course and identified characteristics of the RTF network that correlate with tolerance to local interruption of circumferential fiber bundles.
Structural analysis of the maturing meniscus identified features of the RTF network that change over time. While multiple studies have provided a qualitative description of the RTF network, little quantitative information exists. Quantification is essential to relate structural features to the function. To accomplish this, we used two-photon imaging and objective image processing methods to quantify the amount of RTFs present (areal density), the organization of this network (CSD), and the thickness of fibers within the network, over three age ranges. Our findings support the concept that meniscus undergoes specialization during post-natal maturation. In particular, fetal tissues were relatively homogeneous, containing a thin and isotropic RTF network throughout the tissue expanse. Conversely, in adult menisci, we noted marked heterogeneity in the RTF network. In adults, areal density and RTF fiber thickness increased, especially in the horns, and these fibers were more organized than in the body of the adult meniscus and in juvenile and fetal samples. These data support the specialization of the meniscal horns with maturation, potentially due to the higher loading that is seen in this region27. Interestingly, juvenile tissues showed similarities to fetal menisci only in radial fiber density and not in fiber isotropy. This suggests that network re-orientation may be initiated earlier than increases in fiber density.
Along with these structural changes during meniscus maturation, we also found marked functional changes in the meniscus, particularly in the radial direction. Notably, mechanical testing of radial specimens showed no change in linear region modulus but a substantial increase in both yield strain and resilience with maturation. These changes suggest that the developing RTF network may be contributing to the tissue’s ability to store and/or dissipate energy over larger extents of deformation. Conversely, circumferential testing showed an increase in both toe and linear modulus during post-natal maturation, absent any changes in yield strain. As a result, resilience in the circumferential direction also increased, though this was largely driven by changes in the modulus and not by the extent to which the tissue could be deformed. Note that since we used sections that did not span the full meniscus thickness, these values may be lower than would be seen for a whole meniscus, especially in the adult where fiber bundle structure is well developed. While the organization of the circumferential network does become more anisotropic with development28, previous studies have shown that this network still appears very well organized in fetal tissues and is defined early in meniscus development29 and our findings indicate that this network is only strengthened (greater modulus) over postnatal time in that configuration. This pattern of maturation is consistent with other collagenous tissues30. On the other hand, the meniscus radial tie fiber network shows marked changes in both structural and functional characteristics, particularly in the horn, as the tissue adapts to enable adult load bearing use.
This adaptation of the meniscus RTF structural and functional characteristics to support adult load bearing may come at a cost, however. Strikingly, we found that, in response to a notch defect, the apparent modulus of fetal and juvenile tissues did not change, while adult tissues showed a clear reduction. This means that immature samples (which possess a thin and isotropic RTF network) distribute load through the ECM, and these loads can be rerouted around a tear, such that the circumferential bundles are re-engaged with no loss in overall function. Conversely, the increased modulus in the radial direction of adult tissues, which arose from the focusing of RTFs into bigger, less distributed, more organized fibers, resulted in a tissue that was less able to re-engage disconnected circumferential bundles, and so had a lower tolerance to defect. This is in keeping with studies showing that branched networks can help avoid crack propagation by creating compliant regions near crack tips31. Another possibility is that the material may toughen as the isotropic network reorganizes local to a notch defect32. This is in keeping with, recent work from our group showing that isotropic collagen gel networks rapidly reconstituted strain around a notch defect, while the less isotropic inter-fascicular network of tendon was less able to do so26,33. In tendon, a mid-sized (<60%) notch defect decreased the tissue properties by 23%, 34 potentially due to intrafasicular shear loading of fibrils35. In the developing meniscus, diffuse radial fibers may work as a fiber recruitment mechanisms to control shearing of circumferential bundles36, which is a potential mechanism of failure in circumferential tension7,11 Correlations developed from individual samples examined for both local structure and defect tolerance supported that the isotropy of this RTF network is the strongest predictor of the change in linear modulus with a defect. This is also consistent with previous biomaterial models, where dispersed non-aligned elements within aligned materials were protective of overall mechanical function15.
Overall, this study provides new data and insight into the postnatal structural development and maturation of the meniscus radial tie fiber network and its impact on the functional characteristics of the tissue. Importantly, we noted that the maturation that occurs within the RTF network makes the tissue stronger, but also more susceptible to loss of function with interruption of circumferential fibers. These data may be used to inform future surgical interventions and tissue engineering strategies for functional meniscus restoration.
Acknowledgements:
This work was supported by the Department of Veterans Affairs (I01 RX000174) and the National Institutes of Health (R01 EB002425, R01 AR075418, and T32 AR007132). Additional support was provided by a New Investigator Award from the Orthopaedic Research and Education Foundation (OREF) and a pilot award from the Penn Center for Musculoskeletal Disorders (P30 AR069619).
References
- 1.Kambic HE, McDevitt CA. 2005. Spatial organization of types I and II collagen in the canine meniscus. J. Orthop. Res 23(1):142–149 Available from: http://doi.wiley.com/10.1016/j.orthres.2004.06.016. [DOI] [PubMed] [Google Scholar]
- 2.Setton LA, Mow VC, Muller FJ, et al. 1994. Mechanical properties of canine articular cartilage are significantly altered following transection of the anterior cruciate ligament. J. Orthop. Res 12(4):451–463. [DOI] [PubMed] [Google Scholar]
- 3.Chevrier A, Nelea M, Hurtig MB, et al. 2009. Meniscus structure in human, sheep, and rabbit for animal models of meniscus repair. J. Orthop. Res 27(9):1197–1203 Available from: http://doi.wiley.com/10.1002/jor.20869. [DOI] [PubMed] [Google Scholar]
- 4.Adams ME, Hukins DWL. 1992. The extracellular matrix of the meniscus. In: Knee Meniscus: Basic and Clinical Foundations; p 15–28. [Google Scholar]
- 5.Skaggs DL, Warden WH, Mow VC. 1994. Radial tie fibers influence the tensile properties of the bovine medial meniscus. J. Orthop. Res 12(2):176–185 Available from: http://doi.wiley.com/10.1002/jor.1100120205. [DOI] [PubMed] [Google Scholar]
- 6.Makris EA, Hadidi P, Athanasiou KA. 2011. The knee meniscus: Structure-function, pathophysiology, current repair techniques, and prospects for regeneration. Biomaterials 32(30):7411–7431 Available from: 10.1016/j.biomaterials.2011.06.037. [DOI] [PMC free article] [PubMed] [Google Scholar]
- 7.Fithian DC, Kelly M a, Mow VC. 1990. Material properties and structure-function relationships in the menisci. Clin. Orthop. Relat. Res (252):19–31 Available from: http://www.ncbi.nlm.nih.gov/pubmed/2406069. [PubMed] [Google Scholar]
- 8.Andrews SHJ, Rattner JB, Abusara Z, et al. 2014. Tie-fibre structure and organization in the knee menisci. J. Anat 224(5):531–537 Available from: http://doi.wiley.com/10.1111/joa.12170. [DOI] [PMC free article] [PubMed] [Google Scholar]
- 9.Fisher MB, Henning EA, Söegaard N, et al. 2013. Organized nanofibrous scaffolds that mimic the macroscopic and microscopic architecture of the knee meniscus. Acta Biomater. 9(1):4496–4504 Available from: http://linkinghub.elsevier.com/retrieve/pii/S1742706112004953. [DOI] [PMC free article] [PubMed] [Google Scholar]
- 10.Li Q, Qu F, Han B, et al. 2017. Micromechanical anisotropy and heterogeneity of the meniscus extracellular matrix. Acta Biomater. 54:356–366 Available from: 10.1016/j.actbio.2017.02.043. [DOI] [PMC free article] [PubMed] [Google Scholar]
- 11.Proctor CS, Schmidt MB, Whipple RR, et al. 1989. Material properties of the normal medial bovine meniscus. J. Orthop. Res 7(6):771–782 Available from: http://www.ncbi.nlm.nih.gov/pubmed/2677284. [DOI] [PubMed] [Google Scholar]
- 12.Mauck RL, Baker BM, Nerurkar NL, et al. 2009. Engineering on the Straight and Narrow: The Mechanics of Nanofibrous Assemblies for Fiber-Reinforced Tissue Regeneration. Tissue Eng. Part B Rev 15(2):171–193 Available from: http://www.ncbi.nlm.nih.gov/pubmed/19207040%5Cnhttp://online.liebertpub.com/doi/pdfplus/10.1089/ten.teb.2008.0652. [DOI] [PMC free article] [PubMed] [Google Scholar]
- 13.Bullough PG, Munuera L, Murphy J, Weinstein AM. 1970. The strength of the menisci of the knee as it relates to their fine structure. J. Bone Joint Surg. Br 52(3):564–7 Available from: http://www.bjj.boneandjoint.org.uk/content/52-B/3/564.short. [PubMed] [Google Scholar]
- 14.Bedi A, Kelly NH, Baad M, et al. 2010. Dynamic contact mechanics of the medial meniscus as a function of radial tear, repair, and partial meniscectomy. J. Bone Jt. Surg. - Ser. A 92(6):1398–1408 Available from: http://jbjs.org/cgi/doi/10.2106/JBJS.I.00539. [DOI] [PubMed] [Google Scholar]
- 15.Bansal S, Mandalapu S, Aeppli C, et al. 2017. Mechanical function near defects in an aligned nanofiber composite is preserved by inclusion of disorganized layers: Insight into meniscus structure and function. Acta Biomater. 56(5):102–109 Available from: https://linkinghub.elsevier.com/retrieve/pii/S1742706117300855. [DOI] [PMC free article] [PubMed] [Google Scholar]
- 16.Freund I, Deutsch M. 1986. Second-harmonic microscopy of biological tissue. Opt. Lett 11(2):94 Available from: http://www.ncbi.nlm.nih.gov/pubmed/19730544. [DOI] [PubMed] [Google Scholar]
- 17.Rao RAR, Mehta MR, Leithem S, Toussaint KC Jr.. 2009. Quantitative analysis of forward and backward second-harmonic images of collagen fibers using Fourier transform second-harmonic-generation microscopy. Opt. Lett 34(24):3779 Available from: https://www.osapublishing.org/abstract.cfm?URI=ol-34-24-3779. [DOI] [PubMed] [Google Scholar]
- 18.Berens P. 2009. CircStat : A MATLAB Toolbox for Circular Statistics. J. Stat. Softw 31(10) Available from: http://www.jstatsoft.org/v31/i10/. [Google Scholar]
- 19.Doube M, Klosowski MM, Arganda-Carreras I, et al. 2010. BoneJ: Free and extensible bone image analysis in ImageJ. Bone 47(6):1076–1079 Available from: http://linkinghub.elsevier.com/retrieve/pii/S8756328210014419. [DOI] [PMC free article] [PubMed] [Google Scholar]
- 20.Peloquin JM, Santare MH, Elliott DM. 2018. Short cracks in knee meniscus tissue cause strain concentrations, but do not reduce ultimate stress, in single-cycle uniaxial tension. R. Soc. Open Sci 5(11). [DOI] [PMC free article] [PubMed] [Google Scholar]
- 21.Peloquin JM, Elliott DM. 2016. A comparison of stress in cracked fibrous tissue specimens with varied crack location, loading, and orientation using finite element analysis. J. Mech. Behav. Biomed. Mater 57:260–268 Available from: http://linkinghub.elsevier.com/retrieve/pii/S175161611500466X. [DOI] [PMC free article] [PubMed] [Google Scholar]
- 22.Favata M. 2006. Scarless Healing in the Fetus: Implications and Strategies for Postnatal Tendon Repair. Available from: http://repository.upenn.edu/dissertations/AAI3246156/.
- 23.Fung YCB. 1967. Elasticity of soft tissues in simple elongation. Am. J. Physiol 213(6). [DOI] [PubMed] [Google Scholar]
- 24.Roth V, Mow VC. 1980. The Intrinsic Tensile Behaviour of the Matrix of Bovine Articular Cartilage and Its Variations with Age. J. Bone Jt. Surg 62(7):1102–1117. [PubMed] [Google Scholar]
- 25.Tanaka ML, Weisenbach CA, Carl Miller M, Kuxhaus L. 2011. A Continuous Method to Compute Model Parameters for Soft Biological Materials. J. Biomech. Eng 133(7):074502 Available from: http://biomechanical.asmedigitalcollection.asme.org/article.aspx?articleid=1406984. [DOI] [PubMed] [Google Scholar]
- 26.Szczesny SE, Caplan JL, Pedersen P, Elliott DM. 2015. Quantification of Interfibrillar Shear Stress in Aligned Soft Collagenous Tissues via Notch Tension Testing. Sci. Rep 5(October):14649 Available from: http://www.pubmedcentral.nih.gov/articlerender.fcgi?artid=4606738&tool=pmcentrez&rendertype=abstract. [DOI] [PMC free article] [PubMed] [Google Scholar]
- 27.Fox AJS, Bedi A, Rodeo S a. 2012. The basic science of human knee menisci: structure, composition, and function. Sports Health 4(4):340–51 Available from: http://www.pubmedcentral.nih.gov/articlerender.fcgi?artid=3435920&tool=pmcentrez&rendertype=abstract. [DOI] [PMC free article] [PubMed] [Google Scholar]
- 28.Li Q, Wang C, Han B, et al. 2018. Impacts of maturation on the micromechanics of the meniscus extracellular matrix. J. Biomech 72:252–257 Available from: 10.1016/j.jbiomech.2018.02.037. [DOI] [PMC free article] [PubMed] [Google Scholar]
- 29.Clark CR, Ogden JA. 1983. Development of the Human Knee Joint. J. Bone Jt. Surg Available from: http://archsurg.jamanetwork.com/article.aspx?doi=10.1001/archsurg.1943.01220110121021. [PubMed] [Google Scholar]
- 30.Connizzo BK, Yannascoli SM, Soslowsky LJ. 2013. Structure-function relationships of postnatal tendon development: A parallel to healing. Matrix Biol. 32(2):106–116. [DOI] [PMC free article] [PubMed] [Google Scholar]
- 31.Koh CT, Oyen ML. 2012. Branching toughens fibrous networks. J. Mech. Behav. Biomed. Mater 12:74–82 Available from: 10.1016/j.jmbbm.2012.03.011. [DOI] [PubMed] [Google Scholar]
- 32.Koh CT, Strange DGT, Tonsomboon K, Oyen ML. 2013. Failure mechanisms in fibrous scaffolds. Acta Biomater. 9(7):7326–7334 Available from: 10.1016/j.actbio.2013.02.046. [DOI] [PubMed] [Google Scholar]
- 33.Szczesny SE, Elliott DM. 2014. Interfibrillar shear stress is the loading mechanism of collagen fibrils in tendon. Acta Biomater. 10(6):2582–2590 Available from: 10.1016/j.actbio.2014.01.032. [DOI] [PMC free article] [PubMed] [Google Scholar]
- 34.McCarthy DM, Tramaglini DM, Chan SS, et al. 1995. Effect of partial laceration on the structural properties of the canine FDP tendon: An in vitro study. J. Hand Surg. Am 20(5):795–800. [DOI] [PubMed] [Google Scholar]
- 35.Kondratko-Mittnacht J, Duenwald-Kuehl S, Lakes R, Vanderby R. 2015. Shear load transfer in high and low stress tendons. J. Mech. Behav. Biomed. Mater 45:109–120 Available from: 10.1016/j.jmbbm.2015.01.021. [DOI] [PMC free article] [PubMed] [Google Scholar]
- 36.Mow VC, Whipple R. 1984. The biology and mechanical properties of cartilage and menisci. In Resources for Basic Sciences Educators VI. 165 p. [Google Scholar]


