Abstract
Background and aim:
In chronic liver injury, platelet-derived growth factor (PDGF)-stimulated hepatic stellate cells (HSCs) release fibrogenic extracellular vesicles (EVs). EVs include multivesicular body (MVB)-derived exosomes and Rho-associated kinase (ROCK)-dependent plasma membrane budding-derived microvesicles. Autophagy plays substantial roles in maintaining liver homeostasis and its deregulation has been associated with liver disease. However, the effect of autophagy in regulating fibrogenic EVs and amplifying pro-fibrotic signals among HSCs remains unknown. Here, we aim to understand the role of autophagy in HSC-derived fibrogenic EV release in liver fibrosis.
Methods:
Liver fibrosis in mice was induced by carbon tetrachloride (CCl4) administration or bile duct ligation (BDL). Small EVs were purified by differential ultracentrifugation.
Results:
In vitro, PDGF and its downstream molecule SHP2 (Src homology 2-containing protein tyrosine phosphatase 2) inhibited autophagy and increased HSC-derived EV release. We used this PDGF/SHP2 model to further investigate how autophagy affects fibrogenic EV release. RNA-seq identified an mTOR (mammalian target of rapamycin) signaling molecule to be regulated by SHP2 and PDGF. Disruption of mTOR signaling abolished PDGF-dependent EV release. Activation of mTOR signaling induced the release of MVB-derived exosomes by inhibiting autophagy as well as microvesicles through activation of ROCK1 signaling. These mTOR-dependent EVs promoted in vitro HSC migration. To assess the importance of this mechanism in vivo, SHP2 was selectively deleted in HSCs, which attenuated CCl4 or BDL-induced liver fibrosis. Furthermore, administration of circulating EVs from mice with HSC-specific SHP2 deletion to mice undergoing CCl4-mediated fibrogenesis demonstrated less fibrosis than EVs derived from control mice. Congruently, SHP2 was upregulated in patients with liver cirrhosis.
Conclusion:
These results demonstrate that in HSCs, autophagy inhibits fibrogenic EV release which can attenuate liver fibrosis. (274 words)
Keywords: autophagy, hepatic stellate cell, exosome, microvesicle, mTOR signaling, liver fibrosis
Graphical Abstract
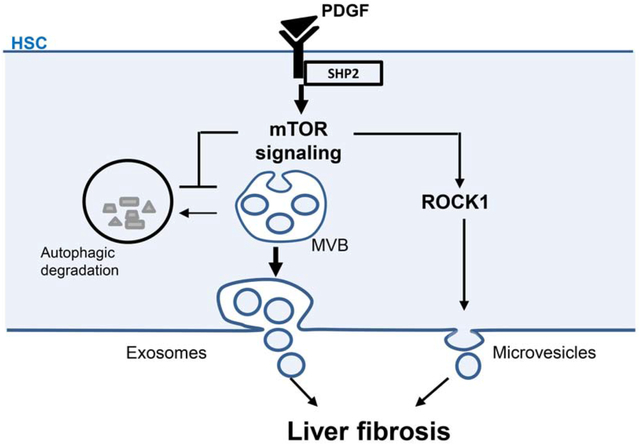
Lay summary:
During liver fibrosis and cirrhosis, the key cell type responsible for fibrotic tissue deposition is the activated hepatic stellate cell (HSC). Recently, we demonstrated that activated HSCs release nano-sized vesicles enriched with fibrogenic proteins. In the current study, we unveil the mechanism of the release of these fibrogenic vesicles with the long-term goal to therapeutically target it.
Introduction
Autophagy is a degradative process among eukaryotes in which double-membrane vesicles named autophagosomes fuse with lysosomes to degrade cytosolic proteins and organelles.[1] Autophagy contributes to liver homeostasis and its deregulation has been linked to several chronic liver diseases.[2,3] The role of autophagy in liver disease depends on the cell type and the stage of the disease.[2,4,5] In hepatocytes, autophagy has been demonstrated to have a protective role while in hepatic stellate cells (HSCs) autophagy is proposed to induce their activation through lipophagy, a selective type of lipid droplet degradation.[2] However, the autophagy inhibitor mammalian target of rapamycin (mTOR) actually promotes HSC activation and liver fibrosis.[6,7] Thus, deciphering the fine-tuned mechanisms in which autophagy is involved with the amplification of fibrogenic signals would improve our understanding of liver fibrosis.
Extracellular vesicles (EVs) have emerged as important cell-derived particles in liver injury and fibrosis progression.[8] Small EVs range from 50–150 nm originating from plasma membrane budding as microvesicles enriched for ADP ribosylation factor 6 (Arf6) or from multivesicular body (MVB) content as exosomes enriched for cluster of differentiation 63 (CD63) and CD81.[8] EVs are significantly involved in cell-to-cell communication through delivery of diverse cargo.[9] In the liver, EVs from injured hepatocytes and sinusoidal endothelial cells (LSECs) induce HSC activation and migration.[8] Interestingly, EV release increases in response to liver injury,[10–12] while inhibition of autophagy or lysosomal degradation have been associated with increased EV release.[13,14] However, there is a lack of understanding of how pathogenic EVs are released and more specifically how autophagy may regulate the biogenesis of pro-fibrotic HSC-derived EVs. One of the key molecules in the progression of liver fibrosis is platelet-derived growth factor (PDGF), released by LSECs, Kupffer cells and HSCs.[15] PDGF is an essential tool for in vitro studies as it induces activation and migration of HSCs[16], the primary cell type involved in matrix deposition during fibrogenesis.[17] In HSCs, PDGF binding to PDGF receptor (PDGFR) induces tyrosine auto-phosphorylation which recruits important downstream signaling molecules, such as Src homology 2 domain protein phosphatase 2 (SHP2).[18] Recently, fibroblastic SHP2 has been shown to induce skin and lung fibrosis.[19] Previously, we demonstrated that PDGF and SHP2 promote enrichment of HSC-derived EVs with fibrogenic proteins.[20] Based on this, we used this PDGF/SHP2 model as a platform for studying the role of autophagy in the field of HSC-derived EV release and liver fibrosis.
In the present study, we demonstrate that HSCs release EVs through mTOR by inhibiting autophagy and activating Rho-associated protein kinase 1 (ROCK1) signaling. Moreover, this EV release mechanism participates in liver fibrosis progression. In conclusion, HSC autophagy reduced liver fibrosis by attenuating fibrogenic HSC-derived EV release.
Material and methods
In vivo experiments
In vivo protocols were approved by the Mayo Clinic Institutional Animal Care and Use Committee. In all in vivo experiments, mice received humane care and were sex and age matched. Six-week old WT C57Bl/6 mice were purchased from Envigo and transgenic mice from Jackson Laboratory. PDGFRβCreERT2 (B6.Cg-Tg(Pdgfrb-cre/ERT2)6096Rha/J), SHP2fl/fl (Ptpn11tm1.1Wbm/J) and Rosa26-Tomato-STOP-GFP (B6.129(Cg)-Gt(ROSA)26Sortm4(ACTB-tdTomato,-EGFP)Luo/J) mice were crossed in our facilities. Heterozygous PDGFRβCreERT2/SHP2fl/+ (SHP2Δ/+) or homozygous PDGFRβCreERT2/SHP2fl/fl (SHP2ΔHSC) mice were obtained. For Cre efficiency, PDGFRβCreERT2 mice were crossed with Rosa26-Tomato-STOP-GFP mice (B6.129(Cg)-Gt(ROSA)26Sortm4(ACTB-tdTomato,-EGFP)Luo/J). The Cre recombinase activity was stimulated by intraperitoneal administration of 75 mg/kg tamoxifen (Sigma-Aldrich #10540-29-1) for 5 consecutive days. There was a 2-week waiting period after the last tamoxifen injection prior to any experimentation. CCl4 (1 μL/g of body weight, Sigma-Aldrich #319961) was administered via intraperitoneal injection twice a week for 4–6 weeks. Bile duct ligations (BDL) or sham operations were performed as previously described,[20] mice were sacrificed 3 weeks later. For EV transplantation, 2×10⁸ serum EVs/mouse/day were administered daily via intraperitoneal injections for 4 weeks. Livers were collected and analyzed by Sirius red and Western blotting (WB).
Patients
Patient serum samples were obtained and analyzed under Mayo Clinic Institutional Review Board-approved protocols. Informed consent was obtained from all patients. Patient demographics are detailed in Supplementary Table 1.
EV purification
EVs were purified using a differential ultracentrifugation method.[20] Briefly, equal volumes of 12-hour conditioned media or serum across experimental conditions were centrifuged 10 min at 300g, 30 min at 20000g (big EVs) and 2.5 hours at 120000g (small EVs) using Optima XPN-80 ultracentrifuge. Small EVs were resuspended in equal volumes for Nanoparticle-Tracking Analysis (NTA, NS300), Western blotting (WB) or EV transplantation.
Imaging
A Zeiss Definite Focus .2 microscope with Axiocam 702 mono camera was used. For live cell imaging, cells were photographed every 5 minutes for 4 hours, ZEN2 (blue edition) was used for fluorescence quantification. For immunofluorescence stainings, ImageJ was utilized for image analysis.
Statistical analysis
Graphpad Prism software was used for statistical analysis. Normal distribution was examined utilizing Shapiro-Wilk test. ANOVA with Bonferroni post-test, Mann-Whitney and t-tests were used to analyze the data. The difference was considered significant for p-value lower than 0.05. Results are presented as mean±SEM. Sample size was determined using https://www.samplesize.net/sample-size-means/.
Supplementary information describes in vitro experiments, RNA-sequencing, gene expression, Western blotting, immunofluorescence, siRNA knockdown, protein array and antibodies.
Results
PDGF inhibits autophagy and increases EV release
We first aimed to test the hypothesis that in HSCs, our PDGF-stimulation model inhibits autophagy to increase EV release. For this, we utilized an mCherry-eGFP-LC3b plasmid,[21] which expresses mCherry-eGFP-LC3b chimeric protein, where LC3b (microtubule-associated proteins 1A/1B light chain 3B) is an autophagosome component, and allows detection of degrading versus non-degrading autophagosomes (Sup figure 1). Autophagosome-lysosome fusion for cargo degradation lowers the pH to eGFP signal extinction, while mCherry fluorescence stays constant. However, when autophagosomes do not fuse with lysosomes, they remain eGFP+ and mCherry+. LX2 cells (human hepatic stellate cell line) were transfected with mCherry-eGFP-LC3b plasmid and treated with vehicle, the autophagic degradation inhibitor bafilomycin A1 or PDGF. As predicted, compared to the vehicle (Figure 1A left, Movie 1), treatment of the cells with bafilomycin A1 increased the eGFP+-mCherry+ autophagosome pool (yellow color) (Figure 1A middle, Movie 2) leading to an increased yellow/red ratio (Figure 1A graph) indicative of autophagy inhibition. Similarly to bafilomycin A1, PDGF also increased the yellow/red ratio compared to basal media condition at 4 hours of treatment (Figure 1A right and graph, Movie 3), demonstrating for the first time that PDGF inhibited autophagic degradation. Congruent with these results, PDGF treatment, but not TGFβ treatment, of primary human HSCs increased the protein levels of LC3b and sequestosome-1 (p62), both crucial for autophagosome formation (Figure 1B left, Sup figure 2). PDGF did not increase LC3b or p62 mRNA levels (Figure 1B, right), suggesting that the protein level increase was due to a reduced autophagic degradation and not to a de novo p62 and LC3b expression. The PDGF-mediated inhibition of autophagy correlated with an increase of the CD63+ MVB pool in primary human HSCs (Figure 1C) and an increase of EV release from primary human and mouse HSCs (Figure 1D–E). One of the crucial downstream signaling molecules of PDGF is SHP2.[18] Inhibition of SHP2 by the competitive inhibitor, SHP099, abolished PDGF-mediated EV release (Figure 1D). SHP099 also decreased LC3b protein levels (Figure 1F) suggesting that SHP2 inhibition promoted autophagic degradation. These results support the concept that PDGF signaling in HSCs inhibits autophagy and increases EV release, suggesting that autophagy may inhibit EV release.
Fig. 1. Inhibition of autophagy correlates with increased EV release in HSCs.
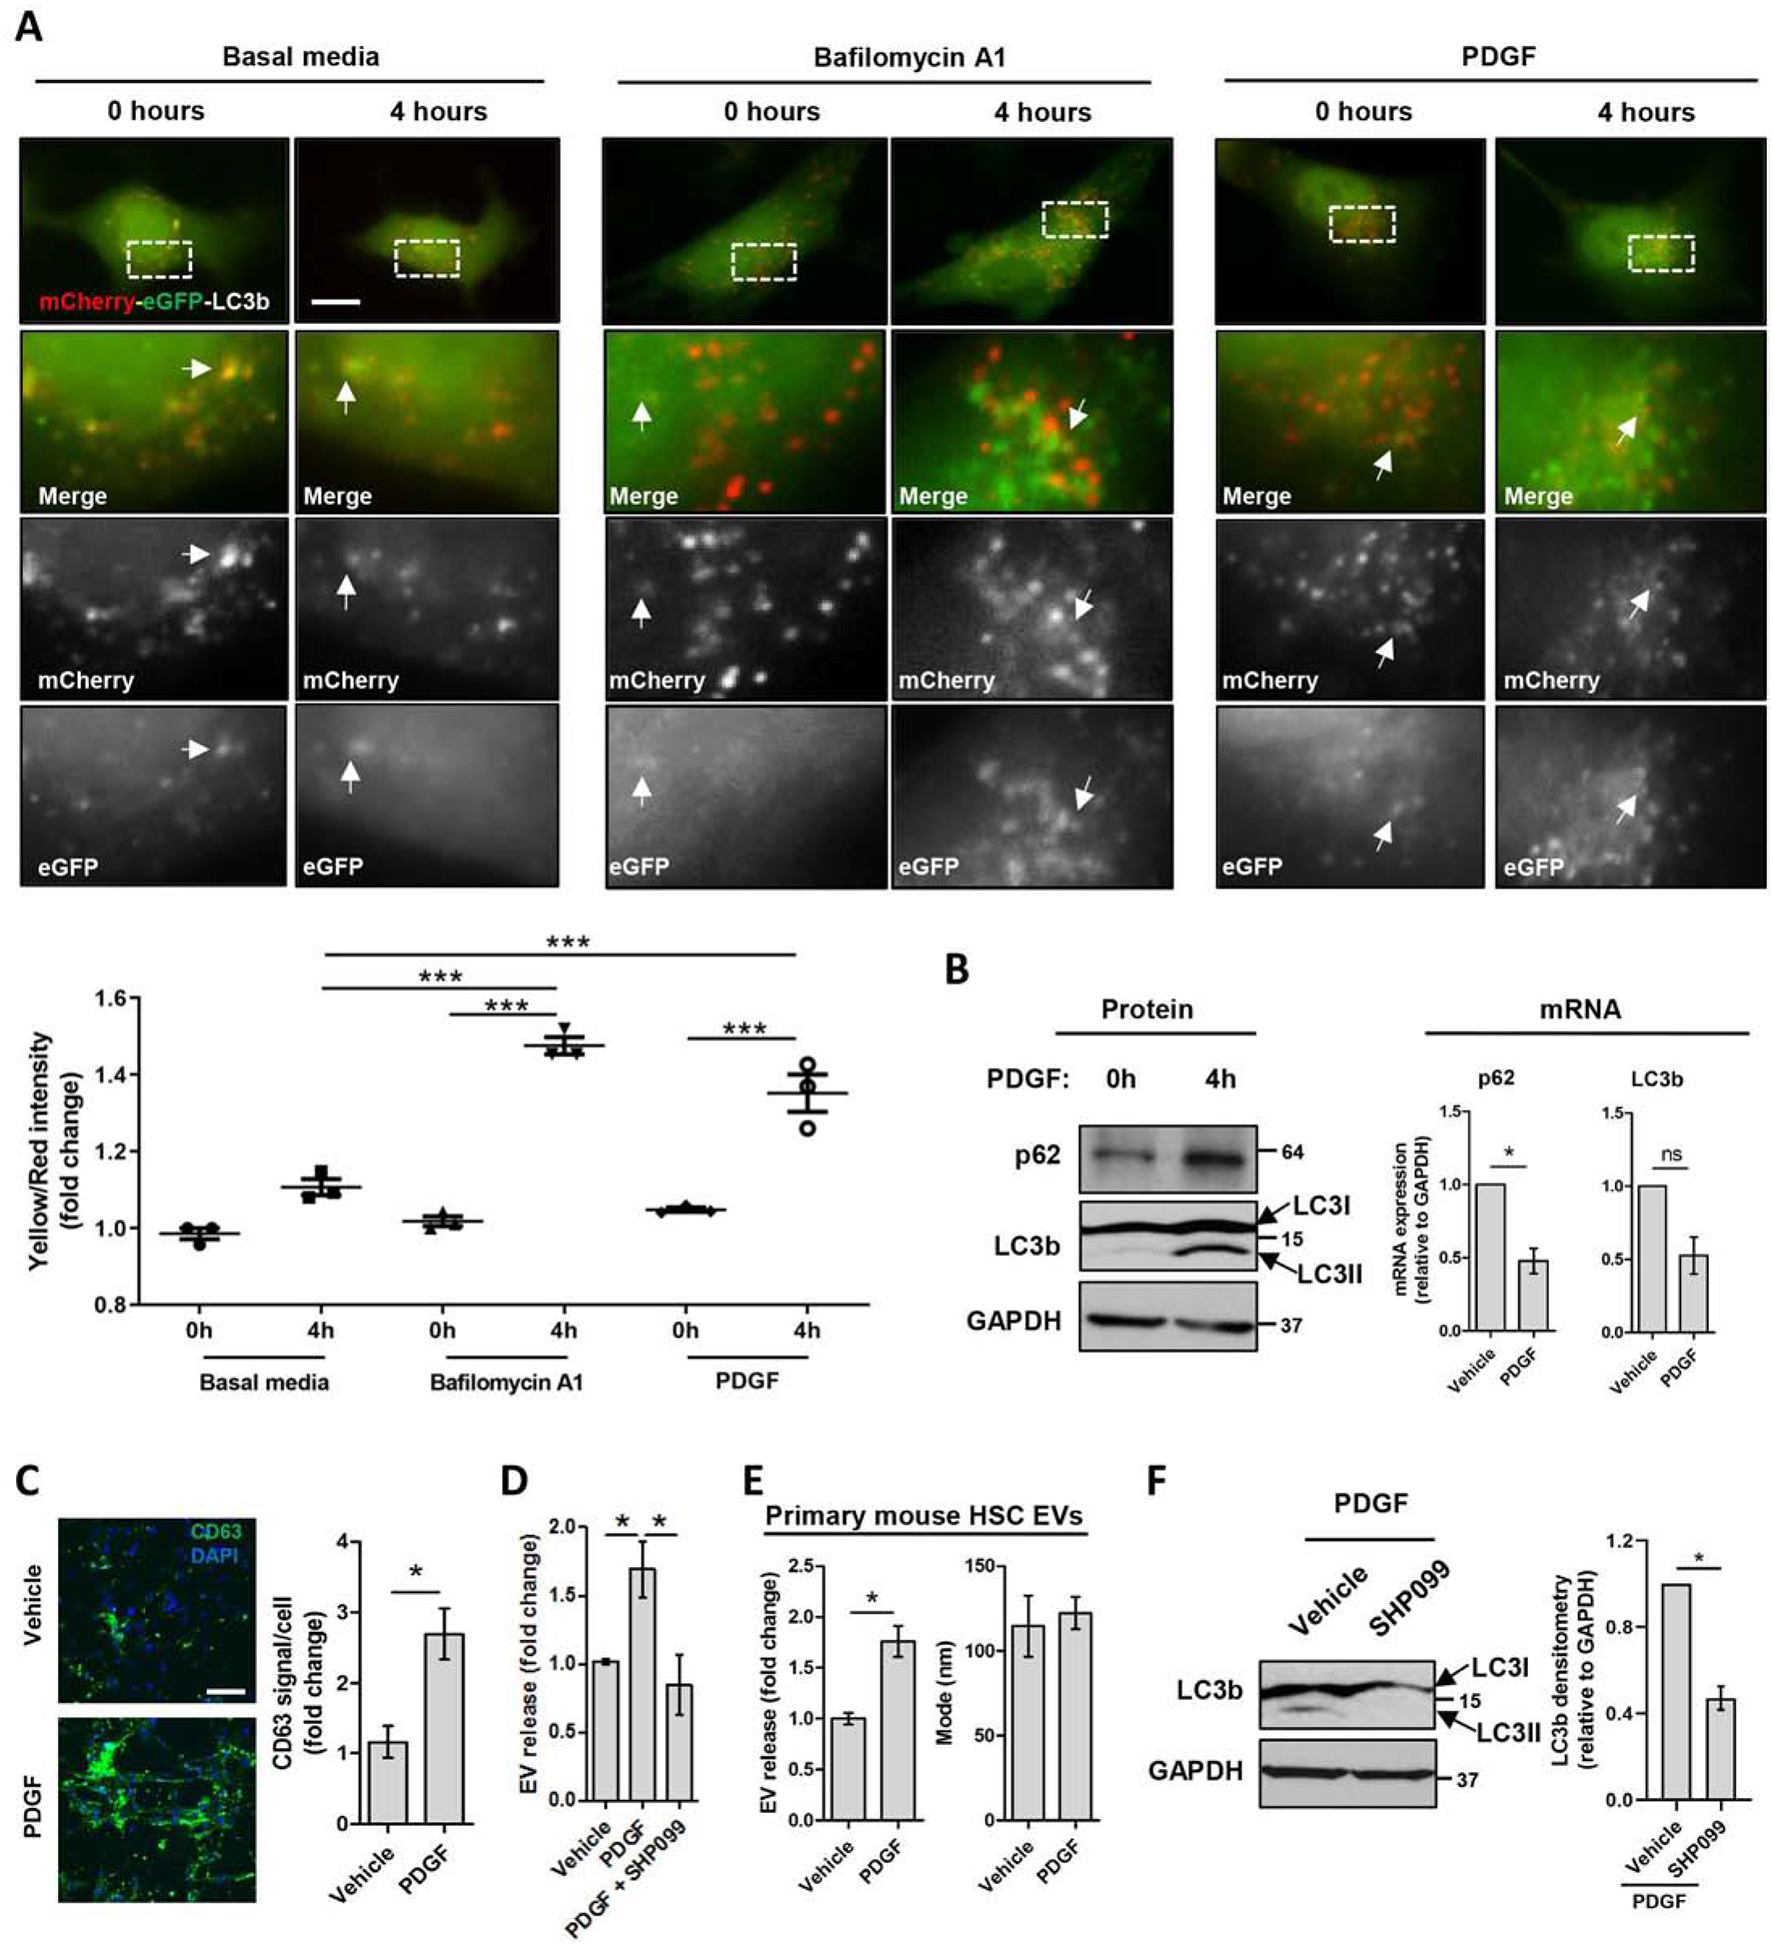
(A) LX2 cells were transfected with mCherry-eGFP-LC3b plasmid and cultured in basal media, in the presence of Bafilomycin A1 or PDGF for 0–4 hours. Time lapse were recorded utilizing a live cell microscope. The graph represents the quantification of mCherry and eGFP signals utilizing ZEN2. (Scale bar: 20 μm, n = 3, paired t-test) (B) Primary human HSCs cultured in the presence of PDGF for 0 and 4 hours were examined by WB (left) and qPCR (right) for p62 and LC3b. (n=4, Mann-Whitney test) (C) Primary human HSCs treated with PDGF for 12 hours were examined by CD63 immunostaining. Fluorescence was quantified utilizing ImageJ. (Scale bar: 100 μm, n = 5, Mann-Whitney test) (D) EVs derived from Primary human HSCs treated with vehicle, PDGF or PDGF+SHP099 for 12 hours were analyzed by NTA (n = 3, one-way ANOVA with Bonferroni comparison). (E) EVs derived from primary mouse HSCs treated with PDGF for 12 hours were analyzed by NTA. (n = 3, Mann-Whitney test) (F) Primary human HSCs cultured in the presence of PDGF or PDGF+SHP099 for 12 hours were examined by WB for LC3b and quantified by densitometry. (n = 6, Mann-Whitney test) Graph bars represent SEM, *p< 0.05, ***p< 0.001.
EV release is regulated by the autophagy activator REDD1
We used this PDGF/SHP2 model to further investigate how autophagy inhibits fibrogenic EV release. For this purpose, we performed HSC whole transcriptome RNA-sequencing. Primary human HSCs were treated with PDGF+/−SHP099, mRNA was examined by sequencing and RNA-seq results were analyzed by ingenuity pathway analysis (Qiagen) (Figure 2). Nearly 25% of the genes were upregulated by SHP099 (Figure 2A). Several pathways were affected by SHP2 inhibition, the top one being osteoarthritis (Sup figure 3A–B), a process with many parallels to fibrosis.[6,22–24] Therefore, the osteoarthritis pathway candidates were further confirmed by qPCR (Sup figure 3C). As a result, the endogenous inhibitor of mTOR named REDD1 was one of the top targets of SHP2. In prior studies, mTOR promoted liver injury and fibrosis,[6,25] and inhibited autophagy.[26] Here, PDGF repressed REDD1 expression which was restored by SHP2 inhibition (Sup figure 3C). As a control, TGFβ did not decrease REDD1, suggesting that REDD1 is specifically regulated by the PDGF/SHP2 axis (Sup figure 3C). As a confirmation of the RNA-seq, SHP2 knock-down by siRNA led to an upregulation of REDD1 in both vehicle and PDGF treatment (Figure 2B). These results demonstrate that REDD1, an mTOR inhibitor and autophagy activator,[27,28] is downregulated by PDGF and SHP2 suggesting a role for REDD1 in EV release.
Fig. 2. SHP2 induces EV release by inhibiting REDD1 expression, an mTOR inhibitor.
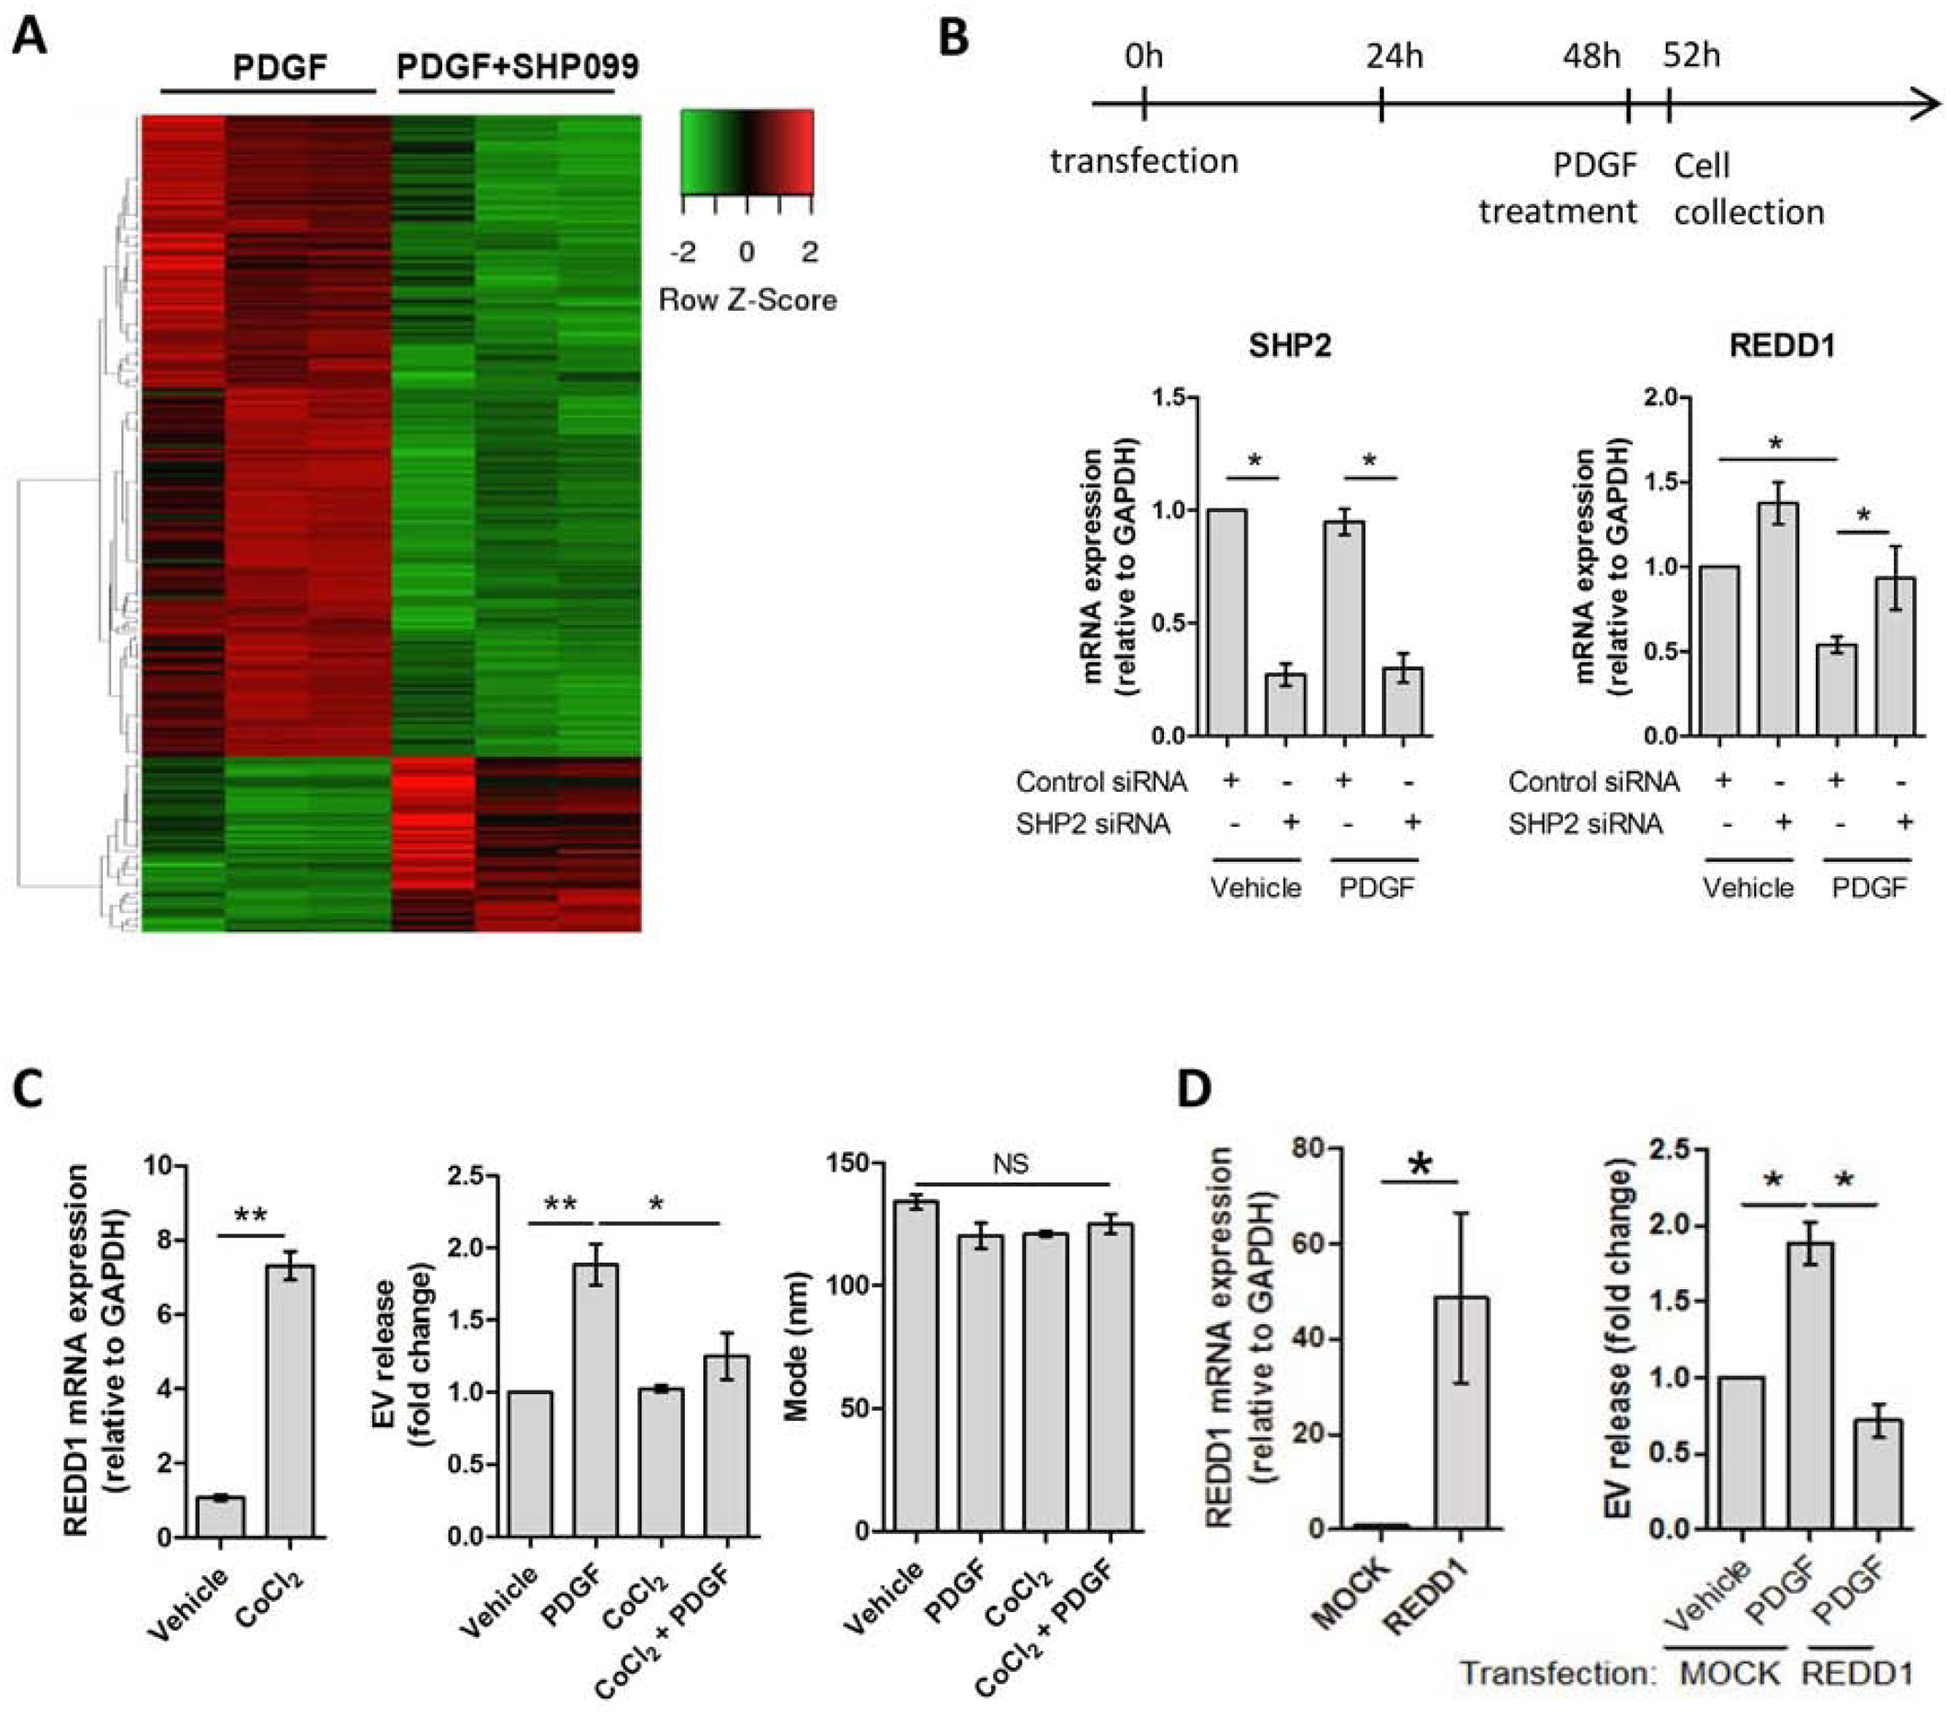
(A) Primary human HSCs were treated with PDGF +/− SHP099 for 48 hours and differential gene expression was analyzed by RNA-sequencing. Green: downregulated genes, red: upregulated genes. (n = 3) (B) Primary human HSCs were transfected with control or SHP2 siRNA. PDGF was added 48 hours later and cell were cultured for additional 4 hours. The mRNA levels of SHP2 and REDD1 were assessed by qPCR. (n = 3) (C) Primary human HSCs were cultured in the presence of vehicle or CoCl2 1 hour prior to vehicle or PDGF treatment. REDD1 mRNA expression was examined by qPCR (left graph, paired t-test). EV concentration and mode were examined by NTA (middle and right graphs). (n = 3) (D) LX2 cells were transfected with REDD1 plasmid and two days later they were treated with vehicle or PDGF for 12 hours. REDD1 overexpression was examined by qPCR (left graph, paired t-test). EV concentration was measured by NTA. (n = 3) Graph bars represent SEM, one-way ANOVA with Bonferroni comparison, *p< 0.05, **p< 0.01, NS: not significant.
Next, we aimed to understand the role of REDD1 in liver fibrosis and HSC-derived EV release by stimulating its expression. For this purpose, we utilized the REDD1 stimulator, cobalt chloride (CoCl2) (Figure 2C, left).[29] Primary human HSCs were treated with CoCl2 in the presence of vehicle or PDGF. EVs were examined by NTA. REDD1 expression attenuated PDGF-mediated EV release (Figure 2C, middle) with no effect on the EV size (Figure 2C, right). Next, we overexpressed REDD1 in LX2 cells (Figure 2D, left). Congruent with the previous results, overexpression of REDD1 significantly reduced HSC-derived EV release (Figure 2D, right). In summary, these results demonstrate that REDD1, an autophagy activator and mTOR inhibitor, is a negative regulator of HSC-derived fibrogenic EV release.
mTOR signaling increases HSC-derived EV release by inhibiting autophagy and activating ROCK1
To further understand how autophagy impacts fibrogenic EV release, we examined the role of the autophagy inhibitor mTOR in HSC-derived EV release. Primary human HSCs were treated with vehicle or PDGF in the presence or absence of rapamycin, a specific mTOR complex 1 (mTORC1) inhibitor.[6] The effect of rapamycin on mTOR signaling was confirmed by the decrease in ribosomal protein S6 kinase (S6K) phosphorylation, a canonical downstream signaling molecule of mTORC1, while the effect of PDGF was confirmed by the downregulation of PDGFRα protein level (Figure 3A). In accordance with our previous results (Figure 2C–D), mTOR inhibition by rapamycin attenuated PDGF-mediated EV release without any effect on the EV size as demonstrated by NTA (Figure 3B). We then performed mTOR silencing, as well as silencing of mTOR binding partners, regulatory-associated protein of mTOR (Raptor) and rapamycin-insensitive companion of mTOR (Rictor) on primary human HSCs (Figure 3C). Congruent with rapamycin results, mTOR knockdown by siRNA abolished PDGF-mediated EV release (Figure 3D). A similar effect was also obtained with Raptor or Rictor siRNA-mediated knockdown (Figure 3D), confirming that mTOR signaling promotes EV release.
Fig. 3. PDGF-mediated EV release is dependent on mTOR, an autophagy inhibitor.
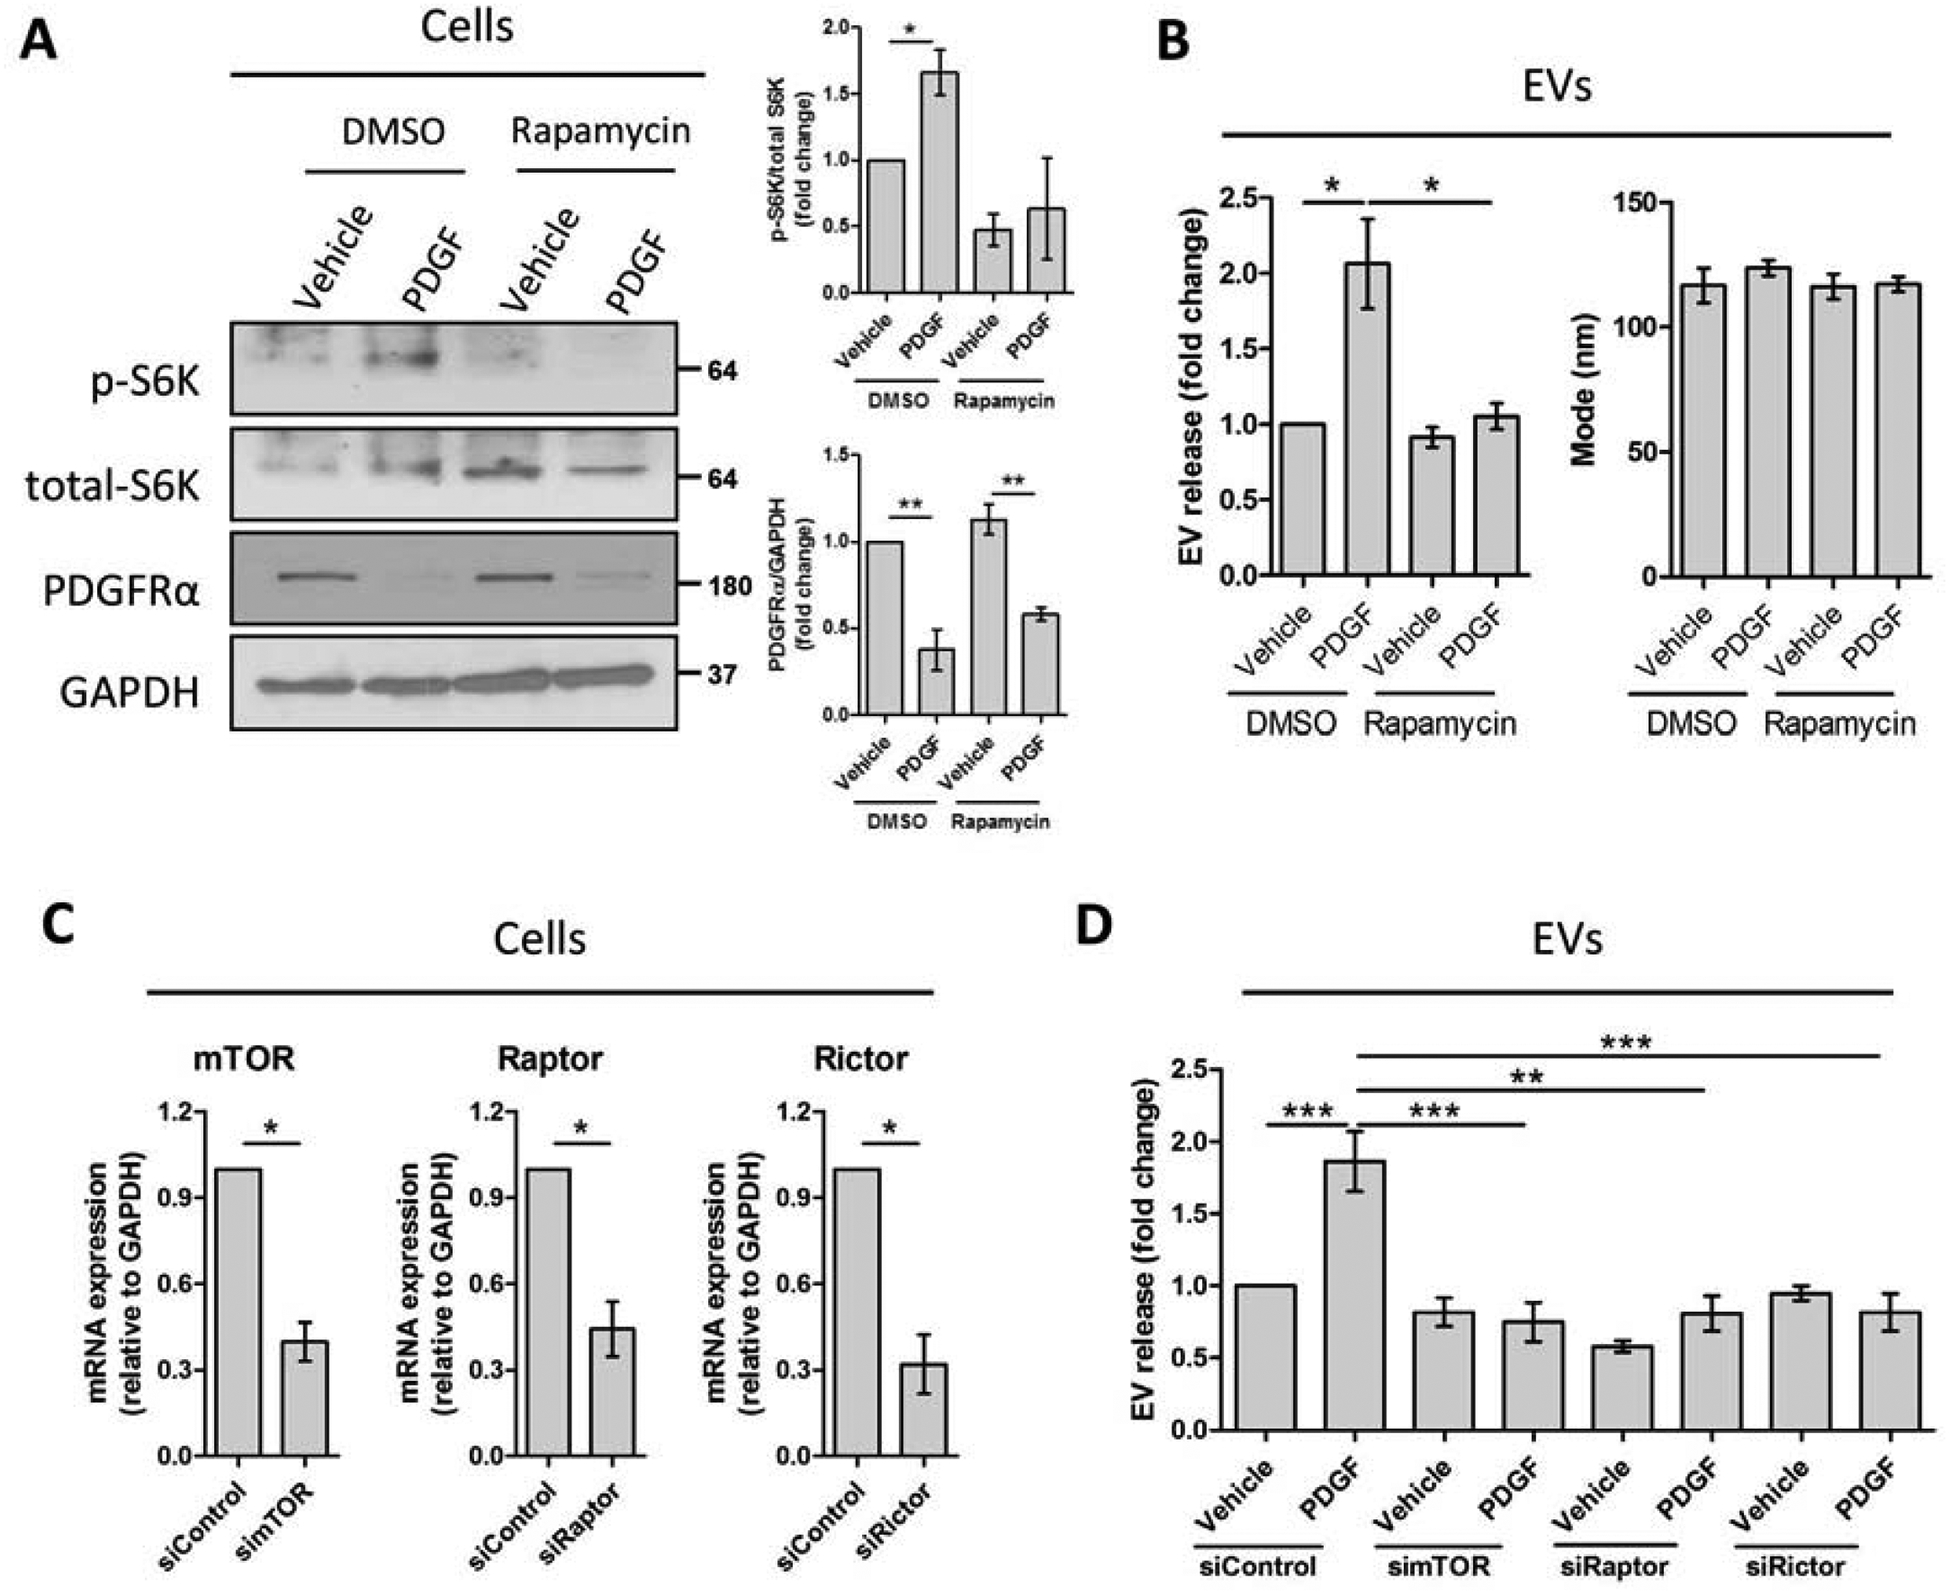
Primary human HSCs were treated with rapamycin for 1 hour. PDGF was added, and cells were cultured for 12 additional hours. (A-C, n = 3) (A) Whole cell lysates were examined by WB for p-S6K, total-S6K and PDGFRα and quantified by densitometry. (B) EV release and EV mode were measured by NTA. Primary human HSCs were transfected with control, mTOR, Raptor or Rictor siRNA (siControl, simTOR, siRaptor or siRictor, respectively). PDGF was added 48 hours later and cells were cultured for additional 12 hours. (C-D, n = 3) (C) mRNA levels of mTOR, Raptor and Rictor were measured by qPCR (paired t-test). (D) EV release was quantified by NTA. Graph bars represent SEM, one-way ANOVA with Bonferroni comparison, *p< 0.05, **p< 0.01.
Next, we examined the origin of mTOR-dependent EV release in primary human HSCs. Since MVBs, the origin of exosomes, can be degraded by autophagy and mTOR is an autophagy inhibitor, we investigated the role of mTOR signaling on exosome release. In our system, PDGF increased p62 protein levels, which were attenuated by rapamycin (Figure 4A), suggesting that PDGF inhibited autophagy through mTOR. Moreover, autophagy inhibition by bafilomycin A1 (Figure 4B) or autophagy-related 5 (Atg5) siRNA (Sup figure 4) significantly increased the exosome marker CD81 in the purified EV fraction, as well as the microvesicle marker Arf6[8] (Sup figurr 5). Based on these results, we investigated the role of mTOR signaling on the MVB pool in primary human HSCs, where CD63 is an MVB and exosome marker. Treatment of cells with PDGF increased the MVB pool, which was abolished by rapamycin, as demonstrated by immunofluorescence (Figure 4C). In line with this, rapamycin reduced PDGF-mediated exosome release as demonstrated by decreased CD81 and CD63 protein levels in the EV fraction (Figure 4D). These results suggest that mTOR signaling induces exosome release.
Fig. 4. Autophagy inhibition and ROCK1 activity increase PDGF-mediated EV release.
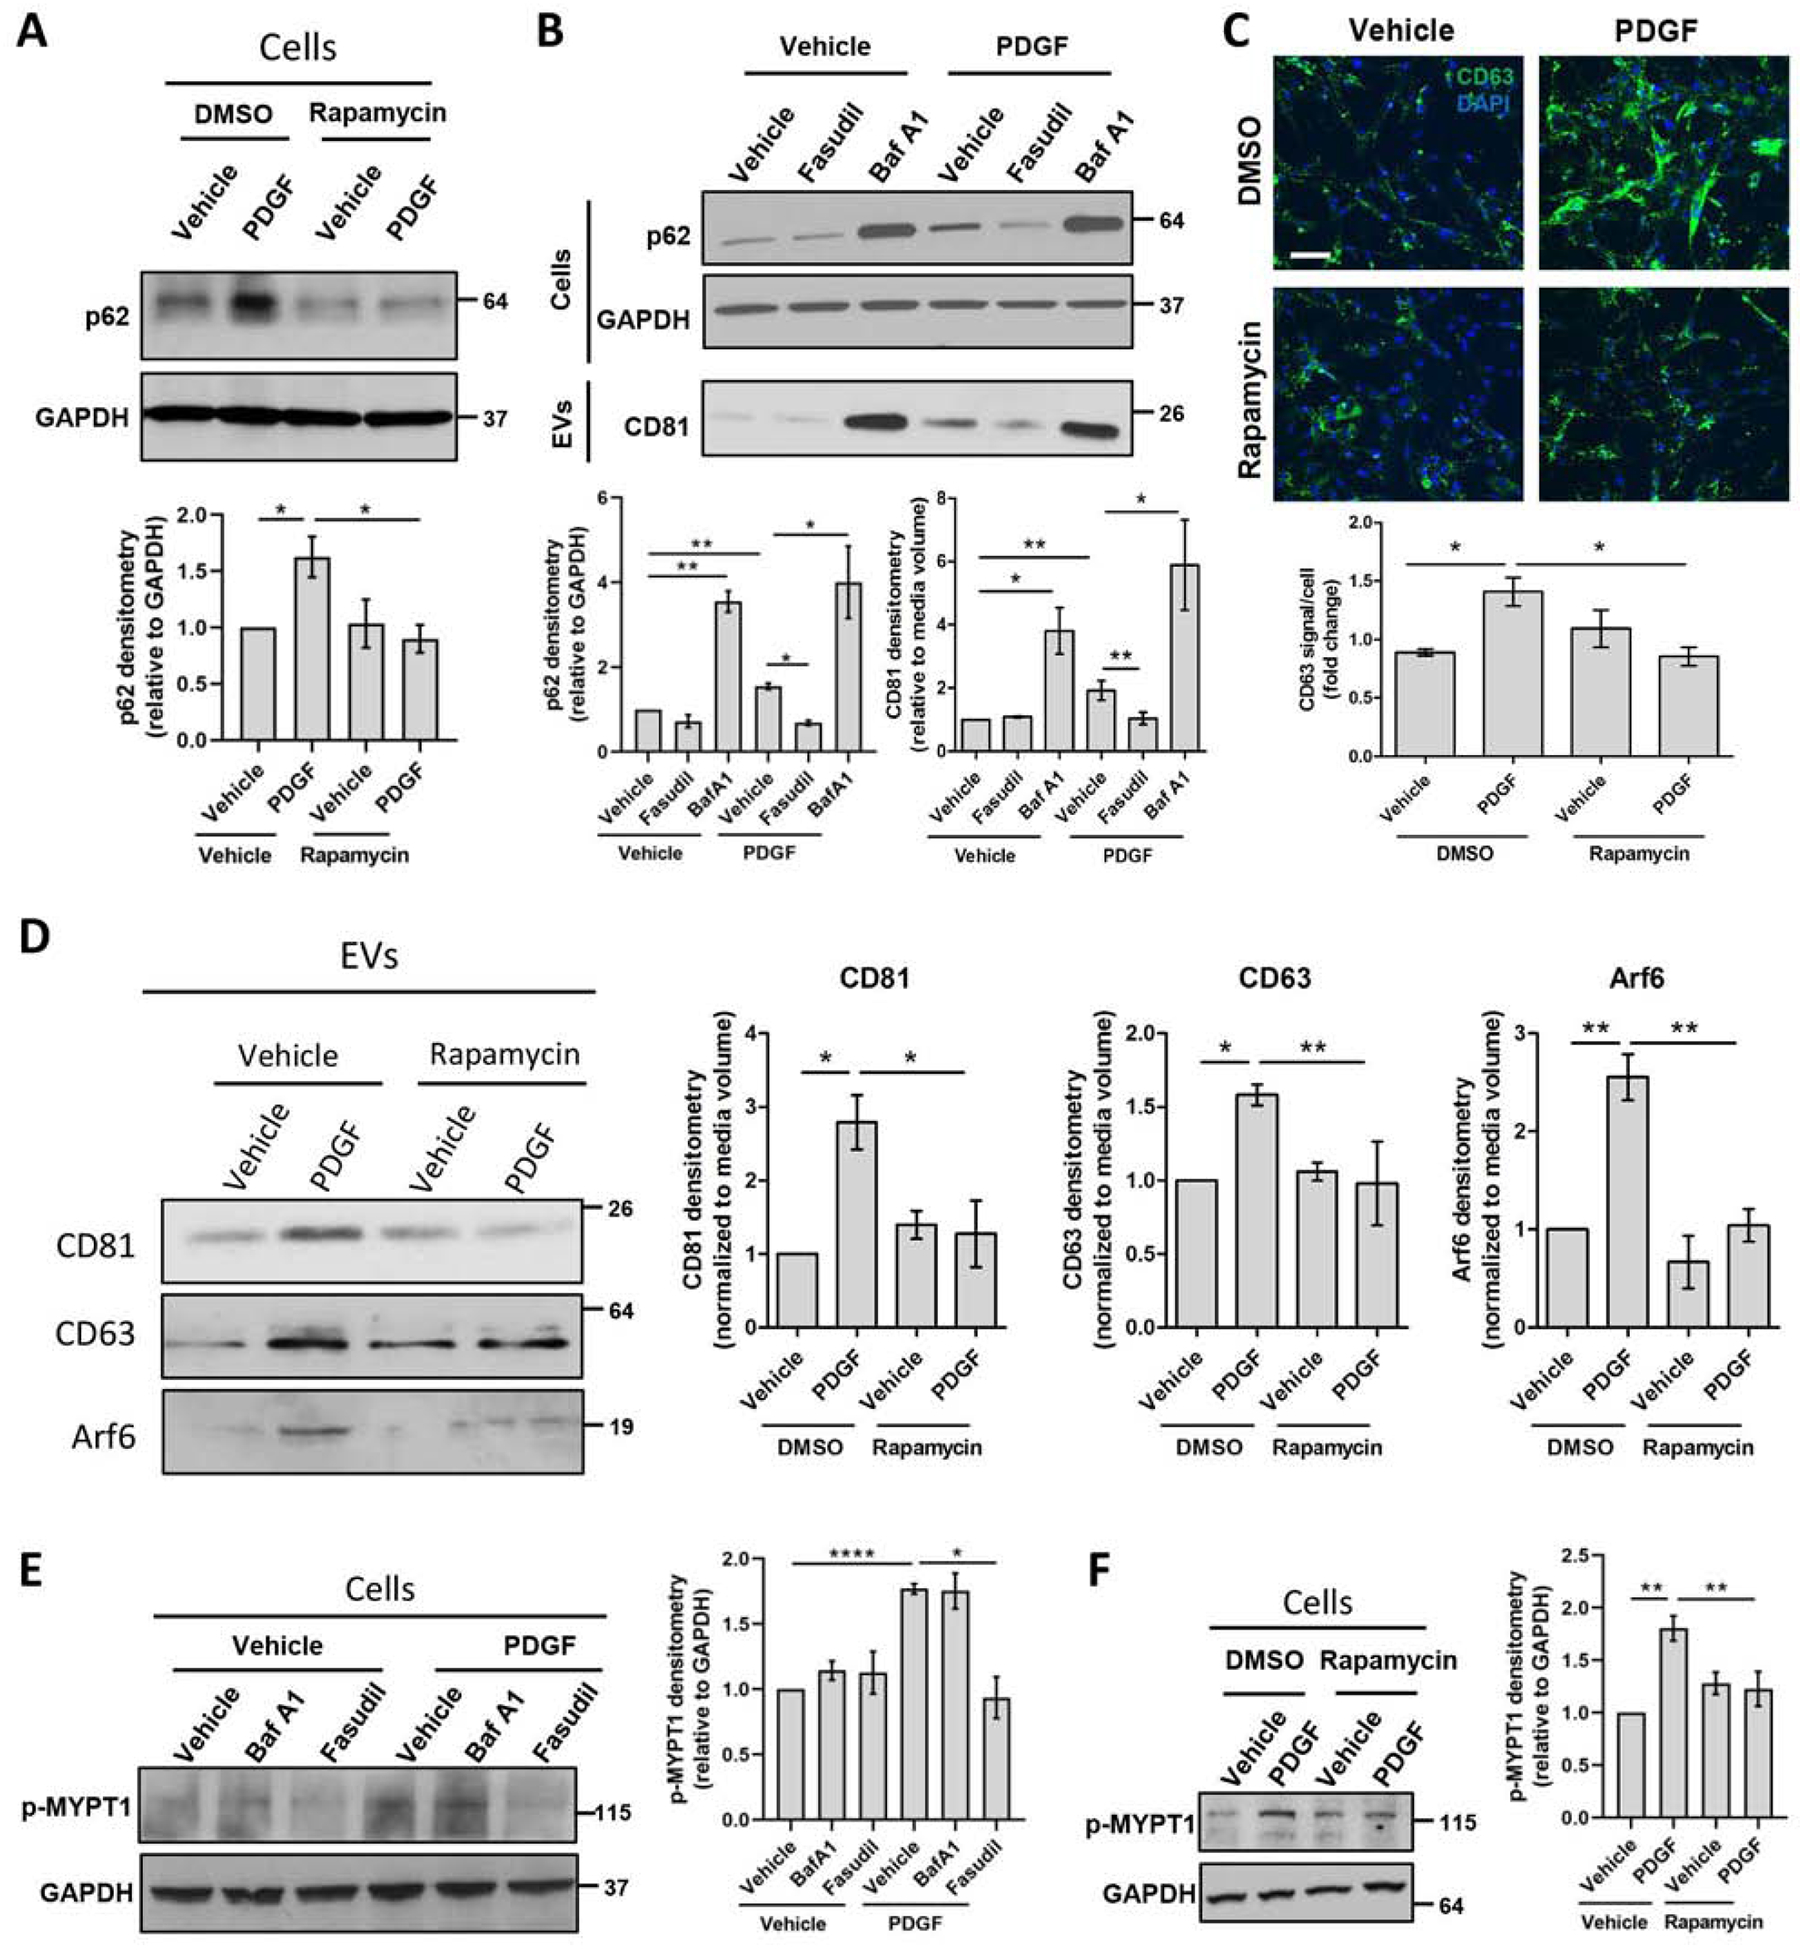
Primary human HSCs were treated with rapamycin, fasudil or bafilomycin A1 for 1 hour. PDGF was added and cells were cultured for 12 additional hours. (A) Whole cell lysates were examined by WB for p62 and quantified by densitometry. (n = 9) (B) Whole cell lysates and EVs were examined by WB for p62 (cells) and CD81 (EVs), and quantified by densitometry. (n = 7) (C) CD63 levels were assessed by immunostaining. (Scale bar: 100 μm, n = 6) (D) EV population was analyzed by WB for CD63, CD81 and Arf6, and quantified by densitometry. (n=3) (E-F) Whole cell lysates were examined by WB for phosphorylated MYPT1 and quantified by densitometry. (n = 6) Graph bars represent SEM, one-way ANOVA with Bonferroni comparison, *p<0.05, **p< 0.01, ***p< 0.001.
In contrast to exosomes, microvesicle release is dependent on ROCK1 activity.[11,30,31] Therefore, we next investigated the effect of mTOR signaling on ROCK1 activity and microvesicle release. PDGF treatment of primary human HSCs activated ROCK1 signaling as demonstrated by the increased levels of the phosphorylated ROCK1 downstream signaling molecule, myosin phosphatase target subunit 1 (MYPT1) (Figure 4E). This was abolished by treating HSCs with the ROCK1 inhibitor, fasudil (Figure 4E). Subsequently, ROCK1 inhibition by fasudil significantly decreased PDGF-mediated EV release, as demonstrated by microvesicle marker Arf6 (Sup figure 5) and exosomal marker CD81 (Figure 4B), suggesting a cross-talk between the mechanisms of exosome and microvesicle release. PDGF-mediated ROCK1 activity was also inhibited by rapamycin, as demonstrated by the attenuated MYPT1 phosphorylation (Figure 4F) suggesting that PDGF induced ROCK1 activation through mTOR. Furthermore, rapamycin reduced PDGF-mediated microvesicle release as demonstrated by decreased Arf6 protein levels in the EV fraction (Figure 4D). These data suggest that mTOR signaling induces microvesicle release.
In summary, mTOR signaling induces exosome release by inhibiting autophagic degradation of MVBs, and microvesicle release by activating ROCK1 signaling, which provide mechanistic insight into PDGF-mediated fibrogenic EV release.
mTOR-mediated EVs induce HSC migration in vitro
Receptor tyrosine kinase (RTK) signaling is prominent in fibrosis,[16,32–35] thus we assessed EV content utilizing a phospho-RTK protein array. We screened for active RTKs which can be transferred from EVs to the recipient cells. Primary human HSCs were treated with vehicle, PDGF, rapamycin or PDGF+rapamycin and EVs were collected after 12 hours. The results of the array showed that several phosphorylated RTKs were present in the EVs after PDGF treatment, such as fibroblast growth factor receptor 3 (FGFR3), tunica interna endothelial cell kinase (Tie2), anaplastic lymphoma kinase (ALK) and receptor tyrosine kinase-like orphan receptor 1 (ROR1) (Figure 5A). The most upregulated mTOR-dependent kinase (upregulated by PDGF and decreased by rapamycin) was phospho-FGFR3 (Figure 5A), an RTK involved in fibroblast migration.[36] This result was confirmed by performing two additional array replicates and by WB (Figure 5B). These data suggest that mTOR signaling not only promotes the release of the EVs but also mediates their enrichment with activated RTKs. Since the identified RTKs have been previously associated to cell migration,[36–39] we next examined the effect of these RTK-enriched EVs on HSC migration. Recipient primary human HSCs were plated at confluency, scratched and treated for 24 hours with EVs derived from vehicle, rapamycin, PDGF or PDGF+rapamycin-treated HSCs. EVs derived from PDGF-treated cells significantly increased recipient HSC migration, unlike EVs derived from PDGF+rapamycin-treated cells, when compared to EVs from vehicle-treated cells (Figure 5C). In summary, these results demonstrate that mTOR promotes the release of pro-migratory RTK-enriched EVs.
Fig. 5. mTOR-dependent EVs are pro-migratory by transferring phosphorylated RTKs.
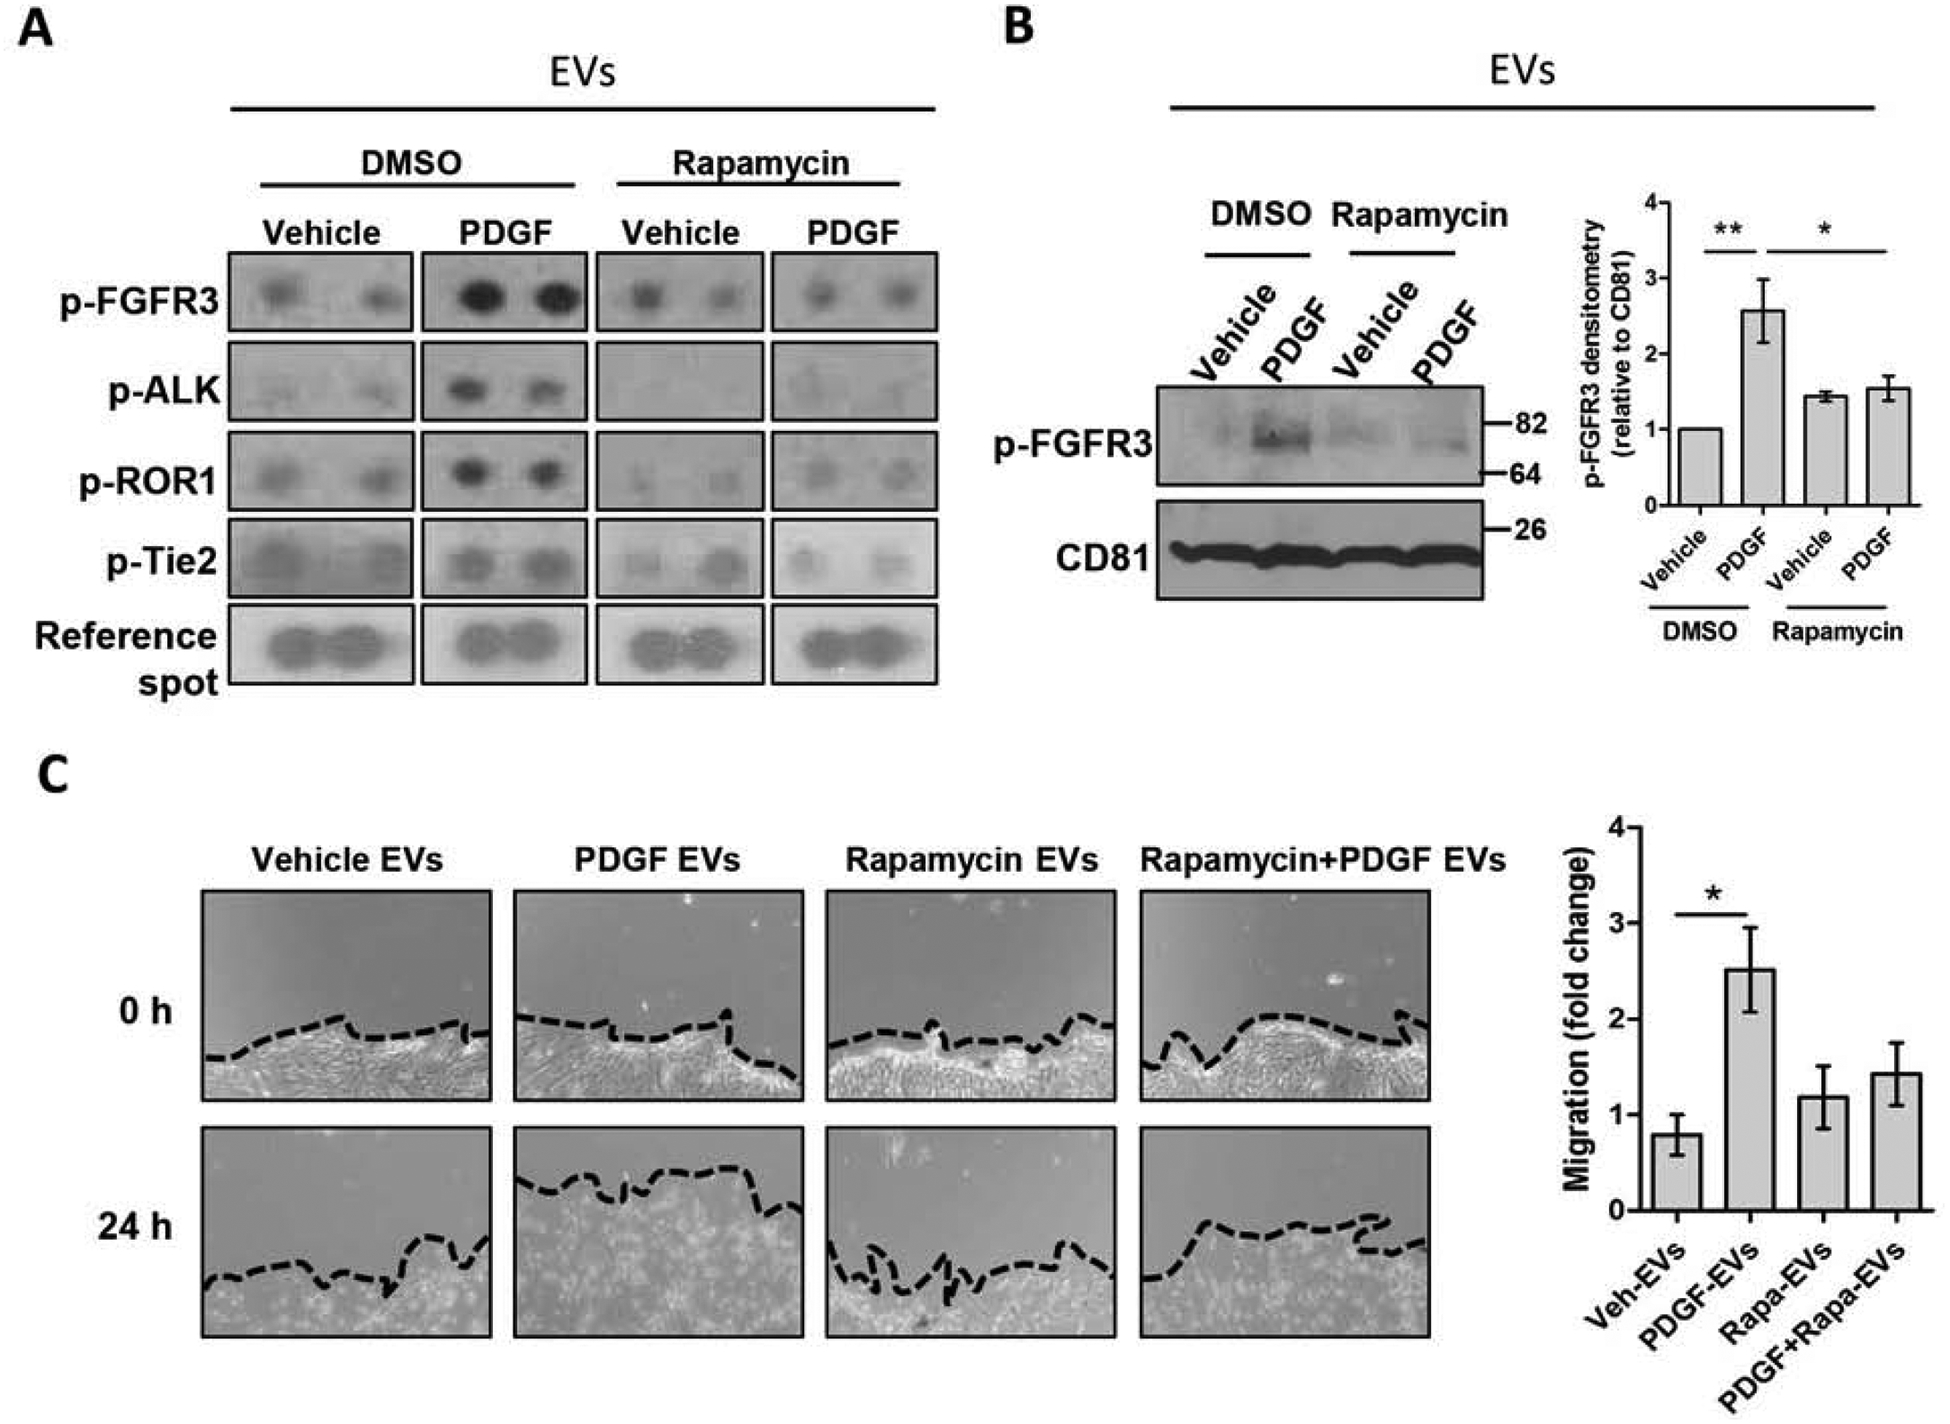
Primary human HSCs were treated with rapamycin for 1 hour. PDGF was added, and cells were cultured for 12 additional hours. (A-C) (A) Equal number of EVs were lysed and analyzed by a phospho-RTK protein array. (n = 3, images cropped) (C) Equal number of EVs were lysed and examined by WB for phosphorylated FGFR3 and CD81, and quantified by densitometry. (n = 3) (D) Confluent HSCs were scratched using a 10 μL pipette tip. Cells were washed and incubated with donor cell EVs in basal media for 24 hours. The migration of cells in three pre-selected areas was measured at 0 and 24 hours (n = 4). Graph bars represent SEM, one-way ANOVA with Bonferroni comparison *p< 0.05, **p< 0.01.
Deletion of HSC-specific SHP2 decreases liver fibrosis in vivo.
As SHP2 is an upstream regulator of mTOR-dependent EV release, we examined its levels in patients with liver cirrhosis. In whole liver lysates, SHP2 was increased in patients with liver cirrhosis compared to healthy individuals (Figure 6A). We utilized a recently published single cell RNA-seq database[40] (GEO accession number GSE136103) to examine gene expression in healthy versus cirrhotic human liver cells. SHP2 was expressed by the majority of liver cells (Sup figure 6A). However, PDGFR, an important component in our mechanism, was expressed mainly by mesenchymal cells (hepatic stellate cells and myofibroblasts) (Sup figure 6B). Therefore, we sought to investigate the effect of HSC-specific SHP2 deletion in liver fibrosis in mice. We crossed PDGFRβCreERT2 mice with SHP2fl/fl mice to obtain PDGFRβCreERT2/SHP2fl/fl mice expressing the chimeric CreERT2 recombinase in PDGFRβ+ cells. As a first step, the efficiency of the CreERT was confirmed by crossing PDGFRβCreERT2 mice with Rosa26-Tomato-STOP-GFP mice where the Tomato sequence is followed by a STOP codon and floxed by loxP sites (Sup figure 7). In the progeny, upon tamoxifen administration, in the PDGFRβ+ cells CreERT enters the nucleus and deletes the Tomato-STOP sequence leading to GFP expression, while in the other cells only Tomato gene is expressed (Sup figure 7). We identified that GFP+ cells were situated in a non-parenchymal position (Sup figure 8A–B). We confirmed by alpha smooth muscle actin (αSMA) immunofluorescence that 74% of αSMA+ HSCs in the liver express the CreERT2 (Sup figure 8C).
Fig. 6. SHP2 deletion selectively in HSCs reduces liver fibrosis.
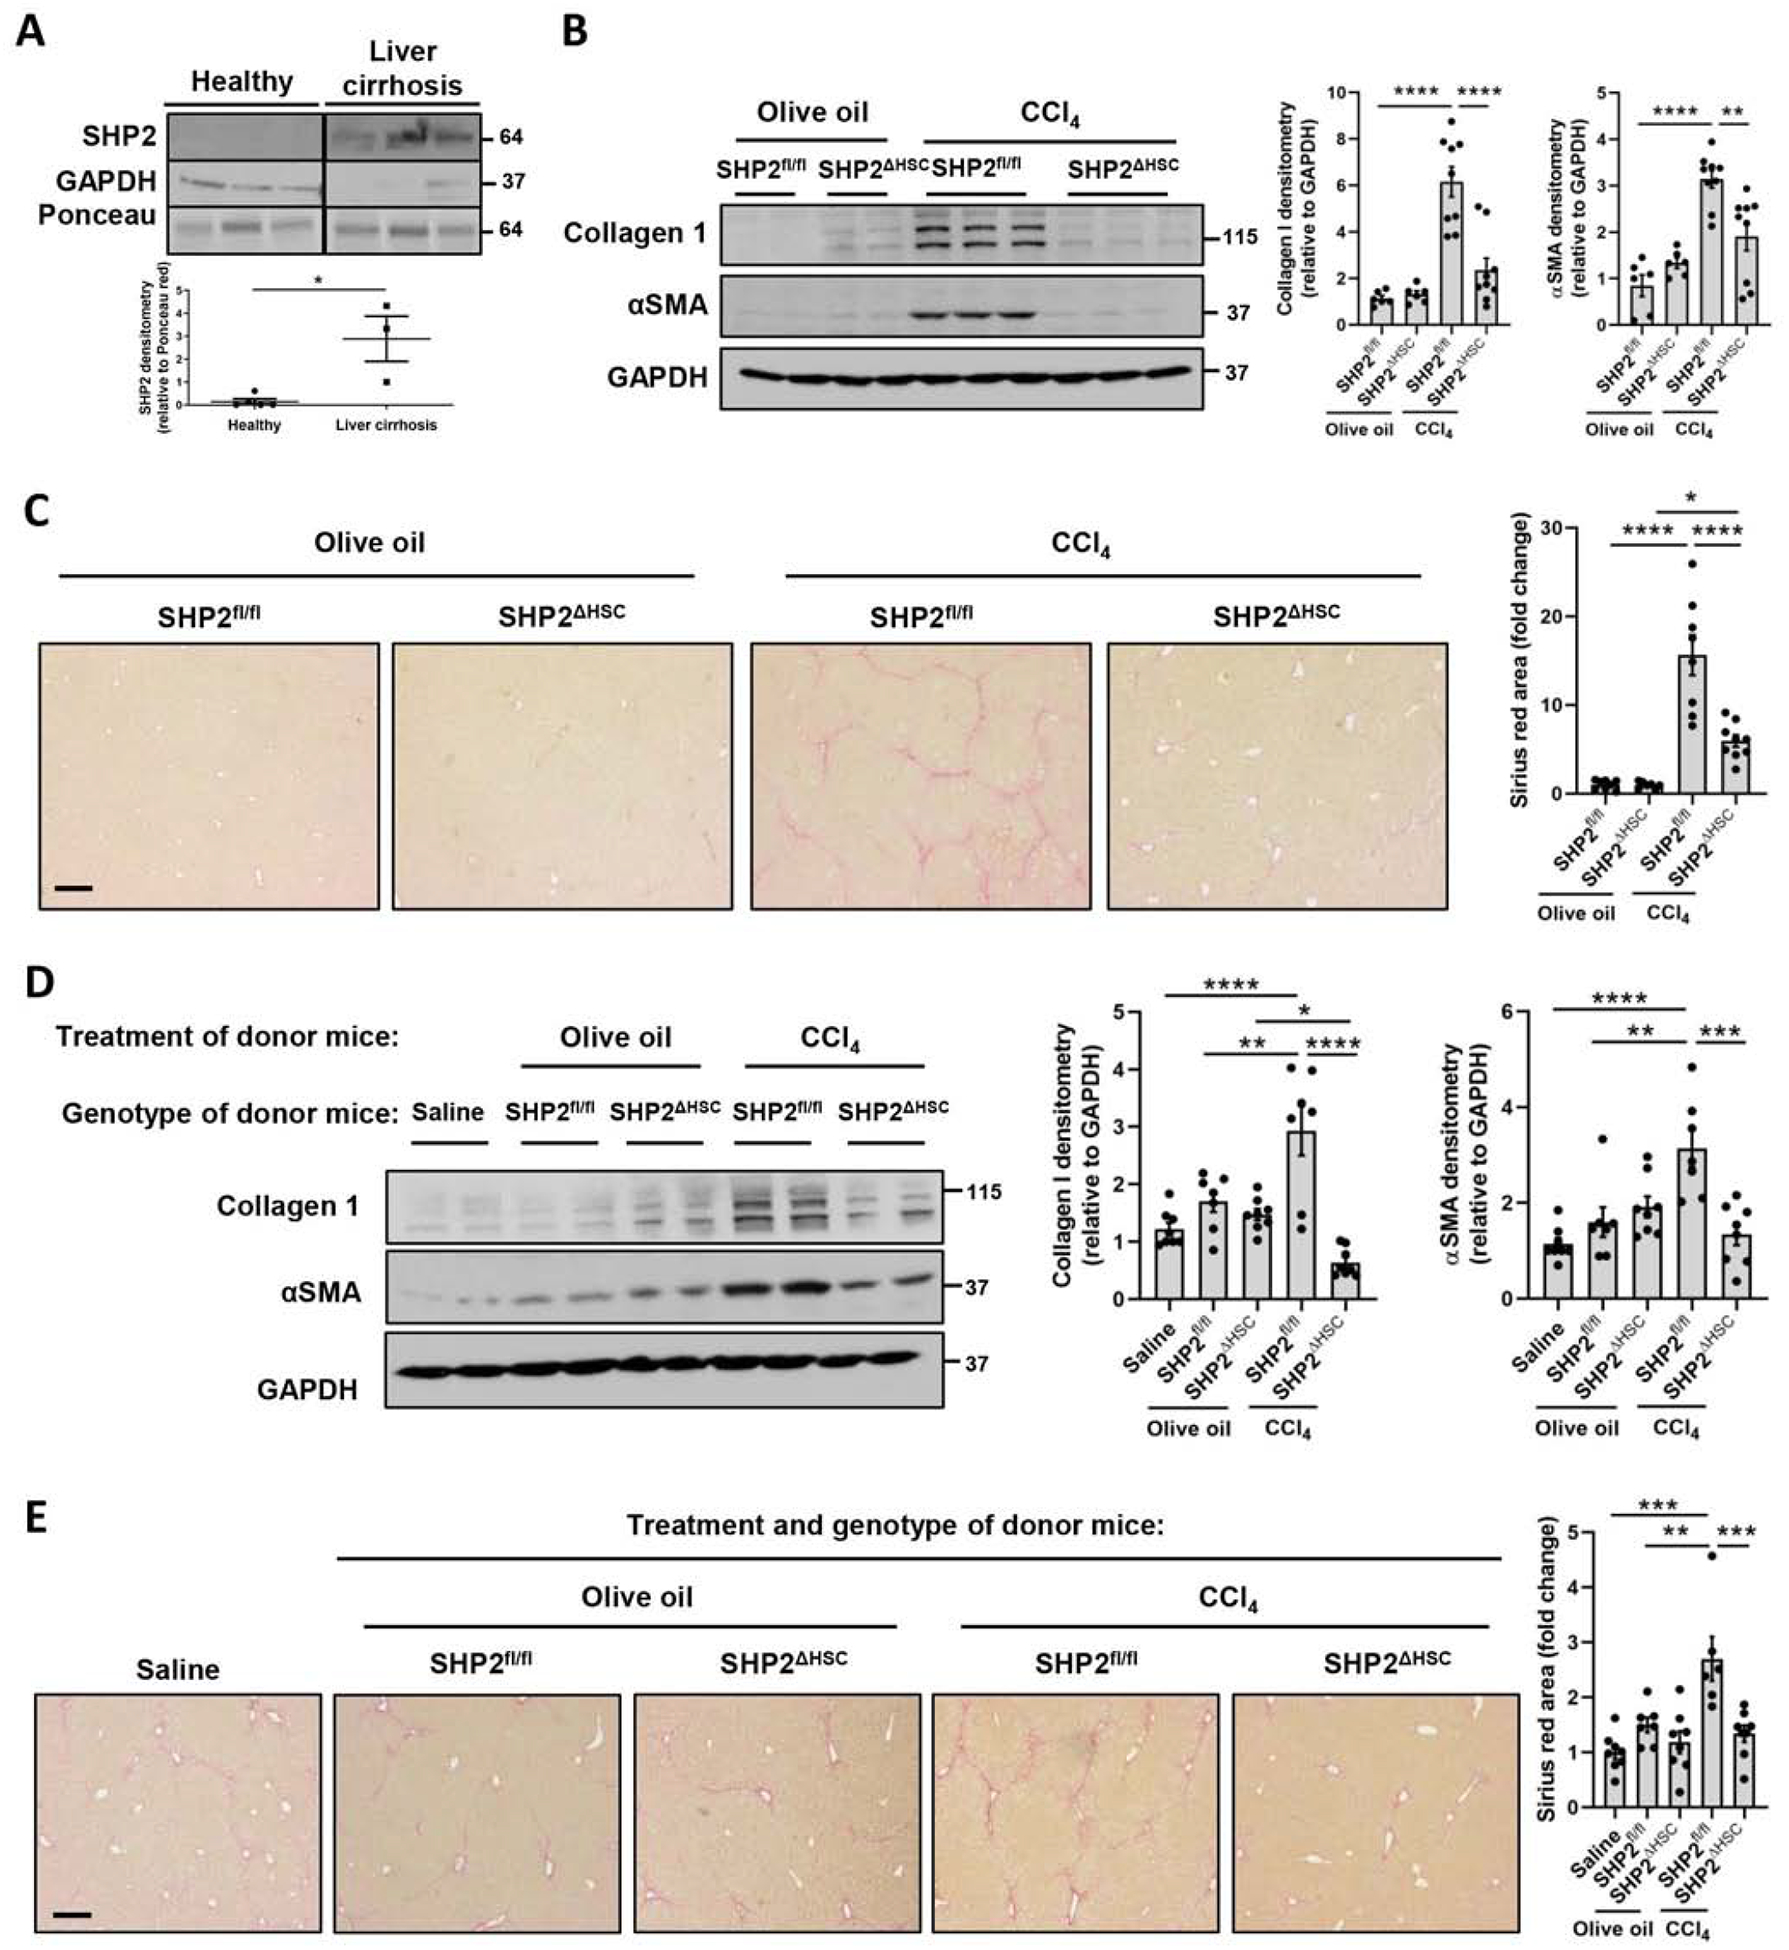
(A) Patient liver samples were lysed and analyzed by WB. 3–5 patients/group, WB images cropped from the same blot, graph bars represent SEM, *p<0.05 Mann-Whitney test. (B-C) SHP2fl/fl or SHP2ΔHSC male and female mice were treated with either olive oil or CCl4 for 6 weeks. Livers were analyzed by WB (C) and Sirius red staining (D). (n= 6–8 animals/group) (D-E) C57Bl/6 male and female mice were treated for 4 weeks with phosphate-buffered saline or equal number of EVs derived from donor mice as indicated in parallel with CCl4. Livers were analyzed by WB (E) and Sirius red (F) (n = 7–8 animals/group). Scale bars: 20μm, graph bars represent SEM, one-way ANOVA with Bonferroni comparison **p< 0.01, ***p< 0.001.
Next we examined the effect of HSC-specific SHP2 deletion on the establishment of liver fibrosis, which was induced by carbon tetrachloride (CCl4) administration for 6 weeks. Livers were then collected and analyzed by Sirius red and WB. As expected, hepatic collagen I, αSMA protein levels, and Sirius red staining were increased in littermate control mice (SHP2fl/fl) after chronic CCl4 (Figure 6B–C). However, hepatic fibrosis was significantly reduced when the SHP2 gene was deleted selectively in HSCs (SHP2ΔHSC mice), as demonstrated by protein levels of collagen I, αSMA, and Sirius red staining (Figure 6B–C). In addition, circulating EVs were examined for p-FGFR3 level, which was not different across the groups (Sup figure 9). To test for intermediate level effects, we utilized SHP2Δ/WT heterozygous mice. In this model, the deletion of only one allele of SHP2 was sufficient to reduce liver fibrosis (Sup figure 10). As a second injury model, we performed bile duct ligation (BDL) surgeries on SHP2ΔHSC mice or their SHP2fl/fl littermate controls. Similarly to the CCl4 injury model, after BDL the SHP2ΔHSC mice presented significant reduction of fibrosis compared to the control mice, as demonstrated by Sirius red staining and WB (Sup figure 11). In summary, SHP2 deletion selectively in HSCs significantly attenuates liver fibrosis.
EVs from mice with HSC-specific SHP2 deletion reduce CCl4-mediated liver fibrosis in WT mice
We have demonstrated that EVs derived from PDGF-treated HSCs are fibrogenic[20] and SHP2 is critical for liver fibrosis (Figure 6B–C). Therefore, we next investigated how HSC-specific SHP2 influences the fibrogenic potential of circulating EVs and how these EVs impact liver fibrosis in vivo. First, we examined the cell-specificity of EV uptake. Flag-tagged EVs generated in LX2 cells were administered intraperitoneally to recipient wild-type mice and livers were examined 24 hours later by double immunofluorescence staining. The results demonstrate co-localization of EVs with HSCs, macrophages and endothelial cells, suggesting EV uptake by these cell types (Sup figure 12). Next, donor mice, SHP2ΔHSC mice or SHP2fl/fl littermate controls, received either olive oil or CCl4 for 6 weeks followed by isolation of circulating EVs. The concentration of small EVs in a mouse circulation is 1010 EVs/mL (Sup figure 13A). To avoid potential side effects by overloading the mice with a high amount of EVs, saline or 2×10⁸ EVs from each donor group were transplanted into WT mice daily by intraperitoneal injections in conjunction with CCl4 for 4 weeks (Sup figure 13B). Compared to saline administration, EVs from olive oil-treated SHP2fl/fl or SHP2ΔHSC donor mice did not affect liver fibrosis. However, EVs from CCl4treated SHP2fl/fl control mice significantly increased CCl4-induced liver fibrosis as demonstrated by WB and Sirius red (Figure 6D–E) suggesting that these EVs are fibrogenic. Furthermore, EVs isolated from CCl4-treated SHP2ΔHSC mice significantly reduced CCl4-induced liver fibrosis (Figure 6D–E), suggesting that the deletion of SHP2 selectively in HSCs reduces the fibrogenic potential of the EVs. In summary, SHP2 deletion selectively in HSCs significantly attenuates the fibrogenic profile of circulating EVs.
Discussion
This study identified a novel mechanism involving autophagy as an essential process regulating fibrogenic EV release from HSCs in liver fibrosis. We discovered a new role for REDD1, an endogenous inhibitor of mTOR signaling, in the repression of fibrogenic EV release. We demonstrated that mTOR signaling is crucial for the release of HSC-derived pro-migratory EVs by inhibiting autophagy and activating ROCK1 signaling. Inhibition of autophagy leads to the release of MVB content as exosomes, while the activation of ROCK1 signaling leads to the release of plasma membrane-derived microvesicles. Furthermore, we provide evidence that mTOR-mediated EVs are pro-migratory in vitro. Finally, blocking this mechanism in vivo attenuates circulating pro-fibrotic EVs and liver fibrosis in mice (Figure 7).
Fig. 7. Proposed mechanism.
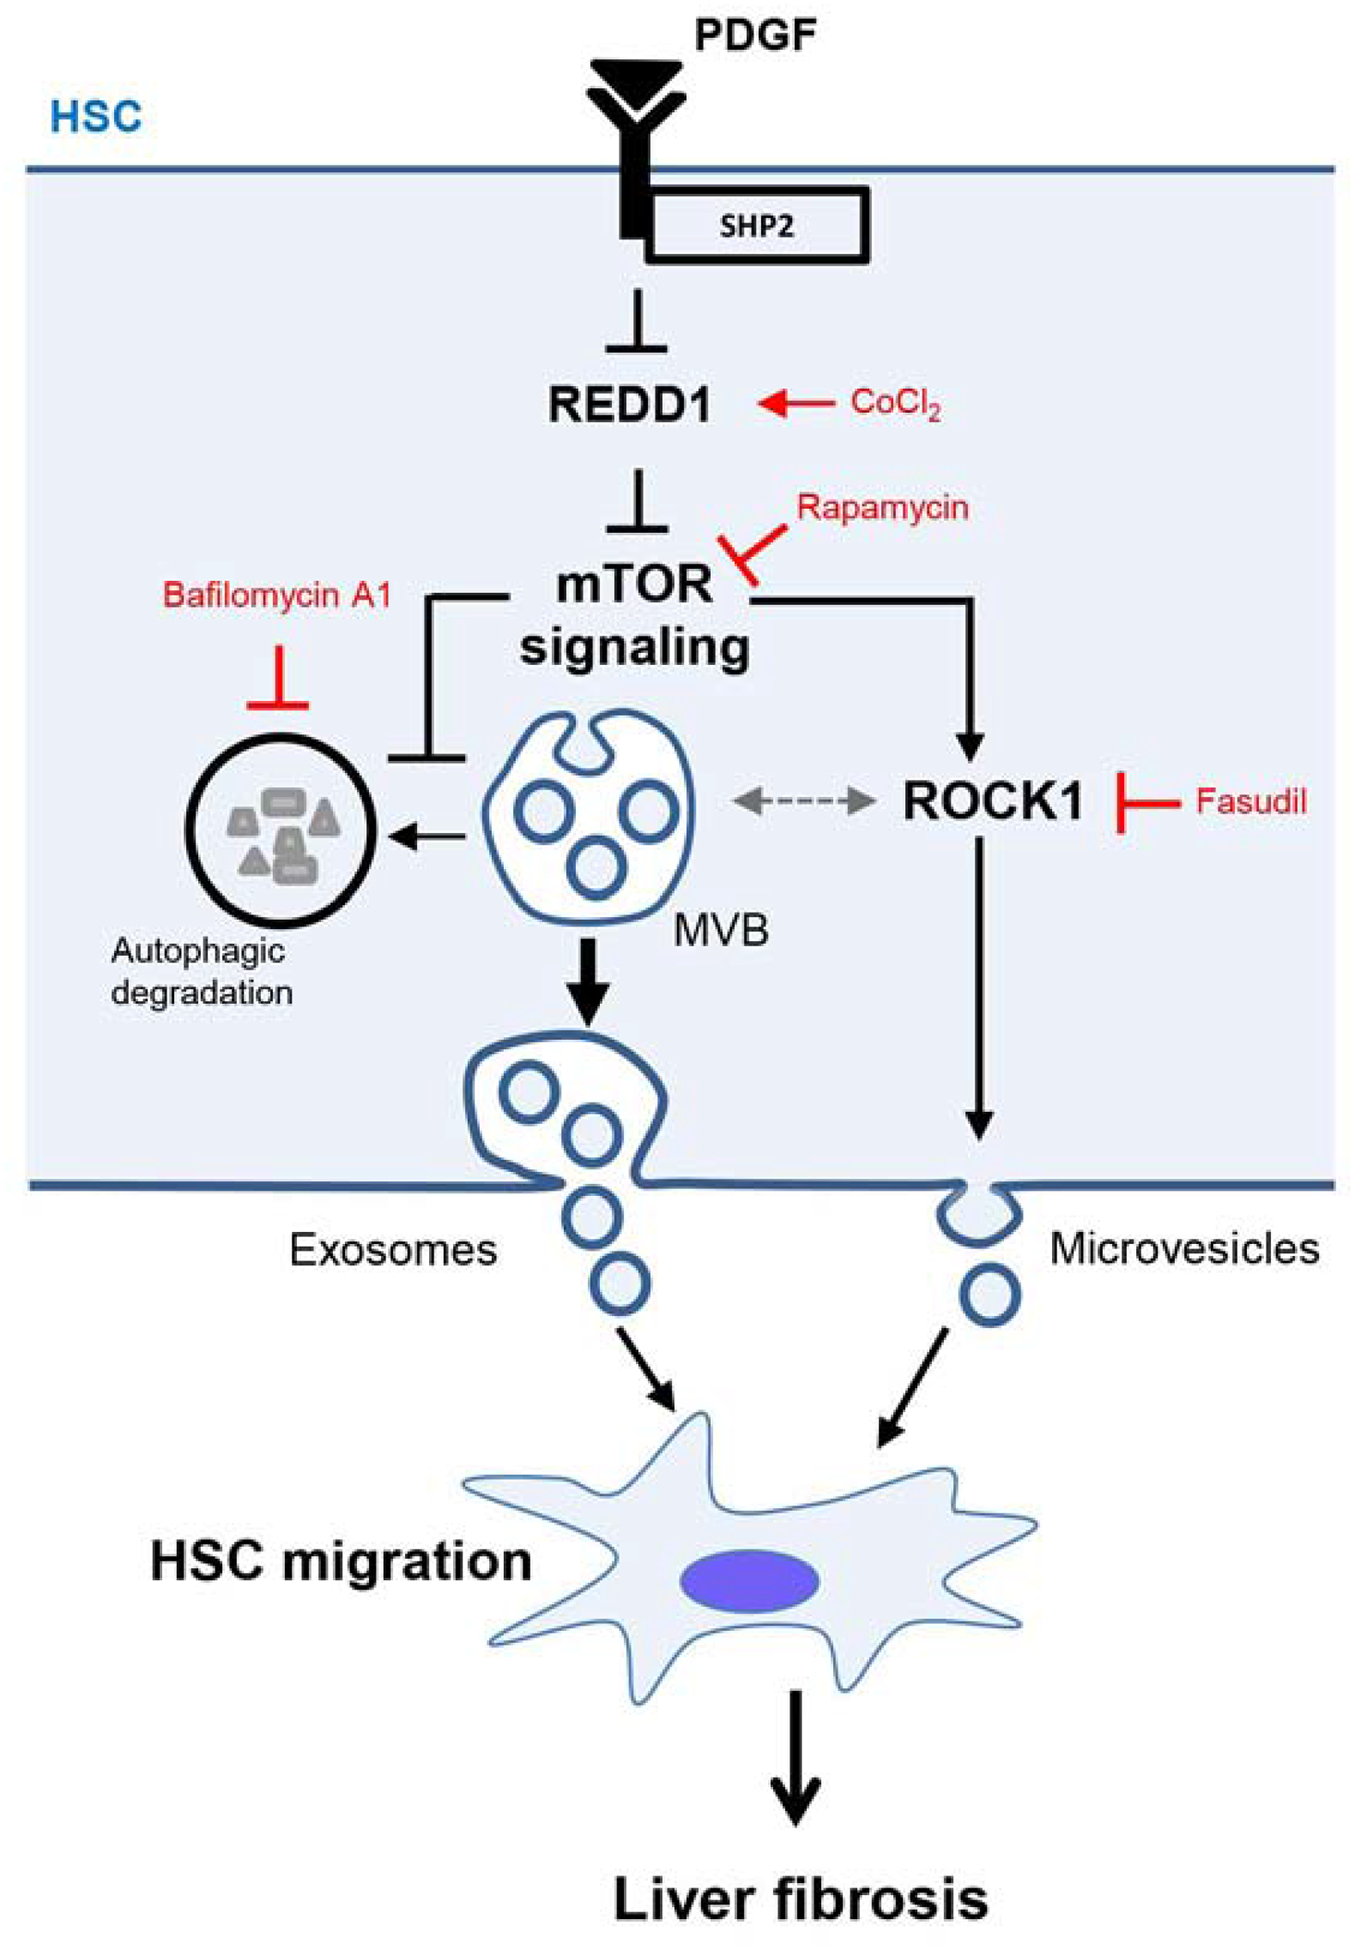
In HSCs, PDGF and SHP2 repress REDD1 expression to amplify mTOR signaling. In turn, mTOR induces exosome release by inhibiting MVB autophagic degradation and microvesicle release by activating ROCK1 signaling. These exosomes and microvesicles induce other HSC migration leading to an amplification of the pro-fibrotic signals and in vivo liver fibrosis. In this schema, CoCl2 stimulates REDD1 expression, rapamycin inhibits mTOR, bafilomycin A1 inhibits autophagic degradation and fasudil inhibits ROCK1 signaling.
Autophagy is proposed to induce HSC activation by degrading lipid droplets. This process is mediated by a specific type of selective autophagy called lipophagy.[41] Consistently, TGFβ can increase autophagy flux in lung fibroblasts.[42] However, the importance of autophagy to numerous cellular mechanisms clouds its canonical categorization as a pro- or anti-fibrotic process. In hepatocytes, autophagy has been described as an anti-fibrogenic pathway since it generates survival signals for hepatocytes.[2] A recent study describes that in alcoholic liver disease, autophagy inhibition in hepatocytes is linked to increased EV release.[43] Nevertheless, the exact mechanism of autophagy-dependent EVs, especially in HSCs and liver fibrosis, remains elusive. In our system, we revealed that PDGF and SHP2, but not TGFβ, mediated activation of HSCs decreased autophagy which correlated with an increase in fibrogenic EV release. Consistently, autophagy inhibition enhanced EV release. Taken together these results demonstrate that, unlike TGFβ stimulation, autophagy is inhibited in PDGF-stimulated HSCs leading to enhanced EV release.
A canonical autophagy inhibitor is mTOR,[26] which is also reported to inhibit lysosomal degradation.[44] Moreover, autophagy can be activated by the mTOR endogenous inhibitor, REDD1 which mainly inhibits the mTORC1 downstream effector p-S6K.[28] It has been shown that in cardiomyocytes SHP2, the PDGF downstream signaling molecule, activates mTOR signaling.[45] Herein, we made the novel observation of REDD1 as a link between SHP2 and mTOR in HSCs and liver fibrosis. We demonstrated that PDGF and SHP2 repressed the inhibitor of mTOR, REDD1, supporting increased mTOR signaling and EV release. EVs derived from cancer cells have been reported to activate mTOR signaling in recipient cells.[46] Nevertheless, the mechanism by which mTOR signaling affects EV release in the donor cells remains unknown. In our study, we revealed that in HSCs mTOR signaling induced exosome release by inhibiting MVB degradation. Moreover, we found that mTOR induced ROCK1 activity, which led to HSC-derived microvesicle release, consistent with the known role of ROCK1 in inducing microvesicle release by hepatocytes.[11] These results indicate that mTOR induces both exosome and microvesicle release by simultaneously inhibiting autophagy and activating ROCK1 (Figure 7).
mTOR and SHP2 play important roles in cancer by stimulating cell proliferation and migration.[47–49] However, the utilization of inhibitors has given divergent results[50,51] possibly due to cell heterogeneity and cell specific effects. Previously, it has been demonstrated that in dermal and pulmonary fibrosis SHP2 disruption suppresses fibroblast activation and exerts anti-fibrotic role.[19] Nevertheless, the role of HSC-specific SHP2 in liver fibrosis remains under-evaluated. Here, we demonstrated that inhibiting mTOR signaling in EV donor cells upon pro-migratory PDGF stimulation reduced the enrichment of EVs with activated RTKs and therefore their migratory potential. These activated RTKs, such as FGFR3 and Tie2, are also reported to be involved in fibrosis[36,52–54] and serve as fibrogenic EV cargos. Along this line, in vivo liver fibrosis was attenuated when mice were transplanted with EVs derived from CCl4-treated SHP2 conditional knockout mice compared to CCl4-treated control mice, confirming the fibrogenic potential of SHP2-dependent EVs. Moreover, the deletion of SHP2, upstream of mTOR, selectively in HSCs attenuated circulating fibrogenic EVs and liver fibrosis in both CCl4 and BDL mouse models. Taken together, these results suggest that blocking the mechanism which leads to pro-migratory and pro-fibrotic EVs attenuates in vivo liver fibrosis.
In conclusion, SHP2 in HSCs exerts its pro-fibrotic role via enhancing the release of fibrogenic EVs through inhibiting autophagy, REDD1 and activating mTOR pathway. Inhibition of SHP2-mTOR signaling might serve as a novel target in the treatment of liver fibrosis.
Supplementary Material
Highlights.
PDGF and SHP2 induce fibrogenic EV release by activating mTOR signaling.
mTOR signaling inhibits autophagy leading to the release of MVB content as exosomes.
mTOR signaling activates ROCK signaling leading to the release of microvesicles.
Blocking this mechanism in vivo inhibits the circulation of pro-fibrotic exosomes and microvesicles, and ultimately liver fibrosis in mice.
Acknowledgments
The authors thank Dr. McNiven’s, Dr. Gores’ and Dr. Malhi’s groups, the Mayo Clinic Genomics and Molecular Biology Cores, Animal Facilities and Mayo Clinic Center for Cell Signaling in Gastroenterology, the First Affiliated Hospital of Xi’an Jiaotong University, Shengjing Hospital of China Medical University.
Financial support: Supported by the AASLD Foundation Pinnacle Research Award and a Pilot and Feasibility Award from the Mayo Clinic Center for Cell Signaling in Gastroenterology (P30DK084567) (EK), and National Institutes of Health (NIH) USA R01 AA021171 (VHS).
Footnotes
Publisher's Disclaimer: This is a PDF file of an unedited manuscript that has been accepted for publication. As a service to our customers we are providing this early version of the manuscript. The manuscript will undergo copyediting, typesetting, and review of the resulting proof before it is published in its final form. Please note that during the production process errors may be discovered which could affect the content, and all legal disclaimers that apply to the journal pertain.
Conflict of interest: none.
References
- [1].Xu J, Camfield R, Gorski SM. The interplay between exosomes and autophagy - partners in crime. J Cell Sci 2018;131. [DOI] [PubMed] [Google Scholar]
- [2].Allaire M, Rautou PE, Codogno P, Lotersztajn S. Autophagy in liver diseases: Time for translation? J Hepatol 2019;70:985–998. [DOI] [PubMed] [Google Scholar]
- [3].Ni HM, Chao X, Yang H, Deng F, Wang S, Bai Q, et al. Dual Roles of Mammalian Target of Rapamycin in Regulating Liver Injury and Tumorigenesis in Autophagy-Defective Mouse Liver. Hepatology 2019. [DOI] [PMC free article] [PubMed] [Google Scholar]
- [4].Hammoutene A, Biquard L, Lasselin J, Kheloufi M, Tanguy M, Vion AC, et al. A defect in endothelial autophagy occurs in patients with nonalcoholic steatohepatitis and promotes inflammation and fibrosis. J Hepatol 2019. [DOI] [PubMed] [Google Scholar]
- [5].Weiskirchen R, Tacke F. Relevance of Autophagy in Parenchymal and Non-Parenchymal Liver Cells for Health and Disease. Cells 2019;8. [DOI] [PMC free article] [PubMed] [Google Scholar]
- [6].Neef M, Ledermann M, Saegesser H, Schneider V, Reichen J. Low-dose oral rapamycin treatment reduces fibrogenesis, improves liver function, and prolongs survival in rats with established liver cirrhosis. J Hepatol 2006;45:786–796. [DOI] [PubMed] [Google Scholar]
- [7].Perez de Obanos MP, Lopez Zabalza MJ, Prieto J, Herraiz MT, Iraburu MJ. Leucine stimulates procollagen alpha1(I) translation on hepatic stellate cells through ERK and PI3K/Akt/mTOR activation. J Cell Physiol 2006;209:580–586. [DOI] [PubMed] [Google Scholar]
- [8].Hirsova P, Ibrahim SH, Verma VK, Morton LA, Shah VH, LaRusso NF, et al. Extracellular vesicles in liver pathobiology: Small particles with big impact. Hepatology 2016;64:2219–2233. [DOI] [PMC free article] [PubMed] [Google Scholar]
- [9].Eguchi A, Kostallari E, Feldstein AE, Shah VH. Extracellular vesicles, the liquid biopsy of the future. J Hepatol 2019;70:1292–1294. [DOI] [PMC free article] [PubMed] [Google Scholar]
- [10].Eguchi A, Lazaro RG, Wang J, Kim J, Povero D, Willliams B, et al. Extracellular vesicles released by hepatocytes from gastric infusion model of alcoholic liver disease contain a MicroRNA barcode that can be detected in blood. Hepatology 2017;65:475–490. [DOI] [PMC free article] [PubMed] [Google Scholar]
- [11].Hirsova P, Ibrahim SH, Krishnan A, Verma VK, Bronk SF, Werneburg NW, et al. Lipid-Induced Signaling Causes Release of Inflammatory Extracellular Vesicles From Hepatocytes. Gastroenterology 2016;150:956–967. [DOI] [PMC free article] [PubMed] [Google Scholar]
- [12].Verma VK, Li H, Wang R, Hirsova P, Mushref M, Liu Y, et al. Alcohol stimulates macrophage activation through caspase-dependent hepatocyte derived release of CD40L containing extracellular vesicles. J Hepatol 2016;64:651–660. [DOI] [PMC free article] [PubMed] [Google Scholar]
- [13].Edgar JR, Manna PT, Nishimura S, Banting G, Robinson MS. Tetherin is an exosomal tether. Elife 2016;5. [DOI] [PMC free article] [PubMed] [Google Scholar]
- [14].Villarroya-Beltri C, Baixauli F, Mittelbrunn M, Fernandez-Delgado I, Torralba D, Moreno-Gonzalo O, et al. ISGylation controls exosome secretion by promoting lysosomal degradation of MVB proteins. Nat Commun 2016;7:13588. [DOI] [PMC free article] [PubMed] [Google Scholar]
- [15].Kostallari E, Shah VH. Pericytes in the Liver. Adv Exp Med Biol 2019;1122:153–167. [DOI] [PMC free article] [PubMed] [Google Scholar]
- [16].Kikuchi A, Monga SP. PDGFRalpha in liver pathophysiology: emerging roles in development, regeneration, fibrosis, and cancer. Gene Expr 2015;16:109–127. [DOI] [PMC free article] [PubMed] [Google Scholar]
- [17].Mederacke I, Hsu CC, Troeger JS, Huebener P, Mu X, Dapito DH, et al. Fate tracing reveals hepatic stellate cells as dominant contributors to liver fibrosis independent of its aetiology. Nat Commun 2013;4:2823. [DOI] [PMC free article] [PubMed] [Google Scholar]
- [18].Bazenet CE, Gelderloos JA, Kazlauskas A. Phosphorylation of tyrosine 720 in the platelet-derived growth factor alpha receptor is required for binding of Grb2 and SHP-2 but not for activation of Ras or cell proliferation. Mol Cell Biol 1996;16:6926–6936. [DOI] [PMC free article] [PubMed] [Google Scholar]
- [19].Zehender A, Huang J, Gyorfi AH, Matei AE, Trinh-Minh T, Xu X, et al. The tyrosine phosphatase SHP2 controls TGFbeta-induced STAT3 signaling to regulate fibroblast activation and fibrosis. Nat Commun 2018;9:3259. [DOI] [PMC free article] [PubMed] [Google Scholar]
- [20].Kostallari E, Hirsova P, Prasnicka A, Verma VK, Yaqoob U, Wongjarupong N, et al. Hepatic stellate cell-derived platelet-derived growth factor receptor-alpha-enriched extracellular vesicles promote liver fibrosis in mice through SHP2. Hepatology 2018;68:333–348. [DOI] [PMC free article] [PubMed] [Google Scholar]
- [21].N’Diaye EN, Kajihara KK, Hsieh I, Morisaki H, Debnath J, Brown EJ. PLIC proteins or ubiquilins regulate autophagy-dependent cell survival during nutrient starvation. EMBO Rep 2009;10:173–179. [DOI] [PMC free article] [PubMed] [Google Scholar]
- [22].Athwal VS, Pritchett J, Llewellyn J, Martin K, Camacho E, Raza SM, et al. SOX9 predicts progression toward cirrhosis in patients while its loss protects against liver fibrosis. EMBO Mol Med 2017;9:1696–1710. [DOI] [PMC free article] [PubMed] [Google Scholar]
- [23].Frangou E, Chrysanthopoulou A, Mitsios A, Kambas K, Arelaki S, Angelidou I, et al. REDD1/autophagy pathway promotes thromboinflammation and fibrosis in human systemic lupus erythematosus (SLE) through NETs decorated with tissue factor (TF) and interleukin-17A (IL-17A). Ann Rheum Dis 2019;78:238–248. [DOI] [PMC free article] [PubMed] [Google Scholar]
- [24].Roderfeld M Matrix metalloproteinase functions in hepatic injury and fibrosis. Matrix Biol 2018;68–69:452–462. [DOI] [PubMed] [Google Scholar]
- [25].Lang AL, Krueger AM, Schnegelberger RD, Kaelin BR, Rakutt MJ, Chen L, et al. Rapamycin attenuates liver injury caused by vinyl chloride metabolite chloroethanol and lipopolysaccharide in mice. Toxicol Appl Pharmacol 2019;382:114745. [DOI] [PMC free article] [PubMed] [Google Scholar]
- [26].Saxton RA, Sabatini DM. mTOR Signaling in Growth, Metabolism, and Disease. Cell 2017;168:960–976. [DOI] [PMC free article] [PubMed] [Google Scholar]
- [27].Brugarolas J, Lei K, Hurley RL, Manning BD, Reiling JH, Hafen E, et al. Regulation of mTOR function in response to hypoxia by REDD1 and the TSC1/TSC2 tumor suppressor complex. Genes Dev 2004;18:2893–2904. [DOI] [PMC free article] [PubMed] [Google Scholar]
- [28].Qiao S, Dennis M, Song X, Vadysirisack DD, Salunke D, Nash Z, et al. A REDD1/TXNIP pro- oxidant complex regulates ATG4B activity to control stress-induced autophagy and sustain exercise capacity. Nat Commun 2015;6:7014. [DOI] [PMC free article] [PubMed] [Google Scholar]
- [29].Salsman J, Stathakis A, Parker E, Chung D, Anthes LE, Koskowich KL, et al. PML nuclear bodies contribute to the basal expression of the mTOR inhibitor DDIT4. Sci Rep 2017;7:45038. [DOI] [PMC free article] [PubMed] [Google Scholar]
- [30].Aoki K, Maeda F, Nagasako T, Mochizuki Y, Uchida S, Ikenouchi J. A RhoA and Rnd3 cycle regulates actin reassembly during membrane blebbing. Proc Natl Acad Sci U S A 2016;113:E1863–1871. [DOI] [PMC free article] [PubMed] [Google Scholar]
- [31].Hannemann S, Madrid R, Stastna J, Kitzing T, Gasteier J, Schonichen A, et al. The Diaphanous-related Formin FHOD1 associates with ROCK1 and promotes Src-dependent plasma membrane blebbing. J Biol Chem 2008;283:27891–27903. [DOI] [PubMed] [Google Scholar]
- [32].Mimche PN, Brady LM, Bray CF, Lee CM, Thapa M, King TP, et al. The receptor tyrosine kinase EphB2 promotes hepatic fibrosis in mice. Hepatology 2015;62:900–914. [DOI] [PMC free article] [PubMed] [Google Scholar]
- [33].Scheving LA, Zhang X, Threadgill DW, Russell WE. Hepatocyte ERBB3 and EGFR are required for maximal CCl4-induced liver fibrosis. Am J Physiol Gastrointest Liver Physiol 2016;311:G807–G816. [DOI] [PMC free article] [PubMed] [Google Scholar]
- [34].Svegliati-Baroni G, Ridolfi F, Di Sario A, Casini A, Marucci L, Gaggiotti G, et al. Insulin and insulin-like growth factor-1 stimulate proliferation and type I collagen accumulation by human hepatic stellate cells: differential effects on signal transduction pathways. Hepatology 1999;29:1743–1751. [DOI] [PubMed] [Google Scholar]
- [35].Taura K, De Minicis S, Seki E, Hatano E, Iwaisako K, Osterreicher CH, et al. Hepatic stellate cells secrete angiopoietin 1 that induces angiogenesis in liver fibrosis. Gastroenterology 2008;135:1729–1738. [DOI] [PubMed] [Google Scholar]
- [36].Joannes A, Brayer S, Besnard V, Marchal-Somme J, Jaillet M, Mordant P, et al. FGF9 and FGF18 in idiopathic pulmonary fibrosis promote survival and migration and inhibit myofibroblast differentiation of human lung fibroblasts in vitro. Am J Physiol Lung Cell Mol Physiol 2016;310:L615–629. [DOI] [PubMed] [Google Scholar]
- [37].Hasan MK, Nafady A, Takatori A, Kishida S, Ohira M, Suenaga Y, et al. ALK is a MYCN target gene and regulates cell migration and invasion in neuroblastoma. Sci Rep 2013;3:3450. [DOI] [PMC free article] [PubMed] [Google Scholar]
- [38].Saharinen P, Eklund L, Miettinen J, Wirkkala R, Anisimov A, Winderlich M, et al. Angiopoietins assemble distinct Tie2 signalling complexes in endothelial cell-cell and cell-matrix contacts. Nat Cell Biol 2008;10:527–537. [DOI] [PubMed] [Google Scholar]
- [39].Zhang S, Zhang H, Ghia EM, Huang J, Wu L, Zhang J, et al. Inhibition of chemotherapy resistant breast cancer stem cells by a ROR1 specific antibody. Proc Natl Acad Sci U S A 2019;116:1370–1377. [DOI] [PMC free article] [PubMed] [Google Scholar]
- [40].Ramachandran P, Dobie R, Wilson-Kanamori JR, Dora EF, Henderson BEP, Luu NT, et al. Resolving the fibrotic niche of human liver cirrhosis at single-cell level. Nature 2019. [DOI] [PMC free article] [PubMed] [Google Scholar]
- [41].Hernandez-Gea V, Ghiassi-Nejad Z, Rozenfeld R, Gordon R, Fiel MI, Yue Z, et al. Autophagy releases lipid that promotes fibrogenesis by activated hepatic stellate cells in mice and in human tissues. Gastroenterology 2012;142:938–946. [DOI] [PMC free article] [PubMed] [Google Scholar]
- [42].Racanelli AC, Kikkers SA, Choi AMK, Cloonan SM. Autophagy and inflammation in chronic respiratory disease. Autophagy 2018;14:221–232. [DOI] [PMC free article] [PubMed] [Google Scholar]
- [43].Babuta M, Furi I, Bala S, Bukong TN, Lowe P, Catalano D, et al. Dysregulated Autophagy and Lysosome Function Are Linked to Exosome Production by Micro-RNA 155 in Alcoholic Liver Disease. Hepatology 2019. [DOI] [PMC free article] [PubMed] [Google Scholar]
- [44].Liu W, Ye C, Cheng Q, Zhang X, Yao L, Li Q, et al. Macrophage Raptor Deficiency-Induced Lysosome Dysfunction Exacerbates Nonalcoholic Steatohepatitis. Cell Mol Gastroenterol Hepatol 2019;7:211–231. [DOI] [PMC free article] [PubMed] [Google Scholar]
- [45].Schramm C, Fine DM, Edwards MA, Reeb AN, Krenz M. The PTPN11 loss-of-function mutation Q510E-Shp2 causes hypertrophic cardiomyopathy by dysregulating mTOR signaling. Am J Physiol Heart Circ Physiol 2012;302:H231–243. [DOI] [PubMed] [Google Scholar]
- [46].Ghosh AK, Secreto CR, Knox TR, Ding W, Mukhopadhyay D, Kay NE. Circulating microvesicles in B-cell chronic lymphocytic leukemia can stimulate marrow stromal cells: implications for disease progression. Blood 2010;115:1755–1764. [DOI] [PMC free article] [PubMed] [Google Scholar]
- [47].Chen YN, LaMarche MJ, Chan HM, Fekkes P, Garcia-Fortanet J, Acker MG, et al. Allosteric inhibition of SHP2 phosphatase inhibits cancers driven by receptor tyrosine kinases. Nature 2016;535:148–152. [DOI] [PubMed] [Google Scholar]
- [48].Han T, Xiang DM, Sun W, Liu N, Sun HL, Wen W, et al. PTPN11/Shp2 overexpression enhances liver cancer progression and predicts poor prognosis of patients. J Hepatol 2015;63:651–660. [DOI] [PubMed] [Google Scholar]
- [49].Matter MS, Decaens T, Andersen JB, Thorgeirsson SS. Targeting the mTOR pathway in hepatocellular carcinoma: current state and future trends. J Hepatol 2014;60:855–865. [DOI] [PMC free article] [PubMed] [Google Scholar]
- [50].Graham L, Banda K, Torres A, Carver BS, Chen Y, Pisano K, et al. A phase II study of the dual mTOR inhibitor MLN0128 in patients with metastatic castration resistant prostate cancer. Invest New Drugs 2018;36:458–467. [DOI] [PMC free article] [PubMed] [Google Scholar]
- [51].Nashan B mTOR Inhibition and Clinical Transplantation: Liver. Transplantation 2018;102:S19–S26. [DOI] [PubMed] [Google Scholar]
- [52].Guzy RD, Li L, Smith C, Dorry SJ, Koo HY, Chen L, et al. Pulmonary fibrosis requires cell-autonomous mesenchymal fibroblast growth factor (FGF) signaling. J Biol Chem 2017;292:10364–10378. [DOI] [PMC free article] [PubMed] [Google Scholar]
- [53].Mammoto T, Jiang A, Jiang E, Mammoto A. Role of Twist1 Phosphorylation in Angiogenesis and Pulmonary Fibrosis. Am J Respir Cell Mol Biol 2016;55:633–644. [DOI] [PubMed] [Google Scholar]
- [54].Martin-Vilchez S, Rodriguez-Munoz Y, Lopez-Rodriguez R, Hernandez B, Borque-Inurrita MJ, Molina-Jimenez F, et al. Inhibition of tyrosine kinase receptor Tie2 reverts HCV-induced hepatic stellate cell activation. PLoS One 2014;9:e106958. [DOI] [PMC free article] [PubMed] [Google Scholar]
Associated Data
This section collects any data citations, data availability statements, or supplementary materials included in this article.


