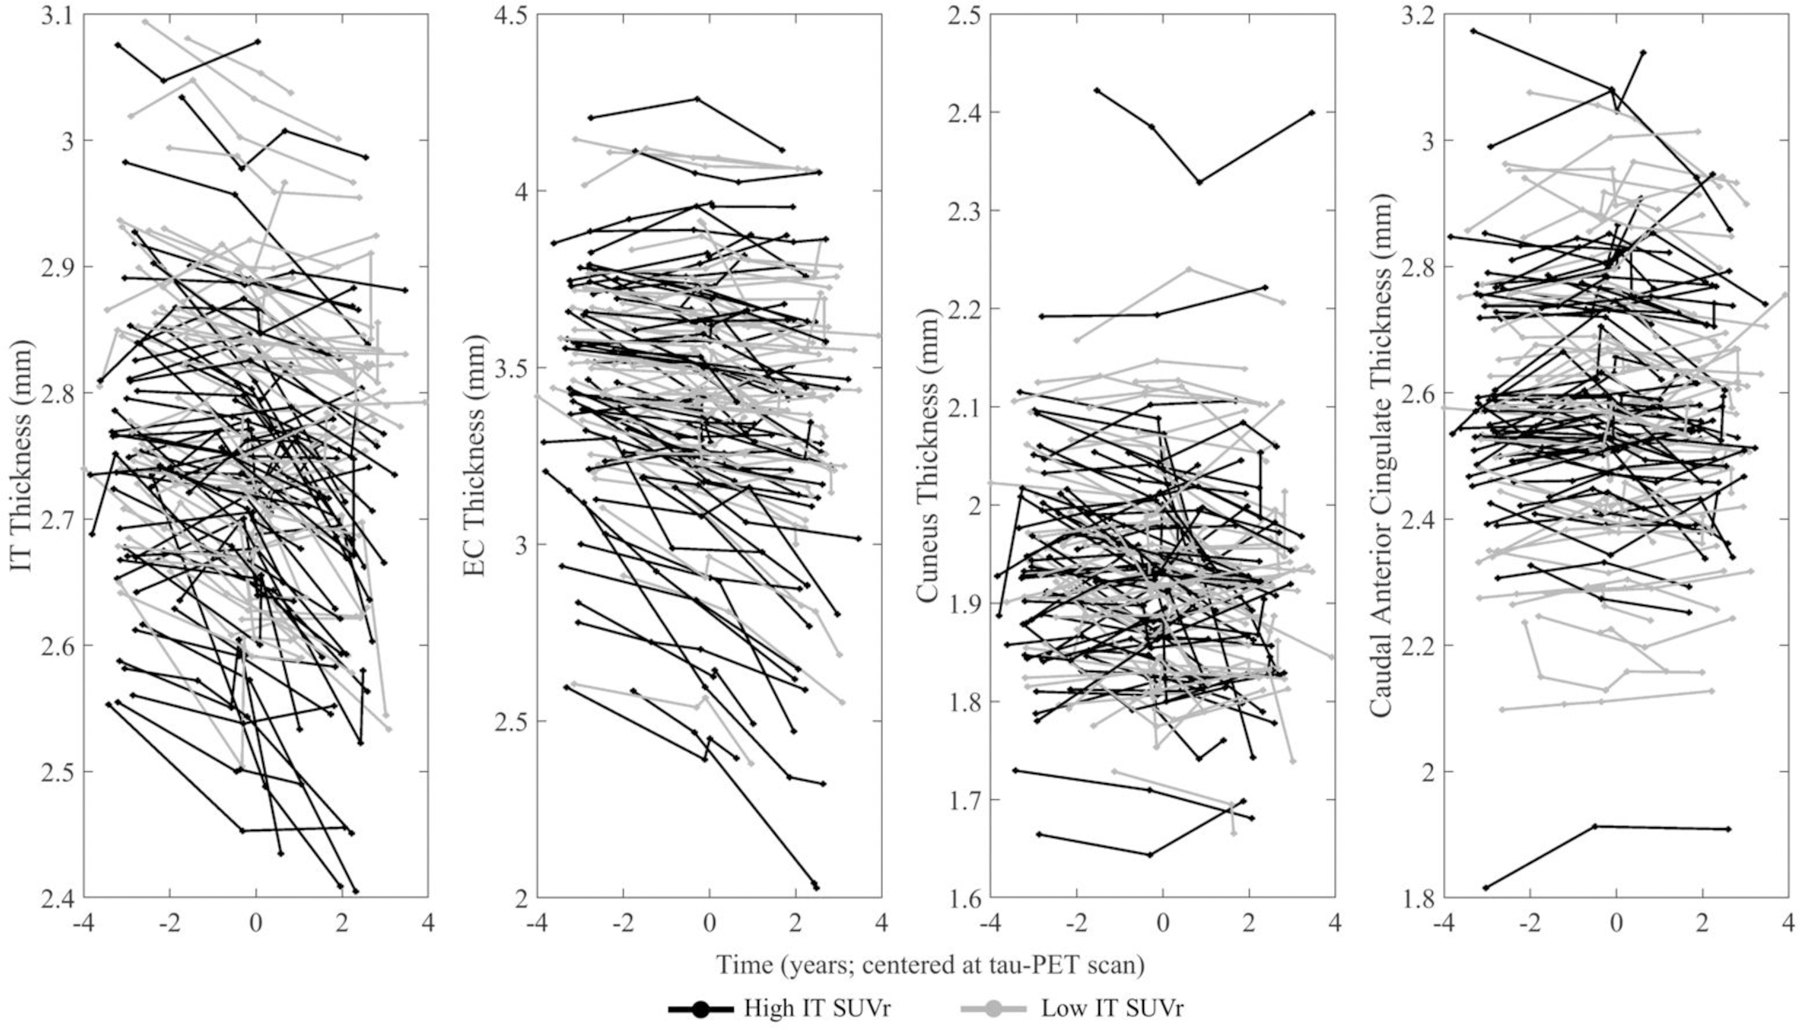
Fig. 3. Cortical Thickness Spaghetti Plots by High and Low IT FTP.

IT FTP is stratified by a median IT SUVr of 1.46 (black = greater than 1.46, gray = less than or equal to 1.46) and longitudinal thickness data for all 111 participants are presented in the (left most) IT, (left middle) EC, (right middle) cuneus, (right most) caudal anterior cingulate. Data are centered at the tau-PET scan. Cuneus models were run with and without the uppermost individual shown, and no significant changes were found within full sample as well as amyloid group analyses. Abbreviations: IT = inferior temporal gyrus; EC = entorhinal cortex; SUVr = standardized uptake value ratio; FTP = flortaucipir.
