

SUMMARY
Cajal recognized that the elaborate shape of neurons is fundamental to their function in the brain. However, there are no simple and generalizable genetic methods to study neuronal or glial cell morphology in the mammalian brain. Here, we describe four mouse lines conferring Cre-dependent sparse cell labeling based on mononucleotide repeat frameshift (MORF) as a stochastic translational switch. Notably, the optimized MORF3 mice, with a membrane-bound multivalent immunoreporter, confer Cre-dependent sparse and bright labeling of thousands of neurons, astrocytes, or microglia in each brain, revealing their intricate morphologies. MORF3 mice are compatible with imaging in tissue-cleared thick brain sections and with immuno-EM. An analysis of 151 MORF3-labeled developing retinal horizontal cells reveals novel morphological cell clusters and axonal maturation patterns. Our study demonstrates a conceptually novel, simple, generalizable, and scalable mouse genetic solution to sparsely label and illuminate the morphology of genetically defined neurons and glia in the mammalian brain.
In Brief
Veldman et al. describe a suite of MORF mouse lines as conceptually novel tools for simple, generalizable, and non-invasive Cre-dependent sparse and stochastic labeling neurons and glia in the mouse brain. They also develop an imaging pipeline that allows for brainwide acquisition and reconstruction of the 3D brain cell morphology.
Graphical Abstract
INTRODUCTION
The foundation of neuroscience begins with Cajal’s formal analyses of Golgi-stained neuronal morphology in the vertebrate brain over a century ago (Cajal, 1909). To date, many barriers remain in elucidating the fundamental principles underlying mammalian brain organization and function (Bargmann and Newsome, 2014). The mammalian brain consists of an astronomical number of neuronal cells; ~86 billion in the human brain and 100 million in the mouse brain (Herculano-Houzel, 2012; Herculano-Houzel et al., 2006). As a basic building block of the brain, each neuron has its own complex shape that constrains and confers its function. Comparable to the number of neurons, there is also an enormous number of glial cells (e.g., astrocytes, microglia, oligodendrocytes; von Bartheld et al., 2016). Glial cells also have elaborate processes that can change in different physiological or disease states (Chung et al., 2015). Thus, the availability of simple and scalable genetic tools to study the morphology of neurons and glial cells will help answer some important questions related to mammalian brain cell biology (Zeng and Sanes, 2017; Swanson and Lichtman, 2016) and pathology (Duman and Aghajanian, 2012; Adalbert and Coleman, 2013).
Neurons are densely packed in the brain, and their intermingled dendritic and axonal processes preclude the visualization of their morphologies. Thus, it often requires a sparse labeling method that randomly labels a small subset of neurons to highlight their dendritic and axonal processes. The traditional Golgi method is time-consuming and not compatible with molecular co-detection of mRNA or protein markers (Swanson and Lichtman, 2016). Several other methods (e.g., dye microinjections, low-titer viral infections) have been used to achieve sparse labeling of genetically defined neurons (Luo et al., 2008; Jefferis and Livet, 2012), but they often require specialized skills and are labor intensive or invasive (Gouwens et al., 2019; Economo et al., 2016; Chan et al., 2017) or have cellular tropism of certain viruses (Chan et al., 2017; Hordeaux et al., 2019). Several Cre-dependent mouse lines have been devised for sparse labeling, but they often have more limited applications due to relatively high labeling frequencies (Wang et al., 2009; Livet et al., 2007) or restricted utility to a subset, but not all, of the available Cre mouse lines (Badea et al., 2003, 2009; Hameyer et al., 2007; Zong et al., 2005).
DNA microsatellites such as mononucleotide repeats in the genome are susceptible to stochastic frameshift mutations during DNA replication or repair (Li et al., 2004; Bhargava and Fuentes, 2010; Buschiazzo and Gemmell, 2006). We previously showed that a G22 repeat placed between a translational start site (ATG) and GFP reporter in a dopamine D1 receptor BAC transgenic mouse can sparsely label ~1% of D1 medium spiny neurons (MSNs; Lu and Yang, 2017). However, this prior MORF mouse line showed relatively weak labeling signals for synapses and axons, and it is unclear whether a MORF-based method can be generalizable for the sparse labeling of other brain cell populations. Here, we created four new MORF mouse lines and demonstrated their general utility to illuminate the complete morphologies of genetically defined neurons and glia cells in the mouse brain.
RESULTS
In Vitro Optimization of Mononucleotide Repeat Types and Context to Improve MORF Reporter Expression Levels
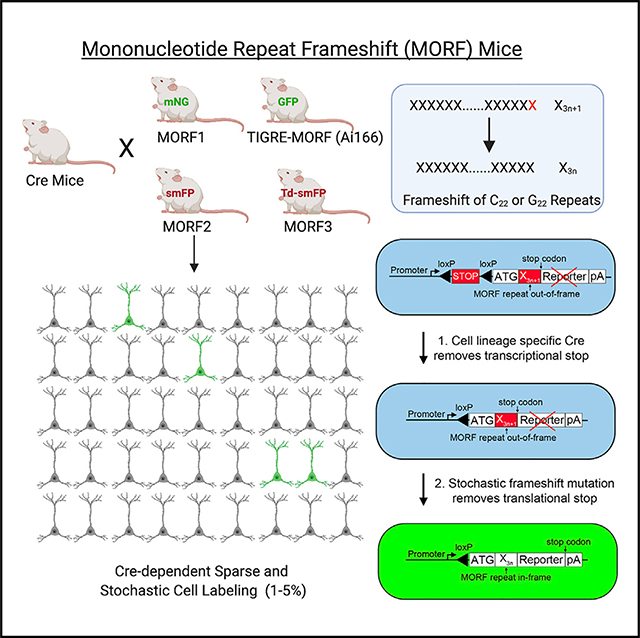
In the present study, we aimed to test whether the MORF-based technology could be optimized to develop mouse lines that confer generalizable, non-invasive, and Cre-dependent sparse and stochastic labeling of brain cells at a frequency that is analogous to Golgi staining (i.e., 1%–5% of cells). Our general strategy is to integrate MORF reporters into 2 murine genomic loci (Rosa26 and TIGRE) that support ubiquitous transgene expression and are suitable for Cre-driven reporter gene expression (Soriano, 1999; Madisen et al., 2010; Daigle et al., 2018). In this design, a strong, ubiquitous or tetracycline transactivator (tTA)-dependent promoter is placed in front of a transcriptional STOP cassette flanked by two loxP sites, which is followed by a MORF reporter cassette consisting of a translational start site (ATG), the mononucleotide repeat itself (Figure 1A), and a membrane-bound (i.e., farnesylated) reporter and polyadenylation sequence (Figure 1B). In Cre+ cell progenies, the floxed transcriptional STOP sequence is removed, but most cells are still unable to translate the MORF reporter protein due to the mononucleotide repeat’s acting as an out-of-frame “translational switch.” Only in a small and random subset of Cre-defined cells in which the mononucleotide repeat had undergone stochastic frameshift to an in-frame repeat length (i.e., X3n+1–X3n; Figure 1A) will the membrane-bound reporter protein be translated to label the cellular morphology (Figure 1B).
Figure 1. MORF Sparse Labeling Strategy and In Vitro Optimization.

(A) The stochastic frameshift of mononucleotide repeats can act as a translational switch, and the 4 different types of repeats encode distinct polyamino acids.
(B) A general design of the Cre-dependent MORF reporter mouse line.
(C) Testing the expression level of GFP in transfected HEK293FT cells with 4 mononucleotide repeats fused to GFP reporters. ANOVA with Tukey’s test (**p < 0.01 versus ATG-GFP, #p < 0.01 versus ATG-C21-GFP).
(D) GFP reporter expression after moving the G21 repeat away from the translation start codon with 1 or 2 Myc-tag spacer sequences. ANOVA with Tukey’s test (**p < 0.01 versus ATG-GFP, #p < 0.01 versus ATG-Myc-Myc-G21-GFP).
(E) GFP reporter expression when a 2-Myc-tag spacer is placed between the translation start site and C21 repeat. ANOVA with Tukey’s test (**p < 0.01 versus ATG-GFP, #p < 0.01 versus ATG-Myc-Myc-C21-GFP).
For (C)–(E), n ≥ 3 replicates. The error bars are means ± SEMs.
To optimize the MORF reporter construct design before generating the reporter mice, we examined several factors, including the types of mononucleotide repeats (Figure 1A) and the distance between the ATG start site and the mononucleotide repeat. We tested in vitro the effects of different mononucleotide types on the expression of a C-terminal GFP and found the highest normalized GFP signals from the C21 MORF construct, followed by much lower levels of expression from G21, A21, and T21 constructs (Figure 1C). Since none of the repeat constructs reached the baseline GFP control signals, we tested whether the juxtaposition of the mononucleotide repeat to the translational start site could lower the reporter protein expression and showed an insertion of 39 or 102 bp (i.e., encoding 1 or 2 Myc tags) before the repeats could increase GFP expression. Such spacer sequences lead to significant increases (e.g., 46%, 69%) in GFP signals compared to the baseline G21 or C21 constructs (Figures 1D and 1E).
Our systematic in vitro optimization revealed that an optimal MORF repeat type is polycytosine, and a DNA spacer (e.g., ~100 bp) between the translational start site and the mononucleotide repeat should further enhance the reporter protein expression.
MORF1 and TIGRE-MORF Mice Confer Cre-Dependent Sparse and Stochastic Expression of Direct Fluorescent Proteins
To test whether the MORF-based strategy could be used to develop Cre-dependent sparse cell labeling in mice, we generated the MORF1 mouse line by targeted insertion into the Rosa26 locus of a Cre-dependent reporter construct with an optimized C22 repeat and a farnesylated mNeonGreen (mNG-F) reporter, one of the brightest fluorescent proteins (Shaner et al., 2013; Figure 2A). We confirmed Cre-dependent mNG-F expression by injecting an adeno-associated virus serotype 1 (AAV1)-Cre into the striatum of MORF1 mice (Figures S1A and S1B). We next crossed MORF1 to the ubiquitously expressing EIIa-Cre mice (Lakso et al., 1996) and used direct fluorescent imaging to confirm the mosaic, sparse, and stochastic labeling of neurons and glia throughout the brain (Figures 2B–2D), and a single cell or a clone of cells in peripheral tissues such as the intestine (Figure 2E). Moreover, MORF1 can also support Cre-dependent sparse labeling of cerebellar Purkinje cells (PCs) in MORF1/Pcp2-Cre mice (Figures 2F–2H), striatal D2-MSNs in MORF1/Drd2-Cre (Figures 2I–2K), and both D1- and D2-MSNs in MORF/Rgs9-Cre (Figures S1C–S1F). The sparsely labeled PCs and MSNs in the MORF1/Cre mice reveal dendrites, dendritic spines, cell bodies, axons, and axonal terminals (Figures 2 and S1). Thus, we conclude that MORF1 mice support Cre-dependent sparse and stochastic labeling of certain brain cell populations. One limitation of the MORF1 model, despite using a bright fluorescent protein, is the weak labeling signals for some neuronal populations, such as cortical pyramidal neurons (PNs; MORF1/Rbp4-Cre), parvalbumin interneurons (MORF1/Pvalb-Cre), and midbrain dopaminergic neurons (MORF1/TH-Cre; data not shown). This issue is compounded by the lack of a good mNG antibody for immunostaining.
Figure 2. The MORF1 and TIGRE-MORF Transgenic Reporter Lines for Cre-Dependent Sparse Cell Labeling with Membrane-Bound Fluorescent Proteins.

(A) Genetic construct for the MORF1 mouse line. The mNeonGreen-F is targeted to the membrane using a farnesylation signal.
(B–E) Direct mNeonGreen fluorescence reveals sparsely labeled cells in tissue sections from MORF1/EIIa-Cre mice.
(F–H) Brain sections from MORF1/Pcp2-Cre mice showing sparse labeling of cerebellar Purkinje cells (PCs) and their axons and axon terminals.
(I–K) D2 medium spiny neurons (MSNs) in MORF1/Drd2-Cre mice demonstrating labeling from dendritic spine (J) to axon terminals in the globus pallidus externus (GPe; K).
(L) Genetic construct for the TIGRE-MORF (Ai166) mouse line.
(M and N) TIGRE-MORF/TH-Cre brain sections showing labeled neuronal cell bodies in the substantia nigra pars compacta (SNc; M) and axon projections toward the striatum (N).
(O and P) Representative images of TIGRE-MORF/Camk2a-CreERT2 double-transgenic mice showing cortical labeling of pyramidal neurons (O), with boxed region magnified in (P), including labeling of axonal segment (arrows).
See also Figures S1 and S2.
To enhance the sparse cell-labeling signals for a direct fluorescent reporter protein in Cre-dependent MORF mice, we next used the TIGRE2.0 transgenic platform (Daigle et al., 2018) using Cre-dependent expression of the tTA transcription factor driving a Cre-dependent G22-GFP-F reporter (Figure 2L). This system allows the transcriptional amplification of Cre-dependent reporter gene expression, achieving high-level expression. To test the utility of this TIGRE-MORF mouse line (also known as Ai166) for sparse labeling of Cre-defined neuronal cells, we crossed the line with TH-Cre and Camk2a-CreERT2 mouse lines and found sparse and very bright labeling of midbrain dopaminergic neurons and their axons (Figures 2M and 2N) and cortical PNs, respectively (Figures 2O and 2P). This mouse line has also been applied to examine the long-range axonal projections of neurons in the cortex and claustrum (Wang et al., 2019). One limitation of TIGRE-MORF mice is the inability to generate live-born double transgenic mice with certain Cre mouse line crosses (e.g., Drd1-Cre, Adora2a-Cre, Rbp4-Cre, Emx1-Cre, Pvalb-Cre; Table S1; data not shown), possibly due to high-level expression of tTA in the developing embryos (Daigle et al., 2018; Steinmetz et al., 2017), which somewhat limits its general utility.
A Generalizable MORF Mouse Line for Cre-Dependent, Sparse, Stochastic, and High Signal-to-Noise Labeling of CNS Cells
To further generalize the utility of MORF mouse lines, we tested whether “spaghetti monster” fluorescent proteins (smFPs; Viswanathan et al., 2015) could be a superior reporter for MORF-based labeling and imaging of brain cells. smFPV5 is an immunoreporter with 10 V5 epitope tags embedded in a superfold, non-fluorescent GFP scaffold, and upon anti-V5 staining, it confers high signal-to-noise labeling (Viswanathan et al., 2015). As a proof of concept, we developed MORF2 mice with a Rosa26 Cre reporter line carrying a C22 repeat and a fusion of mNG and farnesylated smFPV5 (Figure S2A). We crossed MORF2 with different Cre lines and showed with anti-V5 staining the sparse and cell-type-specific labeling of PCs (MORF2/Pcp2-Cre; Figure S2B), striatal MSNs (MORF2/Rgs9-Cre; Figure S2C), striatal PV interneurons (MORF2/Pvalb-Cre; Figure S2D), and retinal horizontal cells (HCs; MORF2/Cx57-iCre; Figures S2E and S2F). The labeled HCs encompass both the dendrites and axons, suggesting the complete labeling of these neurons. Moreover, we showed that MORF2 can be used to label D2-MSNs and their dendrites and axons in the striatum of aged (6 months old) Q175 knockin Huntington disease mouse model (Menalled et al., 2012), and the sparsely labeled D2-MSNs be costained with mutant huntingtin (mHTT) aggregates (Figure S2G; Video S1). Thus, we conclude that the smFPV5 reporter in MORF2 mice is suitable for long-term labeling and double immunostaining in the mouse brain. However, after our extensive testing of MORF2 mice, we noted in multiple MORF2/Cre crosses (i.e., Drd1-Cre, Drd2-Cre, Cx57-iCre, and Rbp4-Cre) that the offspring were occasionally (<20%) genotyped positive for both MORF2 and Cre, but are negative for V5 immunostaining in their brain sections. This occasional transgene silencing issue had not been found in MORF1 mice, and thus is not caused by the presence of the C22 repeat in the Rosa26 locus. We inferred that it is likely due to the differences in Rosa26 targeting constructs between these 2 lines (STAR Methods). Thus, the MORF2 line provides the proof of concept of the utility of smFPV5 reporters but still has limitations due to occasional transgene silencing.
We next sought to develop a truly generalizable MORF mouse line that could be used to cross with any Cre mouse line and reproducibly confer sparse and stochastic cell labeling, and if possible, further enhance the labeling signal strength of the MORF reporter. To this end, we developed a novel tandem smFPV5 reporter that contains 20 V5 epitope tags followed by a farnesylation signal (td-smFPV5-F; STAR Methods). We used this reporter to generate MORF3 mice based on the MORF1 construct design, except for substituting mNG-F with tdsmFPV5-F (Figure 3A; STAR Methods). We next extensively tested the general utility of MORF3 mice by crossing the reporter with multiple Cre mouse lines and tested a large number of offspring (Tables 1 and S2).
Figure 3. MORF3 Transgenic Reporter Lines with the Tandem smFPV5 Immunoreporter Sparsely and Brightly Labeled Cre-Defined Immunostained.

(A) Cre-dependent MORF3 transgene design includes a tandem fusion of 2 membrane-localized smFPV5s (tdsmFPV5) for maximal immunofluorescent detection.
(B–E) Cortical PNs in layer 5 labeled in MORF3/Rbp4-Cre mice (counterstained with NeuN and DAPI), which reveal cell bodies, axons, dendrites (D), and dendritic spines (E).
(F–H) MORF3/Pcp2-Cre mice show sparse labeling of cerebellar Purkinje cells (PCs; co-labeled with calbindin) (F), with bright labeling their cell body and dendrites (G) and dendritic spines (H).
(I–M) Examples of parvalbumin-expressing interneurons in MORF3/PV-Cre mice. Brain sections are double stained for V5 (MORF reporter). PV neurons in the cortex (I–K) and striatum (L and M) are shown, with boxed regions showing magnified images of dendritic processes and thinner, beaded axons (K and M).
(N–R) Imaging of MORF3 and somatostatin (SST)-expressing interneurons in MORF3/SST-Cre mice can be resolved to show detailed dendritic and axonal morphologies (boxed regions) in the cortex (N–P) and striatum (Q and R).
See also Figures S3 and S4.
Table 1.
Summary of MORF Mouse Line Cell-Type-Specific Labeling Efficiencies
| Cell type (antibody) | Cre line | MORF line | MORF+ cells counted | Total cells counted | Labeling efficiency (%) |
|---|---|---|---|---|---|
| Striatal MSN (DARPP-32) | Drd1-Cre | MORF1 | 59 | 2,436 | 4.8a |
| Drd2-Cre | MORF1 | 52 | 2,813 | 3.7a | |
| Rgs9-Cre | MORF1 | 116 | 4,154 | 2.8a | |
| Substantia nigra dopaminergic (TH) | TH-Cre | TIGRE-MORF | 24 | 561 | 4.7a |
| Striatal MSN (DARPP-32) | Drd1-Cre | MORF2 | 15 | 2,149 | 1.4a |
| Drd2-Cre | MORF2 | 38 | 3,203 | 2.4a | |
| Rgs9-Cre | MORF2 | 83 | 3,720 | 2.2a | |
| Cortical interneuron (parvalbumin) | Pvalb-Cre | MORF2 | 33 | 2,120 | 1.6a |
| Cerebellar Purkinje cell (calbindin) | Pcp2-Cre | MORF2 | 19 | 1,941 | 1.0a |
| Retinal horizontal cell (calbindin) | Cx57-iCre | MORF2 | 68 | 3,825 | 1.8a |
| Striatal MSN (DARPP-32) | Drd1-Cre | MORF3 | 36 | 1,389 | 5.2a |
| Drd2-Cre | MORF3 | 39 | 1,593 | 4.9a | |
| Cerebellar Purkinje cell (calbindin) | Pcp2-Cre | MORF3 | 28 | 1,786 | 1.6 |
| Cortical interneuron (parvalbumin) | Pvalb-Cre | MORF3 | 99 | 3,352 | 2.9 |
| Cortical interneuron (somatostatin) | SST-Cre | MORF3 | 75 | 1,979 | 3.8 |
| Retinal horizontal cell (P5; calbindin) | Cx57-iCre | MORF3 | 175 | 15,254 | 1.2 |
| Cortical microglia (Iba1) | Cx3cr1-CreERT2 (100 mg/kg TAM; 5 days) | MORF3 | 141 | 4,049 | 3.5 |
| Cortical astrocyte (S100β) | Aldh1l1-CreERT2 (100 mg/kg TAM; 3 days) | MORF3 | 148 | 4,250 | 3.5 |
Drd1 and Drd2 cells make up ∼50% of DARPP-32+ MSNs in the striatal, respectively; therefore, the labeling efficiency calculation was made using half of the total cells counted as the denominator.
We tested MORF3 mice for the labeling of long-range projection neurons. To label the layer 5 (L5) cortical PNs, we crossed MORF3 with the Rbp4-Cre mouse and performed V5 immunostaining using brain sections from 8 MORF3/Rbp4-Cre mice (Table S2). We consistently detected sparse and stochastic labeling of L5 cortical PNs and hippocampal neurons (Figures 3B–3E; data not shown). The labeling signal is extremely bright to reveal both apical and basal dendritic arbors, dendritic spines, and diffuse axonal projections (Figures 3B–3E). We next showed MORF3/Pcp2-Cre mice (N = 2) labeling a random subset of PCs, revealing their dendrites and dendritic spines (Figures 3F–3H and S3A; data not shown). These labeled PCs can be readily reconstructed digitally (Figures S3A–3C). Finally, we crossed MORF3 with D2-Cre and obtained 22 adult double-transgenic mice (Table S2), which showed the sparse labeling of D2-MSNs, including their dendrites, dendritic spines, axons, and axonal terminals in the globus pallidus (Figures S4A and S4B). Thus, we conclude that MORF3 mice can confer sparse and stochastic labeling of the long-range projection neurons in the brain, and the labeling appeared complete as they include dendrites, dendritic spines, axons, and axonal terminals.
We next examined whether MORF3 can be used to visualize the morphology of GABAergic interneurons. Multiple Cre mouse lines have been developed for different interneuron classes, but the classical Cre reporters or viral-based labeling often only reveals the dendrites and cannot clearly reveal the densely intermingled and thin axons (Taniguchi et al., 2011). We next crossed MORF3 with Pvalb and somatostatin (SST) Cre mouse lines to visualize these 2 classes of interneurons (Taniguchi et al., 2011). MORF3/Pvalb-Cre mice show sparse labeling of the individual Pvalb+ interneurons brainwide, including but not limited to the neocortex and hippocampus (Figures 3I–3M and S3D–S3J). All of the MORF3-labeled Pvalb+ interneurons display not only the thick dendrites but also the thin beaded axons (Figures 3K and 3M). Similarly, MORF3/SST-Cre also sparsely labels individual SST+ interneurons and their dendritic and axonal processes brainwide (e.g., cortex, striatum, hippocampus; Figures 3N–3R and S3K–S3Q). The neurons were imaged at a resolution of 0.2 × 0.2 × 1.0 μm (STAR Methods), which permits ready reconstruction of the neuronal dendrites (Figure S3). Our preliminary analysis already revealed the diversity of SST and Pvalb interneuron morphologies, supporting the presence of more diverse cell types within these two broad interneuron classes (Huang and Paul, 2019).
Next, we estimated the relative labeling strength of MORF1, MORF2, and MORF3 by crossing all 3 lines to D2-Cre (Figures S2H–S2K). We found that MORF1/D2-Cre, with direct fluorescent imaging of mNG, has the weakest labeling strength. However, MORF2/D2-Cre is about 30× and MORF3/D2-Cre 2,600× the signal strength of MORF1/D2-Cre. Thus, with this example and other evidence, we concluded that MORF3 is superior in terms of both the labeling strength (i.e., signal-to-noise) and generalizability compared to the other MORF lines.
MORF3 Labeling of CNS Microglia and Astrocytes to Reveal Their Complete Morphologies
In the mammalian brain, glial cells such as microglia, astrocytes, and oligodendrocytes play key roles in the maintenance and execution of normal brain function and in response to various disease processes (Chung et al., 2015; Long and Holtzman, 2019; Khakh et al., 2017). To image the microglial morphology, we used adult MORF3/Cx3cr1-CreERT2 double-transgenic mice (N = 7; Table S2) with full tamoxifen induction, which normally labels ~>80% of the microglia in the brain (Parkhurst et al., 2013). As expected, MORF3/Cx3cr1-CreERT2 mice stochastically labeled ~3.5% of Iba1+ microglia brainwide (Figures 4 and S5A). Unlike Iba1 labeling that only shows the cell body and thick proximal processes, the td-smFPV5-F reporter in MORF3 brightly labeled both the proximal and distal processes of the microglia, including their membranous distal filopodia (Figures S5B–S5M). The labeled microglia can readily be reconstructed using current programs (Figure 4; STAR Methods).
Figure 4. MORF3 Mice Enable Brainwide Sparse Labeling of Microglia and Astrocytes to Reveal Their Detailed Morphology.

(A–P) Tamoxifen-induced (TAM; 100 mg/kg for 5 days) sparse labeling of microglia with MORF3 throughout the MORF3/Cx3cr1-CreERT2 brain, including the cortex (A–C), striatum (E–G), hippocampus (I–K), and cerebellum (M–O), allows for more detailed imaging of processes and endfeet when compared to Iba1 immunostaining (boxed regions). MORF3-labeled microglia can be readily reconstructed in full 3D (D, H, L, and P).
(Q–T) MORF3/Aldh1l1-CreERT2 induced with 100 mg/kg TAM for 3 days sparsely labels astrocytes with MORF3 throughout the brain, including the cortex (Q and R; counterstained for S100β), corpus callosum (S; counterstained for glial fibrillary acidic protein [GFAP]), and Bergmann glia in the cerebellum (T; co-labeled with GFAP).
See also Figure S5.
Similarly, crossing MORF3 with Aldh1l1-CreERT2 and giving full tamoxifen induction (see STAR Methods) resulted in much sparser labeling of the astrocyte populations than previously reported with conventional Cre reporter mice (Srinivasan et al., 2016; Figures 4Q–4T and S5N). The MORF3 reporter was able to label the membranous branches of astrocytes across multiple brain regions, including the distinct columnar-shaped cerebellar Bergmann glia (Figures 4Q–4T).
Determining the Labeling Frequencies of the MORF Mouse Lines
We have crossed our 4 MORF mouse lines to 19 different Cre lines and generated a total of 184 double-transgenic mice to assess Cre-dependent sparse brain cell labeling (Tables 1 and S2). We have analyzed 129 MORF3/Cre mice crossed with 14 different Cre lines, which consistently showed Cre-dependent, sparse, stochastic, and very bright labeling in all of the double-transgenic mice (Tables 1 and S2). We next assessed the labeling frequency of the MORF mice, defined by the percentage of Cre+ cell progenies that are labeled by the 4 different MORF/Cre mouse crosses. We estimated the labeling frequency using only the MORF/Cre crosses for cell classes that have readily detectable markers. As shown in Table 1, for 11 different Cre mouse lines, the labeling frequencies of 4 MORF mouse lines for different classes of neurons and glia range between 1.0% and 5.2%. Overall, the labeling frequency of all of the MORF mice has an average of ~3.0%. For the most generalizable MORF3 line, we used 8 different Cre lines to show labeling frequencies between 1.2% and 5.2% and an overall labeling frequency of ~2.4%. Such sparseness is comparable to that of the classical Golgi staining (i.e., 1%–5% of brain cells; Luo, 2007), except that MORF has the advantage of labeling genetically defined cell types and is compatible with co-staining of other molecular markers.
MORF3 Mice Support the Immunoelectron Microscopy (Immuno-EM) Study of Neuronal Ultrastructure
One important goal for studying neurons within a neural circuit is the challenge of imaging their morphology at multiple scales, from the mesoscale dendrites and axons to the nanoscale ultrastructures, including synapses and organelles (Lichtman and Denk, 2011; Zingg et al., 2014; Hintiryan et al., 2016; Oh et al., 2014; Kasthuri et al., 2015; Helmstaedter et al., 2013). There is a gap in neurotechnology that allows the study of genetically defined neurons at multiple scales. Since smFPs are compatible with immuno-EM (Viswanathan et al., 2015), we tested to see whether the sparsely labeled PNs in MORF3/Rbp4-Cre mice could be analyzed with light microscopy and EM. To image the ultrastructures of MORF3-labeled neurons, we used glutaraldehyde in the perfusion solutions (Svitkina, 2016) and tested multiple glutaraldehyde concentrations (e.g., 0.25%–2.5%) and found that 0.5% glutaraldehyde works well to balance preserving ultrastructure and maintaining immunoreactivity. As shown in Figures 5A–5D, anti-V5 immunostaining reveals a sparsely labeled detailed morphology of L5 PNs, including the cell bodies, dendrites, axons, and dendritic spines, under confocal and transillumination light microscopy. Strong 3,3-diaminobenzidine (DAB) immunostaining is seen in the semi-thin sections (Figures 5C and 5D) used to select the regions for ultrastructural evaluation. Moreover, under EM with anti-V5 immunostaining followed by a DAB reaction, with mild osmium counterstaining, we can readily detect plasma membrane-bound anti-V5 immunostaining in the cortical PN cell body and proximal dendrite (Figures 5E and 5F), a thin myelinated axon (Figure 5G), and presynaptic terminals with synaptic vesicles (Figures 5H–5J), whereas the nucleus is unstained (Figures 5E and 5F). The immuno-EM (Figures 5E–5J) showed different MORF3/Rbp4-Cre-expressing neurons than those shown in Figures 5C and 5D. In principle, however, it is possible to follow the same neuron from the light to the electron microscopic level. Our results demonstrate the feasibility of using standard light and electron microscopic techniques to visualize MORF3 localization at both the cellular and ultrastructural levels. For volumetric EM reconstructions, a different technical approach is necessary, such as intracellular labeling of neurons and automated sectioning and reconstruction software (e.g., Baena et al., 2019; Guérin et al., 2019). This provides a way for brainwide imaging of genetically defined, sparsely labeled neurons at both the mesoscale and nanoscale.
Figure 5. MORF3 Is Compatible with Transmission Electron Microscopy Enabling Mesoscale to Nanoscale Imaging.

(A) Fluorescent labeling of neurons and processes in neocortex of a MORF3/Rbp4-Cre double-transgenic mouse perfused with 0.5% glutaraldehyde (GA) and 4% paraformaldehyde (PFA) in 0.1 M phosphate buffer (PB).
(B) A labeled neuron with immunostaining of the soma, primary and basal dendrites, and dendritic spines. The arrows (white) point to the axons in the cortex.
(C and D) Membrane horseradish peroxidase (HRP) immunolabeling of a cortical pyramidal neuron (C) and a dendrite and dendritic spines (D) from a 1-μm-thick plastic section near the section processed for immunofluorescence (A and B).
(E) Transmission electron micrograph of an HRP-immunolabeled soma and primary dendrite. The plasma membrane is prominently immunostained, with an increased density of staining in the cytoplasm. The nucleus (n) is unstained. The arrowheads point to the labeled soma and proximal dendrite.
(F) Membrane labeling is prominent at and near the somatic plasma membrane (indicated in E), consistent with the plasma membrane targeting of MORF3.
(G) Labeled thin, myelinated axon, similar to the ones in (B) (arrows).
(H) High-magnification image of a labeled presynaptic terminal on 2 unlabeled postsynaptic terminals (*).
(I) High-magnification image of a labeled presynaptic terminal on an unlabeled small dendrite (*), surrounded by lighter, unlabeled processes. The density of cytoplasmic immunolabeling appears to be consistent in the axons, dendrites, and dendritic spines. Synapses have a higher density of immunolabeling compared to the labeling in the cytoplasm.
(J) High-magnification image of a labeled presynaptic terminal on an unlabeled postsynaptic terminal (*).
The arrowheads in the electron micrographs (E–J) point to immunolabeling. Scale bars: 100 μm (A), 20 μm (B and C), 10 μm (D), 5 μm (E and F), and 500 nm (G–J).
An Imaging Platform to Study the Brainwide Morphology of MORF3-Labeled Cells
To systematically study the morphology of MORF-labeled neurons and glia throughout the brain, we also need a brain tissue processing and imaging pipeline to capture intact three-dimensional (3D) cellular processes. To this end, we have developed a pipeline to tissue-clear and image MORF3-labeled neurons or glia in thick-cut (500 μm) serial brain sections (Figure 6A). To overcome the limitations of light imaging depth in brain tissues due to light scattering in a lipid-rich brain environment (Heintzmann and Ficz, 2013; Richardson and Lichtman, 2015) and antibody penetration with passive immunostaining of the tdsmFPV5-F reporter, we adapted the iDISCO+ tissue-clearing protocol (Renier et al., 2014, 2016) to our MORF3/Cre thick brain sections (see STAR Methods). In addition, we counterstained the brain sections with NeuroTrace (fluorescent Nissl) to enable the registration of each 10× imaged serial brain section onto a digital reference brain atlas, such as the Allen Reference Atlas (ARA; Dong, 2008).
Figure 6. An Imaging Pipeline to Capture the Full Dendritic Morphologies of MORF-Labeled Neurons in Thick Brain Sections and Modulate the Labeling Frequency of MORF3 with TAM-Inducible Cre Lines.

(A) An imaging pipeline to immunolabel with anti-V5, clearing 500- to 600-μm-thick brain sections with iDISCO+ (images at 10×and 30×on the Andor DragonFly) and to digitally reconstruct the MORF-labeled brain cells.
(B) Sagittal brain sections from MORF3/CamK2a-CreERT2 mice processed with the iDISCO+ and imaged at 30× on the Andor DragonFly can capture the 3D dendritic morphology of multiple neuronal cell types brainwide.
(C) The 3D dendritic morphology of individual MSNs can be imaged and digitally reconstructed.
(D and E) Quantification of the number of primary dendritic branches extending from the cell body (D) and the length of the longest primary dendritic branch and the widest radius of the dendritic field in MORF3/CamK2a-CreERT2-labeled MSNs (n = 40) from 500-μm-thick sections (E).
(F) Dose-dependent induction of Cre-recombinase expression with TAM (0, 25, 50, and 100 mg/kg TAM for 1 day) in MORF3/Camk2a-CreERT2 mice increases the MSN labeling frequencies.
(G and H) With a labeling frequency of 0.2% MSNs (TAM induction 25 mg/kg for 1 day) in theMORF3/Camk2a-CreERT2 striatum, the labeled MSNs can be readily reconstructed with our current pipeline (boxed region magnified in H).
(I–L) The lowered labeling frequency of layer 5 cortical PNs in MORF3/Etv1-CreERT2 mice (100 mg/kg TAM for 3 days; I) enables the high-resolution imaging (J; boxed region magnified in L) and digital reconstruction (K) of individual neurons.
(M–P) Similarly, regulating the labeling frequency of layers 2/3/4 cortical PNs in MORF3/Cux2-CreERT2 mice with TAM (50 mg/kg for 1 day; M) enables detailed imaging (N; boxed region magnified in P) and digital reconstruction (O) of individual neurons.
See also Figures S6–S8 and Videos S2 and S3.
To perform high-resolution, brainwide imaging of thick MORF3/Cre-labeled brain sections, we used a DragonFly confocal microscope (Andor, Oxford Instruments) that confers faster imaging times than a conventional laser-scanning confocal microscope and an Olympus microscope with high-power silicone immersion objectives that provide long working distances (up to 800 μm) with high numerical apertures (Figure S6). Although the 40× and 60× objectives have higher resolving power, they are limited to a working distance of 300 μm. The 30× objective has a superior working distance of 800 μm to enable imaging of the entire depth of the 500-μm-thick brain sections and can resolve the major dendritic branches comparable to 60× imaging (Figure S6). As an example of our tissue processing and imaging pipeline, Figure S4A shows a complete 10× image series of 500-μm-thick brain sections of a MORF3/D2-Cre mouse brain, and a 30× high-resolution image of one of these sections is shown in Figure S4B. Moreover, selected regions in these brain sections re-imaged at 100× reveal that the dendritic spines in the striatum and the axonal terminals in the globus pallidus externus (GPe) are intact and can be readily imaged, if needed (Figure S4A).
Ultrasparse Labeling of Densely Packed Neurons to Facilitate Digital Reconstruction
One rate-limiting factor in the morphological analysis of MORF-labeled neurons is the ability to digitally reconstruct the morphology of all of the sparsely labeled and imaged brain cells. With the Golgi-like labeling frequency of 1%–5%, MORF3 labeling of certain brain cell populations (e.g., PCs, PV+, and SST+ interneurons, microglia) that are relatively well separated from one another can be readily reconstructed with current programs (Peng et al., 2010; Li et al., 2019). However, for the projection neurons of the cortex and striatum, the MORF3/Cre mice (Figures 3 and S4) with a labeling frequency of 1%–5% still appear too dense for reconstruction with the available programs. Thus, we reasoned that for the neuronal populations with relatively dense packing and intermingling of their processes, a further reduction in labeling frequency will be necessary to facilitate their morphological reconstructions.
To test such an idea, we combined MORF mice with well-characterized inducible Cre mouse lines and reduced the labeling frequency well below 1% by fine-tuning the Cre activity (Madisen et al., 2010; Wang et al., 2019). As a proof of concept, we crossed MORF3 with a leaky inducible Cre mouse line, Camk2a-CreERT2 (Madisen et al., 2010). We can achieve the ultra-sparse labeling of both PNs and MSNs in the MORF3/Camk2a-CreERT2 brains without Cre recombinase (CreER) induction (Figure 6B; Videos S2 and S3). The MSN labeling in these brains is extremely sparse (0.09%; Figure 6F), and their dendritic arbors can be readily reconstructed (see STAR Methods). Our analysis of 40 reconstructed MSNs imaged from 500-μm-thick brain sections from the MORF3/Camk2a-CreERT2 brains reveal the Euclidean distance of the tip of the longest dendritic branch to the soma (i.e., the radius of the dendritic field) has a median of just below 150 μm and can be as long as 250 μm (Figures 6D and 6E). Therefore, to encompass the entirety of the 300–400 μm dendritic field of an average MSN, it is necessary to image brain sections of at least 400 μm thick. This represents a significant advance in the study of the full dendritic morphology of MSNs, since the prior MSN morphological studies often used brain sections with a thickness of ≤250 μm (http://neuromorpho.org/; Ascoli et al., 2007) and therefore likely contained partial dendritic processes of these neurons.
We next tested the idea that the MSN labeling density in the MORF3/Camk2a-CreERT2 brains can be gradually increased with escalating tamoxifen induction, so that we can achieve a higher labeling density and all of the labeled MSNs can still be digitally reconstructed. With one-day tamoxifen inductions of 25, 50, or 100 mg/kg, the MSN labeling frequencies are 0.2%, 0.43%, and 1.41%, respectively (Figures 6F and S7A). At the labeling frequency of 0.2% (with ~3,000 labeled MSNs per brain), the labeled MSNs can still be readily reconstructed using our current programs (Figures 6G, 6H, and S7B–S7L).
To test whether MORF3 can also ultra-sparsely label cortical PNs for neuronal reconstruction, we crossed MORF3 with Etv1-CreERT2 to label L5 PNs and Cux2-CreERT2 to label L2–L4 PNs (Madisen et al., 2010). With tamoxifen induction (see STAR Methods), the double MORF3/Etv1-CreERT2 mice label the L5 PNs at a very low density, and the labeled neurons can be readily reconstructed digitally (Figures 6I–6L and S8A–S8D). Similarly, the MORF3/Cux2-CreERT2 mice can readily label the L2–L4 cortical PNs at an ultra-sparse density, and the labeled cortical PNs can also be readily reconstructed with our current pipeline (Figures 6M–6P and S8E–S8I).
Applying MORF3 Mice to Study Axonal Development of Retinal HCs
One distinct advantage of MORF3-based genetic sparse cell labeling is to study the morphology of developing neurons in embryos or early postnatal days when other sparse labeling methods, such as viral-based labeling or slice microinjections, are not feasible. As a proof of concept, we tested whether MORF3 can be crossed to D1-Cre and D2-Cre lines to label D1-MSNs and D2-MSNs at postnatal day 0 (P0). As shown in Figure S9, we obtained MORF3/D1-Cre and MORF3/D2-Cre mice (N = 2 per genotype), and immunostained for both V5 epitope and DARPP-32, an early MSN differentiation marker. We found consistent sparse labeling of the differentiating D1-MSNs and D2-MSNs (Figure S9) in the two double-transgenic mice, revealing their developing dendritic processes (Figures S9E and S9K). There appears to be more overlap of DARPP-32+ striosomal neurons with D1-MSNs (Figures S9C and S9F) than their overlap with D2-MSNs (Figures S9I and S9L), a finding that is consistent with a prior study (Biezonski et al., 2015).
We next sought to provide a proof of concept that the MORF mice could be used to study neurodevelopmental questions that were not feasible with prior sparse labeling methods (e.g., viral-based labeling). We focused on examining the morphological development of retinal HCs, which constitute ~2%–3% of the neurons in the murine retina (Jeon et al., 1998; Whitney et al., 2011). They are inhibitory interneurons, and in rodents, they have spherical dendritic trees that synapse with cone photoreceptors and a long, thin axon with dense axonal termi-nals that synapse with rod photoreceptors (Peichl and González-Soriano, 1994). The morphology of HCs is important to their functions in local and global visual signal processing in the retina (Masland, 2012; Chapot et al., 2017; Chaya et al., 2017; Ströh et al., 2018; Drinnenberg et al., 2018). In rodents, most HCs become postmitotic by birth, and like other retinal cell types, HC neurogenesis and differentiation follow a center to peripheral gradient in the retina (Rapaport et al., 2004; Young, 1985). The development of HCs has been enigmatic due to the unusual soma migration and morphological plasticity in both the dendritic and axonal systems (Poché and Reese, 2009; Boije et al., 2016). Although HC development in different vertebrates has been extensively studied for over half a century (Poché and Reese, 2009; Boije et al., 2016), very little is known about the developmental axonal features of the HCs. The challenge to study the postnatal axonal development of HCs is the difficulty in sparsely and completely labeling the morphology of early postnatal HCs using the existing methods (Peichl and González-Soriano, 1994; Soto et al., 2018; Huckfeldt et al., 2009).
We sparsely labeled developing (P5) HCs by crossing MORF3 with Cx57-iCre (Hirano et al., 2016; Figure S10). We imaged the entire retina at 30× magnification for 3 different MORF3/Cx57-iCre retinas, each having ~1.2% HCs labeled with the td-smFPV5-F reporter (Table 1; Figure S10). Next, we digitally reconstructed the full morphology of 151 developing P5 HCs (Figure S11), which allowed us to extract 5 distinct morphological features: dendritic field size, axonal terminal arborization (length sum), longest axonal path, tortuosity of axons, and distance between the center of the retina to the neuronal soma (i.e., eccentricity; Figure 7A). We also defined novel morphological features observed in the developing HCs, including the length and number of axonal offshoots, which are extra-axonal branches along the long, thin axon (Figure 7A), and occasionally long, axon-like processes (Figures 7B and 7F). To our knowledge, this latter rare developing HC subtype (7/151) has never been described before. Correlation analyses and binary scatterplots of all seven morphological features and soma eccentricity provide new insights (Figures 7B and S12). The longest axonal path and the terminal axonal arborization are strongly correlated with each other, and they are significantly negatively correlated with soma eccentricity. This finding suggests that the central-to-peripheral retinal developmental gradient is strongly correlated with the HC axonal maturation at P5 (Figures 7B, S12A, S12B, and S12G). However, the dendritic field size is only modestly correlated with the two axonal parameters (Figures 7B, S12H, and S12I) and not significantly correlated with the soma location at all (Figure S12D). This is consistent with prior findings that independent cues may regulate the maturation of HC dendrites and axons (Poché and Reese, 2009; Soto et al., 2018). Moreover, the presence of the novel axonal offshoots and the length of such offshoots are not correlated with other morphological features or soma eccentricity, suggesting that these excessive early axonal growths may be pruned through a process that is not closely linked to the main axonal or dendritic development.
Figure 7. Morphological Analysis of 151 MORF3-Labeled Murine Retinal Horizontal Cells (HCs) in Development.

(A) Imaging and reconstructing the complete morphology of developing retinal HCs in the postnatal day 5 retina of MORF3/Cx57-iCre mice.
(B) Correlation heatmap of morphological and anatomical features extracted from reconstructed 151 retinal HCs. Blue and red signify positive and negative correlations, respectively. Correlations above 0.2 in absolute value are shown explicitly. The clustering tree on the left is based on dissimilarity equal to one minus the correlation matrix.
(C) t-Distributed stochastic neighbor embedding (t-SNE) plot of clustered retinal HCs. The colors and shapes represent the cell clusters.
(D) Hierarchical cell clustering based on morphological features and soma locations extracted from retinal HCs. The first row below the clustering tree represents clusters (each cluster is assigned a numeric label and color; label 0 and gray color are reserved for cells that are not part of a cluster); the rest of the rows represent, in heatmap form, cell shape statistics. For the heatmap, the shape statistics have been scaled to mean 0 and variance 1. The clustering tree of the shape statistics on the left represents the same clustering as in (B).
(E) Clusters ordered by the farthest soma distance from the center of the retina (least mature at periphery to most mature at center), with a representative example of neurons from each module.
(F) Examples of retinal HCs with >1 axonal projection or secondary process.
See also Figures S10–S12.
We next performed unbiased clustering analyses using all 7 HC morphological features and soma eccentricity and defined 7 distinct developing HC clusters (Figure 7D), which can be visualized in a t-distributed stochastic neighbor embedding (tSNE) plot (Figure 7C). Each developing HC cluster has a unique combination of morphological features (Figure 7D), which can be better visualized when we rank these cell clusters based on their soma eccentricity along the maturation gradient (Figure 7E). As expected, the black (cluster 7) and brown (cluster 3) clusters have the most soma eccentricity and immature morphological features (short axons and smaller dendritic fields), and they separate from each other based on the number of axonal offshoots. The HCs in the blue (cluster 2), red (cluster 6), and turquoise (cluster 1) clusters appear to have long, thin axons but differ from one another in terms of dendritic field size. The yellow cluster (cluster 4) appears to be the most mature as it is located closest to the center of the retina and it has long and tortuous axons (Figures 7D and 7E). The most peculiar and unexpected cell cluster is the green cluster (cluster 5), which consists of the HCs with 2 long axon-like processes (Figures 7D–7F). The somas for the green cluster HCs are in the middle of the center-peripheral gradient, suggesting that they belong to immature HCs (Figures 7E and 7F). Since such bi-axonal HCs are missing in the adult retina (data not shown), and some of the green cluster HCs show one axon with more elaborate processes than the other one, it suggests that the extra axons could be retracting or that these types of HCs are eliminated by the adult stage. In summary, the MORF3/Cx57-iCre mice allowed us to discover novel developmental axonal features of HCs, including unbiased morphology-based HC clusters and novel axonal branching patterns during HC development.
DISCUSSION
Cajal’s systematic investigation of the morphology of Golgi-stained neurons in vertebrates laid the foundation for modern neuroscience (Swanson and Lichtman, 2016). Despite a century of progress, the current neurotechnology for studying neuronal and glial cell morphology is mostly limited to only dozens of reconstructed cells per study (e.g., Gertler et al., 2008; De Biase et al., 2017), and the few studies with morphological analyses of 1,000–2,000 neurons are limited to large-scale organizational efforts (Winnubst et al., 2019; Markram et al., 2015). Thus, to systematically study the morphology of genetically defined neurons and glial cells in the mouse brain, there is a critical need for a simple, generalizable genetic method for sparse, stochastic, and complete labeling of brain cells that can be readily applied to study all of the different cell types in the brain. Here, we describe 4 MORF mouse lines that have been iteratively optimized for Cre-dependent sparse and complete labeling of 1%–5% of Cre-defined cells, a labeling frequency that is akin to the traditional Golgi staining method and hence suitable for brainwide morphological analyses of genetically defined neurons and glial cells.
Our suite of MORF mice, particularly MORF3 mice, represents a significant technological advance in genetically directed sparse cell labeling for studying the morphology of neurons and glial cells compared to prior methods. The first major advantage is the simplicity of our method for genetic cell labeling by simply crossing the MORF mice with any Cre mouse line, which is much simpler, cheaper, and scalable compared to traditional methods such as microinjections in brain slices and viral-based labeling. The second major advantage demonstrated with MORF3/Cre mice is the scale and distribution of genetically labeled neurons and glia: MORF3/Cre labels ~1%–5% of Cre+ neurons and glia distributed stochastically brainwide. Based on the labeling frequency (Table 1) and the total number of cortical interneurons and microglia (Erö et al., 2018; Tremblay et al., 2016), MORF3/Pvalb-Cre labels ~27,000 Pvalb+ cortical interneurons, MORF3/SST-Cre labels ~27,000 SST+ cortical interneurons, and MORF3/Cx3cr1-CreERT2 labels ~199,000 cortical microglia. Moreover, we provide a strategy to use low-level tamoxifen induction of MORF3/CreER mice to label ~3,000 MSNs in each MORF3/CamK2-CreERT2 mouse brain and >1,000 cortical L5 and L2–L4 PNs in MORF3/Etv1-CreERT2 and MORF3/Cux2-CreERT2 mice, respectively. In each case, we provide evidence that the labeled neurons or microglia can be digitally reconstructed with current algorithms. Thus, an important advance of MORF-based reporter mice is sparse and stochastic genetic labeling of thousands to tens of thousands of neurons or glial cells per brain and at a density and a clarity that are amenable to digital morphological reconstructions.
Our method is conceptually distinct and has greatly expanded utility compared to prior Cre-dependent reporter mouse lines for sparse cell labeling. MADM mice rely on the Cre-dependent mitotic recombination of two reporters located on two homologous chromosomes and are limited to Cre lines that express during mitosis, and cannot be used in combination with Cre lines that express in postmitotic neurons or glia cells (Zong et al., 2005). Another mouse line achieves low Cre-dependent labeling by placing long “spacer” DNA (e.g., >10 kb) in between two loxP sites (Ibrahim et al., 2018), but its labeling frequencies still appear too high (8%–10%) and its reporter (yellow fluorescent protein [YFP]) is suboptimal (Araki et al., 1997). Brainbow mice confer multi-color labeling of axons of Cre-defined neurons, but their dendritic labeling appears too dense to resolve (Livet et al., 2007). Moreover, compared to the exclusive use of CreER-inducible lines for sparse cell labeling (Badea et al., 2003, 2009), MORF3 has the versatility to be combined with all of the existing Cre mouse lines to obtain Cre-dependent sparse cell labeling. Finally, viral-based sparse neuronal labeling has certain limitations such as invasiveness of the viral studies, poor infectivity of AAV to microglia (Rosario et al., 2016), and the inability of viral-based labeling to study neurons and glia during embryonic or early postnatal development. In contrast, MORF3-based labeling can readily label the intact morphologies of microglia (Figures 4 and S5) and developing MSNs and HCs (Figures 7 and S9) for morphological studies. Together, our suite of MORF mice greatly expand our capability for brainwide sparse labeling of genetically defined neurons and glia for detailed analysis of their morphologies. Moreover, our optimized MORF3 mice provide the first simple, generalizable, and scalable solution for genetically directed sparse cell labeling to systematically study brain cell morphology in the mammalian brain.
The MORF mice should allow advances in addressing important neurobiological and disease research questions involving the brainwide analyses of genetically defined neuronal or glial cell morphology. The unbiased analyses of neuronal morphology and the integration of such data with molecular phenotyping should facilitate more precise brain cell-type classification, a major goal of the US BRAIN (Brain Research through Advancing Innovative Neurotechnologies) Initiative Cell Type Classification Consortium (Ecker et al., 2017; Zeng and Sanes, 2017). Another important application of the MORF-based sparse cell labeling is to examine the neuronal and glial cell morphology throughout embryonic and postnatal development, as demonstrated by our proof-of-concept study of the axonal development of postnatal retinal HCs. Finally, our MORF mice should greatly expand the use of brainwide neuronal and glial cell morphology to more precisely define cellular pathology in vulnerable neuronal or glial cell types in mouse models of brain diseases (Duman and Aghajanian, 2012; Adalbert and Coleman, 2013; Fu et al., 2018; Lee et al., 2018; Wang et al., 2014). With MORF mice labeling thousands or more genetically defined neurons or glial cells per brain and at densities and labeling strengths that are suitable for morphological reconstruction, we envision that MORF mice could be used for large-scale, brainwide quantitative analyses of neuronal and glial cell pathology, which in turn should accelerate the use of these models to elucidate disease mechanisms and test candidate therapeutics.
STAR★METHODS
RESOURCE AVAILABILITY
Lead Contact
Further information and requests for resources and reagents should be directed to the corresponding author, X. William Yang (xwyang@mednet.ucla.edu).
Materials Availability
Three newly generated MORF mouse lines are being deposited at the Jackson Laboratory for distribution to the scientific community. The JAX catalog numbers for these mice are: JAX #035400 (MORF1), JAX #035403 (MORF3), and JAX #035404 (TIGRE-MORF/Ai166).
Data and Code Availability
The R script implementing cell and shape measure clustering is available from the Lead Contact upon request.
EXPERIMENTAL MODEL AND SUBJECT DETAILS
Animal care and use
Animals were housed in a specific-pathogen-free barrier facility at UCLA, with up to four mice per cage with food and water available ad libitum. They were housed in a temperature-controlled environment with 12-hour light/dark cycle. Mouse care in the current study was in accordance with the United States Public Health Service Guide for the care and Use of Laboratory Animals. The procedures were approved by Chancellor’s Animal Research Committee (ARC) at UCLA. Veterinarian care was provided by the UCLA Division of Laboratory Animal Medicine. Sex matched animals were used for all experiments. No obvious differences between sexes were noted.
METHOD DETAILS
In vitro optimization of MORF expression
Plasmids harboring the described mononucleotide repeats and fluorescent reporters were cloned using standard molecular cloning techniques. The pCS2+ plasmid backbone was used for transient transfection reporter experiments. Experimental GFP reporter plasmids were co-transfected with pCS2-mCherry reporter for normalization of transfection efficiency into HEK293FT cells using FuGENE HD reagent (Promega, E2311). Cells were imaged 48 hours post transfection with standardized, non-saturating exposure times to measure fluorescent brightness. Unmodified GFP reporter was set at 100% brightness and experimental plasmid brightness normalized accordingly. Transfections were repeated at least three times and measurements for each field and channel were taken from three random fields per transfection using the ImageJ mean gray value function.
Transgenic mouse generation
MORF1 and MORF3 transgenic lines were generated through traditional Rosa26 gene knockin methods performed at the University of California-Irvine Transgenic Mouse Facility. The MORF1 and the MORF3 reporters were cloned using standard molecular cloning techniques into the Ai9 plasmid (Madisen et al., 2010), obtained from Addgene (plasmid #22799), at the FseI restriction sites to replace the original tdTomato reporter gene. The MORF1 reporter consists of a Kozak consensus start site followed by two Myc-tags, C22-repeat, mNeonGreen fluorescent reporter (Shaner et al., 2013), and membrane localization signal CAAX domain from Ras. The MORF3 reporter consists of a Kozak consensus start site followed by two Myc-tags, C22-repeat, the first smFP V5 reporter, tdTomato linker domain sequence, the second smFP V5 reporter, and membrane localization signal CAAX domain from Ras. smFP V5 was cloned from pCAG_smFP V5 plasmid obtained from Addgene (plasmid #59758). MORF2 transgenic mice were generated using the ϕC31 integrase method of targeted transgene insertion into the Rosa26 locus (Tasic et al., 2011) performed by Applied StemCell. The MORF2 reporter harboring a Kozak consensus start site followed by two Myc-tags, C22-repeat, mNeonGreen fluorescent reporter, tdTomato linker domain, smFP V5 reporter, and membrane localization signal CAAX domain from Ras was cloned into the pTARGATT6 vector for gene knockin. The TIGRE-MORF mouse line was generated using recombinase-mediated cassette exchange as described previously for TIGRE2.0 (Daigle et al., 2018). The TIGRE-MORF reporter harbors a Kozak consensus start site followed by two Myc-tags, G22-repeat, EGFP reporter, and membrane localization signal CAAX domain from Ras cloned into Flp targeted vector p841 TIGRE FlpIn. Germline transmission of each transgene was confirmed by PCR and adhered to the predicted Mendelian inheritance ratios. Mice were maintained on the C57BL/6J background.
Stereotaxic Viral Injections
Mice were deeply anesthetized with isofluorane (1%–2%) and mounted onto a stereotaxic frame with non-puncturing ear bars (Kopf Instruments). The scalp was opened and a hole for unilateral injection was drilled with a 0.5mm burr drill bit at the site of injection above the dorsal striatum (coordinates from bregma; AP = +1.0 mm, ML = +1.6 mm). rAAV2/2.CMV.Cre (1.1e12 GC/ml injection titer; University of Iowa Gene Transfer Vector Core) was unilaterally injected into the dorsal striatum (coordinates from surface of the brain; DV = −2.5mm) through a 33-gauge injector cannula (PlasticsOne) using a syringe pump (KDS) at a rate of 0.2 μl/min (0.5 μl total). After viral injection, the scalp was carefully closed and sutured. Following the surgical procedure, mice were individually housed and monitored for body weight and health until recovery from the surgery (1 week). To allow enough time for viral expression post-injection, we waited 2–3 weeks before perfusing the mice for tissue collection.
Tamoxifen induction of CreERT2 mice
Tamoxifen stock was prepared by dissolving tamoxifen (Cayman Chemical; Cat# 13258) in corn oil (Sigma-Aldrich; Cat# C8267) at a concentration of 20 mg/ml by shaking overnight at 37ºC. Tamoxifen was adjusted with corn oil to suitable working concentrations to administer by intraperitoneal (i.p.) injection at the doses stated (25–100mg/kg body weight in approximately 200μl of injection volume). CreERT2 mice received i.p. injections of tamoxifen once per day for 1 to 5 days (as indicated in text) and tissue was collected 1 week after the final injection.
Immunostaining and imaging of brain sections
Mice were transcardially perfused with 50 mL of 0.1 M phosphate buffered solution (PBS) followed by 50 mL of ice cold 4% paraformaldehyde (PFA). Tissues were then dissected and post-fixed in PFA overnight at 4ºC. For cryosectioning, tissues were incubated in 30% sucrose PBS for 48 hours and then snap frozen in powdered dry ice. Tissues were then sectioned at 40 μm on a cryostat. Immunostaining was performed using a standard protocol for floating sections. Sections were rinsed 3 times in PBS then blocked in 3% bovine serum albumin and 3% normal goat serum with 0.1% Triton X-100 for 1 hour. Primary antibodies at the noted concentrations were added to the blocking solution and sections incubated overnight at 4ºC with gentle shaking. The following day, sections were washed 3 times for fifteen minutes each and then incubated in secondary antibody (1:500 dilution for all secondaries) for at least 2 hours at room temperature. Sections were then stained with DAPI to label nuclei for 10 minutes, washed 3 times for ten minutes each, and finally mounted on slides with Prolong Diamond antifade reagent (P36965, ThermoFisher). Following curing overnight, slides were imaged using a Zeiss LSM800 confocal microscope. The following primary antibody dilutions were used: Mouse monoclonal anti-V5 tag (1:1000); Rabbit polyclonal anti-V5 tag (1:1000); Rabbit polyclonal anti-calbindin (1:1000); Mouse monoclonal anti-parvalbumin (1:3000); Rabbit polyclonal anti-DARPP-32 (1:500); Rabbit polyclonal anti-tyrosine hydroxylase (1:1000); and Mouse monoclonal anti-NeuN (1:1000).
Immunostaining and imaging of retina wholemounts and sections
Mice were euthanized with CO2 inhalation and retinas were dissected for wholemounts as described in Dunn and Wong (2012). Retinas were fixed with4%PFA in PBS for 15 minutes at room temperature then rinsed with PBS before incubating with blocking reagent (5% Normal Goat Serum and5%Triton-X in PBS) overnight at 4ºC. After blocking, primary antibodies were added in blocking reagent and incubated for 5 days at 4ºC. Then, retinas were washed 3x’s for 1 hour with PBS. Secondary antibodies were then added in blocking reagent and retinas were incubated overnight at 4ºC. Retinas were then washed 3x’s for 1 hour with PBS and mounted onto filter paper and prepared for imaging. Primary antibodies were used at the following dilutions: Chicken polyclonal anti-V5 (1:500) and Rabbit polyclonal anti-Cone Arrestin (1:500). All secondary antibodies were used at 1:500 dilution. The Cx57-iCre/MORF3 mice were sacrificed at P5 and tissue prepared as detailed above. The prepared tissue was imaged on an Andor DragonFly (Belfast, UK) spinning disk confocal microscope with a 30x silicone oil objective at 1 μm z-steps running Andor Fusion 2.1 and visualized with Imaris 9.3.
For retina sections, eyes of euthanized mice were enucleated and fixed with 4% PFA in PBS for 1 hour on ice. The cornea and lens were removed following fixation and the remaining eye cups were placed in 30% sucrose overnight at 4ºC. Eye cups were then frozen with OCT and retinas were sectioned at 20 μm with a cryostat. Alternating sections were collected in 10 different slides with each slide containing tissue representative of the entire retina. For immunostaining, slides were blocked with 10% Normal Goat Serum and 5% Triton-X in PBS for 1 hour at room temperature. Then, sections were incubated with primary antibody overnight at 4ºC. They were then rinsed 3x’s with PBS for 15 minutes. Retina sections were then incubated with secondary antibody overnight at 4ºC. These were subsequently washed 3x’s with PBS. They were then treated with DAPI (1:1000) for 30 minutes at room temperature and then rinsed 1x with PBS. Slides were then prepared for imaging. Primary antibodies were used at the following dilutions: Chicken polyclonal anti-V5 (1:500) and Rabbit polyclonal anti-calbindin (1:2000). All secondaries were used at 1:500 dilution.
Electron microscopy
Mice were deeply anesthetized with pentobarbital and perfused transcardially with ice-cold 0.2% or 0.5% glutaraldehyde (GA) and 4% paraformaldehyde (PFA) in 0.1 M phosphate buffer (PB), pH 7.4. The brain was removed and post-fixed in 0.2% or 0.5% GA and 4% PFA in 0.1 M PB overnight at 4ºC. The brain was washed in 0.1 M phosphate buffered saline (PBS, 0.1M, pH 7.4) and embedded in 10% gelatin (Sigma-Aldrich) dissolved in PBS. Vibratome sections were cut at 90 μm from the rostral forebrain through the hippocampus in the transverse plane. Sections were washed and then stored in 0.1 M PBS at 4ºC.
Selected vibratome sections were 1) washed in 0.1MPBS, 2) incubated in1%sodium borohydride (NaBH4) for 30 minutes in 0.1M PBS, or 3) immersed in 30% sucrose 0.1 M PBS and freeze thawed 3 times. The sections were washed in 0.1 M PBS for 3 × 10 minutes, transferred to plastic cell culture wells (NUNC) and immersed in a blocking solution (1% BSA fraction V, Sigma-Aldrich, 10% normal goat serum; NGS, S-1000, Vector Laboratories) for 1 hour, followed by incubation with the primary antibody (anti-V5 raised in rabbit, V8137, Sigma-Aldrich, for peroxidase) (1:500 in the blocking solution) for 5 days at 4ºC. Thereafter, the sections were washed (3 × 10 minutes) and incubated in the secondary goat anti-rabbit IgG antibody labeled with horseradish peroxidase (HRP) (1:1000, in PBS, plus 3 drops of NGS, Vector Labs). Sections incubated in HRP were washed with PBS (3 × 10 minutes) and incubated in 3,3′-diaminobenzidine (DAB) solution (ImmPACTTM DAB, SK-4103, Vector Labs, peroxidase substrate kit), reacted for 5 minutes, washed 3 times 10 minutes with PBS, and processed for transmission electron microscopy. Sections processed for immunofluorescence were incubated in chicken polyclonal anti-V5 tag (1:500, Abcam) antibody in 1% BSA, 3% NGS, 0.1% NaN3 in PBS for 3 days at room temperature with gentle shaking, washed 4 times for 15 minutes each in PBS, then incubated in Alexa 488 goat anti-chicken IgY (1:1000, Abcam) in 1% BSA, 3% NGS in PBS for 3 hours at room temperature with gentle shaking, washed in PBS 4 times for 15 minutes each, mounted in Prolong Gold antifade reagent (P36930, ThermoFisher), and evaluated using a Zeiss LSM880 confocal microscope.
The sections were washed in sodium cacodylate buffer (0.15 M, pH 7.4) 3 times for 20 minutes each, then immersed in 0.1% of aqueous osmium tetroxide (OsO4) for 30 minutes. Tissues were then rinsed with double distilled water (3 × 10 minutes) and placed in1%uranyl acetate (aqueous) and stored overnight at 4ºC. Tissue sections were washed with double distilled water (3×10 minutes) and dehydrated in ascending ethanol (30%, 50%, 70%, 80%, 95%, 2x, 100x for 10 minutes each), and 5 minutes propylene oxide. Sections were then infiltrated with resin Epon® 812 (Electron Microscopy Sciences (EMS), Hatfield, PA, USA) as follows: a mixture of 100% resin and two parts of propylene oxide for two hours, and then 100% resin for 2 hours. Sections were flat mounted and then incubated in the oven (65ºC) with fresh resin for 48 hours. The areas of interest (cortex and hippocampus) were cut from the section (1×1 mm) and mounted on polymerized Epon blocks using superglue. Thin sections (0.5-micron thick, approximately 5–10 sections), were obtained to identify immunoreactive somata, dendrites, axons, and terminals. Ultrathin sections (90 nm thick) were obtained using a diamond knife (Diatome) with an AO/Reichter Ultracut-E microtome. Sections were collected on single slot carbon-formvar coated copper grids (0.5×2mm).
Transmission electron microscopy observations and digital image captures were made using a FEI Tecnai transmission electron microscope T12 TEM −120 KV (Hillsboro, Oregon USA). All sections were systematically analyzed at low (2000x magnification), and higher magnifications (4,000–10,000x). Sections were studied for the presence of immunoreactive somata, dendrites and axons, and terminals. Images were collected using a Gatan 2kX2k CCD camera at a 0.2 nm line resolution. Images were post-processed using Adobe Photoshop for adjustment of brightness and contrast.
iDISCO+ tissue immunostaining, clearing, and imaging of thick brain sections
Mice were transcardially perfused with 50 mL of 0.1 M phosphate buffered solution (PBS) followed by 50 mL of ice cold 4% paraformaldehyde (PFA). Tissues were then dissected and post-fixed in PFA overnight at 4ºC. Tissues were stored at 4ºC in 0.01M PBS with 0.02% sodium azide. Tissues were vibratome sectioned (Compresstome; Precisionary Instruments) at 300–600 μm. Immunostaining and clearing of the thick sections were adapted for MORF tissues from the iDISCO+ protocol (Renier et al., 2016).
Prior to immunolabeling, sections were dehydrated with a series of methanol (MeOH) washes (20%, 40%, 60%, 80%, 100%; room temperature for 1 hour at each step) and membrane lipids were removed with an overnight incubation in 66% dichloromethane (DCM) and 33% MeOH at room temperature. Sections were bleached with hydrogen peroxide (5% in MeOH) overnight at 4ºC to reduce tissue autofluorescence. Sections were then rehydrated with decreasing concentrations of MeOH (80%, 60%, 40%, 20%, then 0.01M PBS; room temperature for 1 hour each step) and incubated overnight at 37ºC in a permeabilization solution (0.01M PBS with 0.2% Triton X-100 and 20% DMSO). Sections were blocked overnight at 37ºC in 0.01M PBS, 0.2% Triton X-100, 6% normal goat serum (NGS), and 10% DMSO. Sections were then incubated in primary antibody (rabbit polyclonal anti-V5 tag; 1:500) in 0.01M PBS, 0.2% Triton X-100, 3% NGS, 5% DMSO, and 10 μg/ml heparin for 72 hours at 37ºC. The primary antibody solution was replaced every 24 hours (same 1:500 primary antibody concentration). After overnight washing in 0.01M PBS with 0.2% Triton X-100, sections were incubated in fluorescent-conjugated secondary antibody (Alexa Fluor 647 goat anti-rabbit; 1:500) and a fluorescent Nissl stain (NeuroTrace blue; 1:300) in 0.01M PBS, 0.2% Triton X-100, 3% NGS, and 10 μg/ml heparin for 72 hours at 37ºC. The secondary antibody and NeuroTrace solution were replaced every 24 hours (same 1:500 secondary antibody and 1:300 NeuroTrace concentrations). Following overnight washing in 0.01M PBS with 0.2% Triton X-100 and 10 μg/ml heparin, sections were dehydrated with increasing MeOH washes (20%, 40%, 60%, 80%, 100%; room temperature for 1 hour at each step) for tissue clearing. Sections were incubated overnight in 66% dichloromethane (DCM) and 33% MeOH at room temperature followed by two 15-minute washes in 100% DCM. Sections were cleared by incubating in dibenzylether (DBE) for at least 2 hours. Cleared tissue was mounted in DBE on glass microscope slides. Sections in DBE were covered with glass coverslips with silicone spacers and edges were sealed with silicone.
Following curing of the silicone seal overnight, slides were imaged using an Andor DragonFly spinning disk confocal equipped with low-power (2x and 10x) and high-power silicone immersion objectives (30x, 40x, 60x, and 100x) from Olympus. For both low- and high-power imaging, individual image tiles were stitched into composite images with Imaris Stitcher.
QUANTIFICATION AND STATISTICAL ANALYSIS
Quantification of in vitro optimization of MORF expression
For transient transfection experiments, one-way ANOVA was performed with Tukey’s post hoc test for significance set at p < 0.05. For comparison of transgene brightness between MORF1, MORF2, and MORF3, three random fields from three different mice were imaged in the dorsal striatum of Drd2-Cre/MORF mice. Fields were imaged using standardized exposure for comparison. Statistical analysis used one-way ANOVA with Tukey’s post hoc test with statistical significance set at p < 0.05. SPSS statistical software (IBM) was used for data analysis.
Quantification of MORF labeling frequency
To quantify cell labeling efficiency in immunostained tissue sections, three random fields were imaged in the region of interest for each mouse and MORF+ cells were counted as a proportion of the targeted cell population to give a percent labeled for each image. Average labeling frequency is reported for each Cre/MORF combination, n = 1–4 mice per genotype. For horizontal cell labeling frequency with MORF2 and MORF3, retina sections from two different slides and two different animals (4 slides total) were stained as described above. The total number of V5+ cells and calbindin+ (known horizontal cell marker; Haverkamp and Wässle, 2000) cells were counted for each slide. The labeling frequency (in percentage) is the total number of V5+ cells over the number of calb+ cells.
Reconstruction and morphometric quantification of MORF-labeled cells
Individual neurons were either reconstructed in Imaris or extracted directly to TIFF stacks with custom MATLAB code and reconstructed in neuTube. Neurons in Imaris were reconstructed automatically and then manually edited, while neurons in neuTube were semi-automatically reconstructed. Only neurons with their complete morphologies contained within the section were reconstructed. The medium spiny neurons were reconstructed in neuTube and then quantified in the following manner: the number of dendrites coming directly from the soma were counted, and the longest of them was measured along its path to obtain a “longest path length” feature. The Euclidean distance from the soma to the tip of the longest primary dendrite was also recorded. Finally, the distance units provided by neuTube were converted to μm by imaging a slide with a calibration grid (10 μm ticks) and processing it in an identical manner to the neurons. The conversion factor was determined to be 2.5 “neuTube units” per μm.
For horizontal cells, each retina was examined for reconstructable retinal horizontal cells (no overlap of dendritic fields and/or terminal branches). The reconstructable retinal horizontal cells were isolated into their own Imaris file and were semi-automatically reconstructed in 3D with Imaris Filament Tracer (Bitplane). All 151 reconstructions were further broken down into three major parts: the dendritic field, the main axon, and the terminal arbor. The main axon is defined as the thickest process from the soma that begins at the soma and ends at the earliest (in order of importance): bifurcation of the main axon, clear axonal thickening, or the last 1/3rd of the horizontal cell along the longest axonal path. The terminal arbor consists of all the processes from the point the main axon ends to the tail end of the cell. Additional quantifications, including tortuosity (Stepanyants et al., 2004), dendritic field size (Yoshimatsu et al., 2014), longest axonal path, terminal arborization length sum, secondary process length, center to soma distance, number of offshoots greater than 10 μm, and total offshoot length, were performed in Imaris and ImageJ for each of the 151 reconstructed P5 retinal horizontal cells. Longest axonal path was determined by taking the longest possible path along the main axon from the soma to the tip of the terminal arbor. The terminal arborization length sum was calculated by summing the lengths of all the filaments that comprise the terminal arbor. Secondary process length was found by summing the length of any dendritic projections coming from the soma that are more than 50% longer than the next longest dendritic projection and that is not the main axon. The center to soma distance was calculated by measuring distance from the middle of the retina to the center of the soma in Imaris. The number of offshoots was found by counting all the processes coming off the main axon that were greater than 10 μm. These were also summed to obtain the total offshoot length parameter.
Clustering analysis of cells
Eight cell shape measures (tortuosity, dendritic field size, longest axonal path, terminal arborization length sum, secondary process length, center to soma distance, number of offshoots greater than 10 μm, and total offshoot length) were used for cell clustering. The measures were first clustered using average linkage hierarchical clustering with biweight midcorrelation (a robust correlation; Wilcox, 2011) as measure of similarity, and measures with robust correlations higher than 0.5 were merged and summarized using the first principal component. Specifically, total offshoot length and number of offshoots larger than 10 μm were merged, as were terminal arborization length sum and longest axonal path. All 4 remaining shape measures as well as the two principal components were scaled to mean zero and length 1 and then collected into a single matrix A with 6 columns. Cells were then clustered using average linkage hierarchical clustering of Euclidean distance of rows of the matrix A. Cell clusters were defined from the resulting clustering tree using Dynamic Tree Cut (Langfelder et al., 2008) with arguments deepSplit = 1 and minimum cluster size of 5. For cluster visualization, we used t-Distributed Stochastic Neighbor Embedding (t-SNE; Maaten and Hinton, 2008) initialized using the first two singular vectors of A. The clustering analysis was carried out in R.
Supplementary Material
KEY RESOURCES TABLE.
| REAGENT or RESOURCE | SOURCE | IDENTIFIER |
|---|---|---|
| Antibodies | ||
| Mouse monoclonal anti-V5 tag | Bio-Rad | Cat# MCA1360; RRID: AB_322378 |
| Rabbit polyclonal anti-V5 tag | Bethyl | Cat# A190-120A; RRID: AB_67586 |
| Chicken polyclonal anti-V5 tag | Bethyl | Cat# A109-118A; RRID: AB_66741 |
| Chicken polyclonal anti-V5 tag | Abcam | Cat# ab9113; RRID: AB_307022 |
| Rabbit polyclonal anti-S100 beta | Abcam | Cat# ab41548; RRID: AB_956280 |
| Rabbit polyclonal anti-Cone Arrestin | Millipore | Cat# AB15282; RRID: AB_1163387 |
| Rabbit polyclonal anti-tyrosine hydroxylase | Millipore | Cat# AB152; RRID: AB_390204 |
| Mouse monoclonal anti-NeuN | Millipore | Cat# MAB377; RRID: AB_2298772 |
| Rabbit polyclonal anti-calbindin | Swant | Cat# CB38; RRID: AB_2721225 |
| Mouse monoclonal anti-parvalbumin | Swant | Cat# 235; RRID: AB_10000343 |
| Rabbit polyclonal anti-DARPP-32 | Santa Cruz | Cat# sc-11365; RRID: AB_639000 |
| Rabbit polyclonal anti-somatostatin | Novus | Cat# NBP187022; RRID: AB_11034314 |
| Rabbit polyclonal anti-Iba1 | Wako | Cat# 019-19741; RRID: AB_839504 |
| Rabbit polyclonal anti-GFAP | Agilent | Cat# Z0334; RRID: AB_10013382 |
| Alexa Fluor 488 goat anti-chicken IgG | Thermo Fisher | Cat# A-11039; RRID: AB_2534096 |
| Alexa Fluor 488 goat anti-mouse IgG | Thermo Fisher | Cat# A-11001; RRID: AB_2534069 |
| Alexa Fluor 568 goat anti-rabbit IgG | Thermo Fisher | Cat# A-11036; RRID: AB_10563566 |
| Alexa Fluor 594 goat anti-mouse IgG | Thermo Fisher | Cat# A-11005; RRID: AB_2534073 |
| Alexa Fluor 633 goat anti-rabbit IgG | Thermo Fisher | Cat# A-21071; RRID: AB_2535732 |
| Alexa Fluor 647 goat anti-rabbit IgG | Thermo Fisher | Cat# A-32733; RRID: AB_2633282 |
| NeuroTrace Blue Fluorescent Nissl Stain | Thermo Fisher | Cat# N21479 |
| Bacterial and Virus Strains | ||
| rAAV2/2.CMV.Cre | University of Iowa Gene Transfer Vector Core | Cat# VVC-U of Iowa-3534 |
| Biological Samples | ||
| Chemicals, Peptides, and Recombinant Proteins | ||
| Critical Commercial Assays | ||
| Deposited Data | ||
| Experimental Models: Cell Lines | ||
| HEK 293FT | Thermo Fisher | R70007 |
| Experimental Models: Organisms/Strains | ||
| Mouse: MORF1 | This paper | JAX: 035400 |
| Mouse: MORF2 | This paper | N/A |
| Mouse: MORF3 | This paper | JAX: 035403 |
| Mouse: TIGRE-MORF (Ai166) | This paper | JAX: 035404 |
| Mouse: B6;129S6-Tg(Camk2a-cre/ERT2)1Aibs/J | The Jackson Laboratory | JAX: 012362 |
| Mouse: B6.129-Tg(Pcp2-cre)2Mpin/J | The Jackson Laboratory | JAX: 004146 |
| Mouse: B6;129P2-Pvalbtm1(cre)Arbr/J | The Jackson Laboratory | JAX: 008069 |
| Mouse: B6.FVB-Tg(EIIa-cre)C5379Lmgd/J | The Jackson Laboratory | JAX: 003724 |
| Mouse: B6.Cg-7630403G23RikTg(Th-cre)1Tmd/J | The Jackson Laboratory | JAX: 008601 |
| Mouse: B6.129(SJL)-Kcng4tm1.1(cre) Jrs/J | The Jackson Laboratory | JAX: 029414 |
| Mouse: B6(Cg)-Etv1tm1.1(cre/ERT2) Zjh/J | The Jackson Laboratory | JAX: 013048 |
| Mouse: Ssttm2.1(cre)Zjh/J | The Jackson Laboratory | JAX: 013044 |
| Mouse: B6.129P2(C)-Cx3cr1tm2.1 (cre/ERT2)Jung/J | The Jackson Laboratory | JAX: 020940 |
| Mouse: B6N.FVB-Tg(Aldh1l1-cre/ERT2) 1Khakh/J | The Jackson Laboratory | JAX: 031008 |
| Mouse: B6.Cg-Tg(Nes-cre)1Kln/J | The Jackson Laboratory | JAX: 003771 |
| Mouse: B6.FVB(Cg)-Tg(Drd1-cre)EY262Gsat/Mmucd | MMRRC | 030989-UCD |
| Mouse: B6.FVB(Cg)-Tg(Drd2-cre)ER44Gsat/Mmucd | MMRRC | 032108-UCD |
| Mouse: STOCK Tg(Rbp4-cre)KL100Gsat/Mmucd | MMRRC | 031125-UCD |
| Mouse: STOCK Tg(Adora2a-cre) KG139Gsat/Mmucd | MMRRC | 031168-UCD |
| Mouse: B6(Cg)-Cux2tm3.1(cre/ERT2) Mull/Mmmh | MMRRC | 032779-MU |
| Mouse: Cx57-iCre | From the lab of Nicholas Brecha (Hirano et al., 2016) | N/A |
| Oligonucleotides | ||
| Recombinant DNA | ||
| pCS2-EGFP | This paper | N/A |
| pCS2-mCherry | This paper | N/A |
| pCS2-A21-EGFP | This paper | N/A |
| pCS2-T21-EGFP | This paper | N/A |
| pCS2-G21-EGFP | This paper | N/A |
| pCS2-C21-EGFP | This paper | N/A |
| pCS2-1xMyc-G21-EGFP | This paper | N/A |
| pCS2-2xMyc-G21-EGFP | This paper | N/A |
| pCS2-2xMyc-C21-EGFP | This paper | N/A |
| Ai9-MORF1 | This paper | N/A |
| pTARGATT6-MORF2 | This paper | N/A |
| Ai9-MORF3 | This paper | N/A |
| TIGRE-MORF (Ai166) | This paper | N/A |
| Software and Algorithms | ||
| ImageJ | National Institutes of Health | https://imagej.nih.gov/ij/download.html |
| Andor FUSION | Oxford Instruments | https://andor.oxinst.com/products/dragonfly |
| Imaris Image Analysis and Stitcher | Oxford Instruments | https://imaris.oxinst.com/ |
| neuTube | Feng et al., 2015 | https://www.neutracing.com/ |
| Matlab | MathWorks | https://www.mathworks.com/products/matlab.html |
| R | The R Foundation R Foundation for Statistical Computing | https://www.r-project.org/ |
| SPSS Statistics GradPack | IBM | RRID:SCR_002865; https://www.ibm.com/products/spss-statistics-gradpack |
| Other | ||
Highlights.
Optimized MORF method for bright, Cre-dependent, genetic sparse cell labeling
Four new mouse lines for fluorescent, immunogenic, and EM sparse cell labeling
Full cell morphology of projection and interneurons as well as glia revealed
Developmental characterization of retinal horizontal cell morphogenesis
ACKNOWLEDGMENTS
This research was supported by the National Institutes of Health’s (NIH’s) US BRAIN Initiative grants to X.W.Y. (MH106008) and to X.W.Y. and H.-W.D. (MH117079). X.W.Y. is also supported by the NIH (NS084298, AG056114, and P50DA005010), the CHDI Foundation, the Hereditary Disease Foundation, and the Terry Semel Chair in Alzheimer’s Disease Research and Treatment at UCLA. N.C.B. is funded by the NIH (EY15573 and EY29869) and E.Z.S. is funded by the National Eye Institute (NEI; 1K99EY028200). We thank J. Neumann and the University of California, Irvine Transgenic Core for embryonic stem cell (ESC) targeting and blastocyst injections; the Semel Institute Intellectual and Developmental Disabilities Research Center (IDDRC) Microscopy Core (National Institute of Child Health and Human Development (NICHD) U54HD087101); D. Acuna for help in the EM study; J. Hernandez for help in the retina dissections; and Zhuhao Wu (The Rockefeller University) for the iDISCO+ protocol.
Footnotes
DECLARATION OF INTERESTS
X.W.Y. and M.B.V. are co-inventors on a provisional patent related to this work.
SUPPLEMENTAL INFORMATION
Supplemental Information can be found online at https://doi.org/10.1016/j.neuron.2020.07.019.
REFERENCES
- Adalbert R, and Coleman MP (2013). Review: axon pathology in age-related neurodegenerative disorders. Neuropathol. Appl. Neurobiol 39, 90–108. [DOI] [PubMed] [Google Scholar]
- Araki K, Imaizumi T, Okuyama K, Oike Y, and Yamamura K (1997). Efficiency of recombination by Cre transient expression in embryonic stem cells: comparison of various promoters. J. Biochem 122, 977–982. [DOI] [PubMed] [Google Scholar]
- Ascoli GA, Donohue DE, and Halavi M (2007). NeuroMorpho.Org: a central resource for neuronal morphologies. J. Neurosci 27, 9247–9251. [DOI] [PMC free article] [PubMed] [Google Scholar]
- Badea TC, Wang Y, and Nathans J (2003). A noninvasive genetic/pharmacologic strategy for visualizing cell morphology and clonal relationships in the mouse. J. Neurosci 23, 2314–2322. [DOI] [PMC free article] [PubMed] [Google Scholar]
- Badea TC, Hua ZL, Smallwood PM, Williams J, Rotolo T, Ye X, and Nathans J (2009). New mouse lines for the analysis of neuronal morphology using CreER(T)/loxP-directed sparse labeling. PLOS ONE 4, e7859. [DOI] [PMC free article] [PubMed] [Google Scholar]
- Baena V, Schalek RL, Lichtman JW, and Terasaki M (2019). Serial-section electron microscopy using automated tape-collecting ultramicrotome (ATUM). Methods Cell Biol. 152, 41–67. [DOI] [PMC free article] [PubMed] [Google Scholar]
- Bargmann CI, and Newsome WT (2014). The Brain Research Through Advancing Innovative Neurotechnologies (BRAIN) Initiative and Neurology. JAMA Neurol. 71, 675–676. [DOI] [PubMed] [Google Scholar]
- Bhargava A, and Fuentes FF (2010). Mutational dynamics of microsatellites. Mol. Biotechnol 44, 250–266. [DOI] [PubMed] [Google Scholar]
- Biezonski DK, Trifilieff P, Meszaros J, Javitch JA, and Kellendonk C (2015). Evidence for limited D1 and D2 receptor coexpression and colocalization within the dorsal striatum of the neonatal mouse. J. Comp. Neurol 523, 1175–1189. [DOI] [PMC free article] [PubMed] [Google Scholar]
- Boije H, Shirazi Fard S, Edqvist PH, and Hallböök F (2016). Horizontal Cells, the Odd Ones Out in the Retina, Give Insights into Development and Disease. Front. Neuroanat 10, 77. [DOI] [PMC free article] [PubMed] [Google Scholar]
- Buschiazzo E, and Gemmell NJ (2006). The rise, fall and renaissance of microsatellites in eukaryotic genomes. BioEssays 28, 1040–1050. [DOI] [PubMed] [Google Scholar]
- Cajal SR (1909). Histologie du Système Nerveux de L’Homme & Des Vertébrés (Oxford University Press; ). [Google Scholar]
- Chan KY, Jang MJ, Yoo BB, Greenbaum A, Ravi N, Wu WL, Sánchez-Guardado L, Lois C, Mazmanian SK, Deverman BE, and Gradinaru V (2017). Engineered AAVs for efficient noninvasive gene delivery to the central and peripheral nervous systems. Nat. Neurosci 20, 1172–1179. [DOI] [PMC free article] [PubMed] [Google Scholar]
- Chapot CA, Euler T, and Schubert T (2017). How do horizontal cells ‘talk’ to cone photoreceptors? Different levels of complexity at the cone-horizontal cell synapse. J. Physiol 595, 5495–5506. [DOI] [PMC free article] [PubMed] [Google Scholar]
- Chaya T, Matsumoto A, Sugita Y, Watanabe S, Kuwahara R, Tachibana M, and Furukawa T (2017). Versatile functional roles of horizontal cells in the retinal circuit. Sci. Rep 7, 5540. [DOI] [PMC free article] [PubMed] [Google Scholar]
- Chung WS, Welsh CA, Barres BA, and Stevens B (2015). Do glia drive synaptic and cognitive impairment in disease? Nat. Neurosci 18, 1539–1545. [DOI] [PMC free article] [PubMed] [Google Scholar]
- Daigle TL, Madisen L, Hage TA, Valley MT, Knoblich U, Larsen RS, Takeno MM, Huang L, Gu H, Larsen R, et al. (2018). A Suite of Transgenic Driver and Reporter Mouse Lines with Enhanced Brain-Cell-Type Targeting and Functionality. Cell 174, 465–480.e22. [DOI] [PMC free article] [PubMed] [Google Scholar]
- De Biase LM, Schuebel KE, Fusfeld ZH, Jair K, Hawes IA, Cimbro R, Zhang HY, Liu QR, Shen H, Xi ZX, et al. (2017). Local Cues Establish and Maintain Region-Specific Phenotypes of Basal Ganglia Microglia. Neuron 95, 341–356.e6. [DOI] [PMC free article] [PubMed] [Google Scholar]
- Dong HW (2008). The Allen Reference Atlas: A Digital Color Brain Atlas of the C57BL/6J Male Mouse (Wiley; ). [Google Scholar]
- Drinnenberg A, Franke F, Morikawa RK, Jüttner J, Hillier D, Hantz P, Hierlemann A, Azeredo da Silveira R, and Roska B (2018). How diverse retinal functions arise from feedback at the first visual synapse. Neuron 99, 117–134.e11. [DOI] [PMC free article] [PubMed] [Google Scholar]
- Duman RS, and Aghajanian GK (2012). Synaptic dysfunction in depression: potential therapeutic targets. Science 338, 68–72. [DOI] [PMC free article] [PubMed] [Google Scholar]
- Dunn FA, and Wong RO (2012). Diverse strategies engaged in establishing stereotypic wiring patterns among neurons sharing a common input at the visual system’s first synapse. J. Neurosci 32, 10306–10317. [DOI] [PMC free article] [PubMed] [Google Scholar]
- Ecker JR, Geschwind DH, Kriegstein AR, Ngai J, Osten P, Polioudakis D, Regev A, Sestan N, Wickersham IR, and Zeng H (2017). The BRAIN Initiative Cell Census Consortium: Lessons Learned toward Generating a Comprehensive Brain Cell Atlas. Neuron 96, 542–557. [DOI] [PMC free article] [PubMed] [Google Scholar]
- Economo MN, Clack NG, Lavis LD, Gerfen CR, Svoboda K, Myers EW, and Chandrashekar J (2016). A platform for brain-wide imaging and reconstruction of individual neurons. eLife 5, e10566. [DOI] [PMC free article] [PubMed] [Google Scholar]
- Erö C, Gewaltig MO, Keller D, and Markram H (2018). A Cell Atlas for the Mouse Brain. Front. Neuroinform 12, 84. [DOI] [PMC free article] [PubMed] [Google Scholar]
- Feng L, Zhao T, and Kim J (2015). neuTube 1.0: A New Design for Efficient Neuron Reconstruction Software Based on the SWC Format. eNeuro 2, ENEURO.0049–14.2014. [DOI] [PMC free article] [PubMed] [Google Scholar]
- Fu H, Hardy J, and Duff KE (2018). Selective vulnerability in neurodegenerative diseases. Nat. Neurosci 21, 1350–1358. [DOI] [PMC free article] [PubMed] [Google Scholar]
- Gertler TS, Chan CS, and Surmeier DJ (2008). Dichotomous anatomical properties of adult striatal medium spiny neurons. J. Neurosci 28, 10814–10824. [DOI] [PMC free article] [PubMed] [Google Scholar]
- Gouwens NW, Sorensen SA, Berg J, Lee C, Jarsky T, Ting J, Sunkin SM, Feng D, Anastassiou CA, Barkan E, et al. (2019). Classification of electrophysiological and morphological neuron types in the mouse visual cortex. Nat. Neurosci 22, 1182–1195. [DOI] [PMC free article] [PubMed] [Google Scholar]
- Guérin CJ, Kremer A, Borghgraef P, Shih AY, and Lippens S (2019). Combining serial block face and focused ion beam scanning electron microscopy for 3D studies of rare events. Methods Cell Biol. 152, 87–101. [DOI] [PubMed] [Google Scholar]
- Hameyer D, Loonstra A, Eshkind L, Schmitt S, Antunes C, Groen A, Bindels E, Jonkers J, Krimpenfort P, Meuwissen R, et al. (2007). Toxicity of ligand-dependent Cre recombinases and generation of a conditional Cre deleter mouse allowing mosaic recombination in peripheral tissues. Physiol. Genomics 31, 32–41. [DOI] [PubMed] [Google Scholar]
- Haverkamp S, and Wässle H (2000). Immunocytochemical analysis of the mouse retina. J. Comp. Neurol 424, 1–23. [PubMed] [Google Scholar]
- Hayashi S, and McMahon AP (2002). Efficient recombination in diverse tissues by a tamoxifen-inducible form of Cre: a tool for temporally regulated gene activation/inactivation in the mouse. Dev. Biol 244, 305–318. [DOI] [PubMed] [Google Scholar]
- Heintzmann R, and Ficz G (2013). Breaking the Resolution Limit in Light Microscopy In Methods in Cell Biology, Sluder G and Wolf DE, eds. (Elsevier; ), pp. 525–544. [DOI] [PubMed] [Google Scholar]
- Helmstaedter M, Briggman KL, Turaga SC, Jain V, Seung HS, and Denk W (2013). Connectomic reconstruction of the inner plexiform layer in the mouse retina. Nature 500, 168–174. [DOI] [PubMed] [Google Scholar]
- Herculano-Houzel S (2012). The remarkable, yet not extraordinary, human brain as a scaled-up primate brain and its associated cost. Proc. Natl. Acad. Sci. USA 109 (Suppl 1 ), 10661–10668. [DOI] [PMC free article] [PubMed] [Google Scholar]
- Herculano-Houzel S, Mota B, and Lent R (2006). Cellular scaling rules for rodent brains. Proc. Natl. Acad. Sci. USA 103, 12138–12143. [DOI] [PMC free article] [PubMed] [Google Scholar]
- Hintiryan H, Foster NN, Bowman I, Bay M, Song MY, Gou L, Yamashita S, Bienkowski MS, Zingg B, Zhu M, et al. (2016). The mouse cortico-striatal projectome. Nat. Neurosci 19, 1100–1114. [DOI] [PMC free article] [PubMed] [Google Scholar]
- Hirano AA, Liu X, Boulter J, Grove J, Pérez de Sevilla Müller L, Barnes S, and Brecha NC (2016). Targeted Deletion of Vesicular GABA Transporter from Retinal Horizontal Cells Eliminates Feedback Modulation of Photoreceptor Calcium Channels. eNeuro 3, ENEURO.0148–15.2016. [DOI] [PMC free article] [PubMed] [Google Scholar]
- Hordeaux J, Yuan Y, Clark PM, Wang Q, Martino RA, Sims JJ, Bell P, Raymond A, Stanford WL, and Wilson JM (2019). The GPI-Linked Protein LY6A Drives AAV-PHP.B Transport across the Blood-Brain Barrier. Mol. Ther 27, 912–921. [DOI] [PMC free article] [PubMed] [Google Scholar]
- Huang ZJ, and Paul A (2019). The diversity of GABAergic neurons and neural communication elements. Nat. Rev. Neurosci 20, 563–572. [DOI] [PMC free article] [PubMed] [Google Scholar]
- Huckfeldt RM, Schubert T, Morgan JL, Godinho L, Di Cristo G, Huang ZJ, and Wong RO (2009). Transient neurites of retinal horizontal cells exhibit columnar tiling via homotypic interactions. Nat. Neurosci 12, 35–43. [DOI] [PMC free article] [PubMed] [Google Scholar]
- Ibrahim LA, Huang JJ, Wang SZ, Kim YJ, Zhang LI, and Tao HW (2018). Sparse Labeling and Neural Tracing in Brain Circuits by STARS Strategy: Revealing Morphological Development of Type II Spiral Ganglion Neurons. Cereb. Cortex 10.1093/cercor/bhy154. [DOI] [PubMed] [Google Scholar]
- Jefferis GS, and Livet J (2012). Sparse and combinatorial neuron labelling. Curr. Opin. Neurobiol 22, 101–110. [DOI] [PubMed] [Google Scholar]
- Jeon CJ, Strettoi E, and Masland RH (1998). The major cell populations of the mouse retina. J. Neurosci 18, 8936–8946. [DOI] [PMC free article] [PubMed] [Google Scholar]
- Kasthuri N, Hayworth KJ, Berger DR, Schalek RL, Conchello JA, Knowles-Barley S, Lee D, Vázquez-Reina A, Kaynig V, Jones TR, et al. (2015). Saturated Reconstruction of a Volume of Neocortex. Cell 162, 648–661. [DOI] [PubMed] [Google Scholar]
- Khakh BS, Beaumont V, Cachope R, Munoz-Sanjuan I, Goldman SA, and Grantyn R (2017). Unravelling and Exploiting Astrocyte Dysfunction in Huntington’s Disease. Trends Neurosci. 40, 422–437. [DOI] [PMC free article] [PubMed] [Google Scholar]
- Lakso M, Pichel JG, Gorman JR, Sauer B, Okamoto Y, Lee E, Alt FW, and Westphal H (1996). Efficient in vivo manipulation of mouse genomic sequences at the zygote stage. Proc. Natl. Acad. Sci. USA 93, 5860–5865. [DOI] [PMC free article] [PubMed] [Google Scholar]
- Langfelder P, Zhang B, and Horvath S (2008). Defining clusters from a hierarchical cluster tree: the Dynamic Tree Cut package for R. Bioinformatics 24, 719–720. [DOI] [PubMed] [Google Scholar]
- Lee CYD, Daggett A, Gu X, Jiang LL, Langfelder P, Li X, Wang N, Zhao Y, Park CS, Cooper Y, et al. (2018). Elevated TREM2 Gene Dosage Reprograms Microglia Responsivity and Ameliorates Pathological Phenotypes in Alzheimer’s Disease Models. Neuron 97, 1032–1048.e5. [DOI] [PMC free article] [PubMed] [Google Scholar]
- Li YC, Korol AB, Fahima T, and Nevo E (2004). Microsatellites within genes: structure, function, and evolution. Mol. Biol. Evol 21, 991–1007. [DOI] [PubMed] [Google Scholar]
- Li et al. (2019).
- Lichtman JW, and Denk W (2011). The big and the small: challenges of imaging the brain’s circuits. Science 334, 618–623. [DOI] [PubMed] [Google Scholar]
- Livet J, Weissman TA, Kang H, Draft RW, Lu J, Bennis RA, Sanes JR, and Lichtman JW (2007). Transgenic strategies for combinatorial expression of fluorescent proteins in the nervous system. Nature 450, 56–62. [DOI] [PubMed] [Google Scholar]
- Long JM, and Holtzman DM (2019). Alzheimer Disease: An Update on Pathobiology and Treatment Strategies. Cell 179, 312–339. [DOI] [PMC free article] [PubMed] [Google Scholar]
- Lu XH, and Yang XW (2017). Genetically-directed Sparse Neuronal Labeling in BAC Transgenic Mice through Mononucleotide Repeat Frameshift. Sci. Rep 7, 43915. [DOI] [PMC free article] [PubMed] [Google Scholar]
- Luo L (2007). Fly MARCM and mouse MADM: genetic methods of labeling and manipulating single neurons. Brain Res. Brain Res. Rev 55, 220–227. [DOI] [PMC free article] [PubMed] [Google Scholar]
- Luo L, Callaway EM, and Svoboda K (2008). Genetic dissection of neural circuits. Neuron 57, 634–660. [DOI] [PMC free article] [PubMed] [Google Scholar]
- Maaten LVD, and Hinton G (2008). Visualizing data using t-SNE. J. Mach. Learn. Res 9, 2579–2605. [Google Scholar]
- Madisen L, Zwingman TA, Sunkin SM, Oh SW, Zariwala HA, Gu H, Ng LL, Palmiter RD, Hawrylycz MJ, Jones AR, et al. (2010). A robust and high-throughput Cre reporting and characterization system for the whole mouse brain. Nat. Neurosci 13, 133–140. [DOI] [PMC free article] [PubMed] [Google Scholar]
- Markram H, Muller E, Ramaswamy S, Reimann MW, Abdellah M, Sanchez CA, Ailamaki A, Alonso-Nanclares L, Antille N, Arsever S, et al. (2015). Reconstruction and Simulation of Neocortical Microcircuitry. Cell 163, 456–492. [DOI] [PubMed] [Google Scholar]
- Masland RH (2012). The neuronal organization of the retina. Neuron 76, 266–280. [DOI] [PMC free article] [PubMed] [Google Scholar]
- Menalled LB, Kudwa AE, Miller S, Fitzpatrick J, Watson-Johnson J, Keating N, Ruiz M, Mushlin R, Alosio W, McConnell K, et al. (2012). Comprehensive behavioral and molecular characterization of a new knock-in mouse model of Huntington’s disease: zQ175. PLOS ONE 7, e49838. [DOI] [PMC free article] [PubMed] [Google Scholar]
- Oh SW, Harris JA, Ng L, Winslow B, Cain N, Mihalas S, Wang Q, Lau C, Kuan L, Henry AM, et al. (2014). A mesoscale connectome of the mouse brain. Nature 508, 207–214. [DOI] [PMC free article] [PubMed] [Google Scholar]
- Parkhurst CN, Yang G, Ninan I, Savas JN, Yates JR 3rd, Lafaille JJ, Hempstead BL, Littman DR, and Gan WB (2013). Microglia promote learning-dependent synapse formation through brain-derived neurotrophic factor. Cell 155, 1596–1609. [DOI] [PMC free article] [PubMed] [Google Scholar]
- Peichl L, and González-Soriano J (1994). Morphological types of horizontal cell in rodent retinae: a comparison of rat, mouse, gerbil, and guinea pig. Vis. Neurosci 11, 501–517. [DOI] [PubMed] [Google Scholar]
- Peng H, Ruan Z, Long F, Simpson JH, and Myers EW (2010). V3D enables real-time 3D visualization and quantitative analysis of large-scale biological image data sets. Nat. Biotechnol 28, 348–353. [DOI] [PMC free article] [PubMed] [Google Scholar]
- Poché RA, and Reese BE (2009). Retinal horizontal cells: challenging paradigms of neural development and cancer biology. Development 136, 2141–2151. [DOI] [PMC free article] [PubMed] [Google Scholar]
- Rapaport DH, Wong LL, Wood ED, Yasumura D, and LaVail MM (2004). Timing and topography of cell genesis in the rat retina. J. Comp. Neurol 474, 304–324. [DOI] [PubMed] [Google Scholar]
- Raven MA, Oh EC, Swaroop A, and Reese BE (2007). Afferent control of horizontal cell morphology revealed by genetic respecification of rods and cones. J. Neurosci 27, 3540–3547. [DOI] [PMC free article] [PubMed] [Google Scholar]
- Renier N, Wu Z, Simon DJ, Yang J, Ariel P, and Tessier-Lavigne M (2014). iDISCO: a simple, rapid method to immunolabel large tissue samples for volume imaging. Cell 159, 896–910. [DOI] [PubMed] [Google Scholar]
- Renier N, Adams EL, Kirst C, Wu Z, Azevedo R, Kohl J, Autry AE, Kadiri L, Umadevi Venkataraju K, Zhou Y, et al. (2016). Mapping of Brain Activity by Automated Volume Analysis of Immediate Early Genes. Cell 165, 1789–1802. [DOI] [PMC free article] [PubMed] [Google Scholar]
- Richardson DS, and Lichtman JW (2015). Clarifying Tissue Clearing. Cell 162, 246–257. [DOI] [PMC free article] [PubMed] [Google Scholar]
- Rosario AM, Cruz PE, Ceballos-Diaz C, Strickland MR, Siemienski Z, Pardo M, Schob KL, Li A, Aslanidi GV, Srivastava A, et al. (2016). Microglia-specific targeting by novel capsid-modified AAV6 vectors. Mol. Ther. Methods Clin. Dev 3, 16026. [DOI] [PMC free article] [PubMed] [Google Scholar]
- Shaner NC, Lambert GG, Chammas A, Ni Y, Cranfill PJ, Baird MA, Sell BR, Allen JR, Day RN, Israelsson M, et al. (2013). A bright monomeric green fluorescent protein derived from Branchiostoma lanceolatum. Nat. Methods 10, 407–409. [DOI] [PMC free article] [PubMed] [Google Scholar]
- Soriano P (1999). Generalized lacZ expression with the ROSA26 Cre reporter strain. Nat. Genet 21, 70–71. [DOI] [PubMed] [Google Scholar]
- Soto F, Zhao L, and Kerschensteiner D (2018). Synapse maintenance and restoration in the retina by NGL2. eLife 7, e30388. [DOI] [PMC free article] [PubMed] [Google Scholar]
- Srinivasan R, Lu TY, Chai H, Xu J, Huang BS, Golshani P, Coppola G, and Khakh BS (2016). New Transgenic Mouse Lines for Selectively Targeting Astrocytes and Studying Calcium Signals in Astrocyte Processes In Situ and In Vivo. Neuron 92, 1181–1195. [DOI] [PMC free article] [PubMed] [Google Scholar]
- Steinmetz NA, Buetfering C, Lecoq J, Lee CR, Peters AJ, Jacobs EAK, Coen P, Ollerenshaw DR, Valley MT, de Vries SEJ, et al. (2017). Aberrant Cortical Activity in Multiple GCaMP6-Expressing Transgenic Mouse Lines. eNeuro 4, ENEURO.0207–17.2017. [DOI] [PMC free article] [PubMed] [Google Scholar]
- Stepanyants A, Tamás G, and Chklovskii DB (2004). Class-specific features of neuronal wiring. Neuron 43, 251–259. [DOI] [PubMed] [Google Scholar]
- Ströh S, Puller C, Swirski S, Hölzel M-B, van der Linde LIS, Segelken J, Schultz K, Block C, Monyer H, Willecke K, et al. (2018). Eliminating glutamatergic input onto horizontal cells changes the dynamic range and receptive field organization of mouse retinal ganglion cells. J. Neurosci 38, 2015–2028. [DOI] [PMC free article] [PubMed] [Google Scholar]
- Svitkina T (2016). Imaging cytoskeleton components by electron microscopy. Methods Mol. Biol 586, 187–206. [DOI] [PMC free article] [PubMed] [Google Scholar]
- Swanson LW, and Lichtman JW (2016). From Cajal to Connectome and Beyond. Annu. Rev. Neurosci 39, 197–216. [DOI] [PubMed] [Google Scholar]
- Taniguchi H, He M, Wu P, Kim S, Paik R, Sugino K, Kvitsiani D, Fu Y, Lu J, Lin Y, et al. (2011). A resource of Cre driver lines for genetic targeting of GABAergic neurons in cerebral cortex. Neuron 71, 995–1013. [DOI] [PMC free article] [PubMed] [Google Scholar]
- Tasic B, Hippenmeyer S, Wang C, Gamboa M, Zong H, Chen-Tsai Y, and Luo L (2011). Site-specific integrase-mediated transgenesis in mice via pronuclear injection. Proc. Natl. Acad. Sci. USA 108, 7902–7907. [DOI] [PMC free article] [PubMed] [Google Scholar]
- Tremblay R, Lee S, and Rudy B (2016). GABAergic Interneurons in the Neocortex: From Cellular Properties to Circuits. Neuron 91, 260–292. [DOI] [PMC free article] [PubMed] [Google Scholar]
- Viswanathan S, Williams ME, Bloss EB, Stasevich TJ, Speer CM, Nern A, Pfeiffer BD, Hooks BM, Li WP, English BP, et al. (2015). High-performance probes for light and electron microscopy. Nat. Methods 12, 568–576. [DOI] [PMC free article] [PubMed] [Google Scholar]
- von Bartheld CS, Bahney J, and Herculano-Houzel S (2016). The search for true numbers of neurons and glial cells in the human brain: a review of 150 years of cell counting. J. Comp. Neurol 524, 3865–3895. [DOI] [PMC free article] [PubMed] [Google Scholar]
- Wang N, Gray M, Lu XH, Cantle JP, Holley SM, Greiner E, Gu X, Shirasaki D, Cepeda C, Li Y, et al. (2014). Neuronal targets for reducing mutant huntingtin expression to ameliorate disease in a mouse model of Huntington’s disease. Nat. Med 20, 536–541. [DOI] [PMC free article] [PubMed] [Google Scholar]
- Wang Y, Xie P, Gong H, Zhou Z, Kuang X, Wang Y, Li A, Li Y, Liu L, Veldman MB, et al. (2019). Complete single neuron reconstruction reveals morphological diversity in molecularly defined claustral and cortical neuron types. bioRxiv. 10.1101/675280. [DOI] [Google Scholar]
- Whitney IE, Raven MA, Ciobanu DC, Poché RA, Ding Q, Elshatory Y, Gan L, Williams RW, and Reese BE (2011). Genetic modulation of horizontal cell number in the mouse retina. Proc. Natl. Acad. Sci. USA 108, 9697–9702. [DOI] [PMC free article] [PubMed] [Google Scholar]
- Wilcox RR (2011). Introduction to Robust Estimation and Hypothesis Testing (Academic Press; ). [Google Scholar]
- Winnubst J, Bas E, Ferreira TA, Wu Z, Economo MN, Edson P, Arthur BJ, Bruns C, Rokicki K, Schauder D, et al. (2019). Reconstruction of 1,000 Projection Neurons Reveals New Cell Types and Organization of Long-Range Connectivity in the Mouse Brain. Cell 179, 268–281.e13. [DOI] [PMC free article] [PubMed] [Google Scholar]
- Yoshimatsu T, Williams PR, D’Orazi FD, Suzuki SC, Fadool JM, Allison WT, Raymond PA, and Wong RO (2014). Transmission from the dominant input shapes the stereotypic ratio of photoreceptor inputs onto horizontal cells. Nat. Commun 5, 3699. [DOI] [PMC free article] [PubMed] [Google Scholar]
- Young RW (1985). Cell differentiation in the retina of the mouse. Anat. Rec 212, 199–205. [DOI] [PubMed] [Google Scholar]
- Zeng H, and Sanes JR (2017). Neuronal cell-type classification: challenges, opportunities and the path forward. Nat. Rev. Neurosci 18, 530–546. [DOI] [PubMed] [Google Scholar]
- Zingg B, Hintiryan H, Gou L, Song MY, Bay M, Bienkowski MS, Foster NN, Yamashita S, Bowman I, Toga AW, and Dong HW (2014). Neural networks of the mouse neocortex. Cell 156, 1096–1111. [DOI] [PMC free article] [PubMed] [Google Scholar]
- Zong H, Espinosa JS, Su HH, Muzumdar MD, and Luo L (2005). Mosaic analysis with double markers in mice. Cell 121, 479–492. [DOI] [PubMed] [Google Scholar]
Associated Data
This section collects any data citations, data availability statements, or supplementary materials included in this article.
Supplementary Materials
Data Availability Statement
The R script implementing cell and shape measure clustering is available from the Lead Contact upon request.