Abstract
Mammalian cochlear development encompasses a series of morphological and molecular events that results in the formation of a highly intricate structure responsible for hearing. One remarkable event occurs during development is the cochlear lengthening that starts with cochlear outgrowth around E11 and continues throughout development. Different mechanisms contribute to this process including cochlear progenitor proliferation and convergent extension. We previously identified that FGF9 and FGF20 promote cochlear lengthening by regulating auditory sensory epithelial proliferation through FGFR1 and FGFR2 in the periotic mesenchyme. Here, we provide evidence that ETS-domain transcription factors ETV4 and ETV5 are downstream of mesenchymal FGF signaling to control cochlear lengthening. Next generation RNA sequencing identified that Etv1, Etv4 and Etv5 mRNAs are decreased in the Fgf9 and Fgf20 double mutant periotic mesenchyme. Deleting both Etv4 and Etv5 in periotic mesenchyme resulted in shortening of cochlear length but maintaining normal patterning of organ of Corti and density of hair cells and supporting cells. This recapitulates phenotype of mesenchymal-specific Fgfr1 and Fgfr2 deleted inner ear. Furthermore, analysis of Etv1/4/5 triple conditional mutants revealed that ETV1 does not contribute in this process. Our study reveals that ETV4 and ETV5 function downstream of mesenchymal FGF signaling to promote cochlear lengthening.
Keywords: cochlear development, FGF, ETV transcription factors, gene expression
1. Introduction
In the mouse, a ventral outgrowth from the otocyst at approximately E11 marks the developing cochlear duct. Over the following 5 days, the cochlear duct elongates and coil until it reaches one and three-quarters turns (Morsli et al., 1998). Different factors contribute to such elongation including proliferation of a population of sensory progenitor cells located in the floor of the developing cochlear duct. Such population becomes evident early around E11 and is marked with the expression of Sox2. These progenitor cells proliferate for around 48 hours then undergo cell cycle exit, starting in the apex of the cochlear duct around E13 (Doetzlhofer et al., 2006; Matei et al., 2005). Mechanisms regulating the proliferation and cell cycle exit of cells within the progenitor population are under investigation. In addition to progenitor proliferation, convergent extension contributes to the elongation of the sensory organ of the cochlea through unidirectional extension (Wang et al., 2005).
The E26 transformation-specific (ETS) proteins are a group of transcription factors that are encoded by 28 different genes in humans (Oh et al., 2012). These proteins are characterized by the ETS domain which is a highly conserved DNA binding domain. The human ETS proteins are clustered into 12 subgroups based on structural and functional similarity. The PEA3 subgroup includes 3 members: ETV1 (ER81), ETV4 (PEA3) and ETV5 (ERM) which are more than 95% identical in the amino acid sequence within the DNA-binding domain (de Launoit et al., 1997). Members of this subfamily are expressed in multiple organs during development including limb buds, mammary gland and kidney where they are required for normal development (Chotteau-Lelievre et al., 1997; Lu et al., 2009; Mao et al., 2009). Multiple studies show this group of transcription factor function downstream FGF during development (Firnberg and Neubuser, 2002; Herriges et al., 2015; Mao et al., 2009).
FGF signaling plays diverse roles during cochlear development (Ebeid and Huh, 2017). We previously showed that FGF9 and FGF20 are expressed in the epithelium of otic vesicle and signal to the surrounding mesenchymal FGFR1 and FGFR2 to promote cochlear sensory progenitor proliferation and subsequent cochlear growth (Huh et al., 2015). Through both gain-and loss-of-function experiments, we showed that mesenchymal FGF signaling is both necessary and sufficient for cochlea lengthening. To date, the molecules downstream of mesenchymal FGF signaling regulating cochlear length is not known. Here, we identify and validate differentially expressed genes within the periotic mesenchyme of Fgf9/20 double mutants including three ETV transcription factors; Etv4, Etv5 and Etv1. In addition, deleting Etv4 and Etv5 in periotic mesenchyme results in cochlear shortening. These results demonstrate that ETV4 and ETV5 function downstream of mesenchymal FGF signaling to regulate cochlear length.
2. Materials and methods
2.1. Animals
This study was carried out in accordance with the recommendations in the Guide for the Care and Use of Laboratory Animals of the National Institutes of Health. The protocol was approved by the University of Nebraska Medical Center Institutional Animal Care and Use Committee (16-005-02-EP). All efforts were made to minimize animal suffering. Fgf9−/+ (Colvin et al., 2001), Fgf20−/+ (Huh et al., 2012), and Twist2Cre/+ (Sosic et al., 2003) mouse lines were reported previously. Etv1fl/+ (Patel et al., 2003), Etv4−/+ (Laing et al., 2000), and Etv5fl/+ (Zhang et al., 2009) were gifts from Drs. Silvia Arber from University of Basel, John Hassell from McMaster University, and Xin Sun from University of Wisconsin-Madison, respectively. Fgf9−/+;Fgf20−/+ males were mated with Fgf9−/−;Fgf20−/− females to generate control (Fgf9−/+;Fgf20−/+) and Fgf9−/−;Fgf20−/− embryos. Etv4−/−;Etv5fl/fl;Twist2Cre/+ embryos were generated by crossing Etv4−/+;Etv5fl/+;Twist2Cre/+ males to Etv4−/−;Etv5fl/fl females. Etv1fl/fl;Etv4−/−;Etv5fl/fl;Twist2Cre/+ were generated by crossing Etv1fl/+;Etv4−/+;Etv5fl/+;Twist2Cre/+ males to Etv1fl/fl;Etv4−/−;Etv5fl/fl females. Mice were maintained on a 129X1/SvJ;C57B6/J mixed background. Animals for timed mating were put together in the evening, and each morning were tested for the presence of the vaginal plug then they were considered as embryonic day 0.5 (E0.5).
2.2. Sample collection and tissue preparation
For laser capture microdissection and RNA sequencing, E11.5 and E12.5 embryos carrying Fgf9−/−;Fgf20−/− along with control (Fgf9−/+;Fgf20−/+) were collected in DEPC-treated cold PBS. The whole head was immediately embedded in OCT, then frozen in liquid nitrogen and stored at −80°C until further processing.
2.3. Laser capture microdissection
OCT-embedded samples from Fgf9−/−;Fgf20−/− and littermate controls were serially sectioned horizontally (10μm thick) at −20°C using a cryostat (Leica CM1950). The sections were mounted on slides covered with a Polyethylene Naftelato (PEN) membrane (Arcturus, LCM0522). Slides were allowed to dehydrate inside the cryostat chamber for 10 minutes. Slides were immediately stained with a rapid protocol for eosin on ice. Briefly, tissue sections were fixed in 70% ethanol for 1 minute, hydrated in DEPC-treated water twice for 30 seconds, dehydrated in 95% ethanol for 30 seconds and then stained with an eosin Y solution in 95% ethanol for 30 seconds. Sections were then washed twice in 95% ethanol then twice in 100% ethanol. Finally, sections were dried at room temperature for 1 minute and immediately processed with the microdissection system. Laser capture microdissection (LCM) was performed using a PALM MicroBeam system (Zeiss) as demonstrated in the manual. Specifically, the cochlear duct was visualized under bright-field with a 40x objective. The mesenchyme adjacent to the sensory side of the cochlear duct was selected using the PALM RoboSoftware then cut and catapulted by laser pulses into a microtube cap filled with 30μl of RNA extraction buffer. The capture success was evaluated by checking the slide before and after the microdissection process and observing the captured tissue in the microtube cap.
2.4. RNA extraction and quality assessment
Arcturus PicoPure RNA isolation kit (applied biosystems, 12204–01) was used for all RNA extractions as per the manufacturer protocol. Briefly, microdissected tissues in RNA extraction buffer were incubated at 42°C for 30 minutes then stored at −80°C until completing all sample collection. Three littermates per genotype per developmental time point were pooled. During RNA extraction, columns were treated with RNase-free DNase I set (Qiagen, 79254) to remove genomic DNA. The yield and integrity of total RNA from microdissected samples were measured using a 2100 Bioanalyzer (Agilent Technologies). A RIN value was obtained for each sample on a scale of 1–10 and the RNA quality is considered good if RIN ≥ 5 (Kerman et al., 2006).
2.5. RNA sequencing and transcriptome analysis
For LCM samples, next generation RNA sequencing was performed at University of Nebraska Medical Center Sequencing core. Briefly, synthesis of cDNA from 1–3ng of total RNA was performed with the Clontech SMARTer™ Ultra Low RNA Kit (Clontech Laboratories Inc, Mountain View, CA). Sequencing libraries were prepared using the Illumina Paired End Sample Prep Kit (Illumina Inc, San Diego, CA) according to Illumina’s Ultra Low Input mRNA-Seq protocol. Each cDNA library was sequenced to generate 75 base pair reads, on the Illumina NextSeq500 (Illumina). The sequence reads were aligned to the mouse reference genome sequence (USCS mm10) using STAR aligner (Dobin et al., 2012). Alignments were assembled and annotated using Cufflinks (Trapnell et al., 2010). DESeq2 (Anders and Huber, 2010) was used to detect differentially expressed gene transcripts.
2.6. Pathway analysis
The database DAVID (the database of annotation, visualization and integrated discovery (Huang da et al., 2009a, b) was used for pathway analysis. The differentially expressed gene transcripts (q <0.05) identified from the RNA-Seq data were input into DAVID, which identified enriched biological pathways.
2.7. RNA in situ hybridization
E11.5 and E12.5 embryos were collected in DEPC-treated cold PBS, fixed with 4% paraformaldehyde overnight at 4°C then washed with PBS three times. RNA in situ hybridization analysis was performed on 7μm paraffin sections following a standard procedure with digoxigenin-labeled antisense riboprobes (Moorman et al., 2001). In situ hybridization antisense riboprobes were prepared from the following mouse cDNA plasmids: Etv1 (pBluescript SK-Etv1, Addgene 16282), Etv4 (pGEM-Etv4, gift of G. Martin), Etv5 (pBluescriptSK-Etv5, gift of G. Martin), Ebf1 (pCR4-TOPO-Ebf1, Transomic BC13936), and Tgfbi (pCR-BluntII-TOPO-Tgfbi, Transomic BC129900). Plasmids were cut with restriction enzymes (New England Biolabs, MA) and transcribed with RNA polymerases (New England Biolabs, MA). DIG RNA Labeling Mix (Sigma-Aldrich, 11277073910) was used for in vitro transcription according to manufacturer’s instructions. This is followed by treatment with RNase-free DNase I (Sigma-Aldrich, 04716728001) for 15 min at 37°C, then probes were hydrolyzed in hydrolysis buffer (40 mM NaHCO3, 60 mM Na2CO3) at 60°C for 15 minutes. Probes were stored in hybridization buffer at −20°C and were used at a concentration of 1–3ng/μL for hybridization.
2.8. Quantitative real time PCR
E11.5 and E12.5 embryos were collected, and the cochlea (including the epithelium and surrounding mesenchyme of the developing cochlear duct) was crudely dissected out in DEPC-treated cold PBS, then placed in RNA extraction buffer. RNA was extracted using Arcturus PicoPure RNA isolation kit (applied biosystems, 12204–01) according to the manufacturer’s protocol. During RNA extraction, columns were treated with RNase-free DNase I set (Qiagen, 79254) to remove genomic DNA. Reverse transcription of total RNA was performed using GoScript™ Reverse Transcription System (Promega) according to the manufacturer’s protocol. Quantitative real time PCR was performed using both PowerUp™ SYBR™ Green (Applied Biosytems, A25742) and TaqMan Fast Advanced Master Mix (Applied Biosytems, 4444556) according to the manufacturer’s protocol. Primers and probe sets are included in supplemental table S2.
2.9. Immunostaining
For whole mount immunostaining, P0 pups carrying individual or combined Etv1/4/5 mutation along with littermate controls were collected, inner ears were dissected in cold PBS, fixed with 4% paraformaldehyde overnight at 4°C then washed with PBS three times and blocked with PBS containing 0.1% Tween 20 and 0.5% donkey serum. Samples were incubated in primary antibody overnight at 4°C. Samples were then washed with PBS and incubated with a secondary antibody for 2hrs at room temperature then washed, placed on a glass microscope slide in 95% glycerol, coverslipped, and photographed using a Zeiss LSM 700 confocal microscope. Primary antibodies/stains used: Phallodin (R&D Systems, 1:40), Prox1 (Covance, 1:250), Myo6 (Proteus, 1:200).
2.10. Cochlear length quantification and cell counting
Cochlear length was measured using FIJI software from the tip of the apex to the base. Myosin 6 and Prox1 immunostaining were used as markers for hair cells and supporting cells respectively. To measure the density, at least 400μm regions of the base, middle, and apex of the cochleae were counted and normalized to 100μm. Cell counting was performed using FIJI software.
2.11. Statistics
For each experiment, the numbers of samples (n) is indicated. The p value for difference between samples was calculated using either multiple-testing adjusted p-value (for differential expression using DESeq2 (Anders and Huber, 2010)), a two-tailed Student’s t-test (for the qRT-PCR) or one-way ANOVA test followed by Dunnett’s multiple comparisons test for cochlear length comparisons), and p < 0.05 was considered as significant.
3. Results
3.1. Gene Expression Profiling reveals potential FGF-regulated genes of periotic mesenchyme.
We previously identified that mesenchymal FGF signaling is necessary and sufficient for auditory sensory progenitor proliferation and subsequent cochlear lengthening (Huh et al., 2015). To identify genes regulated by FGF signaling in periotic mesenchyme, we isolated E11.5 and E12.5 mesenchymal tissues adjacent to the developing cochlear duct from Fgf9−/−;Fgf20−/− and control (Fgf9−/+;Fgf20−/+) embryos using laser-capture microscopy. We then performed next-generation RNA sequencing. Analysis of normalized sequence reads in control samples indicated enrichment of periotic mesenchymal genes such as Pou3f4 and Tbx18, while epithelial genes like Sox2 and Fgf20 exhibited very low sequence reads (supplemental table S1). Such results provide evidence of the purity of the collected cell population using laser capture microdissection and thereby the reliability and reproducibility of our data.
We next analyzed differentially expressed genes at E11.5 comparing Fgf9−/−;Fgf20−/− to control embryos. In Fgf9−/−;Fgf20−/− mesenchyme, 22 genes showed upregulation and 6 genes showed downregulation compared to control (Fig. 1A) (Log2 fold change >1, adjusted p-value<0.05). At E12.5, 68 genes showed upregulation and 55 genes showed downregulation (Fig. 1B) (Log2 fold change >1, adjusted p-value<0.05). The number of differentially expressed genes (especially the downregulated genes) increased at E12.5 compared to E11.5 indicating subsequent transcriptome changes occurring in a 24-hour interval. The top downregulated genes at both time points included the ETS-domain transcription factors (Etv1, Etv4, Etv5) as well as other transcription factors such as Ebf1. Interestingly, chemokine-like secreted protein Fam19a4 was the most downregulated gene at both time points with more than 4 folds. In addition, Itga8 gene that encodes the alpha 8 subunit of the heterodimeric integrin alpha8beta1 protein showed downregulation more than 4 folds at E12.5. The top differentially expressed genes at both time points are shown in table 1.
Fig 1.
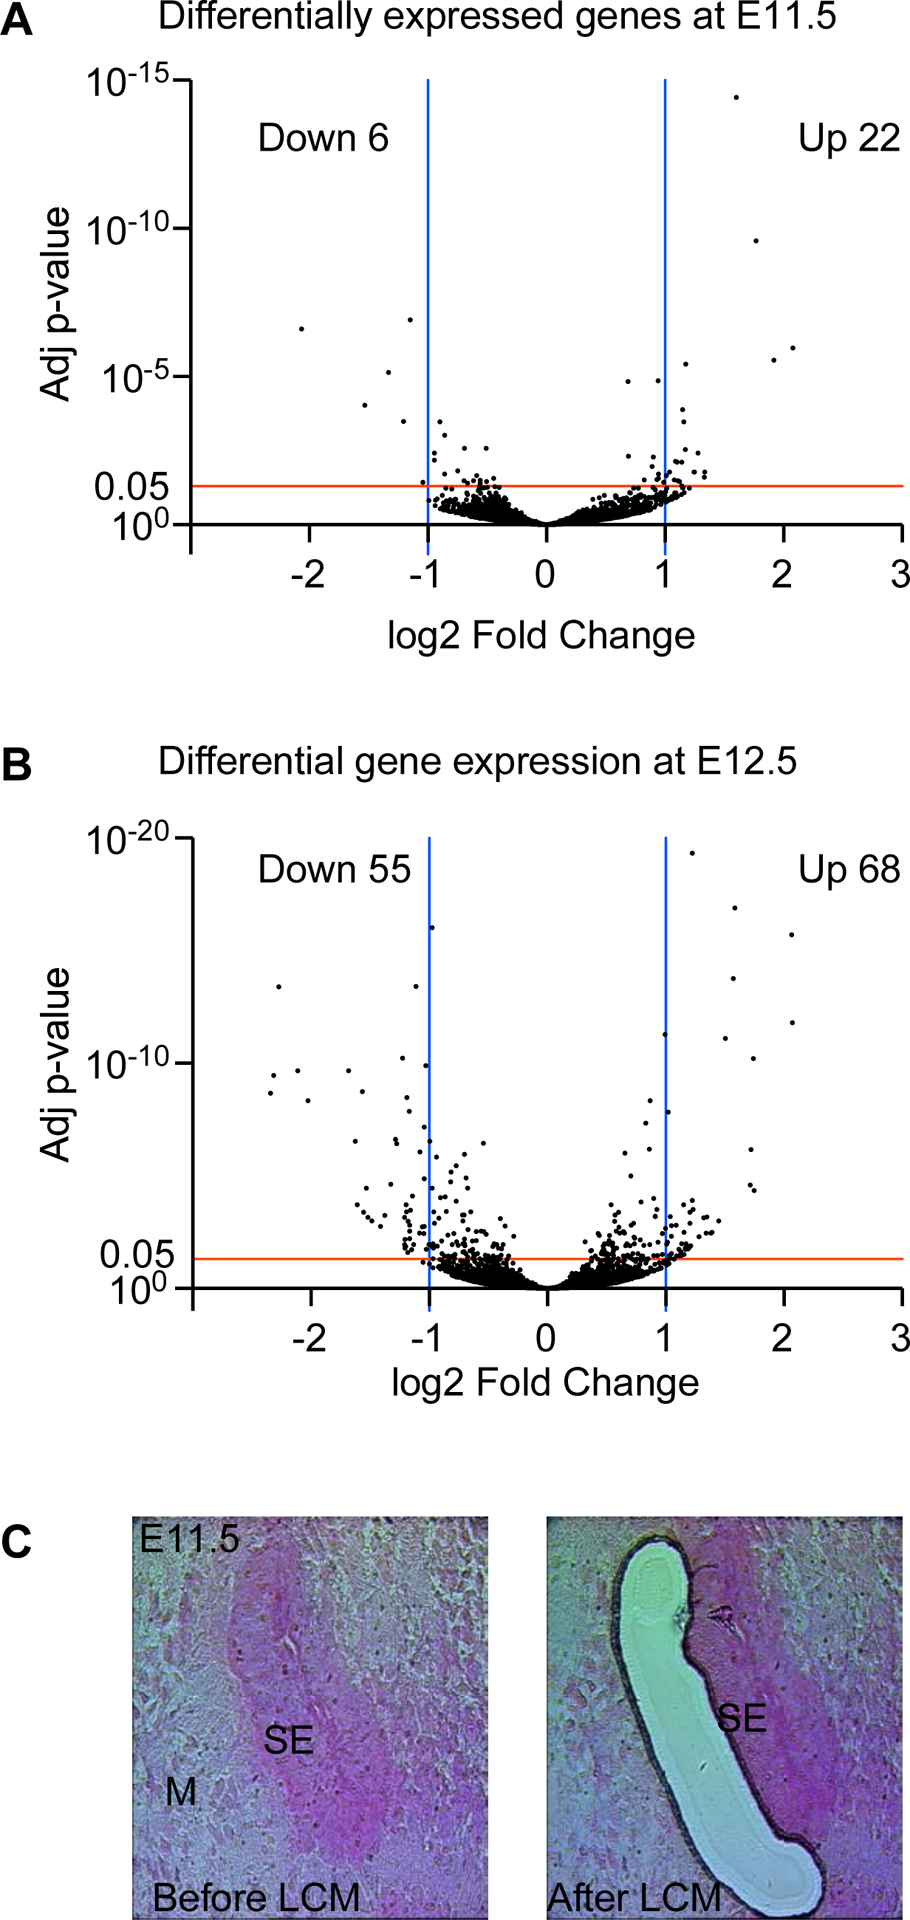
Differentially expressed genes in Fgf9−/−;Fgf20−/− mesenchyme versus control. Volcano plot showing up- and down-regulated genes at E11.5 (A) and E12.5 (B). Red line indicates the threshold of adjusted p-value (0.05) while the blue lines show the cutoff of log2 fold change (>1 and <−1). Each dot on the plot represents a single gene. (C) Representative pictures of E11.5 cochlear duct before and after LCM. (M) refers to mesenchyme and (SE) refers to sensory epithelium.
Table 1.
Top differentially expressed genes at E11.5 and E12.5 in Fgf9−/−;Fgf20−/− versus control. Change is gene expression is shown in log2 fold change (log2FC) and statistical significance is demonstrated as adjusted p-value (P-adj.).
| E11.5 | E12.5 | ||||
|---|---|---|---|---|---|
| Gene symbol | log2FC | p-adj | Gene symbol | log2FC | p-adj |
| Fam19a4 | −2.0654513 | 2.48E-07 | E030030I06Rik | −2.34016 | 2.17E-09 |
| Casp3 | −1.5325825 | 9.40E-05 | Fam19a4 | −2.3155304 | 3.56E-10 |
| Etv4 | −1.3312558 | 7.16E-06 | Itga8 | −2.2701889 | 4.12E-14 |
| Etv1 | −1.204631 | 0.00032689 | Spry4 | −2.1126097 | 2.16E-10 |
| Etv5 | −1.1474219 | 1.22E-07 | Ralyl | −2.0243056 | 4.68E-09 |
| Zfp146 | −1.0413177 | 0.03726918 | Etv4 | −1.9738757 | 2.36E-03 |
| Acsl5 | −0.9439681 | 0.00655954 | Etv5 | −1.6818292 | 2.16E-10 |
| Ttc23 | −0.9433472 | 0.0037542 | Lmo1 | −1.6266506 | 2.88E-07 |
| Ebf1 | −0.8991976 | 0.00033257 | Gabra2 | −1.6083948 | 0.00019493 |
| St6galnac6 | −0.8576845 | 0.01952447 | Tnc | −1.5649379 | 1.86E-09 |
| Msx2 | 1.20424034 | 0.05918682 | Rec8 | 1.44873778 | 0.00098607 |
| Svip | 1.24658362 | 0.01672448 | Dcn | 1.50440975 | 8.04E-12 |
| 1810019J16Rik | 1.24940546 | 0.01672448 | Crabp1 | 1.57112621 | 1.71E-14 |
| Moxd1 | 1.27873406 | 0.00383317 | Serpine2 | 1.58561121 | 1.26E-17 |
| Nog | 1.33061902 | 0.02472503 | Meis1 | 1.71457282 | 2.54E-05 |
| 4930426D05Rik | 1.33369746 | 0.01672448 | Zic1 | 1.72107311 | 6.95E-07 |
| Rgcc | 1.60236369 | 3.83E-15 | Dynlt1b | 1.74258786 | 6.08E-11 |
| Sostdc1 | 1.76823567 | 2.61E-10 | Fn3krp | 1.74765658 | 4.46E-05 |
| Gstm6 | 1.91843934 | 2.83E-06 | Gm5506 | 2.065427 | 1.94E-16 |
| Rec8 | 2.077853 | 1.09E-06 | Zpld1 | 2.07216811 | 1.60E-12 |
3.2. Functional annotation of differentially expressed genes shows enriched pathways/functions.
Next, we studied how differentially expressed genes in Fgf9−/−;Fgf20−/− mesenchyme relates to the development of cochlear progenitors. To understand the functional categories enriched in differentially expressed genes, we utilized the Database for Annotation, Visualization and Integrated Discovery (DAVID) for functional annotation of differentially expressed gene (Huang da et al., 2009a, b) Gene ontological analyses of downregulated genes at both time points showed enrichment in transcription factors, specifically PEA3 group of ETS transcription factors (Etv1, Etv4 and Etv5). Additionally, at E11.5, Ebf1 and Tfdp1 transcription factors as well as cell cycle regulators (Ccnd2, Tfdp1) were downregulated while at E12.5, negative regulators of tyrosine kinase receptor signaling (Spry1 and Spry4) and multiple developmental proteins were downregulated (Table 2).
Table 2.
Functional categories of differentially expressed genes (either upregulated (up) or downregulated (down)) at E11.5 and E12.5 in Fgf9−/−;Fgf20−/− versus control mesenchyme.
| E11.5 down | Term | PValue | Genes |
| PEA3-type ETS-domain transcription factor | 3.27E-06 | Etv1, Etv5, Etv4 | |
| Nucleus | 0.0015755 | Hnrnpm, Csrp2bp, Zfp146, Rfc2, Ccnd2, Ebf1, Etv1, Nup85, Etv5, Etv4, Tfdp1, Phlda1 | |
| Transcription factor activity | 0.00210736 | Zfp146, Ebf1, Etv1, Etv5, Etv4, Tfdp1 | |
| Ubl conjugation | 0.00250484 | Hnrnpm, Zfp146, Ccnd2, Ebf1, Etv1, Etv5, Etv4 | |
| Cyclins and Cell Cycle Regulation | 0.05486549 | Ccnd2, Tfdp1 | |
| E11.5 up | Collagen binding | 0.00900509 | Dcn, Sparc |
| RNA polymerase II regulatory region sequence-specific DNA binding | 0.01718199 | Gata2, Foxf1, Lmx1a | |
| Extracellular matrix binding | 0.02930471 | Dcn, Sparc | |
| Extracellular space | 0.03133622 | Sostdc1, Spint1, Igf1, Dcn, Sparc | |
| Intrinsic apoptotic signaling pathway | 0.03396137 | Cdkn1a, Ddit4 | |
| Positive regulation of fibroblast proliferation | 0.0445977 | Cdkn1a, Igf1 | |
| Negative regulation of angiogenesis | 0.05773814 | Dcn, Sparc | |
| E12.5 down | PEA3-type ETS-domain transcription factor, N-terminal | 1.40E-05 | Etv1, Etv5, Etv4 |
| Developmental protein | 0.00421589 | Sema5a, Irx3, Spry1, Itga8, Kazald1, Pou3f3, Spry4, Tcf15 | |
| Negative regulation of cell adhesion | 0.00447761 | Sema5a, Epha5, Tnc | |
| Regulation of actin cytoskeleton organization | 0.00629443 | Epha5, Pam, Gpm6b | |
| Negative regulation of ERK1 and ERK2 cascade | 0.01076025 | Spry1, Timp3, Spry4 | |
| Chemokine-like protein, FAM19A2 | 0.01087892 | Fam19a1, Fam19a4 | |
| Fibronectin, type III | 0.01096813 | Epha5, Tnc, Lrrn3, Il13ra1 | |
| Extracellular matrix | 0.01348415 | Col26a1, Tnc, Kazald1, Timp3 | |
| Sequence-specific DNA binding | 0.01910438 | Sall3, Irx3, Etv1, Pou3f3, Etv5, Etv4 | |
| Insulin-like growth factor binding protein | 0.03280652 | Nov, Epha5, Kazald1 | |
| E12.5 up | Secreted | 2.29E-09 | Ccdc80, Igf1, Fam132a, Dcn, Ogn, Bdnf, Cbln2, Gpc3, Serpine2, Srpx2, Penk, Frem1, Sostdc1, Rspo3, Fbln5, Sema3c, Wnt11, Lbp, Col1a1, Col8a1, Prss23, Olfm2 |
| Extracellular matrix | 3.96E-06 | Ogn, Fbln5, Frem1, Ccdc80, Wnt11, Col1a1, Dcn, Col8a1 | |
| Developmental protein | 7.00E-05 | Msx2, Msx1, Meis2, Elf3, Serpine2, Frem1, Sema3c, Tbx1, Wnt11, Zic1, Meis1, Hemgn | |
| Negative regulation of cell proliferation | 1.75E-04 | Msx2, Cdkn1a, Msx1, Gpc3, Serpine2, Igf1, Ldoc1, Erdr1 | |
| Positive regulation of transcription, DNA-templated | 3.73E-04 | Agtr2, Elf3, Foxf1, Igf1, Tbx1, Wnt11, Col1a1, Zic1, Cited4 | |
| Positive regulation of cell migration | 0.00359097 | Foxf1, Igf1, Sema3c, Wnt11, Col1a1 | |
| Positive regulation of BMP signaling pathway | 0.00554745 | Msx2, Msx1, Gpc3 | |
| Negative regulation of cell growth | 0.00684689 | Cdkn1a, Msx1, Serpine2, Wnt11 | |
| Positive regulation of mesenchymal cell apoptotic process | 0.00926277 | Msx2, Msx1 | |
| Heparin binding | 0.01030538 | Ogn, Serpine2, Rspo3, Ccdc80 | |
| Inner ear development | 0.0178024 | Bdnf, Igf1, Lin7a | |
| Positive regulation of synapse assembly | 0.01988632 | Bdnf, Cbln2, Srpx2 | |
| Nervous system development | 0.02920633 | Bdnf, Serpine2, Igf1, Sema3c, Zic1 | |
| Differentiation | 0.03351564 | Elf3, Serpine2, Sema3c, Cend1, Zic1, Hemgn | |
| Negative regulation of canonical Wnt signaling pathway | 0.03984049 | Gpc3, Sostdc1, Wnt11 | |
| Growth factor | 0.04868104 | Ogn, Bdnf, Igf1 |
As for upregulated gene categories at E11.5, genes encoding collagen binding proteins (Sparc and Dcn), as well as other secreted proteins (Sostdc1, Spint1, and Igf1) were observed. At E12.5, multiple genes encoding secreted proteins as well as negative regulators of cell proliferation were upregulated (Table 2).
3.3. Differentially expressed genes validated through quantitative RT-PCR and in situ hybridization.
To validate differential gene expression detected by RNA sequencing, quantitative RT-PCR was performed on dissected E11.5 and E12.5 cochlea from Fgf9−/−;Fgf20−/− and littermate controls. At E11.5, downregulation was verified for Etv4, Fam19a4, Tgfbi and Spry4 while upregulation was verified for Dcn, Sparc and Nog (n = 3, Student’s t-test p<0.05) (Fig. 2A). At E12.5, downregulation was validated for Etv4, Fam19a4, Tgfbi, Kitl, Tbx18, Pou3f3, Itga, and Enpp2 (n = 3, Student’s t-test p<0.05) (Fig. 2B).
Fig 2.
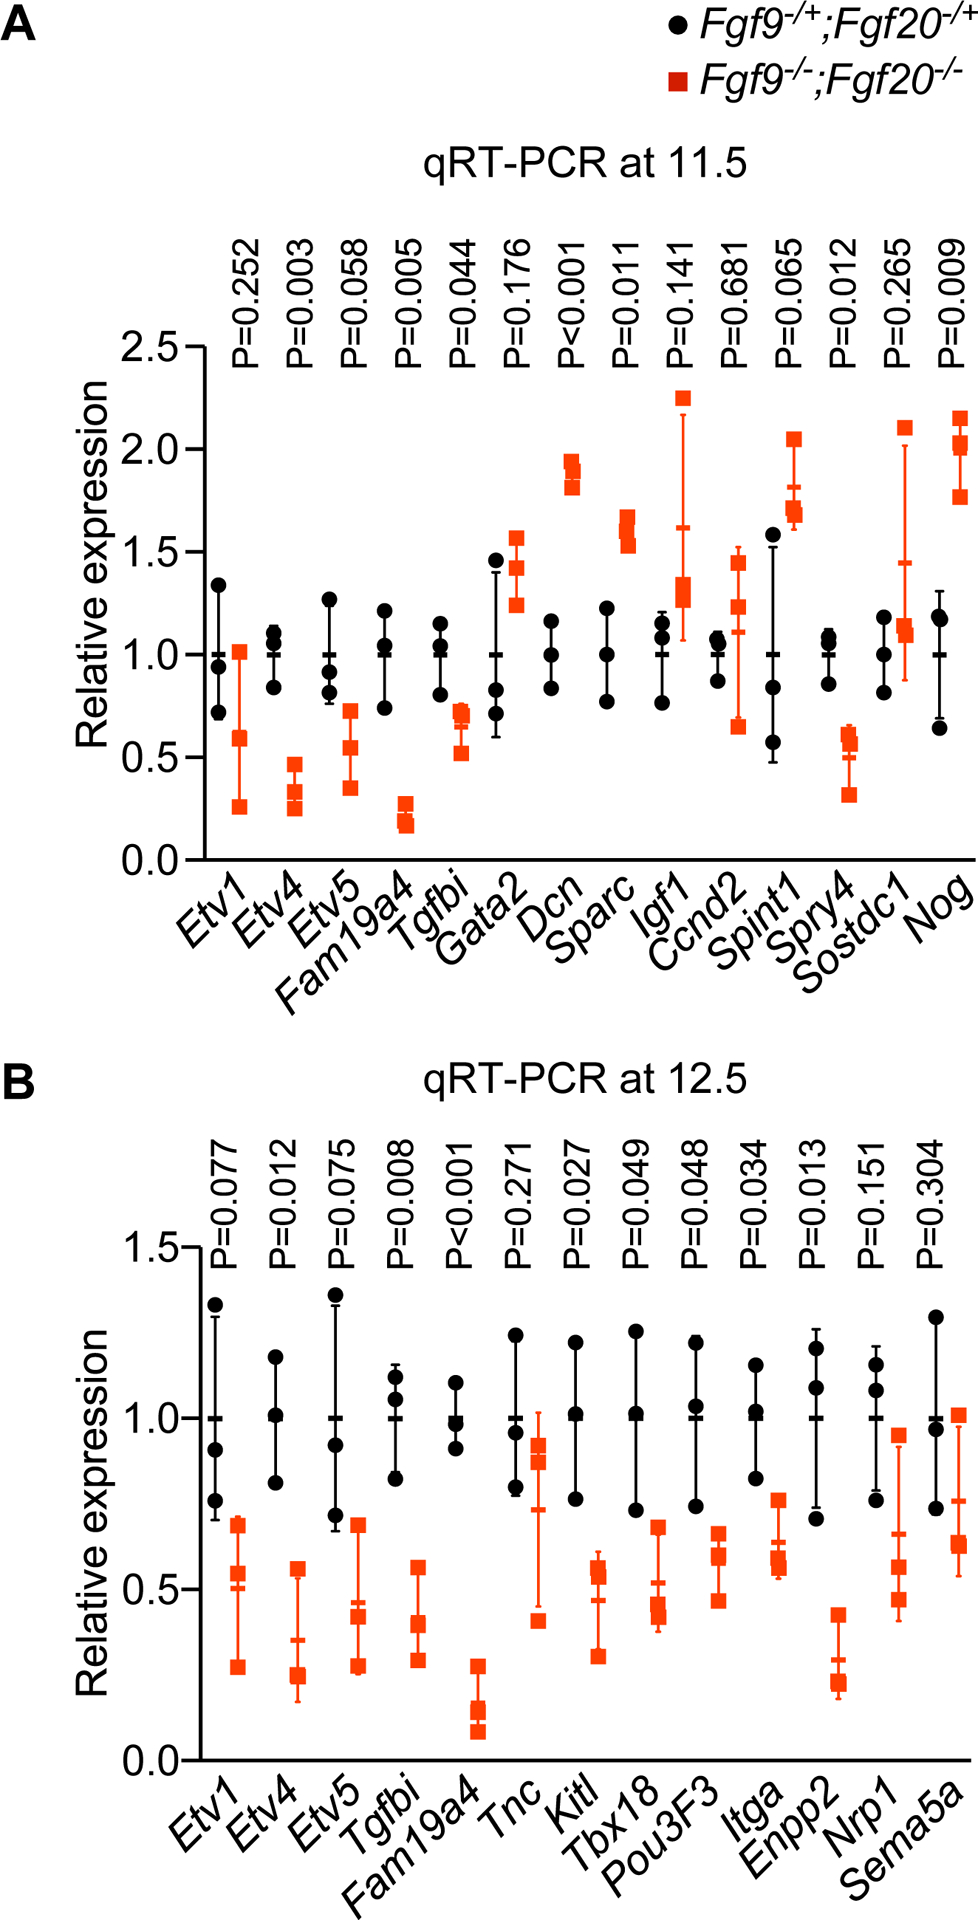
Validating differentially expressed genes in Fgf9−/−;Fgf20−/− versus control. Linear fold change in gene expression in Fgf9−/−;Fgf20−/− (red) compared to control (black) at E11.5 (upper panel) and E12.5 (lower panel) (n = 3, Student’s t-test p-value per gene is shown).
Also, in situ hybridization was performed probing a subset of differentially expressed genes. Etv4 and Etv5 exhibited a similar expression domain at E11.5 and E12.5 where the signal was detected in the mesenchyme surrounding the cochlear duct with a higher signal on the non-sensory side (Fig. 3). The sensory epithelium showed signals for both genes with slightly different domains. Etv5 was also detected in the non-sensory epithelium at E12.5 (Fig. 3). As for Etv1, its expression was weak compared to Etv4 and Etv5. The signal was only detected in the mesenchyme on the non-sensory side of the cochlea. Ebf1 and Tgfbi were detected in the mesenchyme surrounding the cochlear duct. Fam19a4 was expressed in the mesenchyme on the non-sensory side of the growing cochlea. All genes analyzed by in situ hybridization were downregulated in Fgf9−/−;Fgf20−/− compared to controls.
Fig. 3.
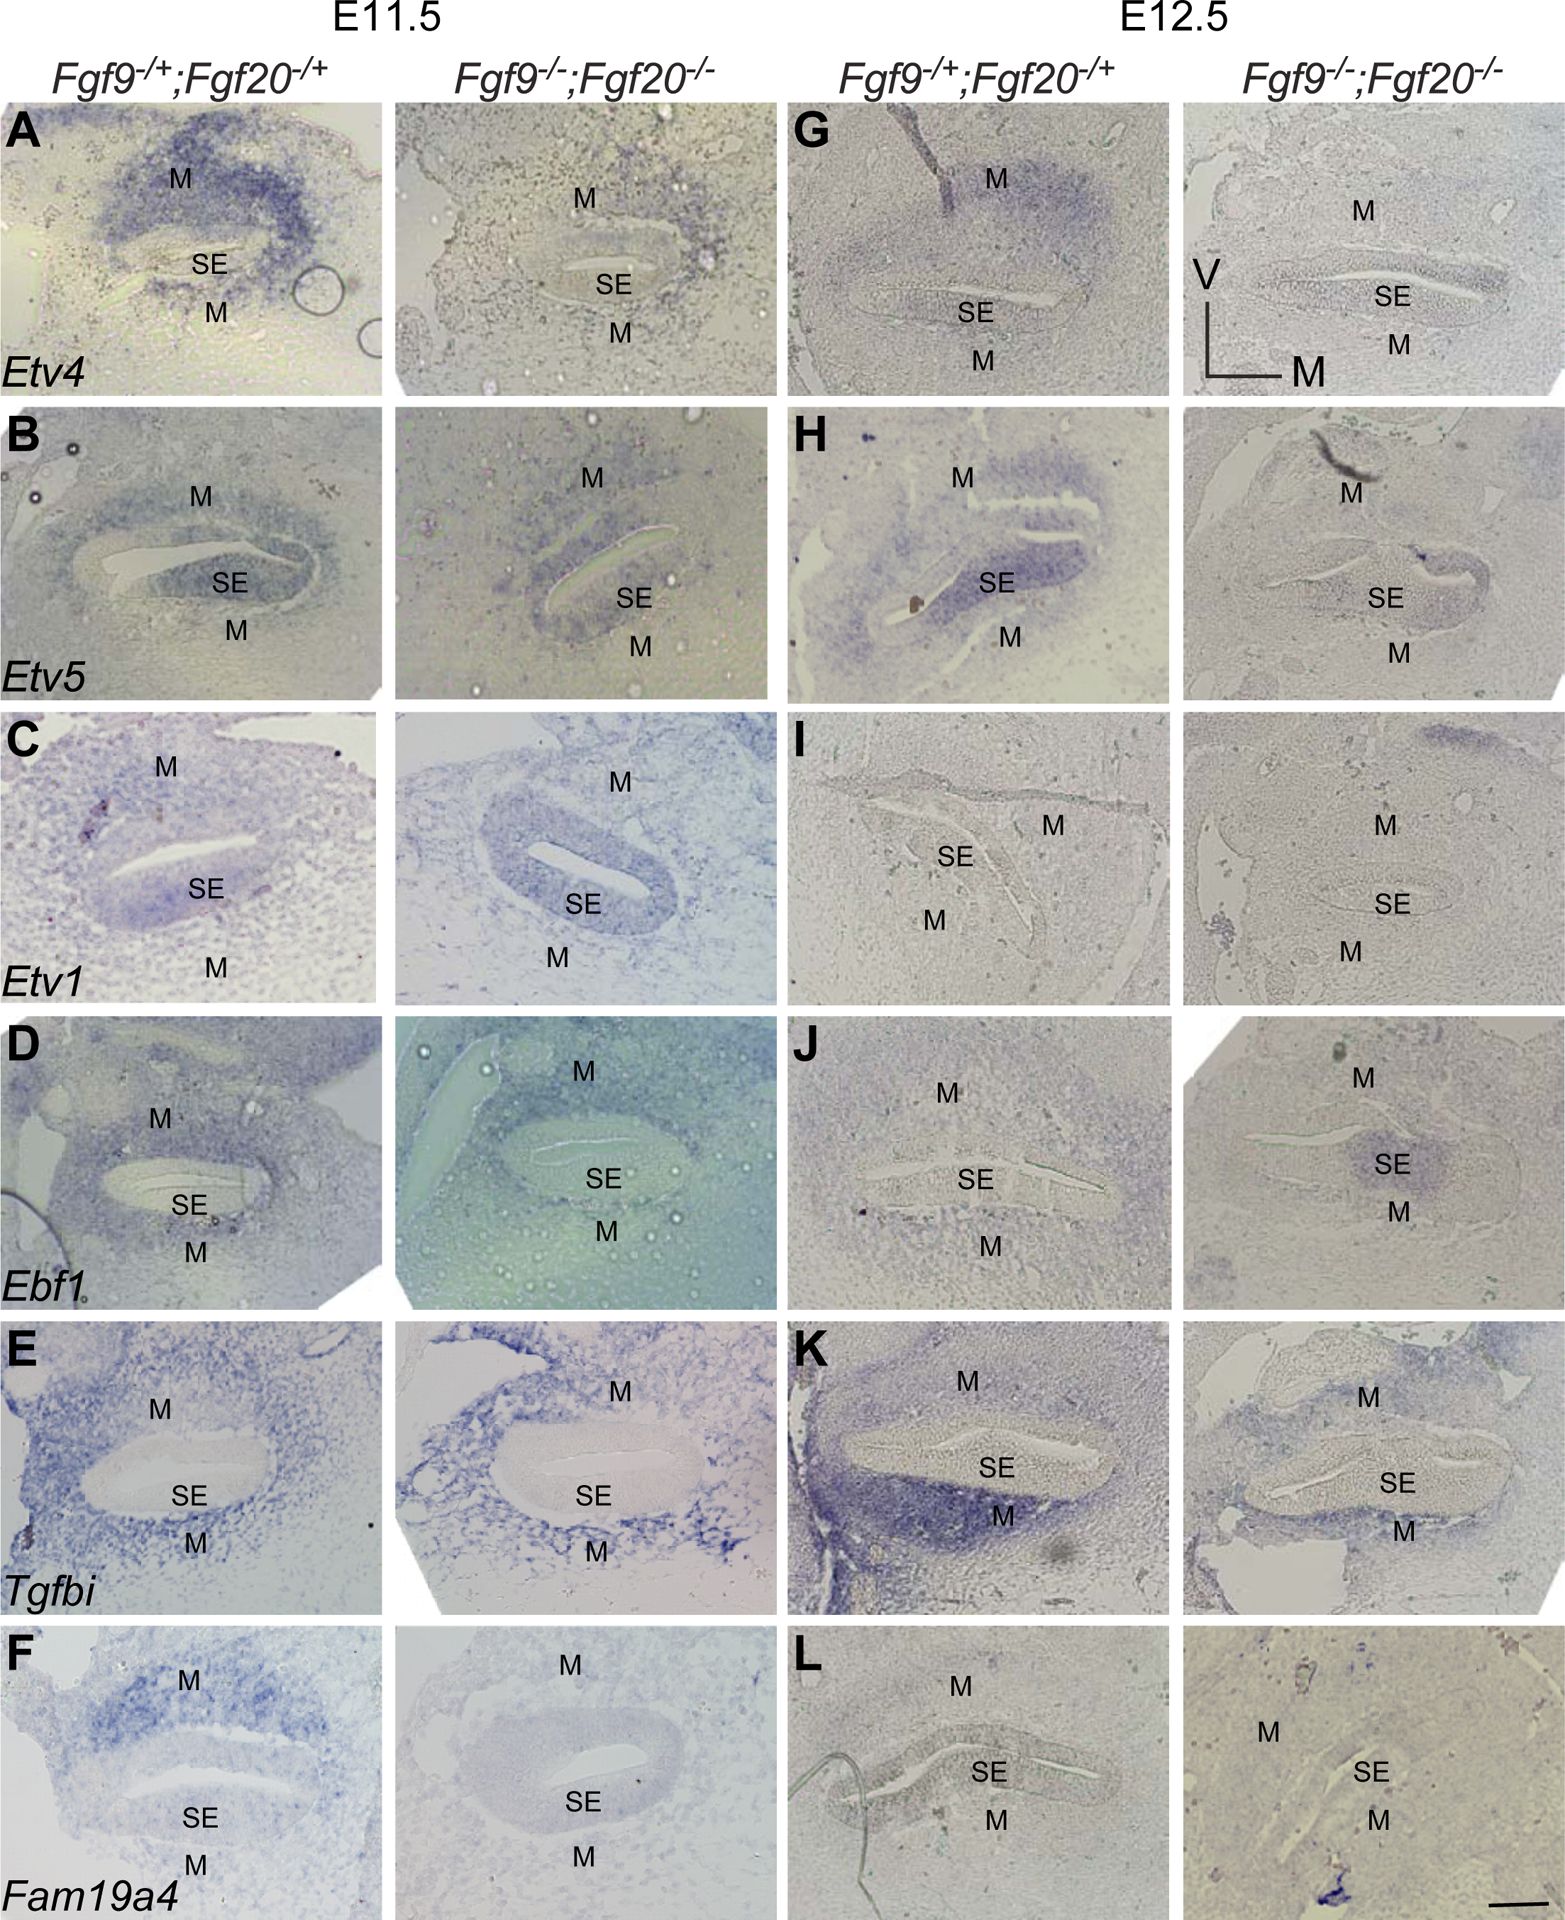
In-situ hybridization of selected candidate genes downstream FGF signaling in periotic mesenchyme at E11.5 and E12.5 in Fgf9−/−;Fgf20−/− versus control. (M) refers to the mesenchyme, (SE) refers to sensory epithelium. Scale bar=50μm.
3.4. Etv4 and Etv5 are required for cochlear lengthening but not epithelial patterning during development.
Since Etv4 and Etv5 showed downregulation at both time points, and both factors function as downstream effectors of FGF signaling in other organ development (Ornitz and Itoh, 2015), we examined their functions during cochlear development. We used a mesenchymal driver (Twist2Cre) (Sosic et al., 2003) and Etv5 Floxed mice (Etv5fl/+) (Zhang et al., 2009) to delete Etv5 in periotic mesenchyme with conventional deletion of Etv4. Examination of P0 cochlea showed that length of cochleae from Etv4−/−;Etv5fl/+;Twist2Cre/+ and Etv4+/−;Etv5fl/fl;Twist2Cre/+ were comparable to controls (Fig. 4). Length of cochleae from Etv4−/−;Etv5fl/fl;Twist2Cre/+ was decreased to 86% compared to controls (One-way ANOVA test, n at least 6, P<0.0001 followed by Dunnett’s multiple comparison test, adjusted P <0.0001) (Fig. 4). These data indicate that mesenchymal Etv4 and Etv5 compensate for each other in regulating the cochlear length. The expression of one copy of either is enough to maintain a normal cochlear length, and the loss of all copies of both genes from the mesenchyme result in cochlear shortening.
Fig 4.
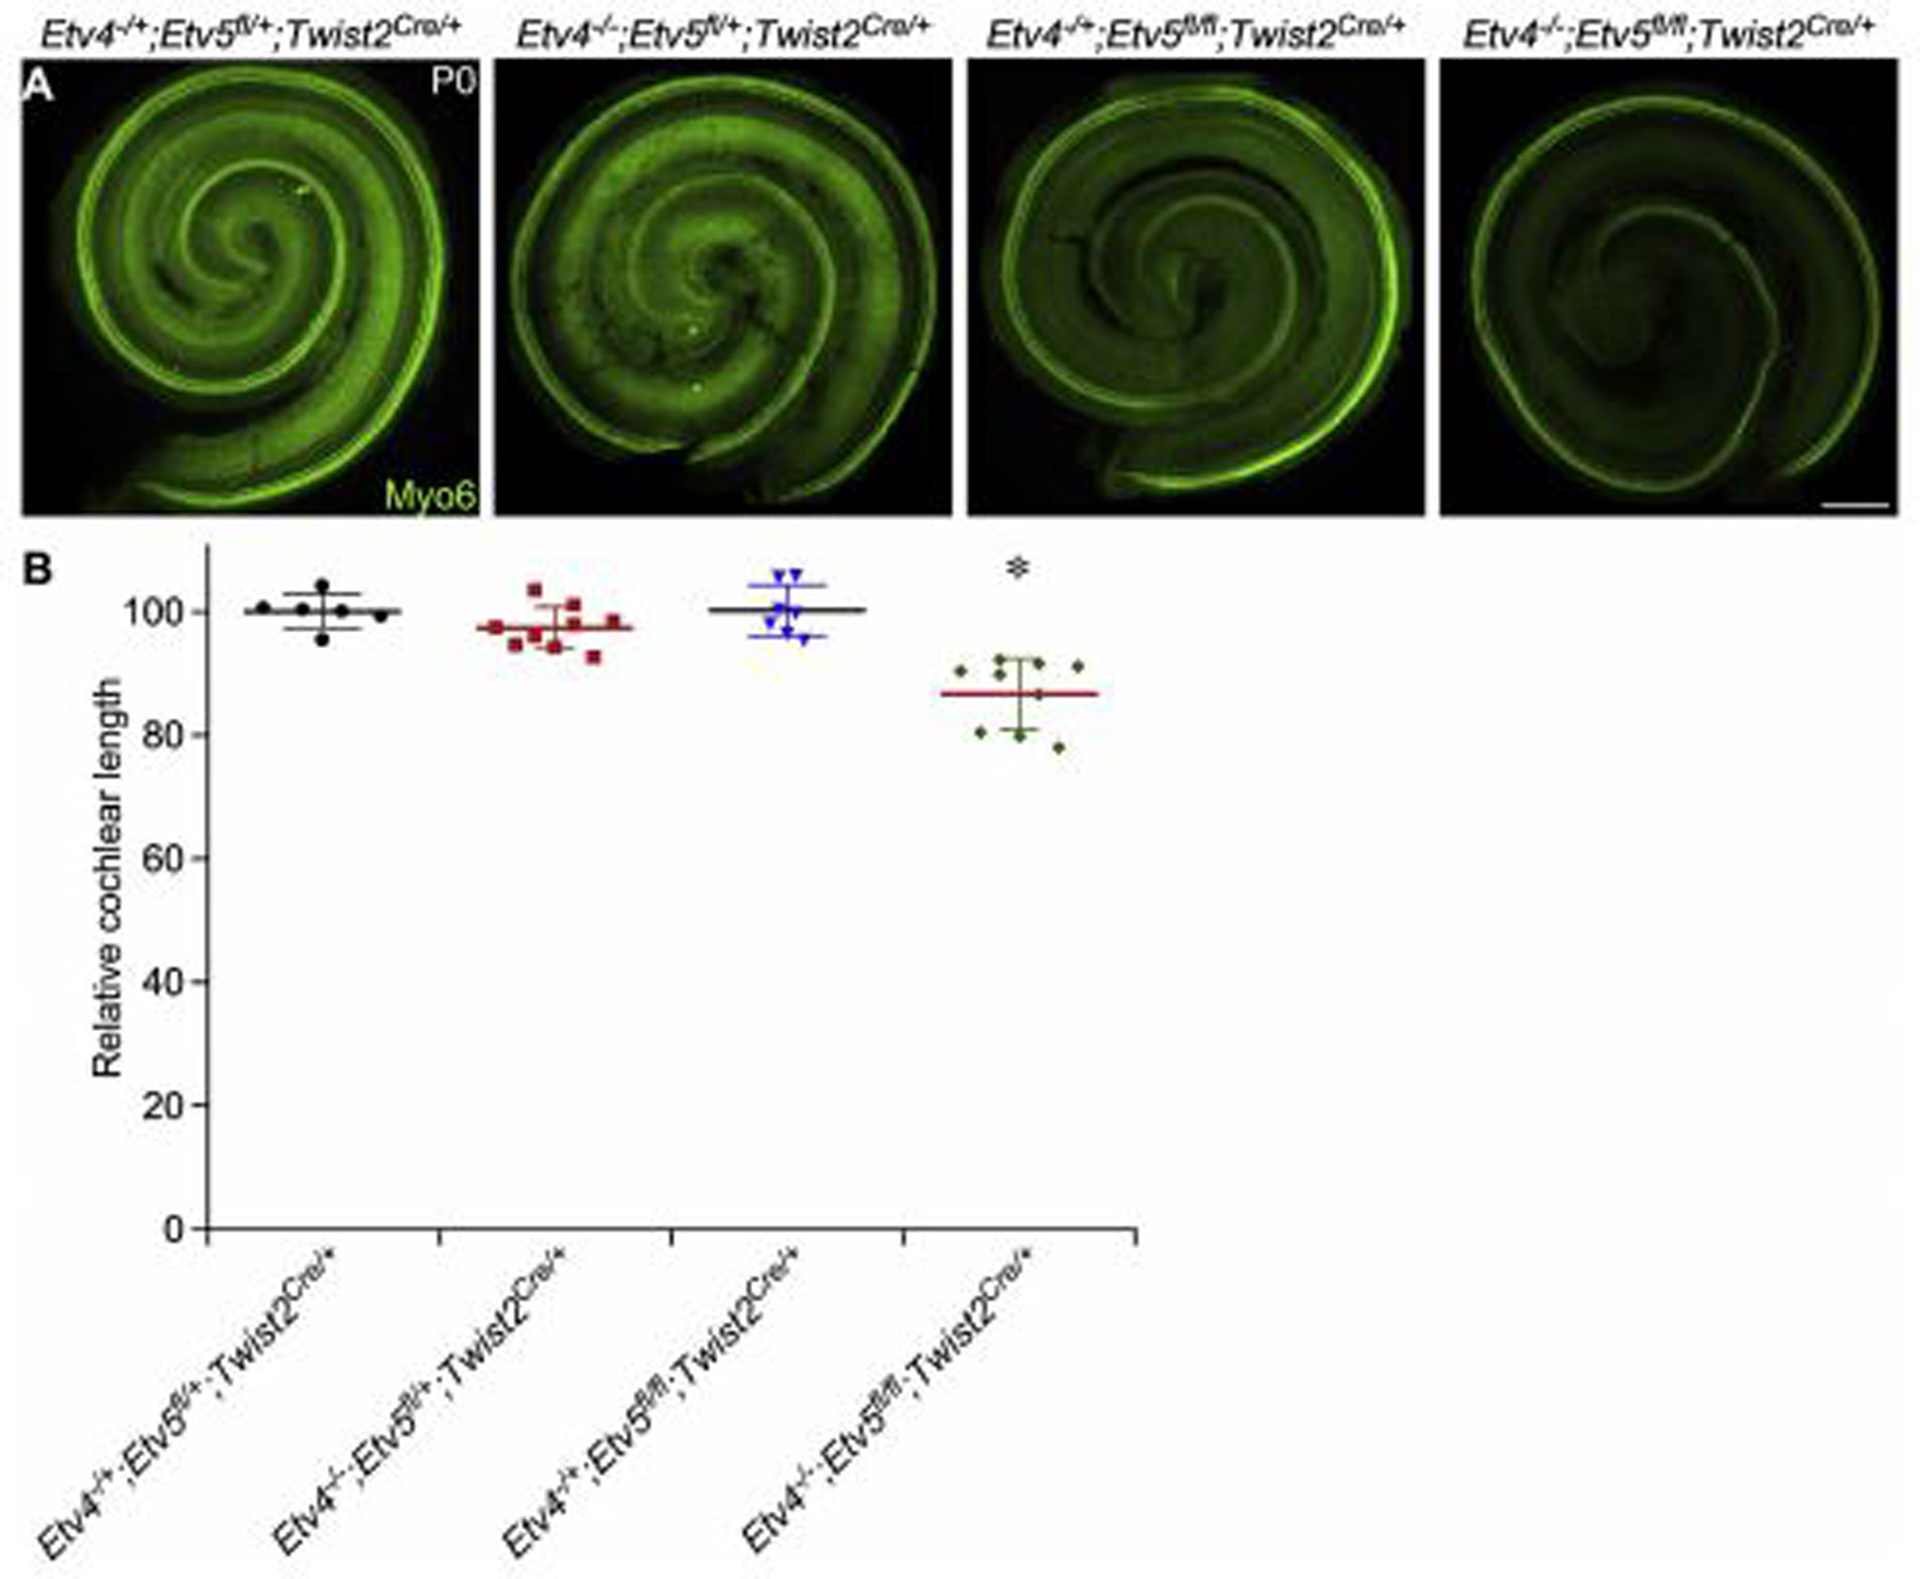
Cochlear phenotype in Etv4/5 compound mutants. (Upper panel) Whole mount cochlea from P0 Etv4 KO (Etv4−/−; Etv5fl/+;Twist2Cre/+), Etv5 cKO (Etv4−/+;Etv5fl/fl;Twist2Cre/+), Etv4/5 compound mutant (Etv4−/−;Etv5fl/fl;Twist2Cre/+) and littermate control (Etv4−/+;Etv5fl/+;Twist2Cre/+) showing whole cochlea stained with Myosin 6 antibody (green). White arrowheads mark the beginning and the end of the cochlear length measurement. (Lower panel) Quantification of cochlear duct length at P0 from each mouse model relative to control. Scale bar=200μm.
Next, we examined the patterning and cell density of the organ of Corti in each model. Staining for hair cell stereocilia bundles and supporting cells showed that hair cells and supporting cells align well in all genotypes (Fig. 5). In addition, the densities of hair cells and supporting cells were comparable in all genotypes (Fig. 5). These data indicate that mesenchymal Etv4 and Etv5 are dispensable for sensory epithelial patterning and differentiation.
Fig 5.
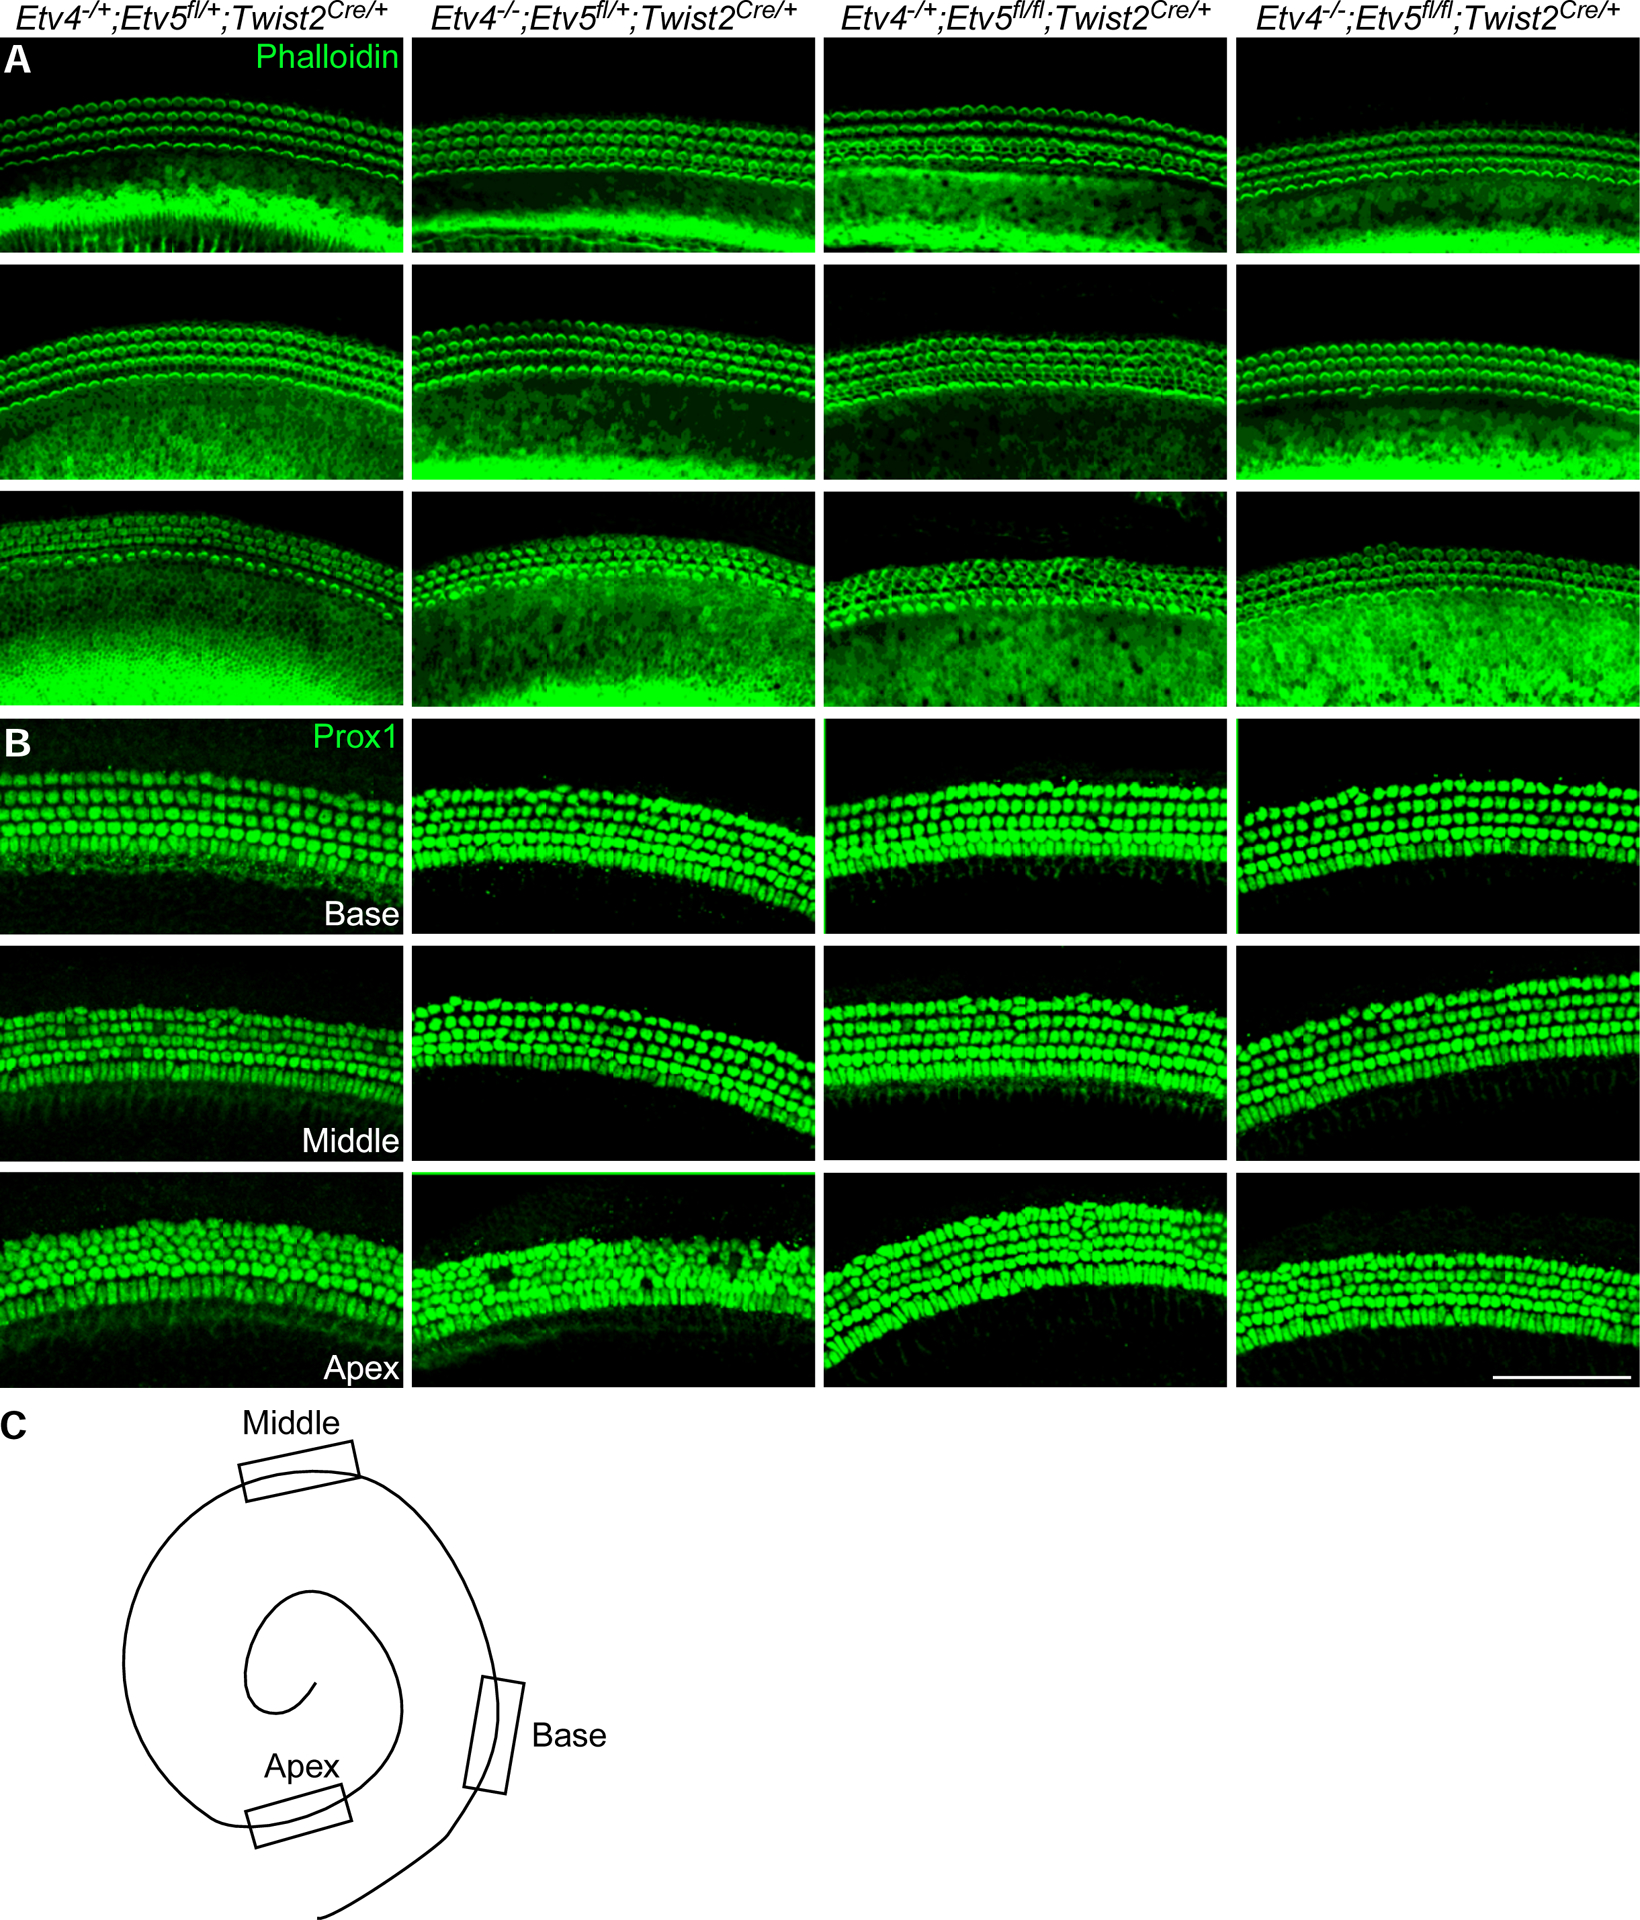
Hair cells and supporting cells in Etv4/5 compound mutants. Whole mount immunostaining of P0 cochlea from Etv4 KO (Etv4−/−; Etv5fl/+;Twist2Cre/+), Etv5 cKO (Etv4−/+;Etv5fl/fl;Twist2Cre/+), Etv4/5 compound mutant (Etv4−/−;Etv5fl/fl;Twist2Cre/+) and littermate control (Etv4−/+;Etv5fl/+;Twist2Cre/+) showing representative regions from each cochlear turn stained with F-actin to show Actin-enriched hair cell stereocilia (green) in panel A, and Prox1 staining (green) in panel B as a marker for supporting cells. (C) diagrammatic sketch to show representative regions from the base, middle and apex. Scale bar=100μm.
3.5. Mesenchymal Etv1 is dispensable for cochlear development.
Compared to the shortened cochlear phenotype caused by the loss of mesenchymal FGF signaling (about 40% compared to controls (Huh et al., 2015)), the phenotype of Etv4−/−;Etv5fl/fl;Twist2Cre/+ (86% compared to controls) is moderate. Etv1 is another member of Erm subfamily of ETS-domain transcription factor (de Launoit et al., 1997). Next-generation RNA sequencing showed that Etv1 expression was also decreased at both E11.5 and E12.5 in Fgf9−/−;Fgf20−/− mesenchyme tissues compared to controls (Tables 1&2). Therefore, we reasoned that Etv1 may function together with Etv4 and Etv5 to regulate cochlear length. To investigate whether Etv1 functions redundantly with Etv4 and Etv5 in regulating cochlear length, Etv1/4/5 triple conditional mutants were generated. Analysis of the length of the cochleae at P0 showed that shortened cochlear length in Etv1fl/fl; Etv4−/−;Etv5fl/fl;Twist2Cre/+ (83% compared to controls) is comparable to either Etv1fl/+; Etv4−/−;Etv5fl/fl;Twist2Cre/+ (84.5% compared to control) or Etv4−/−;Etv5fl/fl;Twist2Cre/+ (86% compared to controls) (One-way ANOVA test, n at least 6, P<0.0001 followed by Dunnett’s multiple comparison test Adjusted P Value <0.0001) (Fig.7A & 8A). Epithelial patterning of organ of Corti and densities of both hair cells and supporting cells were comparable in all genotypes (Fig. 7B,C & 8B,C) indicating that mesenchymal Etv1 is dispensable for cochlear development. Additionally, examining single Etv1 mutants (Etv1fl/fl;Twist2Cre/+) didn’t show any defects in hair cell number and cochlear lengthening (data not shown).
Fig 7.
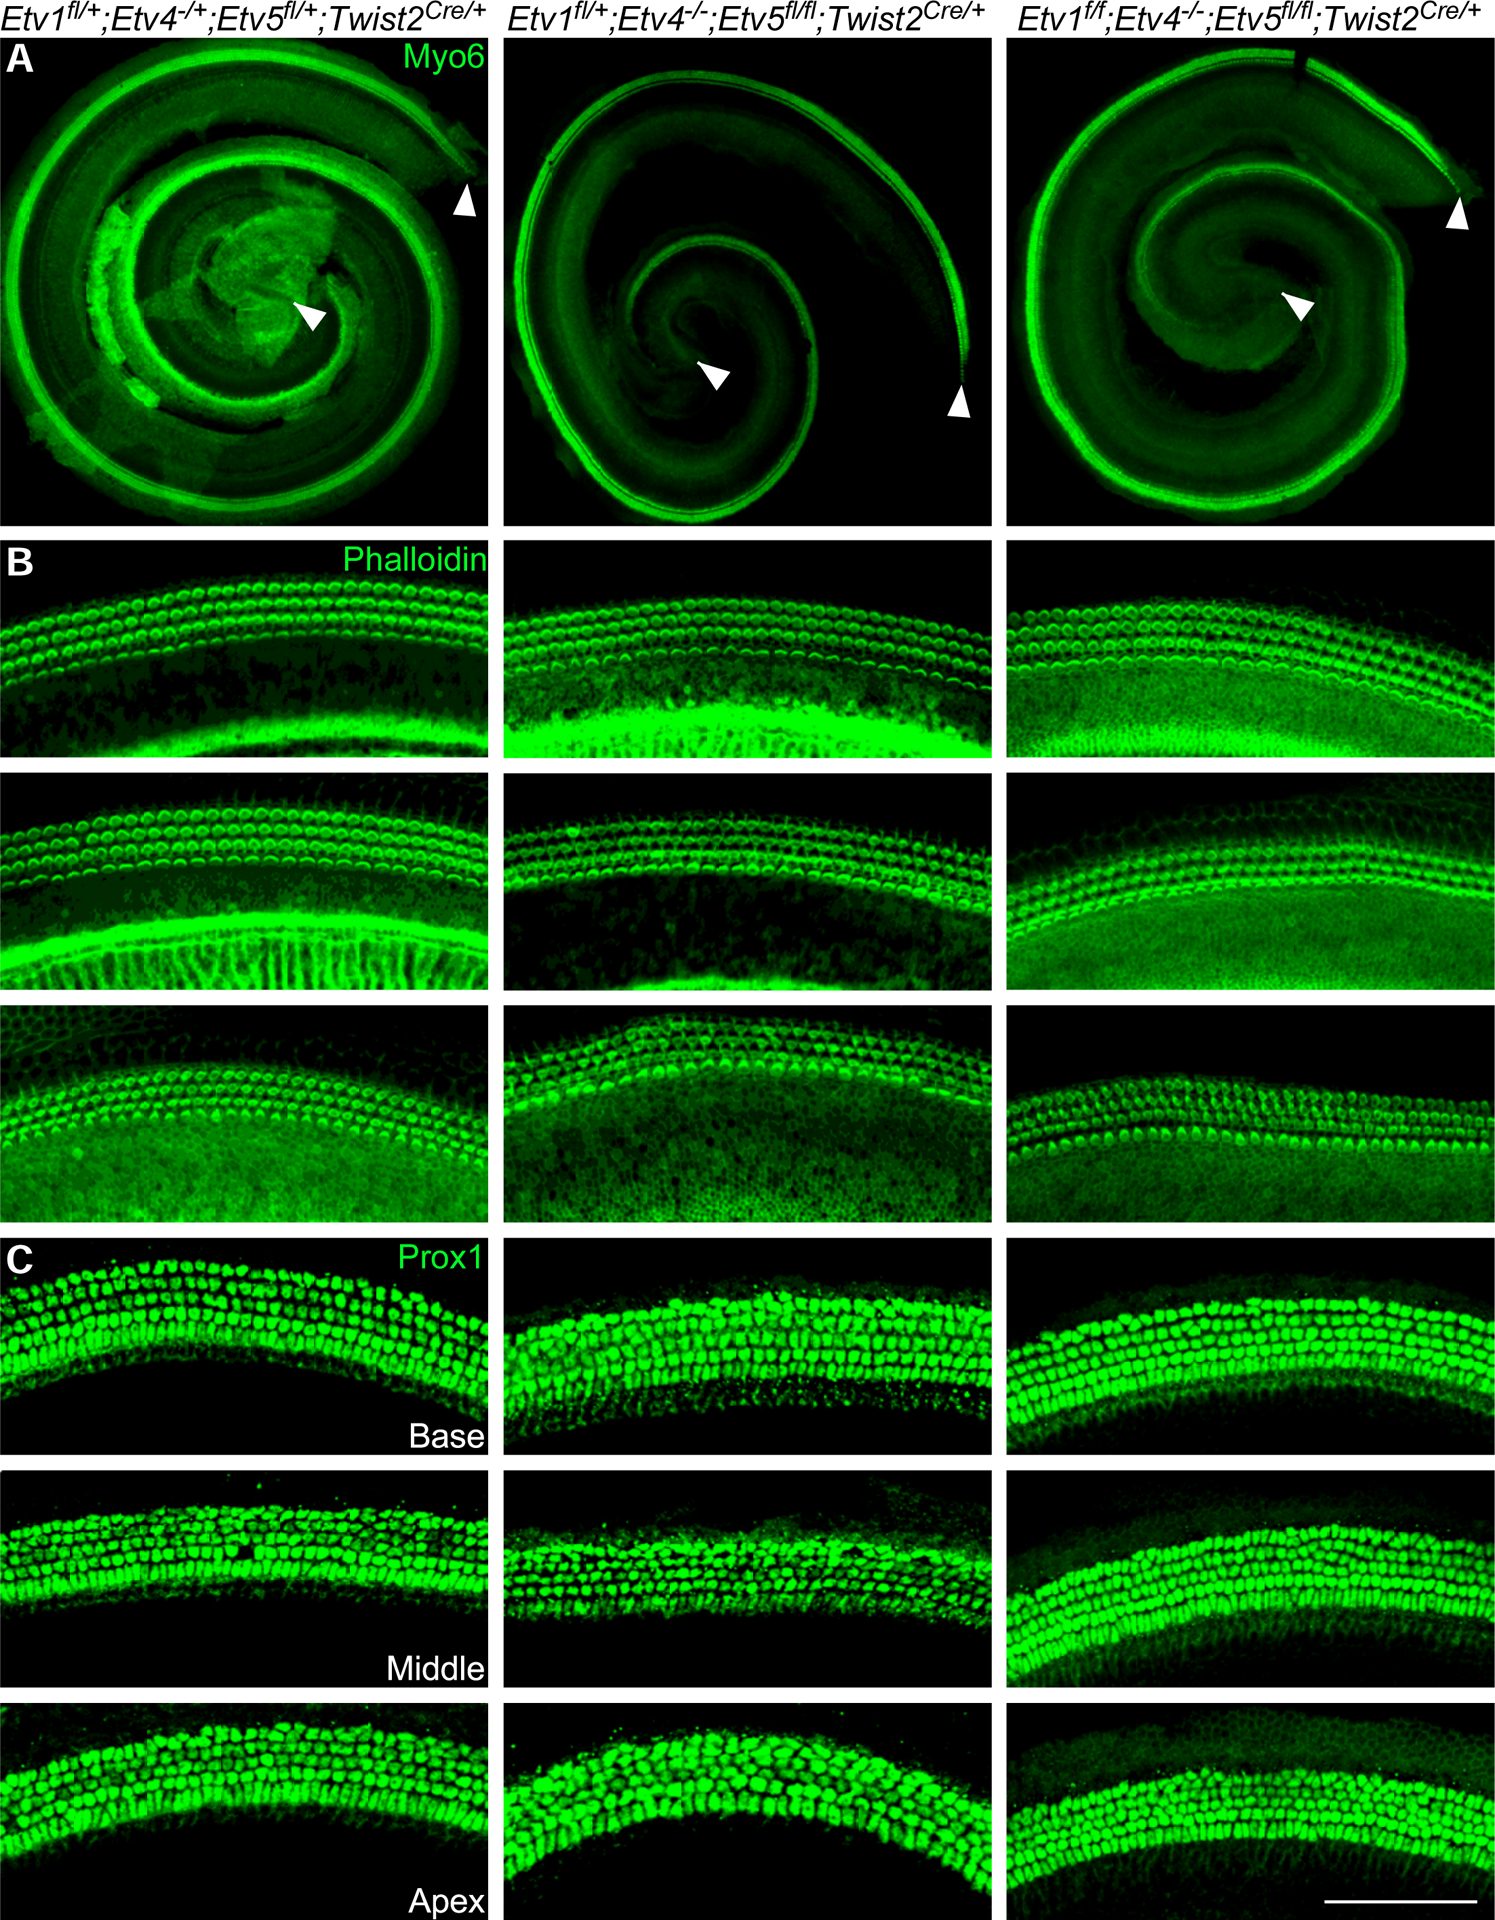
Mesenchymal Etv1 is dispensable for cochlear development Whole mount immunostaining of P0 cochlea from control (Etv1fl/+; Etv4−/+; Etv5fl/+;Twist2Cre/+), Etv4/5 double mutant (Etv1fl/+;Etv4−/−;Etv5fl/fl;Twist2Cre/+) and Etv1/4/5 triple mutant (Etv1fl/fl;Etv4−/−;Etv5fl/fl;Twist2Cre/+) showing whole cochlea stained with Myosin 6 antibody (green) (A), and representative regions from each cochlear turn stained with F-actin (green) (B), and Prox1 staining (green) (C) as a marker for supporting cells. Scale bar=100μm. White arrowheads mark the beginning and the end of the cochlear length measurement.
Fig 8.
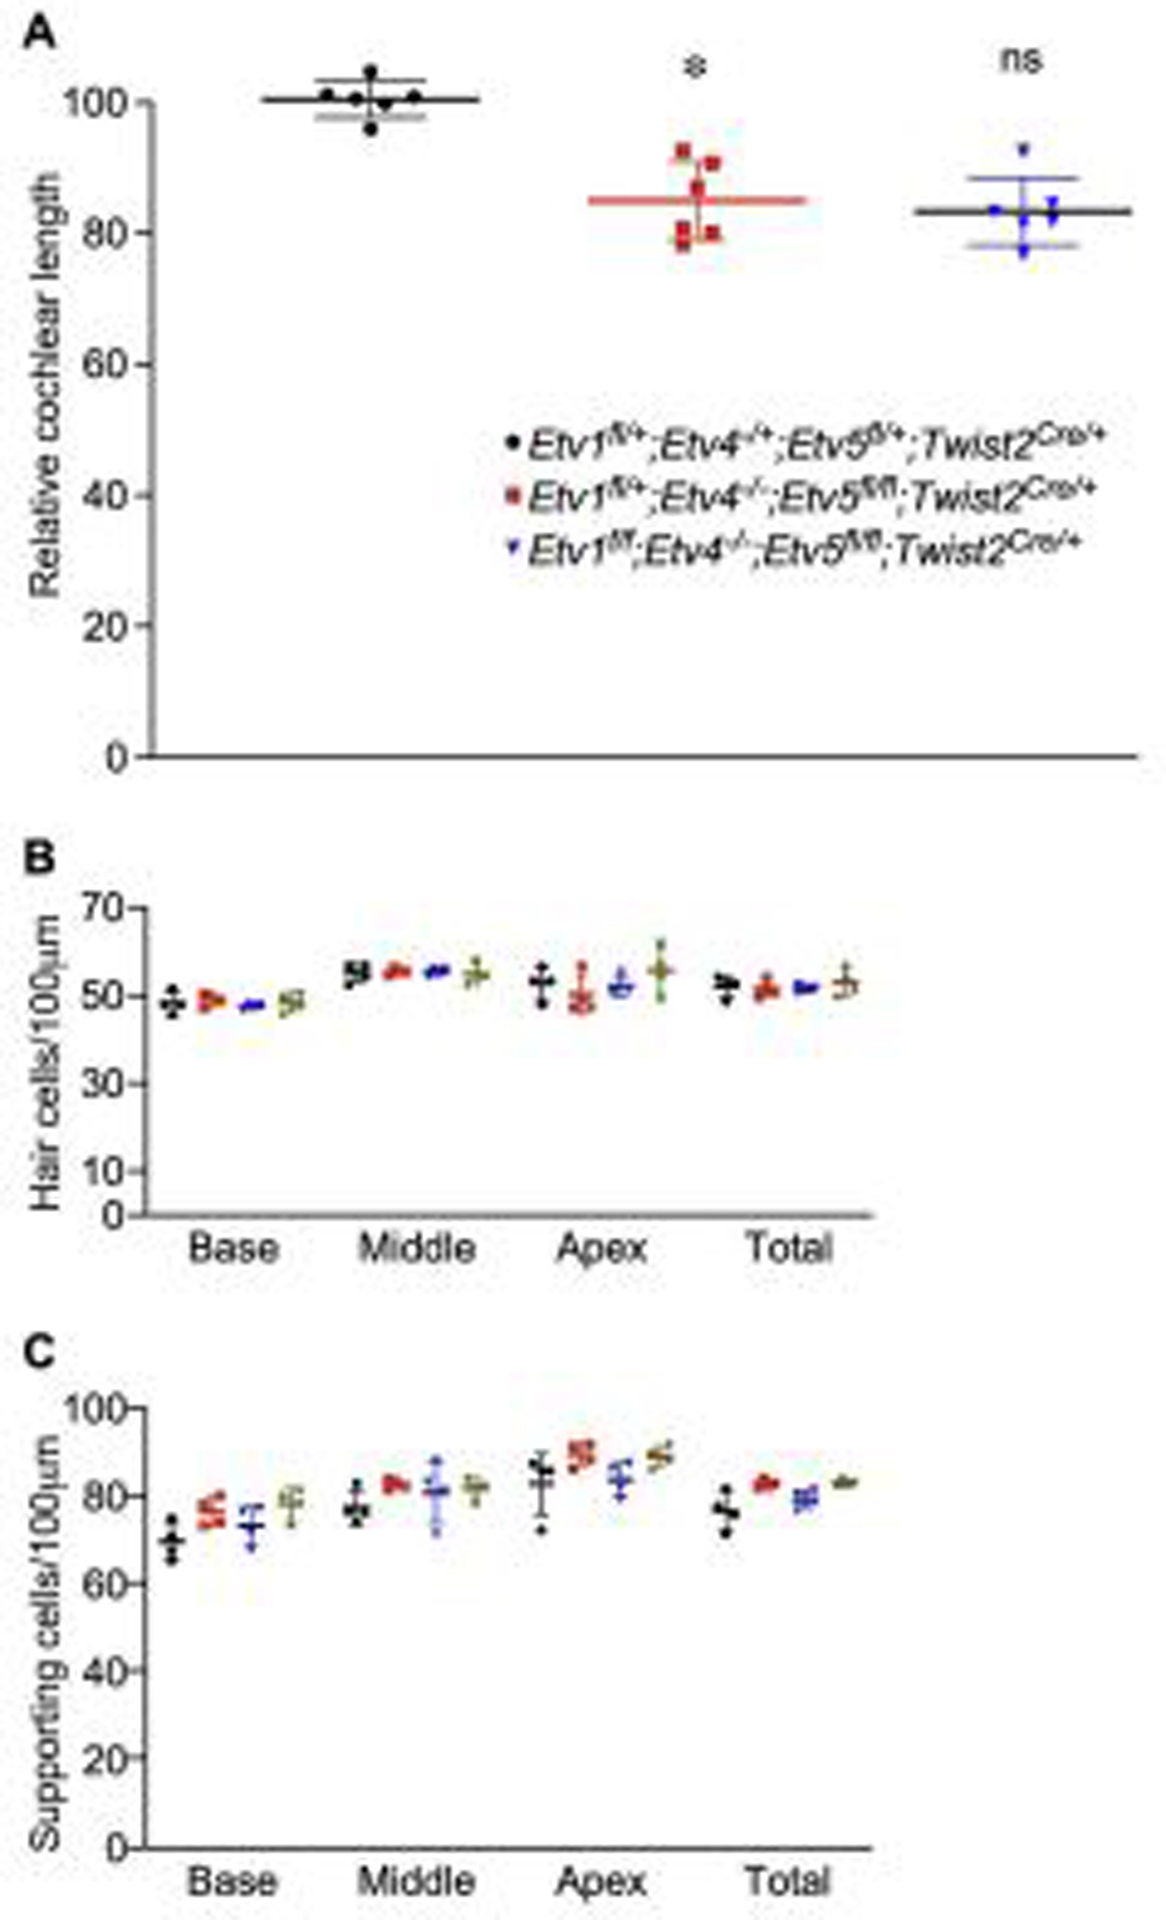
Quantification of cochlear length, hair cell and supporting cell density in Etv1/4/5 compound mutants (A) Quantification of cochlear duct length at P0 from control (Etv1fl/+;Etv4−/+;Etv5fl/+;Twist2Cre/+), Etv4/Etv5 double mutant (Etv1fl/+;Etv4−/−;Etv5fl/fl;Twist2Cre/+) and Etv1/4/5 triple mutant (Etv1fl/fl;Etv4−/−;Etv5fl/fl;Twist2Cre/+) (B) Hair cell density and (C) supporting cell density from each genotype.
4. Discussion
4.1. FGF signaling regulate the periotic mesenchyme transcriptome.
Gene expression analysis of the periotic mesenchyme using RNA sequencing, RNA in situ hybridization, and quantitative real time PCR identified multiple targets downstream FGF signaling at E11.5 and E12.5 developmental time points. We looked specifically at 3 sets of genes: transcription factors that function as direct downstream targets of FGF signaling, secreted molecules that can diffuse back to the growing cochlear epithelium to control the developing progenitors, and cell surface molecules that can regulate epithelial-to-mesenchymal interaction.
As for transcription factors, we identified 3 members of the ETS family of transcription factors that belongs to the same PEA3 subfamily; Etv1, Etv4 and Etv5 (de Launoit et al., 1997) to be downregulated. In addition, other transcription factors such as Ebf1 and Tfdp1 were identified. Such data indicates that FGF signaling at this time of development is regulating mesenchymal gene expression through multiple transcription factors. Another set of downstream targets identified is the Sprouty proteins (Spry1 and Spry4), which are expected as these proteins are known as negative feedback regulators of receptor tyrosine kinase signaling, including FGF signaling (Shim et al., 2005).
Examining genes encoding secreted proteins that were differentially expressed in Fgf9/20 double mutants revealed Fam19a4, a member of the family of chemokine-like proteins, is on the top of downregulated genes at both E11.5 and E12.5 that was also confirmed with real time PCR. Although recent study shows its rule in the activation of macrophages during pathogenic infections (Wang et al., 2015), the role of these proteins during inner ear development is still to be discovered. It is not clear whether FAM19A4 can diffuse back to the developing cochlear epithelium and function to regulate progenitor proliferation. Lack of a mouse model with FAM19a4 deletion is limiting such investigation. Our data also show other genes encoding secreted proteins to be dysregulated in Fgf9/20 double mutants such as Sostdc1. It is a known antagonist for bone morphogenic protein (BMP) signaling and Wnt signaling pathways (Faraahi et al., 2019) and it can potentially diffuse and regulate epithelial development.
As for the cell surface molecules, we identified Itga8 gene expression to be downregulated in Fgf9/20 double mutant mesenchyme at E12.5. As a member of integrin family, this protein functions as a cell adhesion receptor that serves as a link between the extracellular matrix and the cytoskeleton and is capable of bidirectional signaling across the plasma membrane (Hynes, 2002). Follow up studies on the specific rule of such secreted proteins can potentially uncover their contribution to cochlear lengthening.
4.2. ETV transcription factors operate downstream FGF signaling to regulate cochlear length.
Multiple studies show ETV transcription factor function downstream FGF during development (Firnberg and Neubuser, 2002; Herriges et al., 2015; Mao et al., 2009). Our analysis of Etv4/5 compound mutant cochleae showed that deletion of Etv4 or Etv5 alone maintained normal cochlear length and sensory epithelial patterning. On the other hand, deleting both Etv4 and Etv5 yielded a reduced cochlear length. This indicate that Etv4 and Etv5 function redundantly during cochlear development. However, the degree of phenotype in Etv4/5 double mutants (about 86% of the control cochlea) was yet not to the extent of the shortening observed in Fgf9/20 double mutant (about 40% of the control length) (Huh et al., 2015). This is indicative of other factors that are still expressed in Etv4/5 double mutants and are capable of compensating the loss of both Etv4 and Etv5. Investigating the role of Etv1 in cochlear development redundantly with Etv4/5 didn’t show any significant contribution (Fig. 7). One caveat might be the efficiency of Twist2Cre in deleting all 4 copies of Etv1 and Etv5 genes from the mesenchyme since Etv4 is conventionally deleted from all cells. Inefficient deletion of all 4 copies might contribute to the lack of more sever phenotype in Etv1/4/5 triple mutants compared to Etv4/5 double mutants. Additionally, further experiments investigating other candidate transcription factor such as Ebf1 contribution in cochlear lengthening are valid future directions.
4.3. Mesenchymal ETV transcription factors are dispensable for sensory epithelium patterning and differentiation.
Examining hair cells and supporting cells in Etv4/5 and Etv1/4/5 compound mutants showed normal patterning and density across the length of the cochlear duct in all genotypes analyzed. Based on the what we observed, shortened cochlear length and same hair cell density, we speculate that total hair cell number might be decreased. This is a clear recapitulate of phenotype in mesenchymal Fgfr1/2 deletion. Whether shortened cochlea impacts hearing function is interesting subject for further investigation.
4.4. Future Perspectives
Given the distinct regionalization of Fgf9 and Fgf20 expression in nonsensory versus sensory cochlear epithelium, it will be interesting to investigate how these factors contribute to the commitment or maintenance of sensory versus nonsensory fates during early cochlear development. Additionally, how ETV transcription factors contribute to such role is a valid area for investigation.
Although our study shows 2 ETV transcription factors regulating the cochlear length, the mechanism of such regulation is still unclear. Gene expression analysis of the developing cochlear sensory epithelium in mouse models with mesenchymal ETV deletion might help identify target genes downstream ETV4 and ETV5 transcription factors. Additionally, chromatin immunoprecipitation and sequencing (ChIP-seq) assay can be utilized to identify genome-wide DNA binding sites for ETV transcription factors during cochlear development. Loss-of-function experiments utilizing either in vivo mouse models if available or ex vivo explants with gene manipulation will be valid future direction to confirm ETV target contribution in cochlear lengthening.
A challenge facing future experiments is that FGF signaling and subsequently ETVs are active in both cochlear epithelium and surrounding mesenchyme, and possibly playing different roles in each domain at different developmental stages. Careful experimental planning and data interpretation that take into consideration these different expression domains and different roles of FGF signaling during cochlear development is required to achieve better understanding of the underlying molecular mechanisms.
Supplementary Material
Fig 6.
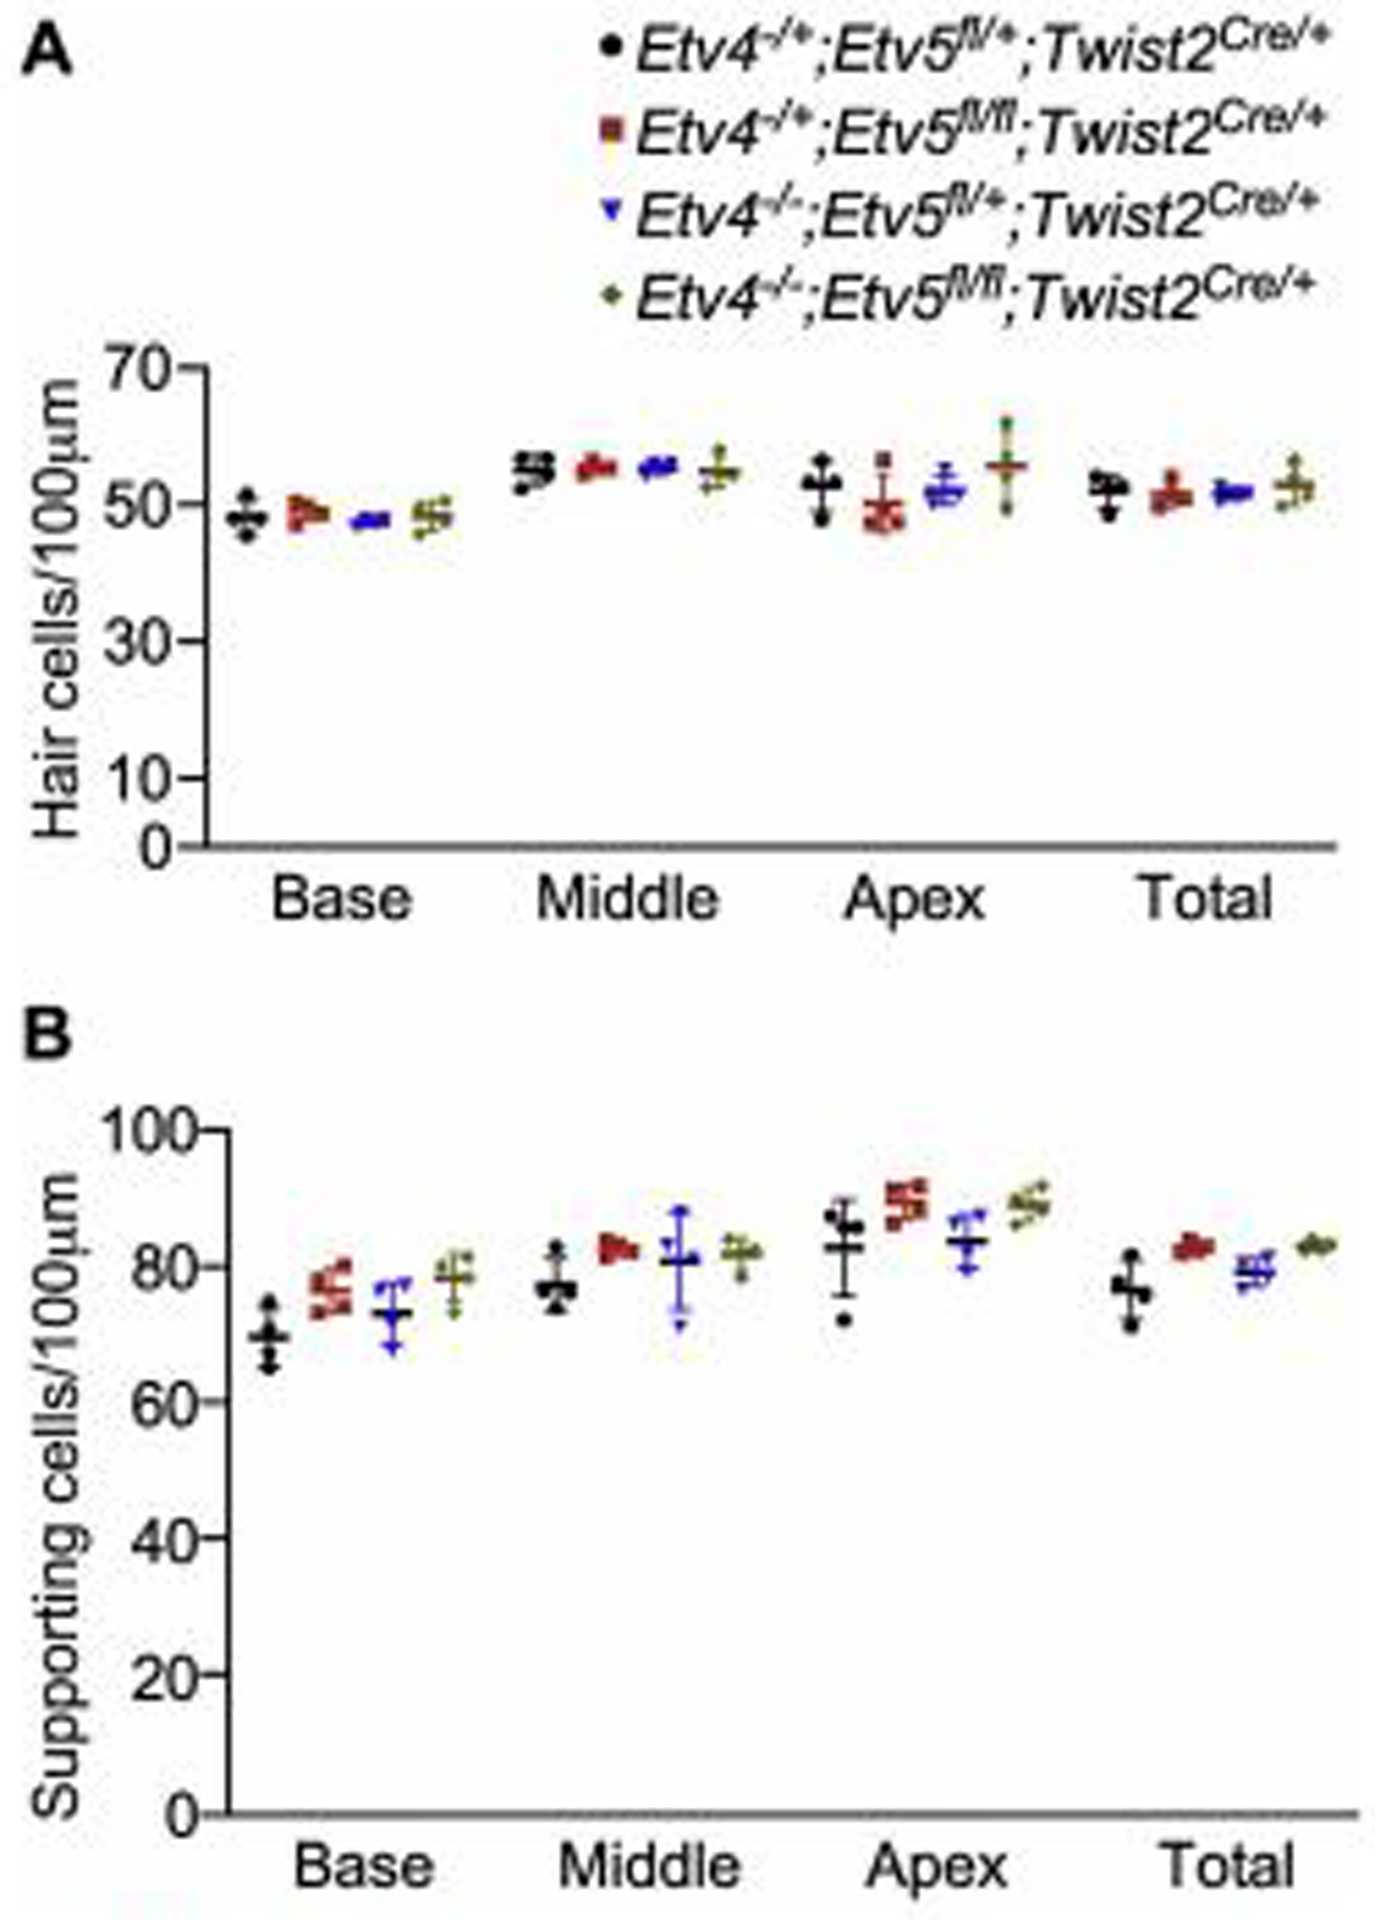
Hair cell and supporting cell density in Etv4/5 compound mutants Quantification of hair cell and supporting cell density at P0 from Etv4 KO (Etv4−/−; Etv5fl/+;Twist2Cre/+), Etv5 cKO (Etv4−/+;Etv5fl/fl;Twist2Cre/+), Etv4/5 compound mutant (Etv4−/−;Etv5fl/fl;Twist2Cre/+) and littermate control (Etv4−/+;Etv5fl/+;Twist2Cre/+) showing no significant change.
Highlights.
RNA sequencing reveals genes differentially expressed in Fgf9/20 mutant inner ears
FGF9/20 regulates expression ETV1/4/5
Loss of Etv4/5 in peri-otic mesenchyme shortens cochlear length
Etv1 does not contribute cochlear length maintenance
Acknowledgements
We thank Drs. Silvia Arber from University of Basel, John Hassell from McMaster University, and Xin Sun from University of Wisconsin-Madison for sharing their mouse models, the University of Nebraska Medical Center Sequencing core facility for help in transcriptome analysis, Ligyeom Ha and Brennan Roche for mouse handling.
Funding: This work was supported by the NIH DC012825, GM110768, and DHHS 44388-Y3 (to S.-H.H.); and the American Hearing Research Foundation (to M.E.).
Footnotes
Publisher's Disclaimer: This is a PDF file of an unedited manuscript that has been accepted for publication. As a service to our customers we are providing this early version of the manuscript. The manuscript will undergo copyediting, typesetting, and review of the resulting proof before it is published in its final form. Please note that during the production process errors may be discovered which could affect the content, and all legal disclaimers that apply to the journal pertain.
References
- Anders S, and Huber W (2010). Differential expression analysis for sequence count data. Genome Biology 11, R106. [DOI] [PMC free article] [PubMed] [Google Scholar]
- Chotteau-Lelievre A, Desbiens X, Pelczar H, Defossez PA, and de Launoit Y (1997). Differential expression patterns of the PEA3 group transcription factors through murine embryonic development. Oncogene 15, 937–952. [DOI] [PubMed] [Google Scholar]
- Colvin JS, Green RP, Schmahl J, Capel B, and Ornitz DM (2001). Male-to-female sex reversal in mice lacking fibroblast growth factor 9. Cell 104, 875–889. [DOI] [PubMed] [Google Scholar]
- de Launoit Y, Baert J-L, Chotteau A, Monte D, Defossez P-A, Coutte L, Pelczar H, and Leenders F (1997). Structure–Function Relationships of the PEA3 Group of Ets-Related Transcription Factors. Biochemical and Molecular Medicine 61, 127–135. [DOI] [PubMed] [Google Scholar]
- Dobin A, Davis CA, Schlesinger F, Drenkow J, Zaleski C, Jha S, Batut P, Chaisson M, and Gingeras TR (2012). STAR: ultrafast universal RNA-seq aligner. Bioinformatics 29, 15–21. [DOI] [PMC free article] [PubMed] [Google Scholar]
- Doetzlhofer A, White P, Lee YS, Groves A, and Segil N (2006). Prospective identification and purification of hair cell and supporting cell progenitors from the embryonic cochlea. Brain Res 1091, 282–288. [DOI] [PubMed] [Google Scholar]
- Ebeid M, and Huh SH (2017). FGF signaling: diverse roles during cochlear development. BMB Rep 50, 487–495. [DOI] [PMC free article] [PubMed] [Google Scholar]
- Faraahi Z, Baud’huin M, Croucher PI, Eaton C, and Lawson MA (2019). Sostdc1: A soluble BMP and Wnt antagonist that is induced by the interaction between myeloma cells and osteoblast lineage cells. Bone 122, 82–92. [DOI] [PMC free article] [PubMed] [Google Scholar]
- Firnberg N, and Neubuser A (2002). FGF signaling regulates expression of Tbx2, Erm, Pea3, and Pax3 in the early nasal region. Dev Biol 247, 237–250. [DOI] [PubMed] [Google Scholar]
- Herriges JC, Verheyden JM, Zhang Z, Sui P, Zhang Y, Anderson MJ, Swing DA, Zhang Y, Lewandoski M, and Sun X (2015). FGF-Regulated ETV Transcription Factors Control FGF-SHH Feedback Loop in Lung Branching. Dev Cell 35, 322–332. [DOI] [PMC free article] [PubMed] [Google Scholar]
- Huang da W, Sherman BT, and Lempicki RA (2009a). Bioinformatics enrichment tools: paths toward the comprehensive functional analysis of large gene lists. Nucleic Acids Res 37, 1–13. [DOI] [PMC free article] [PubMed] [Google Scholar]
- Huang da W, Sherman BT, and Lempicki RA (2009b). Systematic and integrative analysis of large gene lists using DAVID bioinformatics resources. Nat Protoc 4, 44–57. [DOI] [PubMed] [Google Scholar]
- Huh SH, Jones J, Warchol ME, and Ornitz DM (2012). Differentiation of the lateral compartment of the cochlea requires a temporally restricted FGF20 signal. PLoS biology 10, e1001231. [DOI] [PMC free article] [PubMed] [Google Scholar]
- Huh SH, Warchol ME, and Ornitz DM (2015). Cochlear progenitor number is controlled through mesenchymal FGF receptor signaling. eLife 4, 10.7554/eLife.05921. [DOI] [PMC free article] [PubMed] [Google Scholar]
- Hynes RO (2002). Integrins: Bidirectional, Allosteric Signaling Machines. Cell 110, 673–687. [DOI] [PubMed] [Google Scholar]
- Kerman IA, Buck BJ, Evans SJ, Akil H, and Watson SJ (2006). Combining laser capture microdissection with quantitative real-time PCR: effects of tissue manipulation on RNA quality and gene expression. J Neurosci Methods 153, 71–85. [DOI] [PubMed] [Google Scholar]
- Laing MA, Coonrod S, Hinton BT, Downie JW, Tozer R, Rudnicki MA, and Hassell JA (2000). Male sexual dysfunction in mice bearing targeted mutant alleles of the PEA3 ets gene. Mol Cell Biol 20, 9337–9345. [DOI] [PMC free article] [PubMed] [Google Scholar]
- Lu BC, Cebrian C, Chi X, Kuure S, Kuo R, Bates CM, Arber S, Hassell J, MacNeil L, Hoshi M, et al. (2009). Etv4 and Etv5 are required downstream of GDNF and Ret for kidney branching morphogenesis. Nat Genet 41, 1295–1302. [DOI] [PMC free article] [PubMed] [Google Scholar]
- Mao J, McGlinn E, Huang P, Tabin CJ, and McMahon AP (2009). Fgf-dependent Etv4/5 activity is required for posterior restriction of Sonic Hedgehog and promoting outgrowth of the vertebrate limb. Dev Cell 16, 600–606. [DOI] [PMC free article] [PubMed] [Google Scholar]
- Matei V, Pauley S, Kaing S, Rowitch D, Beisel KW, Morris K, Feng F, Jones K, Lee J, and Fritzsch B (2005). Smaller inner ear sensory epithelia in Neurog 1 null mice are related to earlier hair cell cycle exit. Dev Dyn 234, 633–650. [DOI] [PMC free article] [PubMed] [Google Scholar]
- Moorman AF, Houweling AC, de Boer PA, and Christoffels VM (2001). Sensitive nonradioactive detection of mRNA in tissue sections: novel application of the whole-mount in situ hybridization protocol. J Histochem Cytochem 49, 1–8. [DOI] [PubMed] [Google Scholar]
- Morsli H, Choo D, Ryan A, Johnson R, and Wu DK (1998). Development of the mouse inner ear and origin of its sensory organs. The Journal of neuroscience : the official journal of the Society for Neuroscience 18, 3327–3335. [DOI] [PMC free article] [PubMed] [Google Scholar]
- Oh S, Shin S, and Janknecht R (2012). ETV1, 4 and 5: an oncogenic subfamily of ETS transcription factors. Biochim Biophys Acta 1826, 1–12. [DOI] [PMC free article] [PubMed] [Google Scholar]
- Ornitz DM, and Itoh N (2015). The Fibroblast Growth Factor signaling pathway. Wiley interdisciplinary reviewsDevelopmental biology 4, 215–266. [DOI] [PMC free article] [PubMed] [Google Scholar]
- Patel TD, Kramer I, Kucera J, Niederkofler V, Jessell TM, Arber S, and Snider WD (2003). Peripheral NT3 signaling is required for ETS protein expression and central patterning of proprioceptive sensory afferents. Neuron 38, 403–416. [DOI] [PubMed] [Google Scholar]
- Shim K, Minowada G, Coling DE, and Martin GR (2005). Sprouty2, a mouse deafness gene, regulates cell fate decisions in the auditory sensory epithelium by antagonizing FGF signaling. Dev Cell 8, 553–564. [DOI] [PubMed] [Google Scholar]
- Sosic D, Richardson JA, Yu K, Ornitz DM, and Olson EN (2003). Twist regulates cytokine gene expression through a negative feedback loop that represses NF-kappaB activity. Cell 112, 169–180. [DOI] [PubMed] [Google Scholar]
- Trapnell C, Williams BA, Pertea G, Mortazavi A, Kwan G, van Baren MJ, Salzberg SL, Wold BJ, and Pachter L (2010). Transcript assembly and quantification by RNA-Seq reveals unannotated transcripts and isoform switching during cell differentiation. Nature Biotechnology 28, 511–515. [DOI] [PMC free article] [PubMed] [Google Scholar]
- Wang J, Mark S, Zhang X, Qian D, Yoo S-J, Radde-Gallwitz K, Zhang Y, Lin X, Collazo A, Wynshaw-Boris A, et al. (2005). Regulation of polarized extension and planar cell polarity in the cochlea by the vertebrate PCP pathway. Nature genetics 37, 980–985. [DOI] [PMC free article] [PubMed] [Google Scholar]
- Wang W, Li T, Wang X, Yuan W, Cheng Y, Zhang H, Xu E, Zhang Y, Shi S, Ma D, et al. (2015). FAM19A4 is a novel cytokine ligand of formyl peptide receptor 1 (FPR1) and is able to promote the migration and phagocytosis of macrophages. Cell Mol Immunol 12, 615–624. [DOI] [PMC free article] [PubMed] [Google Scholar]
- Zhang Z, Verheyden JM, Hassell JA, and Sun X (2009). FGF-regulated Etv genes are essential for repressing Shh expression in mouse limb buds. Dev Cell 16, 607–613. [DOI] [PMC free article] [PubMed] [Google Scholar]
Associated Data
This section collects any data citations, data availability statements, or supplementary materials included in this article.


