

Abstract
Mitochondria supply ATP essential for synaptic transmission. Neurons face exceptional challenges in maintaining energy homeostasis at synapses. Regulation of mitochondrial trafficking and anchoring is critical for neurons to meet increased energy consumption during sustained synaptic activity. However, mechanisms recruiting and retaining presynaptic mitochondria in sensing synaptic ATP levels remain elusive. Here we reveal an energy signaling axis that controls presynaptic mitochondrial maintenance. Activity-induced presynaptic energy deficits could be rescued by recruiting mitochondria through AMPK-PAK energy signaling pathway. Synaptic activity induces AMPK activation within axonal compartments and AMPK-PAK signaling triggers phosphorylation of myosin-VI, which drives mitochondrial recruitment and syntaphilin-mediated anchoring on presynaptic F-actin. This pathway maintains presynaptic energy supply and calcium clearance during intensive synaptic activity. Disrupting this signaling crosstalk triggers local energy deficits and [Ca2+]i buildup, leading to impaired synaptic efficacy during trains of stimulation, and reduced recovery from synaptic depression after prolonged synaptic activity. Our study reveals a mechanistic crosstalk between energy sensing and mitochondria anchoring to maintain presynaptic metabolism, thus fine-tuning short-term synaptic plasticity and prolonged synaptic efficacy.
Keywords: AMPK, cytoskeletal switch, energy deficits, energy sensing, F-actin, mitochondrial anchoring, mitochondrial trafficking, myosin VI, PAK, presynaptic mitochondria, synaptic efficacy, synaptic plasticity, syntaphilin
Introduction
Mitochondria are essential for maintaining effective synaptic transmission by sequestering presynaptic Ca2+ and by generating cellular energy in the form of adenosine triphosphate (ATP) through oxidative phosphorylation1–3. ATP consumption supports synapse assembly, drives action and synaptic potentials, and fuels synaptic vesicle (SV) refilling, trafficking and recycling, thus sustaining synaptic transmission4,5. Given that ATP has a limited diffusion capacity in extended long axons4,6, presynaptic mitochondria are ideally suited to support such a high metabolic demand. A brief interruption in local ATP synthesis or the loss of presynaptic mitochondria compromises synaptic transmission7. A 3D-electronic micrographic analysis demonstrated that only ~33% of presynaptic active zones (AZs) in hippocampi retain mitochondria and sustained synaptic activity is restricted within mitochondria-containing synapses during long-term potentiation (LTP)8. Since synapses undergo activity-dependent remodeling, changing mitochondrial distribution is critical to meet presynaptic energy consumption. These studies raise two fundamental questions as to (1) whether increased energy consumption during intensive synaptic activity leads to presynaptic energy deficits, and (2) how mitochondria are recruited to presynaptic terminals as a response to reduced energy availability during sustained synaptic activity. Addressing these questions is relevant to a range of neurological disorders associated with altered mitochondrial trafficking, energy deficits, and impaired synaptic function9.
Axonal mitochondrial trafficking and anchoring rely on microtubules (MTs) and filamentous actin (F-actin), the latter being highly enriched at synapses10. While MT-based kinesin and dynein motors drive long-range mitochondrial transport along axons, actin-based myosin motors mediate local movement and anchoring11–14. Mitochondria trafficking can be regulated in response to changes in synaptic activity via Miro-Ca2+ sensing mechanism2,3,15–17. Our previous studies demonstrate that syntaphilin (SNPH) acts a ‘static anchor’ for axonal mitochondria18. SNPH targets to and arrests axonal mitochondrial transport. Deleting snph robustly enhances axonal mitochondrial motility in vitro and in vivo19 and impairs mitochondria positioning at active synapses20. In addition, F-actin is also critical for retaining mitochondria at presynaptic terminals21. These studies prompted us to address three fundamental questions as whether (1) axonal mitochondria are recruited to and anchored at presynaptic terminals through a motor-driven switch from MT-based docking to actin-based anchoring, (2) presynaptic mitochondrial capture is regulated by an energetic signaling cascade in sensing local energy deficits, and (3) this energy sensing ensures mitochondria become captured at synapses in response to intensive synaptic activity. Investigation into the energy signaling regulation of presynaptic mitochondrial maintenance and thus synaptic efficacy is an important emerging frontier.
Here we reveal an energy signaling axis that maintains presynaptic energy supply to sustain synaptic activity. AMP-activated protein kinase (AMPK) serves as an energy stress sensor that is activated when intracellular ATP becomes depleted or ATP consumption is elevated22. P21-activated kinases (PAKs) play an important role in the regulation of cytoskeleton dynamics and synaptic plasticity23,24. Interestingly, PAKs have also been identified as a substrate of the AMPK signaling cascade25. We demonstrate that activity-induced presynaptic energy deficit is rescued by recruiting mitochondria through energy sensing AMPK-PAK pathway. This signaling axis plays a critical role in the recruitment and maintenance of presynaptic mitochondria as a response to energy stress induced by intensive synaptic activity. Axonal mitochondria are captured at presynaptic terminals via an interplay between myosin VI (myo6) and SNPH. Activity-triggered presynaptic energy stress activates the AMPK-PAK signaling that induces myo6 phosphorylation, a process required for facilitating mitochondrial recruitment. Disrupting the AMPK-PAK signaling or interfering with the myo6-SNPH interplay reduces both presynaptic ATP availability and Ca2+ clearance capacity during intensive synaptic activity, leading to impaired synaptic efficacy. Our results suggest an energy-sensitive regulation of mitochondrial trafficking and presynaptic positioning, thus fine-tuning short-term synaptic plasticity and maintaining prolonged synaptic efficacy.
Results
Rescuing Activity-induced Presynaptic Energy Deficit by Recruiting Mitochondria
We first thought to address whether presynaptic mitochondria play a major role in the maintenance of energy supply during sustained synaptic activity. ATP diffused from axonal mitochondria may support basal or short-term synaptic transmission26. We hypothesized that presynaptic mitochondria may serve as local power stations that can supply ATP to sustain prolonged synaptic efficacy. To test this, we performed two live imaging experiments. First, we assessed presynaptic ATP levels using genetically encoded FRET (Förster resonance energy transfer)-based presynaptic ATP probe Synaptophysin-GoATeam2 (Syn-GoAT2). Sustained synaptic activity was induced by γ-aminobutyric acid type A (GABAA) receptor antagonist Picrotoxin (PTX). Time-lapse imaging of cortical neurons at 14 days in vitro (DIV14) demonstrated that synaptic activity induced by 100 μM PTX is sufficient to reduce the relative intensity ratio of Syn-GoAT2 OFP (ATP-bound) to GFP (ATP-free) starting at 30 min, indicating the depletion of presynaptic ATP (Fig. 1a,b). As a negative control, we also applied Syn-GoAT3, a Syn-GoAT2 (R/K) mutant that does not respond to ATP levels27. In contrast to Syn-GoAT2, ATP-insensitive variant Syn-GoAT3 did not respond to synaptic activation (P = 0.0003), thus supporting our hypothesis that PTX-induced synaptic activity for 30 min is sufficient to induce presynaptic energy deficits.
Fig. 1. Activity-induced Presynaptic Energy Deficit Is Rescued by Recruiting Mitochondria via AMPK Signaling.

a,b, Synaptic activity reduces presynaptic ATP levels. Cortical neurons were transfected with presynaptic ATP probe Syn-GoAT2 or ATP-insensitive Syn-GoAT3 at DIV7, followed by live imaging at DIV14 (45 frames, 2-min intervals, total 90 min). PTX was added (100 μM) before the start of the first frame. The OFP/GFP ratio reflects presynaptic ATP availability. Two-way ANOVA showed a main effect of Syn-GoAT2 vs Syn-GoAT3 over time (F1, 20 = 18.54, P = 0.0003). c,d, Recruiting mitochondria reverses presynaptic ATP deficits. Neurons were co-transfected with Syn-GoAT2 and mito-BFP at DIV7, followed by live imaging at DIV14 (15 frames, 2-min intervals, total 30 min). White circles refer to presynaptic boutons. e,f, AMPK is activated within axons by synaptic activity. Neurons were transfected with AMPK activation biosensor AMPKAR-EV at DIV7, followed by live imaging at DIV14 (20 frames, 2-min intervals, total 40 min). CaMKK2 inhibitor STO-609 (10 μM) and/or PTX (100 μM) was added to the imaging chamber before the start of the first frame. The YFP/CFP ratio reflects AMPK activity, which was normalized to same time points without PTX treatment. g,h, AMPK is activated by synaptic activity. Neurons at DIV14 were treated with DMSO (ctrl), AMPK activator AICAR (1 mM), PTX (100 μM), or PTX+AMPK inhibitor compound C (CC) (10 μM) for 2 hr. Cell lysates (5 μg) were immunoblotted with antibodies as indicated. The intensity of pACC-1 or pAMPKα was calibrated with total ACC-1 or AMPKα, and normalized to DMSO. N=3 independent experiments. i, Kymograph showing presynaptic mitochondrial recruitment upon AMPK activation. Neurons were co-transfected with GFP-synapsin and DsRed-Mito at DIV7–8, followed by dual-channel live imaging at DIV14 (360 frames, 10-sec intervals, 60 min). AICAR (1 mM) was added to the imaging chamber before the start of the first frame. White arrows point at mobile mitochondria that are captured at presynaptic terminals (yellow vertical lines). j,k, Images (j) and analyses (k) showing activity-induced presynaptic mitochondrial recruitment through AMPK signaling. Neurons were transfected with AMPK-WT or AMPK-KD, followed by treatment with DMSO, PTX (100 μM), AICAR (1 mM), CC (10 μM) or STO-609 (10 μM) for 2 hr at DIV14. The co-localized pixels of mitochondria (TOM20) and presynaptic terminals (SV2) are highlighted in the black-white images. Data were quantified from the total number of neurons indicated in the parentheses (b,d,f,k), presented as box plots (min, max, median, 25th and 75th percentiles) with dots as individual values (d) or mean ± SEM with dots as individual values (b,f,h,k), and analyzed by two-way ANOVA (b,f) followed by Fisher’s LSD test (f), two-sided Mann-Whitney (d), or one-way ANOVA followed by two-sided Tukey’s multiple comparisons (h,k). Scale bars: 5 μm (c,i); 10 μm (a,e,j). * P < 0.05.
Next, we investigated whether recruiting mitochondria can rescue presynaptic energy deficits during sustained synaptic activity. ATP levels at individual presynaptic boutons were analyzed using Syn-GoAT2 before and after recruiting mitochondria during 30-min PTX treatment. Presynaptic boutons that failed to recruit mitochondria displayed reduced presynaptic ATP (P < 0.001) (Fig. 1c,d). Such activity-induced energy deficits can be reversed by recruiting mitochondria to presynaptic terminals (P < 0.001). Altogether, these live imaging data support our first conclusion: recruiting mitochondria to presynaptic terminals is able to reverse activity-induced energy deficits. Although ATP is dispersed along axons and diffused to presynaptic boutons26, local ATP supply by presynaptic mitochondria is critical to maintain energy homeostasis during sustained synaptic activity.
Synaptic Activity Facilitates Mitochondrial Recruitment via the AMPK Signaling
Given that sustained synaptic activity leads to presynaptic energy deficits, we next investigate whether synaptic activity induces the recruitment of axonal mitochondria to presynaptic terminals through an energy-sensing mechanism that has not been elucidated3,15–17,28,28. AMPK is a key cellular energy stress sensor composed of three subunits: one catalytic α subunit and two regulatory β and γ subunits; the latter contains adenine-nucleotide-binding sites that allow the sensing of adenosine monophosphate (AMP), adenosine diphosphate (ADP), and ATP. Recent bioenergetic studies suggested that high frequency stimulation (HFS) can activate AMPK signaling that is essential for sustaining LTP29,30. These studies allow us to propose a working model: elevated energy consumption and reduced energy availability at presynaptic terminals activates AMPK signaling, thereby recruiting presynaptic mitochondria in response to enhanced synaptic activity.
We performed six lines of experiments to test this working model. First, we examined the time-course of axonal AMPK activation by applying a highly sensitive AMPK activation biosensor (AMPKAR-EV)31 upon PTX-induced synaptic activity from 0 to 40 min. Time-lapse imaging of cortical neurons at DIV14 show that the relative intensity ratio of YFP/CFP, that reflects AMPK activity, increased in the axonal compartment starting at 10 min upon PTX treatment (Fig. 1e,f). These data suggest that sustaining synaptic activity for 10 min is sufficient to activate the AMPK signaling within axonal compartments. Second, we examined whether AMPK is activated by Ca2+/calmodulin-dependent protein kinase kinase beta (CaMKK2) in response to elevated Ca2+ levels during synaptic activity. Neurons were treated with PTX (100 μM) and STO-609 (10 μM), a CaMKK2-specific inhibitor that blocks Ca2+-induced AMPK activation30,32. STO-609 treatment delayed activity-induced AMPK activation for ~10 min (P < 0.05) and this delay was abolished at 30 min (Fig. 1e,f). The maximal axonal AMPK activation was not affected by blocking CaMKK2. Thus, while Ca2+-CaMKK2 plays an early role in the AMPK signaling32,33, energy sensing may play a primary role in activating AMPK during sustained synaptic activity that triggers presynaptic energy deficits.
Energetic stress or ATP depletion activates AMPK by phosphorylation on threonine-172 within its α subunit22. We next asked whether sustained synaptic activity induces this phosphorylation event at AMPK-Thr172. As a downstream indicator for AMPK activation, we also measured the phosphorylation of acetyl-CoA carboxylase-1 (ACC-1)-Ser79, a direct substrate of AMPK34. Immunoblotting analysis with phospho-specific antibodies demonstrated a significant increase of phospho-AMPK-Thr172 (P < 0.05) and phospho-ACC-1-Ser79 (P < 0.01) following PTX (100 μM, 2 hr) treatment in neurons (Fig. 1g,h). This AMPK signaling activation is comparable to neurons treated with 5-aminoimidazole-4-carboxamide ribonucleotide (AICAR 1 mM, 2 hr), an analog of AMP that stimulates AMPK activation35. PTX-induced phosphorylation of AMPK-Thr172 (P < 0.05) and ACC-1-Ser79 (P < 0.01) was abolished by AMPK inhibitor compound c (CC) (10 μM, 2 hr). We further repeated this phosphorylation assay by treating cortical neurons with PTX for 0, 30, 60 or 120 min, followed by immunoblotting of AMPK-Thr172 and ACC-1-Ser79. PTX treatment for 30 min was sufficient to activate AMPK signaling (Extended Data Fig. 1a–c). These studies indicate that neuronal AMPK signaling is activated by PTX-induced synaptic activity starting at 10 min in live imaging or 30 min by biochemical detection.
Next, we examined whether presynaptic mitochondrial capture can be facilitated by activating the AMPK signaling. Cortical neurons were transfected with GFP-synapsin (a presynaptic marker) and DsRed-Mito (a mitochondrial marker) at DIV7–8, followed by dual-channel live imaging at DIV14 upon the addition of AICAR. Mitochondria were recruitment to presynaptic bouton as early as 20 min upon AMPK activation (Fig. 1i). We further confirmed this by co-immunostaining SV2 and TOM20 in fixed cortical neurons. Neurons treated with either AICAR (1 mM, 2 hr) or PTX (100 μM, 2 hr), or overexpressing AMPK exhibited similar increases in the percentage of presynaptic terminals co-localized with mitochondria relative DMSO control (DMSO: 48.10 ± 2.14%; AICAR: 76.39 ± 1.63%, P < 0.001; PTX: 74.35 ± 1.94%, P < 0.001; AMPK-WT: 67.08% ± 2.16%; P < 0.001) (Fig. 1j,k). Conversely, co-treatment of neurons with PTX and AMPK inhibitor CC or expressing AMPK-KD (kinase-dead) mutant abolished activity-induced mitochondrial recruitment (DMSO: 48.10 ± 2.14%; PTX + CC: 40.31% ± 1.51%, P = 0.0669; PTX + AMPK-KD: 48.20% ± 2.02%, P > 0.99). In addition, co-treatment of neurons with PTX and CaMKK2 inhibitor STO-609 did not affect activity-induced mitochondrial recruitment (PTX: 74.35 ± 1.94%; PTX + STO-609: 73.50% ± 1.87%, P > 0.99), supporting the notion that presynaptic mitochondrial recruitment is activated mainly through the energy-sensing pathway under sustained synaptic activity. Kinase activity of WT and kinase-dead AMPK mutant were validated in neurons by measuring phospho-ACC-1-Ser79 (pACC-1). Expressing AMPK-WT (P = 0.028), but not AMPK-KD (P > 0.05), activated AMPK signaling upon synaptic activity (Extended Data Fig. 1d,e). AMPK-KD is an AMPKα1 mutant (K47R) that plays a dominant negative effect by competing with endogenous AMPKα1 for binding two regulatory subunits (Fig. 1j)36. However, when cell lysates were used for immunoblotting (Extended Data Fig. 1d,e), such a dominant negative effect was diluted by un-transfected neurons in culture. We further demonstrated no detectable effect of PTX or AICAR on the density of presynaptic terminals nor on the mitochondria membrane potential (Δψm) (Extended Data Fig. 2a–d). These results support our second conclusion: activity-induced presynaptic energy deficit is rescued by recruiting mitochondria through the AMPK signaling.
Myo6 and SNPH Are Essential for Capturing Mitochondria on Presynaptic F-actin
We hypothesized that axonal mitochondria are captured at presynaptic terminals via the MT-actin crosstalk that coordinates recruiting and anchoring by actin-based motors and anchors37,38. We first examined whether there is an interplay between actin-based motors and mitochondria anchoring protein SNPH. Myo6 drives minus-end-directed cargo transport along polarized actin tracks and was also found in synapses in hippocampal neurons39. Loss of myo6 impairs presynaptic function and LTP40. In addition, myo6 opposes MT-based axonal mitochondrial transport41. These studies raise the question of whether myo6 recruits and captures mitochondria at presynaptic F-actin through interacting with SNPH. We performed multiple lines of imaging analyses to address this issue.
First, we examined presynaptic mitochondria in cortical neurons following myo6 knockdown. Neurons were infected with scramble shRNA (scr-shRNA), mouse myo6-targeted shRNA (myo6-shRNA), or myo6-shRNA combined with expression of human myo6 that is resistant to mouse myo6-shRNA (Extended Data Fig. 3a–d), thus serving to rescue the knockdown phenotype. Depleting myo6 significantly reduced the percentage of presynapses co-localized with mitochondria (37.35 ± 1.89%, P < 0.001) compared to scr-shRNA control neurons (52.57 ± 2.39%). Co-expressing human myo6 rescued the phenotype (59.15 ± 2.14%, P > 0.05) (Fig. 2a,b). We demonstrated no detectable effect of myo6 knockdown on the density and size of axonal mitochondria and the density of presynaptic terminals (Extended Data Fig. 3e,f). Second, we asked whether myo6-driven mitochondrial recruitment depends on SNPH by examining wild-type (WT) and snph knockout (KO) cortical neurons. Overexpressing myo6 increased the percentage of presynapses co-localized with mitochondria in WT neurons (Flag: 45.77 ± 2.03%; Flag-myo6: 66.34 ± 1.66%, P < 0.001) (Fig. 2c,d). However, this effect was abolished in snph KO neurons (Flag: 29.43 ± 1.73%; Flag-myo6: 29.35 ± 1.76%, P > 0.99). Consistently, overexpressing myo6 significantly reduced axonal mitochondrial motility in WT neurons (Flag: 35.91 ± 1.52%; Flag-myo6: 14.27 ± 1.41%, P < 0.001), but not in snph KO neurons (Flag: 79.24 ± 1.54%; Flag-myo6: 79.04 ± 1.72%, P > 0.05) (Fig. 2e,f). Depleting myo6 did not display an additive effect to the already-decreased mitochondria capture at presynaptic terminals in snph KO neurons (snph KO + scr-shRNA: 27.82% ± 1.42%; snph KO + myo6-shRNA: 28.66% ± 1.47%, P > 0.05) (Extended Data Fig. 3g,h). Thus, myo6-driven recruitment and SNPH-mediated anchoring act synergistically to capture axonal mitochondria at presynaptic terminals.
Fig. 2. Myo6 Recruits Presynaptic Mitochondria in Response to Synaptic Activity.

a,b, Images (a) and analyses (b) showing reduced presynaptic mitochondria upon knockdown of myo6. Cortical neurons at DIV4 were infected with scr-shRNA, mouse myo6-shRNA, or together with human myo6, followed by co-immunostaining at DIV14. The co-localized pixels are highlighted in the black-white images. c,d, Images (c) and analyses (d) showing myo6-driven presynaptic mitochondrial recruitment in the presence of SNPH. WT and snph KO cortical neurons at DIV7 were infected with Flag or Flag-myo6, followed by co-immunostaining at DIV14. e,f, Kymographs (e) and analyses (f) showing declined motility of axonal mitochondria by expressing myo6 in WT but not in snph KO neurons. Cortical neurons at DIV7 were co-transfected with DsRed-Mito and Flag or Flag-myo6, followed by time-lapse imaging at DIV14. g,h, Images (g) and analyses (h) showing that SNPH is required for presynaptic mitochondrial anchoring on F-actin. WT and snph KO cortical neurons at DIV14 were treated with DMSO or LatB (2 μM) for 3 hr, followed by co-immunostaining. i,j, Kymograph (i) and analyses (j) showing enhanced motility of axonal mitochondria upon disruption of F-actin. Axonal mitochondrial motility in cortical neurons at DIV14 was assessed before and after LatB treatment (2 μM) for 3 hr. k,l, Kymographs (k) and analyses (l) showing activity-induced mitochondrial recruitment through the AMPK-myo6-SNPH-actin axis. snph KO cortical neurons at DIV14 were treated with DMSO, AICAR (1 mM), PTX (100 μM) for 2 hr (k, upper panels); WT cortical neurons at DIV7 were infected with myo6-shRNA, followed by treatment with DMSO, AICAR (1 mM) or PTX (100 μM) for 2 hr at DIV14 (k, middle panels); or WT cortical neurons at DIV14 were treated with LatB (2 μM) for 3 hr (k, lower panels), followed by treatment with DMSO, AICAR (1 mM) or PTX (100 μM) for 2 hr. Following these treatments, neurons were co-immunostained at DIV14. The co-localized pixels were highlighted in the black-white images. The percentage of presynaptic terminals co-localized with mitochondria was assessed within four neuronal groups as indicated above bar graphs (WT, snph KO, myo6-shRNA, and LatB), and separately compared with DMSO condition within each groups (l). Data were quantified from total number of neurons (n) indicated within bars (b,l) or in the parentheses (d,f,h,j), where v represents total number of presynaptic terminals (d,h) or mitochondria (f,j); expressed as mean ± SEM with dots as individual values; and analyzed by one-way ANOVA with post hoc testing by Dunnett’s (b) or two-sided Tukey’s (d,f,h,j,l) multiple comparisons test. Scale bars: 10 μm. *** denotes P < 0.001. p values above blue bars (l) represents the baseline comparison with WT DMSO.
We further examined whether F-actin participates in SNPH-mediated mitochondrial anchoring at presynaptic terminals. First, we assessed actin filaments in WT and snph KO cortical neurons at DIV14 before and after treatment with Latrunculin B (LatB) (2 μM, 3 hr), a widely used reagent that depolymerizes F-actin42. Using both Airyscan confocal microscopy and stimulated emission and depletion (STED) nanoscopy, we observed reduced F-actin upon LatB treatment without impacting neuronal morphology, axonal MTs or presynaptic terminals (Extended Data Fig. 4a,b). We also examined mitochondrial Δψm following LatB treatment by loading fixable Δψm-dependent dye MitoTracker CMTMRos (CMTMRos). LatB did not induce mitochondrial depolarization in axons, whereas treating neurons with Δψm uncoupler carbonyl cyanide 3-cholorophenylhydrazone (CCCP) (10 μM, 30 min) depolarized mitochondria (Extended Data Fig. 4c,d). We further demonstrated no detectable effect of LatB on the average density of presynaptic terminals in both live and fixed neurons, nor any effect on the density or size of axonal mitochondria (Extended Data Fig. 4e–g). Altogether, LatB treatment selectively depolymerizes actin filaments without changing presynaptic terminals or axonal mitochondria in mature neurons.
Next, we performed time-lapse imaging to examine whether F-actin is required for capturing mitochondria at presynaptic terminals. Cortical neurons were co-transfected with GFP-synapsin and DsRed-Mito at DIV7–8, followed by dual-channel live imaging at DIV14 before (0–15 min time-lapse) and after (15–75 min time-lapse) LatB treatment (10 μM). Kymograph analysis displayed a striking phenotype: upon F-actin depolymerization, presynaptic mitochondria were released into axons as early as 20 min of LatB treatment (Extended Data Fig. 5a–c). After 60 min of LatB treatment, the percentage of presynapses capturing mitochondria was reduced from 36.34 ± 2.62% to 24.31 ± 2.05% (P < 0.001). By co-immunostaining SV2 and TOM20 (an outer mitochondrial membrane protein, OMM), we demonstrated that LatB treatment (2 μM for 3 hr) in WT neurons significantly reduced the percentage of presynapses co-localized with mitochondria (36.78 ± 1.72%, P < 0.001) compared to DMSO control (50.35 ± 1.93%) (Fig. 2g,h). Interestingly, deleting snph reduced mitochondrial capture at presynaptic terminals under DMSO conditions (35.72 ± 1.90%, P < 0.001) similarly to LatB-treated WT neurons. LatB treatment in snph KO neurons did not further reduce presynaptic mitochondria. We confirmed these light images with transmission electron microscopy (TEM) and found a similar reduction in mitochondrial positioning at presynaptic AZs upon F-actin disruption (Extended Data Fig. 5d,e). Depolymerizing actin filaments or deleting snph similarly enhanced axonal mitochondrial motility (WT-DMSO: 33.90 ± 1.57%; WT-LatB: 63.18 ± 1.82%, P < 0.001; KO-DMSO: 72.92 ± 2.28%, P < 0.001) (Fig. 2i,j). LatB treatment in snph KO neurons failed to further reduce mitochondrial capture at presynaptic terminals (P = 0.8873) and increase axonal mitochondrial motility (P = 0.9869). Thus, our live imaging analyses combined with TEM ultrastructural observations support the notion that both F-actin and SNPH are required for capturing presynaptic mitochondria.
Furthermore, we determined whether activity-induced recruitment of presynaptic mitochondria is coordinated by combined action of AMPK, myo6, F-actin and SNPH. Neurons with snph KO, myo6 depletion, or LatB-treatment were incubated with AICAR (1 mM, 2 hr) or PTX (100 μM, 2 hr). While WT neurons exhibited a robust presynaptic mitochondrial capture upon AICAR or PTX treatment (Fig. 1j), this phenotype was abolished in snph KO neurons (DMSO: 38.14 ± 2.75%; AICAR: 39.78 ± 1.63%, P > 0.99; PTX: 43.19 ± 1.86%, P = 0.8422), in myo6 knockdown neurons (DMSO: 38.30 ± 2.30%; AICAR: 33.02 ± 1.62%, P = 0.8008; PTX: 40.90 ± 1.45%, P = 0.9989), and in LatB-treated neurons (DMSO 35.74 ± 3.07%; AICAR: 40.00 ± 2.26%, P = 0.9642; PTX: 42.20 ± 1.55%, P = 0.5828) (Fig. 2k,l). Thus, these data support our third conclusion: axonal mitochondria can be recruited to and captured at presynaptic terminals in response to sustained synaptic activity via a coordinated action of AMPK signaling, myo6 motor, F-actin, and SNPH anchor.
Myo6-SNPH Interplay Switches Mitochondrial Anchoring from MTs to F-actin
To understand mechanisms underlying myo6-driven recruitment and SNPH-mediated anchoring of presynaptic mitochondria, we performed four lines of biochemical experiments. First, we examined whether myo6 interacts with SNPH in mouse brains. An anti-myo6 antibody or anti-SNPH antibody reciprocally immunoprecipitated SNPH or myo6 from WT, but not snph KO, mouse brain homogenates (Fig. 3a,b). Second, the myo6-SNPH complex was confirmed by a pull-down assay: GST-SNPH (1–469), but not GST, pulls down myo6 from mouse brain homogenates (Fig. 3c). Third, endogenous myo6 was pulled down by GST-tagged SNPH (1–469) or (1–203) domain, but not by truncated SNPH lacking its N-terminal region, suggesting that SNPH interacts with myo6 through its N-terminal domain (Fig. 3d,e). Furthermore, we generated two truncated myo6 mutants: myo6-(1–980) that contains the motor domain but lacks the cargo binding domain (CBD), and myo6-(980–1286) that retains only the CBD43 (Fig. 3f). Pull-down analysis demonstrated that myo6-CBD is sufficient to bind to SNPH (Fig. 3g).
Fig. 3. Myo6 Mediates SNPH Anchoring on F-actin.

a,b, Representative immunoprecipitation assays showing SNPH-myo6 complex in mouse brains. An antibody against myo6 (a) or SNPH (b) reciprocally immunoprecipitated SNPH or myo6 from WT mouse brain homogenates (BH) but failed to detect myo6-SNPH complex from snph KO mouse BH. c, Representative pull-down assay confirming myo6-SNPH complex. GST-SNPH (1–469) or GST was incubated with mouse BH at 4°C overnight, followed by immunoblotting with myo6. Coomassie blue staining reflects the purity of GST and GST-SNPH in pull-down. d,e, Schematic SNPH domain structures and truncated forms (d) and representative pull-down assay (e) showing the binding of myo6 to N-terminal region (1–203) of SNPH. GST or GST-SNPH truncated mutants were incubated with HEK293 cell lysates at 4°C for 3 hr, followed by immunoblotting of myo6. Coomassie blue staining reflects the purity of truncated GST-SNPH. MTB: microtubule binding domain; KBD: kinesin binding domain. f,g, Schematic myo6 domains and truncated forms (f) and pull-down assay (g) showing that myo6-CBD is sufficient to bind SNPH. Flag-tagged myo6 or its truncated forms were expressed in HEK293 cells. The cell lysates were incubated with GST or GST-SNPH (1–469) at 4°C for 3 hr. h, Representative actin spin-down assay showing no direct interaction between SNPH and F-actin. GST, GST-SNPH (1–469) or actinin was incubated for 30 min in the absence or presence of F-actin, followed by ultracentrifugation. The supernatant (S) and pellets (P) were analyzed by SDS-PAGE and Coomassie blue staining. Yellow box indicates sedimented F-actin; green box shows actinin co-sedimented with F-actin; red box indicates GST-SNPH (1–469) that mainly remained in the supernatant. i-l, Representative PLA (I,k) and analyses (j,l) showing in situ close proximity of SNPH and F-actin (i,j) in the presence of myo6, or increased in situ close proximity of SNPH and MTs upon depletion of myo6 (k,l). PLA was performed in cortical neurons expressing scr or myo6-shRNA. Axons were labeled by βIII-tubulin. The number of PLA signal puncta per cell (j) or per 100 μm2 (l) was quantified and normalized by neurons expressing scr-shRNA. Note that close proximity of SNPH with F-actin vs MTs in axons is reciprocally regulated by myo6. Data were collected from a total number of neurons indicated under bars in three experiments, expressed as mean ± SEM, and analyzed by two-sided Kruskal-Wallis test with post hoc testing by Dunn’s multiple comparisons test (j) or two-sided unpaired Student’s t-test (l). Scale bars: 20 μm.
To address whether the myo6-SNPH interplay mediates cytoskeletal switch of mitochondrial anchoring from MTs to actin filaments, we performed actin spin-down assays44 to determine the direct interaction of SNPH with actin filaments. Purified GST, GST-SNPH (1–469), a C-terminal tail-deleted SNPH with loss of mitochondrial targeting, or actinin, an actin-binding protein serving as a positive control45, was incubated for 30 min in the absence or presence of F-actin. While the majority of actinin was spun down with F-actin in the pellet (Fig. 3h), GST-SNPH (1–469) mainly remained in the supernatant after ultracentrifugation, suggesting no direct interaction between SNPH and F-actin. We next examined whether myo6 mediates anchoring of SNPH on actin by proximity ligation assay (PLA), which utilizes specific antibodies for in situ detection of SNPH and actin based on their close proximity to each other46. PLA signals were readily detected in cortical neurons. However, depleting myo6 with myo6-shRNA reduced PLA signals (P < 0.001), while deleting snph abolished PLA signals (Fig. 3i,j). These PLA data suggest that close in situ proximity of SNPH and actin in neurons is mediated by actin-based myo6. As controls, knockdown of myo6 or deletion of SNPH did not alter global morphology of F-actin or MTs in axonal compartments (Extended Data Fig. 6a,b). We alternatively performed PLA by applying antibodies against SNPH and βIII-tubulin. Knockdown of myo6 enhanced PLA signals reflecting close proximity of SNPH and MTs (P < 0.001) (Fig. 3k,l), thus providing evidence of close proximity of SNPH with F-actin or MTs in axons is reciprocally regulated by myo6. Altogether, these data support our fourth conclusion: myo6-SNPH interplay mediates the switch of mitochondrial anchoring platform from MTs to F-actin.
SNPH Serves As an Adaptor Recruiting Myo6 to Axonal Mitochondria
Myo6 distributes on the plasma membrane and the cytosol and its association with endosomes, Golgi-derived vesicles, and autophagosomes is mediated by specific adaptors43,47. SNPH is distributed on the surface of axonal mitochondria18,48. Identification of a SNPH-myo6 interaction raises a question as to whether SNPH serves as an adaptor that recruits myo6 to axonal mitochondria. To address this, we examined localization of myo6 in axons of mature cortical neurons at DIV14. Confocal images and line scan analysis showed co-localization of myo6 with axonal mitochondria labeled by cytochrome c (cyto c) (Fig. 4a,b). STED super-resolution imaging further deciphered myo6 sub-mitochondrial distribution: myo6 displayed a pattern distinct from the cyto c-labeled inner mitochondrial membrane and intermembrane space (Fig. 4c). Instead, myo6 perfectly co-localized with SNPH by forming structures that surround the mitochondrial shape (Fig. 4d), and formed punctate structures on the OMM labeled with TOM20 (Fig. 4e). This mitochondria-targeted pattern was abolished in snph KO cortical neurons (Fig. 4f), where myo6 was dispensed along axons. We further characterized co-localization of myo6 with axonal mitochondria using confocal microscopy. Both Pearson’s coefficient (P < 0.001) and Mander’s coefficient (P < 0.001) consistently showed a significant reduction in myo6 targeting to axonal mitochondria in snph KO neurons when compared to WT neurons (Fig. 4g,h), thus suggesting SNPH as an adaptor recruiting myo6 to axonal mitochondria.
Fig. 4. SNPH Serves As an Adaptor Recruiting Myo6 to Axonal Mitochondria.

a,b, Representative confocal images (a) and line scan analysis (b) showing axonal mitochondrial targeting of myo6. Cortical neurons at DIV14 were co-immunostained with cytochrome c (cyto c) and myo6. (a’) Enlarged views of the boxed region in a. Line scan analysis of the boxed region reveals co-localization of myo6 and mitochondria along axons (b). c,d, Representative STED images and line scan analyses showing the distinct distribution of myo6 from the inner membrane protein cyto c (c) and co-localization of myo6 and SNPH along the surface of axonal mitochondria (d). e,f, Representative STED images and line scan analyses showing that myo6 targeting to axonal mitochondria is dependent on SNPH. WT and snph KO cortical neurons at DIV14 were co-immunostained with myo6 and OMM protein TOM20. g,h, Confocal images (g) and coefficient analyses (h) showing the co-localization of myo6 and axonal mitochondria in the presence of SNPH. WT and snph KO neurons were co-immunostained with myo6 and cyto c. Pearson’s and Mander’s coefficient (percentage of myo6 signals co-localized with cyto c) revealed a reduced percentage of myo6 signals co-localized with mitochondria in snph KO neurons. i,j, Schematic myo6 domain structures and cargo-binding domain (CBD) mutants and their SNPH-binding capacity in pull-down assays (j). GFP-myo6 or its mutants were expressed in HEK293 cells. The cell lysates were incubated with GST or GST-SNPH (1–469) at 4°C for 3 hr. The protein complexes were immunoblotted with an anti-GFP antibody. k,l, Representative images (k) and analyses (l) showing that defective SNPH-binding mutants of myo6 lost their mitochondrial targeting. Cortical neurons at DIV7 were transfected with GFP-tagged myo6, myo6-CBD, myo6-RRL-AAA, or myo6-WWY-WLY, followed by immunostaining at DIV14. Mander’s coefficient reflects the percentage of GFP-myo6 signals (or its mutants) co-localized with TOM20. m,n, Representative images (m) and analyses (n) showing that myo6-driven presynaptic mitochondrial recruitment is through its interaction with SNPH. WT neurons at DIV7 were transfected with Flag or Flag-tagged myo6, or myo6-WWY-WLY or myo6-RRL-AAA, followed by co-immunostaining at DIV14. The co-localized pixels are highlighted in the black-white images. Data were collected from the total number of neurons indicated within bars (h,l,n), expressed as mean ± SEM with dots as individual values, and analyzed by two-sided unpaired Student’s t-test (h), two-sided Kruskal-Wallis test with post hoc testing by Dunn’s multiple comparisons test (l), or one-way ANOVA with post hoc testing by Dunnett’s multiple comparisons test (n). Scale bars: 1 μm (c,d,e,f) and 10 μm (a,g,k,m).
Given that myo6 interacts with SNPH via its C-terminal CBD (Fig. 3g), we next determined whether the CBD is required for recruiting myo6 to axonal mitochondria. We replaced three residues within two cargo-binding interface motifs RRL-AAA or WWY-WLY at the CBD of myo649 (Fig. 4i) and found that both mutants lost their binding capacity to SNPH (Fig. 4j). While myo6 and myo6-CBD mainly appeared as vesicular structures targeting axonal mitochondria, myo6-RRL-AAA and myo6-WWY-WLY mutants displayed a diffuse pattern throughout the axon (Fig. 4k,l), further supporting that myo6 is recruited onto axonal mitochondria through its interaction with SNPH. In addition, we expressed myo6-WWY-WLY and myo6-RRL-AAA in cortical neurons to confirm the role of myo6-SNPH interaction in anchoring presynaptic mitochondria. While overexpressing myo6 increased the percentage of presynaptic terminals co-localized with mitochondria in WT neurons (Flag: 45.77 ± 2.03%; Flag-myo6: 66.34 ± 1.66%, P < 0.001), expressing either myo6-WWY-WLY or myo6-RRL-AAA mutant failed to increase the percentage of presynaptic terminals co-localized with mitochondria (Fig. 4m,n). Altogether, these results support our fifth conclusion that myo6-SNPH interplay is essential for recruiting myo6 to axonal mitochondria and ultimately capturing mitochondria at presynaptic terminals.
AMPK-PAK Signaling Facilitates Mitochondrial Capture by Phosphorylation of Myo6
PAKs are a family of serine/threonine kinases that play a central role in signaling cascades remodeling the cytoskeleton and scaffolding, and supporting synaptic transmission23,24,50. Interestingly, group I PAKs (PAK1/2/3) have been identified as substrates of AMPK25, and PAK2 mediates cell metabolism and survival by interacting with AMPK51. PAKs phosphorylates the motor domain of myo6, a process required for recruiting myo6 to actin-rich membrane ruffles52,53. Deleting Pak3 in mice leads to deficiencies in LTP, learning, and memory24; while deletion of both Pak1 and Pak3 leads to an even stronger defect in synaptic function54. Thus, the AMPK-PAK signaling is an attractive candidate for our investigations into mechanisms underlying energy-responsive recruitment of presynaptic mitochondria. First, we asked whether sustained synaptic activity induces PAK phosphorylation by AMPK. Cortical neurons at DIV14 were treated with DMSO, PTX (100 μM, 2 hr), or AMPK activator AICAR (1 mM, 2 hr), or PTX together with AMPK inhibitor CC (10 μM, 2 hr). Phospho-PAK1/2/3 were significantly increased upon synaptic activity (P < 0.05) or AMPK activation (P < 0.05); such elevated phospho-PAK1/2/3 level was abolished by inhibiting AMPK with CC (Fig. 5a,b). Second, we examined whether activated PAK is able to phosphorylate myo6 at T405, the main myo6 phosphorylation site by group I PAKs52,53. We selected truncated myo6 mutants containing 100-residue (355–454) as phosphorylation substrate and co-expressed neurons with myo6(355–454) or phospho-dead mutant myo6(355–454)-T405A together with PAK3-T421E, a constitutively active (CA) PAK3, or PAK3-K297L, a kinase-dead (KD) mutant. Band shift analysis with phospho-tag gels revealed detectable phosphorylation status when myo6(355–454) was co-expressed with PAK3-CA but not with PAK3-KD (Fig. 5c). This myo6 phosphorylation was inhibited when co-expressing myo6(355–454)-T405A mutant. These results provide a mechanistic link between AMPK-PAK energy signaling and myo6-SNPH anchoring through myo6 phosphorylation at T405.
Fig. 5. AMPK-PAK Signaling Facilitates Presynaptic Mitochondrial Capture through Myo6 Phosphorylation.

a,b, AMPK activation triggers PAK phosphorylation in neurons. Cortical neurons at DIV14 were treated with DMSO, PTX (100 μM), AMPK activator AICAR (1 mM), or PTX together with AMPK inhibitor CC (10 μM) for 2 hr, followed by immunoblotting. Equal amounts (5 μg) of neuronal lysates were sequentially immunoblotted with phospho-PAK1/2/3 (pPAK), total PAK, and GAPDH. The pPAK intensity was calibrated with total PAK and normalized to DMSO control. N=3 independent experiments. c, Activated PAK3 phosphorylates myo6 at T405. HEK cells were co-transfected with GFP-myo6 (234–454) or GFP-myo6 (234–454)-T405A (TA) with Flag-PAK3-KD (kinase dead) or Flag-PAK3-CA (constitutively active), followed by immunoblot 24 hr after transfection. Equal amounts (5 μg) of cell lysates were loaded on phospho-tag gel and sequentially immunoblotted with antibodies against GFP, Flag, and GAPDH; phosphorylation status is indicated by a band shift as indicated. d,e, Representative images (d) and analyses (e) showing the role of myo6-T405 phosphorylation in presynaptic mitochondrial capture. Cortical neurons at DIV7 were transfected Flag-tagged myo6, myo6-T405A (phospho-dead), or myo6-T405E (phospho-mimetic), followed by co-immunostaining at DIV14. The co-localized pixels are highlighted in the black-white images. f,g, Kymographs (f) and analyses (g) showing reduced mitochondrial motility in axonal by expressing myo6-T405E. Cortical neurons at DIV7 were co-transfected with DsRed-Mito and myo6, myo6-T405A, or myo6-T405E, followed by live imaging at DIV14. h,i, Representative images (h) and quantitative analyses (i) showing the role of PAK3 activity in capturing presynaptic mitochondria. Cortical neurons at DIV7 were transfected with Flag-tagged PAK3, PAK3-CA, or PAK3-KD, followed by co-immunostaining at DIV14. j,k, Representative images (j) and quantitative analyses (k) showing that inhibiting PAK3 abolished activity- or AMPK-induced presynaptic mitochondrial recruitment. Cortical neurons at DIV14 were treated with PTX (100 μM), AICAR (1 mM), or PTX combined with the PAK inhibitor IPA3 (10 μM) for 2 hr, followed by co-immunostaining of SV2 and TOM20. Data were quantified from the total number of neurons indicated within bars (e,i,k) or under the bar graph (g) from three experiments, expressed as mean ± SEM with dots as individual values, and analyzed by one-way ANOVA followed by two-sided Tukey’s multiple comparisons test (b), two-sided Kruskal-Wallis test with post hoc testing by Dunn’s multiple comparisons test (e,g,i) or two-sided unpaired Student’s t-test (k). Scale bars: 10 μm.
We next asked whether myo6 phosphorylation at T405 is able to facilitate mitochondrial positioning at presynaptic terminals. While expressing phospho-mimetic mutant myo6-T405E, but not phospho-dead mutant myo6-T405A, facilitated presynaptic mitochondrial recruitment (P < 0.001) (Fig. 5d,e). Enhanced presynaptic capture by expressing myo6-T405E substantially reduced mitochondrial motility along axons (P < 0.001) (Fig. 5f,g). These results reinforce the notion that phosphorylation at myo6-T405 is a key step in this energy-anchoring crosstalk, thus facilitating presynaptic mitochondrial capture. We further characterized the role of PAK signaling in presynaptic mitochondria recruitment. Expressing PAK3 did not affect the percentage of presynaptic terminals co-localized with mitochondria (P > 0.99), consistent with its autoinhibitory conformation55. Conversely, expressing kinase constitutively active PAK3-CA significantly increased mitochondrial retention at presynaptic terminals (P < 0.001); which was largely abolished when expressing kinase-dead PAK3-KD (Fig. 5h,i). These data support that PAK signaling is involved in the capture of presynaptic mitochondria.
Furthermore, we asked whether the AMPK-PAK signaling facilitates activity-induced presynaptic mitochondrial capture. Cortical neurons at DIV14 were treated with PTX (100 μM, 2 hr), AMPK activator AICAR (1 mM, 2 hr), or combined with Group I PAK inhibitor 1,1’-Dithiodi-2-naphthtol (IPA3) (10 μM, 2 hr)56, followed by co-immunostaining of SV2 and TOM20. Strikingly, PTX- and AICAR-triggered mitochondrial capture was abolished by PAK inhibitor IPA3 (PTX: 74.34 ± 1.94%; PTX + IPA3: 42.27 ± 1.86%, P < 0.001; AICAR: 76.39 ± 1.63%; AICAR + IPA3: 41.39 ± 1.71%, P < 0.001) (Fig. 5j,k). Activating AMPK-PAK-myo6 axis has no detectable effect on the density of presynaptic terminals, nor on the membrane potential of axonal mitochondria (Extended Data Fig. 2a,b,7a,b). Altogether, these data support our sixth conclusion: the mechanistic crosstalk between the AMPK-PAK energy signaling and myo6-SNPH mitochondrial anchoring allows neurons recruiting presynaptic mitochondria in response to synaptic activity and energy deficits.
AMPK-PAK-Myo6 Axis Maintains Presynaptic Calcium Clearance and Synaptic Efficacy
In addition to supplying energy, presynaptic mitochondria buffer local [Ca2+]i4,18,28. To characterize presynaptic Ca2+ transients, we applied Synaptophysin-GECO (Syn-GECO), a genetically encoded single-color calcium indicator that links to the C-terminal tail of synaptophysin57. First, we measured Ca2+ within presynaptic terminals with or without mitochondria using Syn-GECO. The peak value of F/F0 over baseline was averaged. Presynaptic terminals capturing mitochondria have higher Ca2+ clearance capacity (P < 0.001) when compared to those without mitochondria under the same intensive activity (Fig. 6a). Second, we examined whether the AMPK-PAK-myo6 axis plays a role in accelerating presynaptic Ca2+ clearance during intensive activity by recruiting presynaptic mitochondria. Enhancing presynaptic mitochondrial recruitment, by expressing myo6 or myo6-T405E, by activating AMPK-PAK pathway with AICAR or expressing PAK3-CA, significantly reduced the average Syn-GECO peak amplitudes during 100-Hz stimulation (Flag: 3.66 ± 0.16; myo6: 2.50 ± 0.22, P = 0.0011; myo6-T405E: 1.99 ± 0.12, P < 0.001; AICAR: 1.99 ± 0.16, P < 0.001; PAK3-CA: 1.83 ± 0.18, P < 0.001) (Fig. 6b–d), indicating an accelerated Ca2+ clearance capacity. In contrast, impairing presynaptic mitochondrial anchoring, by expressing myo6-T405A, inhibiting AMPK-PAK pathway by CC treatment, or expressing PAK3-KD, increased average Syn-GECO peak amplitudes (myo6-T405A: 5.48 ± 0.34, P < 0.001; CC: 5.86 ± 0.40, P < 0.001; PAK3-KD: 5.19 ± 0.31, P < 0.001) relative to control. These live imaging data suggest a critical role of the AMPK-PAK-myo6 signaling in maintaining presynaptic Ca2+ clearance capacity during intensive activity.
Fig. 6. Modulating AMPK-PAK-myo6 Axis Affects Presynaptic Calcium Clearance.

a, Syn-GECO F/F0 curves and quantitative analysis showing that presynaptic mitochondria accelerate Ca2+ clearance under intensive synaptic activity. Cortical neurons were co-transfected with DsRed-Mito and presynaptic calcium indicator Syn-GECO at DIV7, followed by time-lapse imaging of presynaptic [Ca2+]i transients evoked by a train of stimulation (100 Hz, 10 sec) at DIV12–14. The peak value of F/F0 over baseline was averaged. b-d, Representative presynaptic kymographs (b), Syn-GECO F/F0 curves (c), and quantitative analyses (d) showing that activating or inhibiting the AMPK-PAK-myo6 axis alters presynaptic calcium clearance capacity during intensive synaptic activity. Cortical neurons at DIV7 were co-transfected with Syn-GECO along with myo6, myo6-T405A, myo6-T405E, PAK3-KD or PAK3-CA, or were treated with AICAR (1 mM) or CC (10 μM) for 2 hr, followed by time-lapse imaging of [Ca2+]i transients evoked by a train of stimulation (100 Hz, 10 sec) at DIV12–14. Vertical white lines in kymographs (b) represent dynamic [Ca2+]i transients at individual presynaptic terminals during a train of stimulation, where the peak value of F/F0 over baseline were normalized (c) and averaged (d). Data were quantified from the total number of boutons (a) or neurons indicated in parentheses (a, c) or bars (d), expressed as mean ± SEM with dots as individual values (a, d), and analyzed by two-sided unpaired Student’s t-test (a), or one-way ANOVA with post hoc testing by the Holm-Sidak’s multiple comparisons test (d), where ** P <0.01 and *** P < 0.001 by comparing each condition with control (blue bar). Scale bars: 10 μm.
Presynaptic calcium transients play an important role in SV exocytosis and neurotransmitter release, thus modulating synaptic efficacy. Reduced presynaptic Ca2+ clearance contributes to elevated Ca2+ levels and therefore repetitive trains of stimulation induces short-term synaptic depression50,58. Given such robust impaired presynaptic Ca2+ clearance (Fig. 6a–d), we asked whether altering the AMPK-PAK-myo6 signaling modulates basal synaptic transmission. Cortical neurons were treated with AICAR (1 mM) or CC (10 μM) for 2 hr, or expressing GFP-tagged myo6, myo6-CBD, myo6-T405A (phospho-dead), myo6-T405E (phospho-mimetic), PAK3-KD, or PAK3-CA, followed by patch-clamp on paired neurons. No significant difference was observed in the average amplitude of evoked excitatory postsynaptic currents (EPSCs) (0.05 Hz) (Extended Data Fig. 8a–h), suggesting that modulating the AMPK-PAK-myo6 signaling does not affect basal synaptic transmission. Next, we determined whether activating or inhibiting the AMPK-PAK-myo6 axis modulates short-term synaptic depression during repetitive trains of stimulation (20 Hz, 1 s at 20 sec intervals or 50 Hz, 200 msec). Activating the AMPK-PAK-myo6 pathway, by treating neurons with AICAR, overexpressing myo6, myo6-T405E, or PAK3-CA, accelerated energy-dependent synaptic transmission, triggering a fast depression of synaptic strength during the trains (Fig. 7a–d). In contrast, inhibiting the AMPK-PAK-myo6 pathway, by treating neurons with CC, expressing myo6-CBD, myo6-T405A, or PAK3-KD, impaired presynaptic mitochondrial recruitment, triggering energy deficits and [Ca2+]i buildup at presynaptic terminals during repetitive stimulations. These defects collectively contribute to slowed synaptic depression during repetitive stimulations. To further confirm whether altered synaptic depression is due to presynaptic mitochondria, we repeated these studies in WT and snph KO neurons and demonstrated that these manipulations of the PAK-myo6 pathway have an impact on short-term synaptic depression only in WT neurons (F2, 61 = 5.319, P = 0.0074) but not in snph KO neurons (F2, 73 = 0.08927, P = 0.9147) (Extended Data Fig. 9a,b). Given that SNPH specifically anchors axonal mitochondria, these studies support the notion that these synaptic phenotypes are indeed dependent on mitochondrial anchoring per se.
Fig. 7. AMPK-PAK-myo6 Axis Accelerates Synaptic Recovery after Sustained Activity.

a-d, Activating or inhibiting AMPK-PAK-myo6 signaling modulates short-term synaptic depression. Normalized EPSCs amplitude was plotted against each AP stimulation from paired cortical neurons evoked by 20 Hz, 1 sec with 20 sec inter-train intervals (ITI) (a,b) or 50 Hz, 200 msec (c,d). At DIV14–18, dual whole-cell patch-clamp recording was performed on paired cortical neurons treated with AICAR (1 mM) or CC (10 μM) for 2 hr (a); or presynaptic neurons expressing various proteins as indicated (b-d). Two-way ANOVA revealed a main effect: F2,59=7.764, P=0.0010 (a); F2,69=3.595, P=0.0327 (b); F2,56=10.78, P=0.0001 (c); or F2,64=4.294, P=0.0178 (d). e-g, STED super-resolution images (e) and quantitative analysis (f,g) showing larger SV clusters in proximity to mitochondria. Cortical neurons at DIV14 were co-immunostained with synaptophysin and cyto c, or treated with DMSO or PTX (2 μM for 2 hr) before immunostaining. The average size of SV clusters in proximity to mitochondria (orange circles) was significantly larger than SV clusters without mitochondria in proximity (green circles). Data were quantified from total number of neurons indicated in parentheses, expressed as mean ± SEM with dots as individual values, and analyzed by two-sided Mann-Whitney test. Scale bar: 2 μm. h, Presynaptic ATP declines under HFS. Neurons at DIV7–9 were transfected with Syn-GoAT2 or Syn-GoAT3, followed by live imaging at DIV14. Three trains of stimulations (200 AP at 20 Hz) were delivered to neurons through field stimulation chamber and a 130-sec rest phase was placed between each train. 20 frames of images with 2-sec intervals were taken for total 40 sec (5 frames during stimulations and 15 frames after stimulations). The relative ratio of OFP/GFP signal was normalized to the start of the first train. Two-way ANOVA revealed a main effect by expressing Syn-GoAT2 vs Syn-GoAT3 (F1,58=18.06, P<0.0001). Data were quantified from 30 neurons under each condition. i,j, Representative EPSC curves (i) and normalized EPSC amplitudes (j) showing accelerated synaptic recovery after HFS by activating PAK-myo6 signaling. Neurons were transfected at DIV5, followed by recording at DIV14–18. Recording configuration (total 132 sec) consists of a 2-sec 100 Hz train, a 10-sec recovery phase of four stimuli, and a 120-sec rest phase. The single EPSC traces for the first and last EPSCs were plotted and four recovery EPSCs after the first HFS train were plotted illustrating the recovery period (i). The normalized EPSC amplitude was plotted for the first of each HFS and for each of the recovery EPSCs under each condition. Two-way ANOVA revealed a main effect of gene manipulation (F2,57=3,306, P=0.0438) and a significant interaction between gene manipulation and stimuli (F28,798=1.765, P=0.0089). Data were quantified from the total pairs of neurons indicated in parentheses, and represented as mean ± SEM.
AMPK-PAK-Myo6 Axis Accelerates Synaptic Recovery after Prolonged Synaptic Activity
Synaptic activity imposes large energetic demands that are met by local ATP synthesis59. Although glycolysis maintains basal ATP levels, mitochondrial oxidative phosphorylation boosts ATP to sustain intensive synaptic transmission by mobilizing, refilling, and recycling SVs, thus maintaining long-term synaptic plasticity4,7–9,59,60. We investigated whether enhanced presynaptic mitochondria capture maintains the size of SV clusters after sustained synaptic activity. Cortical neurons at DIV14 were treated with DMSO or PTX (2 μM for 2 hr). STED imaging showed that the average size of SV clusters in proximity to mitochondria was significantly larger than SV clusters without mitochondria in proximity (P = 0.0492) (Fig. 7e,f). Furthermore, activity-induced presynaptic mitochondrial anchoring maintained the average size of SV clusters after sustained synaptic activity (Fig. 7g), suggesting that presynaptic mitochondria are the main local energy source driving SV mobilization and refilling in order to sustain the lasting synaptic efficacy7,8.
To examine whether recruiting presynaptic mitochondria is critical for the maintenance of ATP availability during sustained synaptic activity, we measured presynaptic ATP during high-frequency stimulation (HFS). Presynaptic ATP levels were recorded during HFS profile, which consists of 3 repetitive trains of stimuli: a 200-AP train (10-sec, 20 Hz) and a 130-sec rest phase (10-sec recovery phase + 120-sec rest phase). The OFP/GFP ratio of Syn-GoAT2 ATP probe was decreased after 3 repetitive trains of stimuli, whereas the ATP-insensitive variant Syn-GoAT3 failed to display such a decline (F1, 58 = 18.06, P < 0.0001) (Fig. 7h). These data support that presynaptic energy deficits contribute to synaptic depression during repetitive stimulation.
Next, we examined whether increased mitochondrial anchoring by expressing myo6 and its phospho-mimetic mutant myo6-T405E in cortical neurons accelerates the recovery of synaptic depression after prolonged repetitive stimulation. In a duration of 132 sec consisting of a 2-sec 100 Hz train, a 10-sec recovery phase of four stimuli, and a 120-sec rest phase, neurons overexpressing myo6 or myo6-T405E induced a faster synaptic recovery after HFS (Fig. 7i,j). Two-way ANOVA revealed a main effect of gene manipulation (F2, 57 = 3.306, P = 0.0438) and a significant interaction between gene manipulation and stimuli (F28, 798 = 1.765, P = 0.0089). These manipulations of the PAK-myo6 pathway affected synaptic recovery only in WT neurons but not in snph KO neurons (F3, 57 = 0.5787, P = 0.6314) (Extended Data Fig. 9c), confirming that accelerated synaptic recovery following HFS is through SNPH-mediated mitochondrial anchoring.
Presynaptic mitochondria play a dual-role in maintaining presynaptic Ca2+ clearance and maintaining ATP availability. To assess the relatively contribution of presynaptic ATP on the recovery of synaptic efficacy after prolonged synaptic activity, we examined the recovery rate from synaptic depression after HFS by inhibiting uptake of calcium into mitochondria with 10 μM RU360, a mitochondrial calcium uniporter inhibitor. In consistent with a previous report61, blocking mitochondria calcium buffering with RU360 slowed the recovery rate of synaptic depression after HFS (Extended Data Fig.10a). However, the recovery rate was accelerated when activating myo6-SNPH axis even with loss of calcium buffering capacity (Extended Data Fig.10b). Therefore, these data support our conclusion that the AMPK-PAK-myo6 pathway is critical for the presynaptic ATP maintenance, thus aiding the recovery of synaptic depression after prolonged synaptic activity.
Discussion
Our study reveals that axonal mitochondria are recruited to and anchored at presynaptic terminals through a cytoskeleton-switch from axonal MTs to presynaptic F-actin, a process mediated by a myo6-SNPH interplay. Prolonged synaptic activity induces presynaptic energy deficit, which activates the AMPK-PAK signaling and triggers myo6-driven mitochondrial recruitment and SNPH-mediated anchoring. This mechanistic crosstalk between energy sensing and mitochondrial anchoring enables neurons recruiting presynaptic mitochondria (Fig. 8). By inhibiting the AMPK-PAK-myo6-SNPH signaling, we show that prolonged synaptic activity triggers local energy deficits and [Ca2+]i buildup, leading to impaired synaptic efficacy and accelerated synaptic depression. These defects are relevant to major neurological disorders associated with synaptic dysfunction, energy deficits, mitochondrial defects8,37,48.
Fig. 8. Schematic Illustration of Mechanistic Crosstalk between Energy Sensing and Presynaptic Mitochondrial Anchoring During Sustained Synaptic Activity.

Presynaptic function is driven by highly energy-dependent processes, including assembly and maintenance of synapses, generation of action potentials and ionic gradients, trafficking, refilling and recycling of SVs. While local glycolysis provides ATP for basal synaptic activity, mitochondria supply the majority of the total ATP in synapses, thus supporting intensive synaptic transmission and maintaining long-term synaptic efficacy. Anchored presynaptic mitochondria ideally serve as local energy sources. Given that only ~33% of presynaptic active zones in hippocampi retain mitochondria, energy-sensitive regulation of mitochondrial recruitment ensures that metabolically active presynaptic terminals are adequately supplied with ATP during intensive synaptic activity. Axonal mitochondria are recruited to and anchored on presynaptic F-actin filaments through an anchoring platform-switch which is mediated by the myo6-SNPH interplay. Enhanced synaptic activity induces presynaptic energy stress, which activates the energy sensing AMPK-PAK signaling pathway and triggers myo6 phosphorylation, a cellular process essential for facilitating myo6-driven presynaptic mitochondrial recruitment and SNPH-mediated anchoring. Such a mechanistic crosstalk enables neurons to capture mitochondria at presynaptic terminals in response to local energy stress during sustained synaptic activity, thus fine-tuning synaptic plasticity and prolonged synaptic efficacy. (The illustration was adapted with permission from Sheng Trends Cell Biol. 27, 403–416, 2017 Elsevier).
Presynaptic function is driven by energy-dependent processes, including generation of action potentials and ionic gradients, and refilling and recycling of SVs. Mitochondria supply ~93% of the total ATP in synapses1, thus sustaining lasting synaptic efficacy and plasticity7. It was reported that mitochondria-derived ATP is dispersed in axons and diffused to non-mitochondria-containing presynaptic boutons26. However, sustained synaptic activity is specific to mitochondria-containing presynaptic boutons during long-term potentiation8. Presynaptic boutons with mitochondria have more docked SVs than those without mitochondria in the hippocampal CA1 area. ATP production from presynaptic mitochondria is the main local energy source driving SV mobilization from the reserve pool in order to sustain the lasting synaptic efficacy7. These studies raise the question whether presynaptic mitochondria provide additional ATP to sustain SV release and recycling during prolonged synaptic activity. Given that only ~33% of AZs in hippocampi retain mitochondria8, energy-sensitive regulation of mitochondrial recruitment ensures that metabolically active presynaptic terminals are adequately supplied with ATP during prolonged synaptic activity.
By live imaging analyses, we examined presynaptic ATP availability at individual presynaptic terminals during sustained synaptic activity. PTX-induced synaptic activity for 30 min is sufficient to deplete presynaptic ATP. Presynaptic ATP levels were also depleted during 3 repetitive trains of stimuli (10-sec, 20 Hz); such energy deficits could be effectively reversed by recruiting mitochondria to presynaptic boutons. However, presynaptic boutons that failed to recruit mitochondria displayed energy depletion following sustained synaptic activity. Thus, neurons adapt a unique mechanism recruiting presynaptic mitochondria in response to an enhanced metabolic demand during prolonged synaptic activity.
Miro1/2 regulate myo19 recruitment and stability, and coordinate mitochondrial trafficking and distribution in mouse embryonic fibroblasts14,62. However, cytoskeletal organization is quite unique in axons, where MTs are exclusively oriented with their plus ends towards terminals and two-tier F-actin filaments are differentially organized. While subplasmalemmal actin rings form periodic structures that wrap around axons, intra-axonal actin filaments enrich at presynaptic terminals and highly dense mesh structures38,63,64. This unique F-actin structure ideally serves as a platform for anchoring organelles12. These studies suggest an opposing role of F-actin and MTs on axonal mitochondrial transport11,21. Therefore, our study aimed to address two questions: (1) how are MT-based axonal mitochondria recruited to and captured on presynaptic actin filaments? and (2) does a myosin motor drive this anchoring platform switch?
We demonstrate that MT-actin switch is critical for recruiting and retaining mitochondria at presynaptic terminals through the myo6-SNPH interplay. With STED imaging and time-lapse analysis, we revealed a striking phenotype: upon F-actin disruption by LatB treatment, captured presynaptic mitochondria are quickly released into axons; this phenotype was not readily observed in snph KO neurons. SNPH associates with F-actin through its interaction with myo6. STED imaging further revealed a predominant co-localization of myo6 and SNPH on the surface of axonal mitochondria in WT but not in snph KO neurons, suggesting SNPH acting an adaptor that recruits myo6 to axonal mitochondria. We further showed that myo6 interacts with SNPH and targets to axonal mitochondria through its C-terminal CBD region; replacing three-residues within CBD motifs abolished its interaction with SNPH and its targeting to axonal mitochondria. Furthermore, by knocking down myo6 or expressing SNPH-binding defective myo6 mutants, we consistently showed reduced presynaptic mitochondrial capture. Conversely, overexpressing myo6 increased mitochondria captured at presynaptic terminals in WT neuron, but not in snph KO neurons. Altogether, these results support our model: the myo6-SNPH interplay mediates a cytoskeletal switch of mitochondrial anchoring platform from MTs to actin filaments, thus recruiting and capturing axonal mitochondria at presynaptic terminals.
Myo6 was reported to oppose MT-based mitochondrial transport, suggesting its role in anchoring rather than trafficking mitochondria41. Consistently, myo6 anchors signaling endosomes to actin filaments47. Although myo6 was recruited to damaged mitochondria through forming a complex with Parkin65, this process is unlikely relevant to healthy mitochondria as they do not recruit Parkin. We found that a myo6-SNPH interaction is required for myo6 recruitment to axonal mitochondria. Interestingly, SNPH interacts with the CBD at the C-terminal tail of myo6, which was reported to confer cargo specificity through its interaction with various organelle adaptors43.
Miro as a Ca2+ sensor regulates mitochondrial transport15,16,66. Two genetic studies showed that loss of Miro1 does not prevent Ca2+-dependent arresting of mitochondria motility62,67, thus raising questions as to whether Miro1 is the only essential factor for Ca2+-triggered mitochondrial immobilization and whether Miro2 or other anchoring proteins can immobilize mitochondria by sensing Ca2+ signals. We previously tested this possibility and found that activating the Miro-Ca2+ pathway failed to arrest axonal mitochondria in snph KO hippocampal neurons20. These findings highlight SNPH as one of essential players in recruiting axonal mitochondria to active synapses. Our current study reveals an energy-sensitive mechanism underlying mitochondrial anchoring on presynaptic terminals through the myo6-SNPH interplay. Unlike the Miro1-Ca2+ model, the crosstalk between energy sensing and mitochondrial anchoring enables neurons to recruit and capture presynaptic mitochondria in response to local energy stress during sustained synaptic activity. Prolonged synaptic activity consumes large amounts of ATP, and thus induces local energy stress that activates the AMPK-PAK signaling and facilitates myo6-driven mitochondrial recruitment and SNPH-mediated anchoring. Ca2+ elevation arrests mitochondria on axonal MTs through the Miro1-Ca2+ sensing, which may be a prerequisite step for recruiting mitochondria to presynaptic terminals where the dense actin filaments firmly restrain mitochondria.
Presynaptic energy deficits are defined as insufficient ATP supply and/or increased energy consumption. Sustained synaptic activity drives large ATP consumption resulting in an increased AMP/ATP ratio and AMPK activation, which up-regulates glycolysis and mitochondrial respiration to maintain energy homeostasis. However, the majority of presynaptic terminals in CNS neurons lack an anchored mitochondrion8. Thus, recruiting presynaptic mitochondria is critical for the maintenance of lasting synaptic efficacy. We propose that AMPK signaling facilitates mitochondrial recruitment in parallel with the regulation of mitochondrial respiration to meet elevated metabolic needs at synapses. This is supported by findings that AMPK signaling is necessary for maintaining LTP during HFS in vivo29 and for regulating mitochondrial motility and replenishing ATP supply in distal regions during axonal growth68,69. Depleting SNPH abolishes AMPK-mediated phenotype68, highlighting a critical role for SNPH in AMPK signaling pathway.
We provided six lines of evidence to support our hypothesis that elevated energy consumption at presynaptic terminals activates AMPK signaling, which facilitates mitochondrial recruitment to rescue local energy deficits. First, activity-mediated presynaptic energy deficits induced the phosphorylation of AMPK-Thr172, a prerequisite for AMPK activation34. Second, presynaptic mitochondrial capture was facilitated by activating the AMPK signaling and abolished by inhibiting AMPK activity. Third, AMPK signaling regulated mitochondrial anchoring through the myo6-SNPH interplay. While WT neurons exhibited robust presynaptic mitochondrial recruitment upon activation of AMPK, this phenotype was abolished in neurons with snph deletion, myo6 knockdown, or disruption of actin filaments. Fourth, sustained synaptic activity triggered AMPK-PAK signaling cascade through the phosphorylation of its downstream target PAK25. Fifth, presynaptic mitochondrial recruitment was facilitated through myo6 phosphorylation at T405 by the PAK signaling. Group I PAKs induce myo6 phosphorylation at T405 within the myo6 motor domain and myo6-T405 phosphorylation facilitates myo6 recruitment to actin-enriched regions47,52. This phosphorylation event was confirmed in our phospho-tag gels. Expressing phosphomimic myo6-T405E, but not phospho-dead myo6-T405A, increased presynaptic mitochondria capture. Furthermore, expressing PAK-CA, but not PAK3-KD, increased mitochondrial retention at presynaptic terminals. Altogether, our study reveals the crosstalk between energy sensing and mitochondrial anchoring that recruiting presynaptic mitochondria by sensing local energy deficits.
Presynaptic mitochondria play a dual-role in supporting synaptic transmission by buffering presynaptic Ca2+ and supplying ATP7,28,59,61,70–72. Ca2+ release from presynaptic mitochondria contributes to elevated residual calcium that induces short-term and post-tetanic potentiation at many types of synapses58,70,73,74. Disrupting the AMPK-PAK-myo6 axis triggers [Ca2+]i buildup at presynaptic terminals, thus suppressing synaptic depression during repetitive stimulations. Disrupting the AMPK-PAK-myo6 axis also triggers presynaptic energy deficits, thus slowing the recovery of synaptic depression after prolonged synaptic activity. Such energy deficits inhibit massive SV fusion and recycling induced by elevated presynaptic [Ca2+]i, thus limiting synaptic depression during repetitive trains. Our findings support this notion. First, presynaptic mitochondria play a crucial role in maintaining SV pool size. Second, presynaptic ATP is quickly depleted by HFS in a timescale of a few minutes. Therefore, impairing presynaptic mitochondrial positioning induces local energy deficits during trains of stimulation.
In summary, our study elucidates a mechanistic interplay between energy sensing and mitochondrial anchoring to fine-tune presynaptic mitochondrial positioning upon sensing activity-induced energy stress. This mechanistic crosstalk is critical for neurons to sustain prolonged synaptic efficacy. Impaired axonal energy metabolism and dysregulated AMPK signaling have been reported in major neurodegenerative diseases9,75. An ultrastructural examination revealed a fourfold reduction in presynaptic mitochondria in cortical regions from Alzheimer disease (AD) patients76, which is consistent to our previous study demonstrating SNPH depletion in the late stages of an AD mouse model and AD patient brains48. Therefore, impaired crosstalk between energy sensing and mitochondria anchoring may contribute to presynaptic energy deficits in AD brains, thus leading to synaptic dysfunction and cognition impairments. The fundamental insights revealed by our study conceptually advance the current knowledge of how neurons respond to metabolic energy stress and synaptic activity by adapting mitochondria trafficking and anchoring.
Methods
Mouse Lines and Animal Care
The snph−/− mouse line was generated by targeted gene replacement in embryonic stem cells as previously described18. The mice were maintained in the National Institute of Neurological Disorders and Stroke (NINDS) animal facility and housed in groups of 3–5 animals on a 12/12-h light/dark cycle (lights on at 6:00 a.m.) at 70°F with 45% humidity, and given ad libitum access to food and water. All animal procedures were performed according to National Institutes of Health (NIH) guidelines and were approved by the Animal Care and Use Committee of NINDS/NIDCD.
Primary Neuron Cultures
For preparing WT and snph−/− cortical neuron cultures, E18 embryonic mice (sex: random) were used. After dissociation by papain (Worthington), neurons were re-suspended in plating medium (Neurobasal medium supplemented with 2% B-27, 0.5 mM GlutaMAX, 55 μM 2-Mercaptoenthanol (all from Thermo Fisher Scientific), 10% fetal bovine serum (HyClone) and 0.25 μg/ml insulin (Sigma-Aldrich)) and plated onto 12-mm coverslips (Deckgläser) coated with poly-ornithine (Sigma-Aldrich; 1:3 in PBS) in a 24-well tissue culture plate. After 24 hr of growing neurons in plating medium, half of the plating medium was replaced with the same amount of neuronal feeding medium (Neurobasal medium supplemented with 2% B-27, 0.5 mM GlutaMAX, and 5 μM 5-Fluoro-2-deoxyuridine) to inhibit glia proliferation. Neurons were fed every three days by aspirating half the medium and replacing it with the same amount of neuronal feeding medium. Neurons were transfected with various constructs at DIV7–9 using the calcium phosphate method and imaged at DIV14 with a Zeiss LSM880 Airyscan confocal microscope.
DNA Constructs
Lentiviral constructs encoding WT, truncated and point-mutated myo6, AMPK and PAK3 were generated by PCR and subcloned into the pDONR221 vector by BP Clonase II to create Gateway entry clones (Thermo Fisher Scientific), which were then transferred to destination lentiviral vectors pHAGE-CMV-n-EGFP or pHAGE-CMV-n-HA-Flag by LR Clonase II (Thermo Fisher Scientific). EGFP-myo6-(355–454) was generated by cloning truncated myo6 into pEGFP-C2. EGFP-synapsin was generated by cloning the full-length synapsin sequence into pEGFP-C1. Synaptophysin-GO-ATeam2 and synaptophysin-GO-ATeam3 was generated by cloning the full-length synaptophysin encoding sequence into GO-ATeam2 and GO-ATeam3 (gifts from Dr. H. Imamura, Kyoto University). The following constructs were gifts from the labs: DsRed-mito (R. Youle, NINDS, NIH), GFP-myo6 (J. Kendrick-Jones, MRC-LMB and F. Buss, University of Cambridge), AMPKAR-EV (M. Matsuda, Kyoto University, Addgene plasmid # 105241), and Mito-BFP (G. Voeltz, University of Colorado, Addgene plasmid # 49151). Myo6 shRNA (backbone pLKO.1) was purchased from Dharmacon. Scramble shRNA pLKO.1 was from Addgene. Synaptophysin-GECO and pGEX-4T-1-SNPH and truncation mutants were generated in our previous studies57,77.
Live Neuron Imaging and Analysis
Transfected neurons were transferred to pre-warmed Hibernate E low fluorescence medium (BrainBits) supplemented with 2% B27 and 0.5 mM GlutaMAX. Temperature was maintained at 37°C using an air stream incubator. Cells were imaged with a 40× 1.3 NA oil immersion objective on a Zeiss LSM 880 Airyscan confocal microscope. Time-lapse images were acquired at a 1024 × 1024-pixel resolution. To image axonal mitochondrial transport, images were taken consecutively every 10 sec for a total duration of 10 min. Kymographs were generated using ImageJ (NIH). To measure presynaptic ATP levels, two emission images were collected at 505–550 nm and long pass above 545 nm along axons expressing synaptophysin-GO-ATeam2 or synaptophysin-GO-ATeam3, as described previously19,27. Ratiometric images were generated using ImageJ (NIH). To measure presynaptic ATP levels under repeated trains of stimuli, field stimulations (10 sec at 20 Hz) were delivered via platinum electrodes in a RC-21BRFS stimulation chamber (Warner Instruments) in modified Tyrode’s solution (145 mM NaCl, 3 mM KCl, 10 mM HEPES, 10 mM glucose, 1.2 mM CaCl2, and 1.2 mM MgCl2). To measure AMPK activation, two emission images were collected at 450–500 nm and long pass above 525 nm along axons expressing AMPKAR-EV. Ratiometric images were generated using ImageJ (NIH). To measure presynaptic calcium levels, cortical neurons at DIV13–14 transfected with synaptophysin-GECO were transferred to a RC-21BRFS stimulation chamber (Warner Instruments) in modified Tyrode’s solution, and imaged with a 40× 1.3 NA oil immersion objective on a LSM 880 Zeiss confocal microscope as previously described4. Field stimulations (10 sec at 100 Hz) were delivered via platinum electrodes in the chamber. Images were taken consecutively every 1 sec for a total duration of 40 sec. Confocal images were acquired using Zen 2.1 SP3 (Zeiss).
STED Super-resolution Imaging
STED super-resolution imaging was performed as previously described48. An inverted STED microscope with a resolution of ~50–90 nm (TCS SP8 STED 3X, Leica, Germany) was used. Alexa Fluor 488 was excited by a tunable white light laser (70% of maximum power) at 470 nm (10%) with the STED depletion laser at 592 nm (30% of the maximum power); its fluorescence at 480–560 nm was collected using time-gated detection (1.5–6.5 nsec). Alexa Fluor 594 was excited by the tunable white light laser at 594 nm (10%) with the STED depletion laser at 660 nm (30% of the maximum power); its fluorescence between 600–640 nm was collected using time-gated detection (1.5–6.5 nsec). SiR was excited by a tunable white light laser at 652 nm (20%) with the STED depletion laser at 750 nm (20% of the maximum power); its fluorescence at 660–700 nm was collected using time-gated detection (1.5–6.5 nsec). For dual-color imaging, channels at the higher wavelength range were imaged first to avoid bleaching with a frame-scanning mode. STED images were acquired using Leica Application Suite X (LASX) (3.1.5.16308) (Leica Microsystems). Images were subject to deconvolution processing using Huygens Profession 17.10 (Scientific Volume Imaging).
Electron Microscopy
WT or snph−/− cortical neurons at DIV14 were fixed at room temperature (RT) with an EM fixative (0.1% glutaraldehyde with 4% paraformaldehyde in PBS) for 30 min after DMSO or LatB (2 μM) treatment. After 5 washes (5 min each) with PBS, neurons were treated with PBS containing 0.2% OsO4 for 30 min, en bloc mordanted with uranyl acetate, dehydrated through a series of graded ethanol washes, and embedded in epoxy resins. Thin sections were stained with uranyl acetate and lead citrate. Images were acquired on a JEOL 200CX electron microscope (EM Facility, NINDS, NIH) and analyzed using ImageJ.
Immunocytochemistry
Cortical neurons were fixed with 4% paraformaldehyde and 4% sucrose at RT for 20 min, washed three times with PBS for 5 min each, permeabilized in 0.15% Triton X-100 for 15 min, and then incubated in blocking buffer (4% BSA and 3% normal goat serum) in PBS for 1 hr. Fixed neurons were next incubated with primary antibodies diluted in blocking buffer at 4°C overnight. Primary antibodies were as follows: rabbit anti-TOM20 (1:100, Santa Cruz), anti-myo6 (1:100, Sigma-Aldrich), anti-synaptophysin (1:400, Santa Cruz), and anti-SNPH (1:250); mouse anti-βIII-tubulin (1:5000, Sigma-Aldrich), anti-MAP2 (1:5000, BD Biosciences), anti-SV2 (1:2000, DSHB), anti-myo6 (1:50, Santa Cruz), and anti-cyto c (1:100, BD Biosciences). After washing three times with PBS at RT for 10 min each, samples were incubated with secondary fluorescent antibodies (Alexa 488, 546, 594 or 633 conjugated, Thermo Fisher Scientific) diluted in blocking buffer for 60 min, rewashed with PBS, and mounted with Fluoro-Gel mounting medium (Electron Microscopy Sciences) before imaging.
Proximity Ligation Assay (PLA)
The proximity ligation assay was performed according to the manufacturer’s instructions (Sigma-Aldrich). Briefly, fixed neurons were incubated with primary antibodies (SNPH-actin interaction: rabbit anti-SNPH, 1:250 and mouse anti-actin, 1:100, Abcam; SNPH-microtubules interaction: rabbit anti-SNPH, 1:100, Abcam and mouse anti-βIII-tubulin, 1:2000, Sigma-Aldrich) diluted in Duolink antibody diluent at 4°C overnight, then washed three times with Buffer A (0.01 M Tris, 0.15 M NaCl, 0.05% Tween 20) at RT for 5 min each, incubated with Duolink PLA Probe at 37°C for 1 hr, rewashed with PBS three times at RT for 5 min each, then incubated in Duolink PLA ligation solution at 37°C for 30 min, rewashed with PBS three times at RT for 5 min each, then incubated with Duolink PLA amplification solution at 37°C for 100 min, washed with 1x Buffer B (0.2 M Tris, 0.1 M NaCl pH 7.5) two times at RT for 10 min each and PBS at RT for 5 min. To counterstain for a neuronal marker, neurons were post-fixed with 4% paraformaldehyde and 4% sucrose for 10 min at RT and processed for immunocytochemistry.
Labeling of F-actin
To label F-actin with Phalloidin, cortical neurons were incubated with Alexa Fluor 594 Phalloidin (Thermo Fisher Scientific) post immunocytochemistry at RT for 30 min, washed with PBS, and mounted with mounting medium before imaging. To label F-actin using SiR-actin, cortical neurons were incubated with 5 μM SiR-actin and 10 μM Verapamil (Cytoskeleton) at RT for 60 min and neurons were imaged in PBS containing 1 μM SiR-actin.
Measurement of Mitochondria Membrane Potential (ΔΨm)
To measure mitochondria membrane potential using TMRE, cortical neurons were loaded with MitoTracker CMTMRos (100 nM, Thermo Fisher Scientific) for 30 min, a fixable ΔΨm-dependent dye. Neurons were then washed three times with PBS, fixed, and immunostained with an antibody against TOM20. ΔΨm was assessed by the relative fluorescence intensity of MitoTracker CMTMRos on TOM20-labeled mitochondria using ImageJ. To measure mitochondria membrane potential using TMRE, cortical neurons were incubated with TMRE (50 nM, Thermo Fisher Scientific) for 20 min along with total mitochondrial marker mitoTracker Green (20 nM) for 20 min at DIV14, washed with PBS for three times, then proceed to live-cell imaging. ΔΨm was assessed by the relative fluorescence intensity of TMRE on mitoTracker Green using ImageJ.
Immunoblotting
Cortical neurons were infected with scramble or myo6 shRNA lentiviruses at DIV5–7. Cells were then collected at DIV12–14 and lysed with RIPA buffer (50 mM Tris-HCl, pH 7.4, 150 mM NaCl, 1% NP-40, 0.1% SDS, 0.5% DOC, 2 mM EDTA) with cOmplete™ protease inhibitor cocktail tablets (Roche). To assess the level of protein phosphorylation, cortical neurons treated with DMSO, PTX (100 μM, Sigma-Aldrich), or AICAR (1 mM, Millipore), or HEK293T cells transfected with WT and mutated myo6 and PAK3 constructs, were collected and lysed with RIPA buffer supplemented with cOmplete™ protease inhibitor cocktail tablets and PhosSTOP™ (Roche). Equal amounts of proteins were loaded and analyzed by 4–12% Bis-Tris NuPAGE (Thermo Fisher Scientific) or 7.5% Phos-tag gels (FIJIFILM Wako) and processed for immunoblot. Primary antibodies were used as follows: rabbit anti-myo6 (1:1000, Sigma-Aldrich), anti-SNPH (1:2000), anti-Phospho-ACC (Ser79) (1:1000, Cell Signaling), anti-ACC (1:1000, Cell Signaling), anti-Phospho-AMPKα (Thr172) (1:1000, Cell Signaling), anti-AMPKα (1:1000, Cell Signaling), anti-Phospho-PAK1/2/3 (1:1000, Abcam), anti-PAK1/2/3 (1:1000, Thermo Fisher) and anti-GAPDH (1:5000, Millipore); mouse anti-Flag (1:2000, Sigma-Aldrich), anti-Tubulin (1:5000, Sigma-Aldrich), and anti-GFP (1:500, Santa Cruz). Secondary antibodies were used as follows: Mouse IgG HRP-linked (1:5000, GE Healthcare) and Rabbit IgG HRP-linked (1:2500, GE Healthcare).
GST Pull-down Assay
GST-tagged proteins were expressed in Escherichia coli BL21. The BL21 cells were grown to an OD600 of 0.6; expressed protein was induced with isopropyl-β-d-thiogalactoside (IPTG) to a final concentration of 1 mM at 25°C for 4–6 hr. The bacterial pellets were resuspended in lysis buffer (1x TBS supplemented with 1% Triton, 1 mM EDTA, 1 mM PMSF, and cOmplete protease inhibitor cocktail tablets). After sonication and centrifugation, the crude extract was purified using Glutathione-Sepharose 4 Fast Flow beads (GE Healthcare). Mouse brains were homogenized in Binding Buffer (25 mM HEPES, 10 mM NaCl, 0.01% Triton, 5% Glycerol, 1 mM DTT, pH7.5, and cOmplete protease inhibitor cocktail tablets). The homogenates were centrifuged at 15,000 × g for 20 min. HEK293T cells were lysed in Binding Buffer and centrifuged at 15,000 × g for 20 min. The supernatant was carefully collected. GST beads coated with GST, GST-SNPH, or its truncated mutants were mixed with the brain homogenate or HEK293T cell supernatants and incubated for 3 hr with gentle agitation. The beads were then extensively washed with 1x TBS supplemented with 0.1% Triton. Next, the beads were dissolved in LDS-PAGE sample buffer (Thermo Fisher Scientific) and heated at 75°C for 10 min. Proteins were resolved by Bis-Tris NuPAGE and processed for immunoblot analysis or Coomassie Blue Staining.
Coimmunoprecipitation
Mouse brains were homogenized in ELB buffer (50 mM HEPES, 250 mM NaCl, 5 mM EDTA, 0.1% NP-40, 1 mM DTT, 10% glycerol, and cOmplete protease inhibitor cocktail tablets). The crude homogenates were centrifuged at 12,000 × g at 4°C for 15 min. An anti-myo6 antibody (10 μl, Sigma Aldrich) or anti-SNPH antibody (10 μl, Abcam) was then added to the supernatants and incubated on a rotator at 4°C overnight. Protein A Sepharose CL-4B (GE Healthcare) was added to each sample; incubation continued for an additional 2 hr followed by five washes with ELB buffer. The beads were dissolved in LDS-PAGE sample buffer supplemented with 10 mM DTT and heated at 75°C for 10 min. Proteins were resolved by Bis-Tris NuPAGE and processed for immunoblot analysis.
Actin Spin-down Assay
GST-SNPH (1–469) was purified by binding to Glutathione-Sepharose 4 Fast Flow beads, eluted with 15 mM glutathione supplemented with 4 mM DTT and 2.5% 2-Mercaptoethanol, dialyzed in general actin buffer, and ultracentrifuged at 150,000 × g for 1 hr at 4°C. The purified GST-tagged SNPH proteins were then used for the actin spin-down assay according to the manufacturer’s instructions (Cytoskeleton). Briefly, purified GST-SNPH1 (1–469) and the positive control α-actinin (supplied in the kit) were each incubated with F-actin at RT for 30 min, followed by centrifugation at 150,000 × g for 90 min at 24°C. The supernatants were collected, and pellets were resuspended in SDS-PAGE sample buffer. Both supernatant and pellet samples were resolved by SDS-PAGE and Coomassie Blue Staining.
Lentivirus Production and Infection
HEK293T cells maintained in DMEM (Thermo Fisher Scientific) containing 10% FBS (Hyclone) and 0.5 mM GlutaMAX were transfected with vector, psPAX2, and pMD2G plasmids at a 4:3:1 ratio by Lipofectamine 2000 (Thermo Fisher Scientific) to produce the lentivirus. After over-night transfection, the medium was aspirated and replaced with 8 ml UltraCULTURE medium containing 1% Sodium Pyruvate, 1% Sodium Bicarbonate (all from Lonza), and 1% GlutaMAX. Virus-containing medium was harvested at 48 and 72 hr post transfection, then centrifuged at 800 × g for 10 min to remove cell debris. The supernatant was filtered through a 0.45 um filter and centrifuged at 90,000 × g for 90 min using an ultracentrifuge. The viral pellet was resuspended in PBS, aliquoted, and stored at −80°C until use. Cortical neurons at DIV5–7 were infected with the concentrated virus.
Electrophysiology
For EPSC recordings, cultured cortical neurons grown on coverslips to DIV14–17 were transferred to a submersion chamber on an upright microscope (BX50WI, Olympus), and perfused with normal artificial cerebrospinal fluid (ACSF, in mM: 125 NaCl, 25 NaHCO3, 2.5 KCl, 1.25 NaH2PO4, 10 D-glucose, 2 MgCl2, 2 CaCl2 bubbled with 95% O2 and 5% CO2). Fluorescent positive neurons were identified by epifluorescence microscopy. Dual patch-clamp recordings were made with a whole-cell configuration at RT. Both neurons were voltage-clamped at −70 mV to obtain EPSCs. Membrane currents were acquired using a MultiClamp 700B amplifier and digitized by Digidata 1440A with pCLAMP 10.2 software (Axon Instruments/Molecular Devices). Signals were filtered at 2 kHz and digitized at 10 kHz. Patch pipettes (Sutter Instrument) with resistance of 4–8 mega-ohms were tip-filled and then backfilled with internal solution. For measuring basal EPSC and synaptic depression, the internal solution was composed of (in mM) 130 K-gluconate, 6 NaCl, 20 HEPES, 0.2 EGTA, 1 MgCl2, 2 MgATP, 0.3 Na3GTP (pH 7.2–7.4 with KOH, 285–300 mOsm); for measuring synaptic transmission recovery, the internal solution was composed of (in mM) 146.5 K-gluconate, 7.5 KCl, 9 NaCl, 10 HEPES, 0.2 EGTA, 0.3 Na3GTP (pH 7.25 with KOH, 295 mOsm). EPSCs were recorded at least 5 min later, when they appeared steadily larger in size. RU360 (10 μM, Sigma-Aldrich), AICAR (1 mM, Millipore) and CC (10 μM, Millipore) perfusion was achieved by using a circulating pump. Series resistance was monitored and not compensated, and cells in which series resistance varied by 20% during a recording session were discarded. Unless otherwise indicated, all chemicals were obtained from Sigma-Aldrich.
Statistics and Reproducibility
All quantifications were performed unblinded. Statistical parameters including the definitions and exact value of n (e.g., number of experiments or replications, number of axons, number of organelles, number of neurons, etc), deviations and p values are reported in the figures and corresponding figure legends. Statistical analysis was carried out using Prism 7 (Graphpad Software). Comparisons between two groups were performed by an unpaired Student’s t-test (sample size ≥ 30), a Mann-Whitney test (sample size < 30) or a Wilcoxon matched-pairs rank test (for paired samples). Comparisons between three or more groups were performed by one-way analysis of variance (ANOVA) with post hoc testing by a Dunnett’s multiple comparisons test (sample size ≥ 30, compare to ctrl group) or a Tukey’s multiple comparisons test (sample size ≥ 30, compare to every other group), Kruskal-Wallis test (sample size < 30) with post hoc testing by a Dunn’s multiple comparisons test, or two-way ANOVA with post hoc testing by a Tukey’s multiple comparisons test where indicated. Comparisons of biochemical studies were performed by Fisher’s LSD test, or one-way ANOVA with post hoc testing by a Dunnett’s multiple comparisons test (compare to ctrl group) or a Tukey’s multiple comparisons test (compare to every other group). Data are expressed as mean ± SEM. Differences were considered significant with P < 0.05. All experiments were repeated at least three times independently.
Reporting summary
Further information on research design is available in the Nature Research Reporting Summary linked to this article.
Data availability
Further information and requests for resources and reagents should be directed to and will be fulfilled by the corresponding author Zu-Hang Sheng (shengz@ninds.nih.gov). The raw data sets generated and/or analyzed during the current study are available from the corresponding author upon reasonable request. Source data are provided with this paper.
Extended Data
Extended Data Fig. 1. Activation of AMPK Signaling by PTX-induced Synaptic Activity.

a–c, Representative immunoblots (a) and quantitative analyses (b,c) showing synaptic activity-induced AMPK signaling in a time-dependent manner. Cortical neurons at DIV14 were treated with PTX (100 μM) for 0, 30, 60 or 120 min, followed by harvesting cell lysates for analysis. Equal amounts (5 μg) of cell lysates were sequentially immunoblotted with antibodies against AMPKα-Thr172 (pAMPKα) and ACC-1-Ser79 (pACC-1), total ACC-1 and AMPKα, and GAPDH (a). The relative intensity of pACC-1 or pAMPKα was calibrated with total ACC-1 or AMPKα respectively, and normalized to the time point at 0 min (b,c). d,e, Validation of AMPK WT and kinase-dead (KD) constructs. Cortical neurons were infected with Flag, Flag-AMPK-WT or Flag-AMPK-KD at DIV4–5, treated with PTX (100 μM for 2 hr) at DIV14, followed by harvesting cell lysates for analysis. Equal amounts (5 μg) of cell lysates were sequentially immunoblotted with antibodies against Flag, AMPK, pACC-1, total ACC-1 and GAPDH. The relative intensity of pACC-1 was calibrated with total ACC-1 levels, and normalized to control. Note that expressing AMPK-WT (P = 0.028), but not AMPK-KD (P = 0.7636), activated AMPK signaling. Data were collected from n=3 (b, c) or n=4 (e) independent experiments, expressed as mean ± SEM, and analyzed by one-way ANOVA with post hoc testing by Dunnett’s multiple comparisons test (b, c) or by two-sided Fisher’s LSD test (e).
Extended Data Fig. 2. PTX and AICAR Do Not Affect Presynaptic Density and Mitochondrial Integrity.

a,b, Representative images (a) and quantitative analyses (b) showing similar presynaptic density along axons following synaptic activation with PTX or AMPK activation with AICAR. Cortical neurons at DIV14 were treated with PTX (100 μM) or AICAR (1 mM) for 2 hr, followed by co-immunostaining of synaptophysin (SYP) and βIII-tubulin. c,d, Representative images (c) and quantitative analyses (d) showing unaffected mitochondrial integrity upon synaptic activation with PTX or AMPK activation with AICAR. Cortical neurons at DIV14 were treated with PTX (100 μM) or AICAR (1 mM) for 2 hr, followed by co-labeling of total mitochondria with mitoTracker Green (20 nM for 20 min) and mitochondria membrane potential with TMRE (50 nM for 20 min). Mitochondrial integrity was assessed by integrated intensity ratio of TMRE (red) vs mitoTracker (green) within individual mitochondria and normalized to the control group. Data were quantified from the total number of neurons indicated within bars, expressed as mean ± SEM, and analyzed by one-way ANOVA with post hoc testing by Dunnett’s multiple comparisons test. Scale bars: 10 μm.
Extended Data Fig. 3. Myo6 Knockdown Does Not Impact Density of Axonal Mitochondria and Presynaptic Terminals.

a, The alignment of mouse and human myo6 sequences that are targeted by mouse myo6-shRNA. Sequence differences are marked by red color. b, Three immunoblot repeats showing effective myo6 knockdown by myo6-shRNA in mouse cortical neurons. Neurons were infected with lentiviruses encoding scramble (scr) or myo6-shRNA (myo) at DIV5 and analyzed by immunoblotting at DIV14. Note that myo6-shRNA effectively depletes myo6 expression in mouse neurons while human myo6 (h-myo) is resistant to mouse myo6-shRNA. c,d, Representative images (c) and quantitative analysis (d) showing effective knockdown of myo6 in mouse cortical neurons. Neurons were infected with lentiviruses encoding scr- or myo6-shRNA at DIV5, followed by co-immunostaining of myo6 and βIII-tubulin at DIV14. e,f, Quantitative analyses revealing no detectable effect of myo6 knockdown on the average density and size of axonal mitochondria (e) and density of presynaptic terminals (f). Cortical neurons at DIV4 were infected with scr-shRNA or myo6-shRNA, followed by co-immunostaining of SV2 and TOM20 at DIV14. The number (per 100 μm) and size (μm2) of axonal mitochondria and the number of presynaptic boutons (per 100 μm) were quantified. g,h, Representative images (g) and quantitative analysis (h) showing no additive reduction in presynaptic mitochondria by myo6 knockdown in snph KO neurons. Neurons were infected with scr-shRNA or myo6-shRNA at DIV4–5, followed by co-immunostaining at DIV14. The co-localized pixels of red (TOM20) and green (SV2) channels are highlighted in the black-white images. Data were quantified from the total number of neurons indicated within bars from three experiments. Data are expressed as mean ± SEM and analyzed by two-sided unpaired Student’s t-test. Scale bars: 20 μm (c) and 10 μm (g).
Extended Data Fig. 4. LatB Disrupts F-Actin without Impacting Density of Presynaptic Boutons and Axonal Mitochondria.
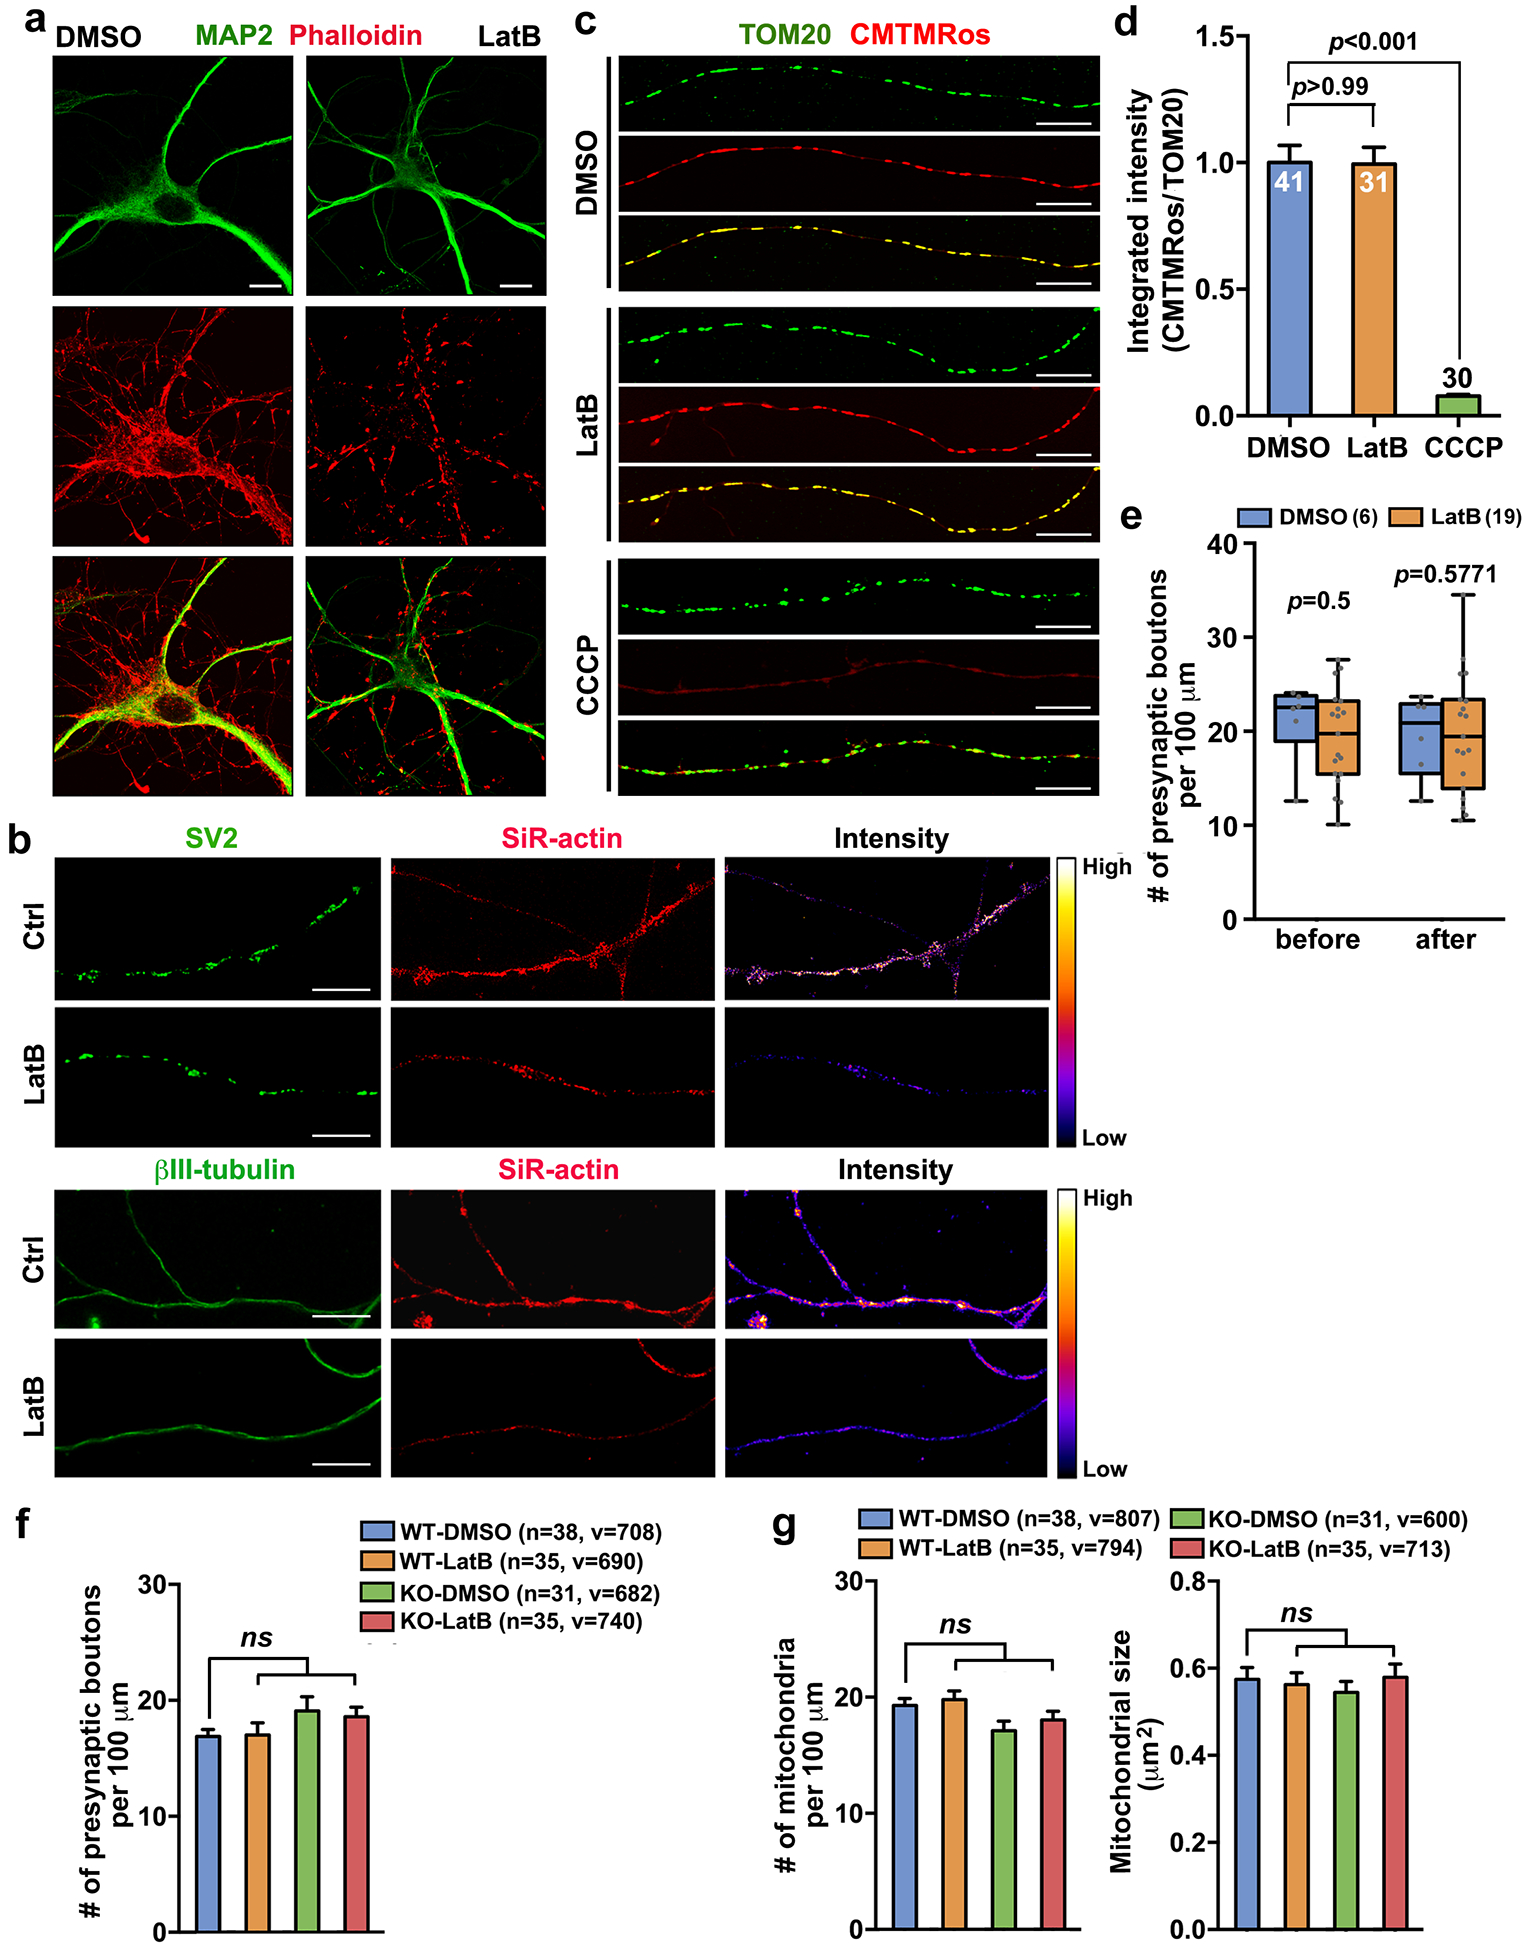
a, Disruption of F-actin with LatB. Cortical neurons were treated with DMSO or LatB (2 μM) for 3 hr at DIV14, followed by phalloidin labeling of F-actin and immunostaining of MAP2. b, STED images showing reduced F-actin in axons and at presynaptic terminals upon LatB treatment. Neurons at DIV14 were treated with DMSO or LatB (2 μM) for 3 hr, followed by SiR-actin labeling and immunostaining. c,d, Images (c) and analyses (d) showing unchanged mitochondrial integrity following LatB treatment. Neurons at DIV14 were treated with DMSO or LatB (2 μM) for 3 hr, or CCCP (10 μM) for 30 min, followed by labeling with CMTMRos (100 nM) for 20 min and immunostaining of TOM20. Mitochondrial integrity was assessed by integrated intensity ratio of CMTMRos vs TOM20 and normalized to DMSO. e–g, LatB treatment does not affect presynaptic density in live (e) and fixed neurons (f) and the density and size of axonal mitochondria (g). For live imaging, neurons were co-transfected with GFP-synapsin and DsRed-mito at DIV7–8, and dual-channel imaging was performed at DIV14. For fixed neuron imaging (f,g), neurons at DIV14 were treated with DMSO or LatB (2 μM) for 3 hr, followed by co-immunostaining. The average number of presynaptic boutons per 100 μm was quantified from the total number of neurons indicated in bars (d) or in parentheses (e,f,g) where n represents number of neurons and v stands for number of presynaptic terminals (f) or mitochondria (g) from three experiments. Data are presented as box plots (min, max, median, 25th and 75th percentiles) with dots as individual values (e) or bar graphs of mean ± SEM (d,f,g), and analyzed by two-sided unpaired Student’s t-test (e) or one-way ANOVA followed by Dunnett’s test (d,f,g). Scale bars: 10 μm (a,c) or 5 μm (b).
Extended Data Fig. 5. SNPH and F-actin Are Essential for Capturing Presynaptic Mitochondria.

a–c, Representative kymographs (a,b) and quantitative analyses (c) showing axonal mitochondria moving out of presynaptic terminals upon F-actin disruption in live neurons. Cortical neurons were co-transfected with GFP-synapsin and DsRed-Mito at DIV7–8, followed by dual-channel live imaging in distal axons at DIV14 (450 frames with 10-sec intervals for 75 min). After 90 frames (15 min) of live imaging, LatB was added to the chamber (10 μM) and the same axons were continuously time-lapse imaged for an additional 60 min. White arrows (a) point to mitochondria being released from presynaptic terminals; black arrows (b) point to presynaptic terminals capturing mitochondria under DMSO condition (b, left panels) or releasing mitochondria upon LatB treatment (b, right panels). The percentage of presynaptic terminals capturing mitochondria was quantified before and after LatB treatment. Note that disrupting F-actin reduces the percentage of presynaptic terminals capturing mitochondria. d,e, Electron micrographs (d) and quantitative analysis (e) showing reduced mitochondrial positioning at AZs upon F-actin disruption or snph deletion. WT or snph KO cortical neurons at DIV14 were treated with DMSO or LatB (2 μM) for 3 hr, followed by TEM. Yellow area shows AZs with SV clustering; green area shows mitochondria. Data were quantified from the total number of neurons (c) or AZs (e) per condition indicated in parentheses (c,e). Data are presented as box plots (min, max, median, 25th and 75th percentiles) with dots as individual values (c) or as bar graphs of mean percentage (e), and analyzed by two-sided Wilcoxon matched-pairs rank test (c). Scale bars: 10 μm (a,b) or 500 nm (d).
Extended Data Fig. 6. Deletion of SNPH or Knockdown of Myo6 Does Not Affect Axonal Cytoskeleton.

Representative STED super-resolution images showed that deleting snph (a) or knocking down myo6 (b) does not affect global structures of axonal cytoskeleton. WT or snph KO cortical neurons at DIV14 were immunostained by antibody against βIII-tubulin, followed by SiR-actin labeling of F-actin (a), or were infected with scr-shRNA or myo6-shRNA at DIV5 and immunostained with βIII-tubulin, followed by SiR-actin labeling at DIV14 (b). Scale bars: 5 μm.
Extended Data Fig. 7. Modulating PAK-myo6 Axis Does Not Affect Density of Presynaptic Terminals or Mitochondrial Integrity.

Representative images (a,c) and quantitative analyses (b,d) showing no significant effect on the density of presynaptic terminals (a,b) and mitochondrial integrity (c,d) upon activation of PAK-myo6 axis by expressing PAK-CA or myo6-T405E. Cortical neurons at DIV7 were transfected with PAK3-CA or myo6-T405E, followed by co-immunostaining of synaptophysin (SYP) and βIII-tubulin (a,b) or by labeling mitochondria membrane potential with TMRE (50 nM for 20 min) along with total mitochondrial marker mitoTracker Green (20 nM for 20 min) at DIV14 (c,d). Mitochondrial integrity was assessed by the integrated intensity ratio of TMRE (red) vs mitoTracker (green) within individual mitochondria and normalized to the control group. Data were quantified from the total number of neurons indicated within bars, expressed as mean ± SEM, and analyzed by one-way ANOVA with post hoc testing by Dunnett’s multiple comparisons test. Scale bars: 10 μm.
Extended Data Fig. 8. Modulating the AMPK-PAK-myo6 Axis Has No Impact on Basal Synaptic Transmission.

Representative EPSC curves (a,c,e,g) and mean amplitudes (b,d,f,h) at 0.05 Hz showed no significant differences of basal synaptic transmission following modulation of the AMPK-PAK-myo6 pathway. Dual whole-cell patch-clamp recording was performed at DIV14–18 on paired cortical neurons treated with AICAR (1 mM) or CC (10 μM) for 2 hr (a,b); or presynaptic neurons expressing GFP, GFP-tagged myo6 or myo6-CBD (c,d); myo6-T405A or myo6-T405E (e,f); PAK3-KD or PAK3-CA (g,h). Data were quantified from the total pairs of neurons indicated in bars, represented as mean ± SEM, and analyzed by one-way ANOVA (b: F2, 72 = 1.764, P = 0.178; d: F2, 104 = 0.060, P = 0.941) with post hoc testing by Dunnett’s multiple comparisons test or two-sided unpaired Student’s t-test (f: P = 0.1162; h: P = 0.7052).
Extended Data Fig. 9. Disrupting SNPH-mediated Anchoring Abolishes the Role of PAK-myo6 in Maintaining Synaptic Transmission.

a,b, Normalized EPSC amplitudes plotted against stimulus number showing that activation of PAK-myo6 pathway facilitates short-term synaptic depression in WT (a), but not in snph KO neurons (b). Dual whole-cell patch-clamp recordings were performed on paired WT or snph KO cortical neurons infected with GFP, GFP-tagged myo6, myo6-T405E. High-frequency (50 Hz, 200 msec) pulse trains were delivered to presynaptic neurons. Two-way ANOVA revealed a main effect of gene manipulation in WT neurons (F2, 61 = 5.319, P = 0.0074) (a), but no main effect in snph KO neurons (F2, 73 = 0.08927, P = 0.9147) (b). Data were quantified from total pairs of neurons indicated in parentheses and expressed as mean ± SEM. (c) Activation of PAK-myo6 signaling axis in snph KO neurons failed to accelerate synaptic recovery after high-frequency stimulation. snph KO cortical neurons were infected with GFP, GFP-tagged myo6-WT, myo6-T405E, or PAK-T421E (PAK3-CA) at DIV5, following by dual whole-cell patch clamp recording at DIV14–18. Recording configuration (total 132 sec duration) consists of a 2-sec 100 Hz train, a 10-sec recovery phase of four stimuli, and a 120-sec rest phase. The normalized EPSCs amplitude is plotted for the first of each HFS and for each of the recovery EPSCs for each condition. Two-way ANOVA revealed no main effect of gene manipulation in snph KO neurons (F3, 57 = 0.5787, P = 0.6314). Data were quantified from total pairs of neurons indicated in parentheses and expressed as mean ± SEM.
Extended Data Fig. 10. Presynaptic Mitochondria Contribute to the Recovery of Synaptic Efficacy During Prolonged Synaptic Activity.

a, Normalized EPSC amplitudes showing mitochondrial capacity of calcium clearance contributes to synaptic recovery after high-frequency stimulation (HFS). Cortical neurons were used for dual whole-cell patch clamp recording at DIV14–18. The mitochondrial calcium uniporter inhibitor RU360 (10 μM) was added to the intracellular recording solution to block mitochondrial calcium buffering capacity. Recording configuration (total 132 sec duration) consisted of a 2-sec 100 Hz train, a 10-sec recovery phase of four stimuli, and a 120-sec rest phase. The normalized EPSC amplitude was plotted for the first of each HFS and for each of the recovery EPSCs under each condition. Note that the application of RU360 induced a slower synaptic recovery after HFS. Two-way ANOVA revealed a main effect of RU360 treatment (F1, 41 = 10.64, P = 0.0022) and a significant interaction between RU360 treatment and stimuli (F14, 574 = 9.457, P < 0.001). b, Normalized EPSC amplitudes showing that myo6-SNPH-captured presynaptic mitochondria significantly contribute to synaptic recovery after HFS even their calcium buffering capacity is blocked. Cortical neurons were infected with lentiviruses encoding GFP, GFP-tagged myo6 and myo6-T405E, followed by dual whole-cell patch clamp recording at DIV14–18. 10 μM RU360 was applied to intracellular recording solution. The same recording configuration was used as described above. Note that enhanced presynaptic mitochondria anchoring through activating myo6-PAK pathway accelerates synaptic recovery after HFS even when calcium buffering capacity is blocked. Two-way ANOVA revealed a main effect of gene manipulation (F2, 60 = 3.506, P = 0.0363) and a significant interaction between gene manipulation and stimuli (F28, 840 = 2.074, P = 0.001). Data were quantified from the total pairs of neurons indicated in parentheses, and presented as mean ± SEM.
Acknowledgments
We thank members of the Sheng lab for constructive discussion; K. A. Chamberlain and J. C. Roney for critical reading and editing; K. Remmert and J. Hammer (NHLBI, NIH) for advice on actin co-sedimentation assay; H. Imamura (Kyoto University), R. Youle (NINDS, NIH), J. Hammer (NHLBI, NIH), J. Kendrick-Jones (MRC-LMB), F. Buss (University of Cambridge), D-Y. Jin (The University of Hong Kong), G. Voeltz (University of Colorado), M. Matsuda (Kyoto University) and D. Trono (EPFL) for sharing constructs; and the NINDS EM Facility and Light Imaging Facility. This work was supported by the Intramural Research Program of NINDS, NIH ZIA NS003029, and ZIA NS002946 (Z-H. Sheng).
Footnotes
Competing interests
All authors declare no competing interests.
REFERENCES
- 1.Harris JJ, Jolivet R & Attwell D Synaptic energy use and supply. Neuron 75, 762–777, (2012). [DOI] [PubMed] [Google Scholar]
- 2.Sheng ZH The interplay of axonal energy homeostasis and mitochondrial trafficking and anchoring. Trends Cell Biol. 27, 403–416, (2017). [DOI] [PMC free article] [PubMed] [Google Scholar]
- 3.Devine MJ & Kittler JT Mitochondria at the neuronal presynapse in health and disease. Nat. Rev. Neurosci 19, 63–80, (2018). [DOI] [PubMed] [Google Scholar]
- 4.Sun T, Qiao H, Pan PY, Chen Y & Sheng ZH Motile axonal mitochondria contribute to the variability of presynaptic strength. Cell Rep. 4, 413–419, (2013). [DOI] [PMC free article] [PubMed] [Google Scholar]
- 5.Ashrafi G & Ryan TA Glucose metabolism in nerve terminals. Curr. Opin. Neurobiol 45, 156–161, (2017). [DOI] [PMC free article] [PubMed] [Google Scholar]
- 6.Hubley MJ, Locke BR & Moerland TS The effects of temperature, pH, and magnesium on the diffusion coefficient of ATP in solutions of physiological ionic strength Biochim. Biophys. Acta 1291, 115–121, (1996). [DOI] [PubMed] [Google Scholar]
- 7.Verstreken P et al. Synaptic mitochondria are critical for mobilization of reserve pool vesicles at Drosophila neuromuscular junctions. Neuron 47, 365–378, (2005). [DOI] [PubMed] [Google Scholar]
- 8.Smith HL et al. Mitochondrial support of persistent presynaptic vesicle mobilization with age-dependent synaptic growth after LTP. eLife 5, e15275, (2016). [DOI] [PMC free article] [PubMed] [Google Scholar]
- 9.Pathak D, Berthet A & Nakamura K Energy failure - does it contribute to neurodegeneration? . Ann. Neurol 74, 506–516, (2013). [DOI] [PMC free article] [PubMed] [Google Scholar]
- 10.Cingolani LA & Goda Y Actin in action: the interplay between the actin cytoskeleton and synaptic efficacy. Nat. Rev. Neurosci 9, 344–356, (2008). [DOI] [PubMed] [Google Scholar]
- 11.Morris RL & Hollenbeck PJ Axonal transport of mitochondria along microtubules and F-actin in living vertebrate neurons. J. Cell Biol 131, 1315–1326, (1995). [DOI] [PMC free article] [PubMed] [Google Scholar]
- 12.Chada SR & Hollenbeck PJ Nerve growth factor signaling regulates motility and docking of axonal mitochondria. Curr. Biol 14, 1272–1276, (2004). [DOI] [PubMed] [Google Scholar]
- 13.Hirokawa N & Takemura R Molecular motors and mechanisms of directional transport in neurons. Nat. Rev. Neurosci 6, 201–214, (2005). [DOI] [PubMed] [Google Scholar]
- 14.Quintero OA et al. Human Myo19 is a novel myosin that associates with mitochondria. Curr. Biol 19, 2008–2013, (2009). [DOI] [PMC free article] [PubMed] [Google Scholar]
- 15.Wang X & Schwarz TL The mechanism of Ca2+ -dependent regulation of kinesin-mediated mitochondrial motility. Cell 136, 163–174, (2009). [DOI] [PMC free article] [PubMed] [Google Scholar]
- 16.MacAskill AF et al. Miro1 is a calcium sensor for glutamate receptor-dependent localization of mitochondria at synapses. Neuron 61, 541–555, (2009). [DOI] [PMC free article] [PubMed] [Google Scholar]
- 17.Sheng ZH Mitochondrial trafficking and anchoring in neurons: New insight and implications. J. Cell Biol 204, 1087–1098, (2014). [DOI] [PMC free article] [PubMed] [Google Scholar]
- 18.Kang JS et al. Docking of Axonal Mitochondria by Syntaphilin Controls Their Mobility and Affects Short-Term Facilitation. Cell 132, 137–148, (2008). [DOI] [PMC free article] [PubMed] [Google Scholar]
- 19.Zhou B et al. Facilitation of axon regeneration by enhancing mitochondrial transport and rescuing energy deficits. J. Cell Biol 214, 103–119, (2016). [DOI] [PMC free article] [PubMed] [Google Scholar]
- 20.Chen Y & Sheng ZH Kinesin-1-syntaphilin coupling mediates activity-dependent regulation of axonal mitochondrial transport. J. Cell Biol 202, 351–364, (2013). [DOI] [PMC free article] [PubMed] [Google Scholar]
- 21.Gutnick A, Banghart MR, West ER & Schwarz TL The light-sensitive dimerizer zapalog reveals distinct modes of immobilization for axonal mitochondria. Nat. Cell Biol 21, 768–777, (2019). [DOI] [PMC free article] [PubMed] [Google Scholar]
- 22.Xiao B et al. Structural basis of AMP binding to mammalian AMP-activated protein kinase. Nature 449, 496–500, (2007). [DOI] [PubMed] [Google Scholar]
- 23.Bokoch GM Biology of the p21-activated kinases. Annu. Rev. Biochem 72, 743–781, (2003). [DOI] [PubMed] [Google Scholar]
- 24.Meng J, Meng Y, Hanna A, Janus C & Jia Z Abnormal Long-Lasting Synaptic Plasticity and Cognition in Mice Lacking the Mental Retardation Gene Pak3. J. Neurosci 25, 6641–6650, (2005). [DOI] [PMC free article] [PubMed] [Google Scholar]
- 25.Kong D et al. A Postsynaptic AMPK-->p21-Activated Kinase Pathway Drives Fasting-Induced Synaptic Plasticity in AgRP Neurons. Neuron 91, 25–33, (2016). [DOI] [PMC free article] [PubMed] [Google Scholar]
- 26.Pathak D et al. The role of mitochondrially derived ATP in synaptic vesicle recycling. J. Biol. Chem 290, 22325–22336, (2015). [DOI] [PMC free article] [PubMed] [Google Scholar]
- 27.Nakano M, Imamura H, Nagai T & Noji H Ca2+ regulation of mitochondrial ATP synthesis visualized at the single cell level. ACS Chem. Biol 6, 709–715, (2011). [DOI] [PubMed] [Google Scholar]
- 28.Vaccaro V, Devine MJ, Higgs NF & Kittler JT Miro1-dependent mitochondrial positioning drives the rescaling of presynaptic Ca2+ signals during homeostatic plasticity. EMBO Rep. 18, 231–240, (2017). [DOI] [PMC free article] [PubMed] [Google Scholar]
- 29.Yu DF et al. HFS-Triggered AMPK Activation Phosphorylates GSK3beta and Induces E-LTP in Rat Hippocampus In Vivo. CNS Neurosci. Ther 22, 525–531, (2016). [DOI] [PMC free article] [PubMed] [Google Scholar]
- 30.Marinageli C et al. AMP-activated protein kinase is essential for the maintenance of energy levels during synaptic activation. iScience 9, 1–13, (2018). [DOI] [PMC free article] [PubMed] [Google Scholar]
- 31.Konagaya Y et al. A Highly Sensitive FRET Biosensor for AMPK Exhibits Heterogeneous AMPK Responses among Cells and Organs. Cell Rep. 21, 2628–2638, (2017). [DOI] [PubMed] [Google Scholar]
- 32.Hurley RL et al. The Ca2+/calmodulin-dependent protein kinase kinases are AMP-activated protein kinase kinases. J. Biol. Chem 280, 29060–29066, (2005). [DOI] [PubMed] [Google Scholar]
- 33.Woods A et al. Ca2+/calmodulin-dependent protein kinase kinase-beta acts upstream of AMP-activated protein kinase in mammalian cells. Cell Metab. 2, 21–33, (2005). [DOI] [PubMed] [Google Scholar]
- 34.Herzig S & Shaw RJ AMPK: guardian of metabolism and mitochondrial homeostasis. Nat. Rev. Mol. Cell Biol 19, 121–135, (2018). [DOI] [PMC free article] [PubMed] [Google Scholar]
- 35.Corton JM, Gillespie JG, Hawley SA & Hardie DG 5-Aminoimidazole-4-carboxamide ribonucleoside A specific method for activating AMP-activated protein kinase in intact cells? Eur. J. Biochem 229, 558–565, (1995). [DOI] [PubMed] [Google Scholar]
- 36.Hamann JC et al. Entosis is induced by glucose starvation. Cell Rep. 20, 201–210, (2017). [DOI] [PMC free article] [PubMed] [Google Scholar]
- 37.Sheng ZH & Cai Q Mitochondrial transport in neurons impact on synaptic homeostasis and neurodegeneration. Nat. Rev. Neurosci 13, 77–93, (2012). [DOI] [PMC free article] [PubMed] [Google Scholar]
- 38.Coles CH & Bradke F Coordinating neuronal actin-microtubule dynamics. Curr. Biol 25, R677–691, (2015). [DOI] [PubMed] [Google Scholar]
- 39.Osterweil E, Wells DG & Mooseker MS A role for myosin VI in postsynaptic strcture and glutamate receptor endocytosis. J Cell Biol. 168, 329–338, (2005). [DOI] [PMC free article] [PubMed] [Google Scholar]
- 40.Yano H et al. BDNF-mediated neurotransmission relies upon a myosin VI motor complex. Nat. Neurosci 9, 1009–1018, (2006). [DOI] [PubMed] [Google Scholar]
- 41.Pathak D, Sepp KJ & Hollenbeck PJ Evidence that myosin activity opposes microtubule-based axonal transport of mitochondria. J. Neurosci 30, 8984–8992, (2010). [DOI] [PMC free article] [PubMed] [Google Scholar]
- 42.Morton WM, Ayscough KR & McLaughlin PJ Latrunculin alters the actin-monomer subunit interface to prevent polymerization. Nat. Cell Biol 2, 376–378, (2000). [DOI] [PubMed] [Google Scholar]
- 43.Tumbarello DA, Kendrick-Jones J & Buss F Myosin VI and its cargo adaptors - linking endocytosis and autophagy. J. Cell Sci 126, 2561–2570, (2013). [DOI] [PMC free article] [PubMed] [Google Scholar]
- 44.Srivastava J & Barber D Actin co-sedimentation assay; for the analysis of protein binding to F-actin. J. Vis. Exp 13, e690, (2008). [DOI] [PMC free article] [PubMed] [Google Scholar]
- 45.Sjoblom B, Salmazo A & Djinovic-Carugo K Alpha-actinin structure and regulation. Cell. Mol. Life Sci 65, 2688–2701, (2008). [DOI] [PMC free article] [PubMed] [Google Scholar]
- 46.Alam MS Proximity Ligation Assay (PLA). Curr. Protoc. Immunol 123, e58, (2018). [DOI] [PMC free article] [PubMed] [Google Scholar]
- 47.Masters TA, Tumbarello DA, Chibalina MV & Buss F MYO6 Regulates Spatial Organization of Signaling Endosomes Driving AKT Activation and Actin Dynamics. Cell Rep. 19, 2088–2101, (2017). [DOI] [PMC free article] [PubMed] [Google Scholar]
- 48.Lin MY et al. Releasing Syntaphilin Removes Stressed Mitochondria from Axons Independent of Mitophagy under Pathophysiological Conditions. Neuron 94, 595–610 e596, (2017). [DOI] [PMC free article] [PubMed] [Google Scholar]
- 49.Spudich G et al. Myosin VI targeting to clathrin-coated structures and dimerization is mediated by binding to Disabled-2 and PtdIns(4,5)P2. Nat. Cell Biol 9, 176–183, (2007). [DOI] [PMC free article] [PubMed] [Google Scholar]
- 50.Thevenot E et al. p21-Activated kinase 3 (PAK3) protein regulates synaptic transmission through its interaction with the Nck2/Grb4 protein adaptor. J. Biol. Chem 286, 40044–40059, (2011). [DOI] [PMC free article] [PubMed] [Google Scholar]
- 51.Campbell HK, Salvi AM, O’Brien T, Superfine R & DeMali KA PAK2 links cell survival to mechanotransduction and metabolism. J. Cell Biol 218, 1958–1971, (2019). [DOI] [PMC free article] [PubMed] [Google Scholar]
- 52.Buss F et al. The localization of myosin VI at the golgi complex and leading edge of fibroblasts and its phosphorylation and recruitment into membrane ruffles of A431 cells after growth factor stimulation. J. Cell Biol 143, 1535–1545, (1998). [DOI] [PMC free article] [PubMed] [Google Scholar]
- 53.Brooks AB et al. MYO6 is targeted by Salmonella virulence effectors to trigger PI3-kinase signaling and pathogen invasion into host cells. Proc. Natl. Acad. Sci. U. S. A 114, 3915–3920, (2017). [DOI] [PMC free article] [PubMed] [Google Scholar]
- 54.Huang W et al. p21-Activated kinases 1 and 3 control brain size through coordinating neuronal complexity and synaptic properties. Mol. Cell. Biol 31, 388–403, (2011). [DOI] [PMC free article] [PubMed] [Google Scholar]
- 55.Lei M et al. Structure of PAK1 in an autoinhibited conformation reveals a multistage activation switch. Cell 102, 387–397, (2000). [DOI] [PubMed] [Google Scholar]
- 56.Deacon SW et al. An isoform-selective, small-molecule inhibitor targets the autoregulatory mechanism of p21-activated kinase. . Chem. Biol 15, 322–331, (2008). [DOI] [PMC free article] [PubMed] [Google Scholar]
- 57.Di Giovanni J & Sheng ZH Regulation of synaptic activity by snapin-mediated endolysosomal transport and sorting. . EMBO J. 34, 2059–2077, (2015). [DOI] [PMC free article] [PubMed] [Google Scholar]
- 58.Zucker RS & Regehr WG Short-term synaptic plasticity. Annu. Rev. Physiol 64, 355–405, (2002). [DOI] [PubMed] [Google Scholar]
- 59.Rangaraju V, Calloway N & Ryan TA Activity-driven local ATP synthesis is required for synaptic function. Cell 156, 825–835, (2014). [DOI] [PMC free article] [PubMed] [Google Scholar]
- 60.MacAskill AF, Atkin TA & Kittler JT Mitochondrial trafficking and the provision of energy and calcium buffering at excitatory synapses. Eur. J. Neurosci 32, 231–240, (2010). [DOI] [PubMed] [Google Scholar]
- 61.Billups B & Forsythe ID Presynaptic mitochondrial calcium sequestration influences transmission at mammalian central synapses. J Neurosci. 22, 5840–5847, (2002). [DOI] [PMC free article] [PubMed] [Google Scholar]
- 62.López-Doménech G et al. Miro proteins coordinate microtubule- and actin-dependent mitochondrial transport and distribution. EMBO J. 37, 321–336, (2018). [DOI] [PMC free article] [PubMed] [Google Scholar]
- 63.Xu K, Zhong G & Zhuang X Actin, spectrin, and associated proteins form a periodic cytoskeletal structure in axons. Science 339, 452–456, (2013). [DOI] [PMC free article] [PubMed] [Google Scholar]
- 64.Ganguly A et al. A dynamic formin-dependent deep F-actin network in axons. J. Cell Biol 210, 401–417, (2015). [DOI] [PMC free article] [PubMed] [Google Scholar]
- 65.Kruppa AJ et al. Myosin VI-Dependent Actin Cages Encapsulate Parkin-Positive Damaged Mitochondria. Dev. Cell 44, 484–499.e486, (2018). [DOI] [PMC free article] [PubMed] [Google Scholar]
- 66.Chang DT, Honick AS & Reynolds IJ Mitochondrial trafficking to synapses in cultured primary cortical neurons. J. Neurosci 26, 7035–7045, (2006). [DOI] [PMC free article] [PubMed] [Google Scholar]
- 67.Nguyen TT et al. Loss of Miro1-directed mitochondrial movement results in a novel murine model for neuron disease. Proc. Natl. Acad. Sci. U. S. A 111, E3631–3640, (2014). [DOI] [PMC free article] [PubMed] [Google Scholar]
- 68.Courchet J et al. Terminal axon branching is regulated by the LKB1-NUAK1 kinase pathway via presynaptic mitochondrial capture. Cell 153, 1510–1525, (2013). [DOI] [PMC free article] [PubMed] [Google Scholar]
- 69.Tao K, Matsuki N & Koyama R AMP-activated protein kinase mediates activity-dependent axon branching by recruiting mitochondria to axon. Dev. Neurobiol 74, 557–573, (2014). [DOI] [PubMed] [Google Scholar]
- 70.Friel DD & Tsien RW An FCCP-sensitive Ca2+ store in bullfrog sympathetic neurons and its participation in stimulus-evoked changes in [Ca2+]i. J Neurosci. 14, 4007–4024, (1994). [DOI] [PMC free article] [PubMed] [Google Scholar]
- 71.Tang Y & Zucker RS Mitochondrial involvement in post-tetanic potentiation of synaptic transmission. Neuron 18, 483–491, (1997). [DOI] [PubMed] [Google Scholar]
- 72.Virmani T, Atasoy D & Kavalali ET Synaptic vesicle recycling adapts to chronic changes in activity. J Neurosci. 26, 2197–2206, (2006). [DOI] [PMC free article] [PubMed] [Google Scholar]
- 73.Jonas EA et al. Modulation of synaptic transmission by the BCL-2 family protein BCL-xL. J Neurosci 23, 8423–8431, (2003). [DOI] [PMC free article] [PubMed] [Google Scholar]
- 74.Sakaba T & Neher E Calmodulin mediates rapid recruitment of fast-releasing synaptic vesicles at a calyx-type synapse. Neuron 32, 1119–1131, (2001). [DOI] [PubMed] [Google Scholar]
- 75.Vingtdeux V, Davies P, Dickson DW & Marambaud P AMPK is abnormally activated in tangle- and pre-tangle-bearing neurons in Alzheimer’s disease and other tauopathies. Acta Neuropathol. 121, 337–349, (2011). [DOI] [PMC free article] [PubMed] [Google Scholar]
- 76.Pickett EK et al. Region-specific depletion of synaptic mitochondria in the brains of patients with Alzheimer’s disease. Acta Neuropathol. 136, 747–757, (2018). [DOI] [PMC free article] [PubMed] [Google Scholar]
- 77.Chen YM, Gerwin C & Sheng ZH Dynein light chain LC8 regulates syntaphilin-mediated mitochondrial docking in axons. J. Neurosci 29, 9429–9438, (2009). [DOI] [PMC free article] [PubMed] [Google Scholar]
Associated Data
This section collects any data citations, data availability statements, or supplementary materials included in this article.
Data Availability Statement
Further information and requests for resources and reagents should be directed to and will be fulfilled by the corresponding author Zu-Hang Sheng (shengz@ninds.nih.gov). The raw data sets generated and/or analyzed during the current study are available from the corresponding author upon reasonable request. Source data are provided with this paper.