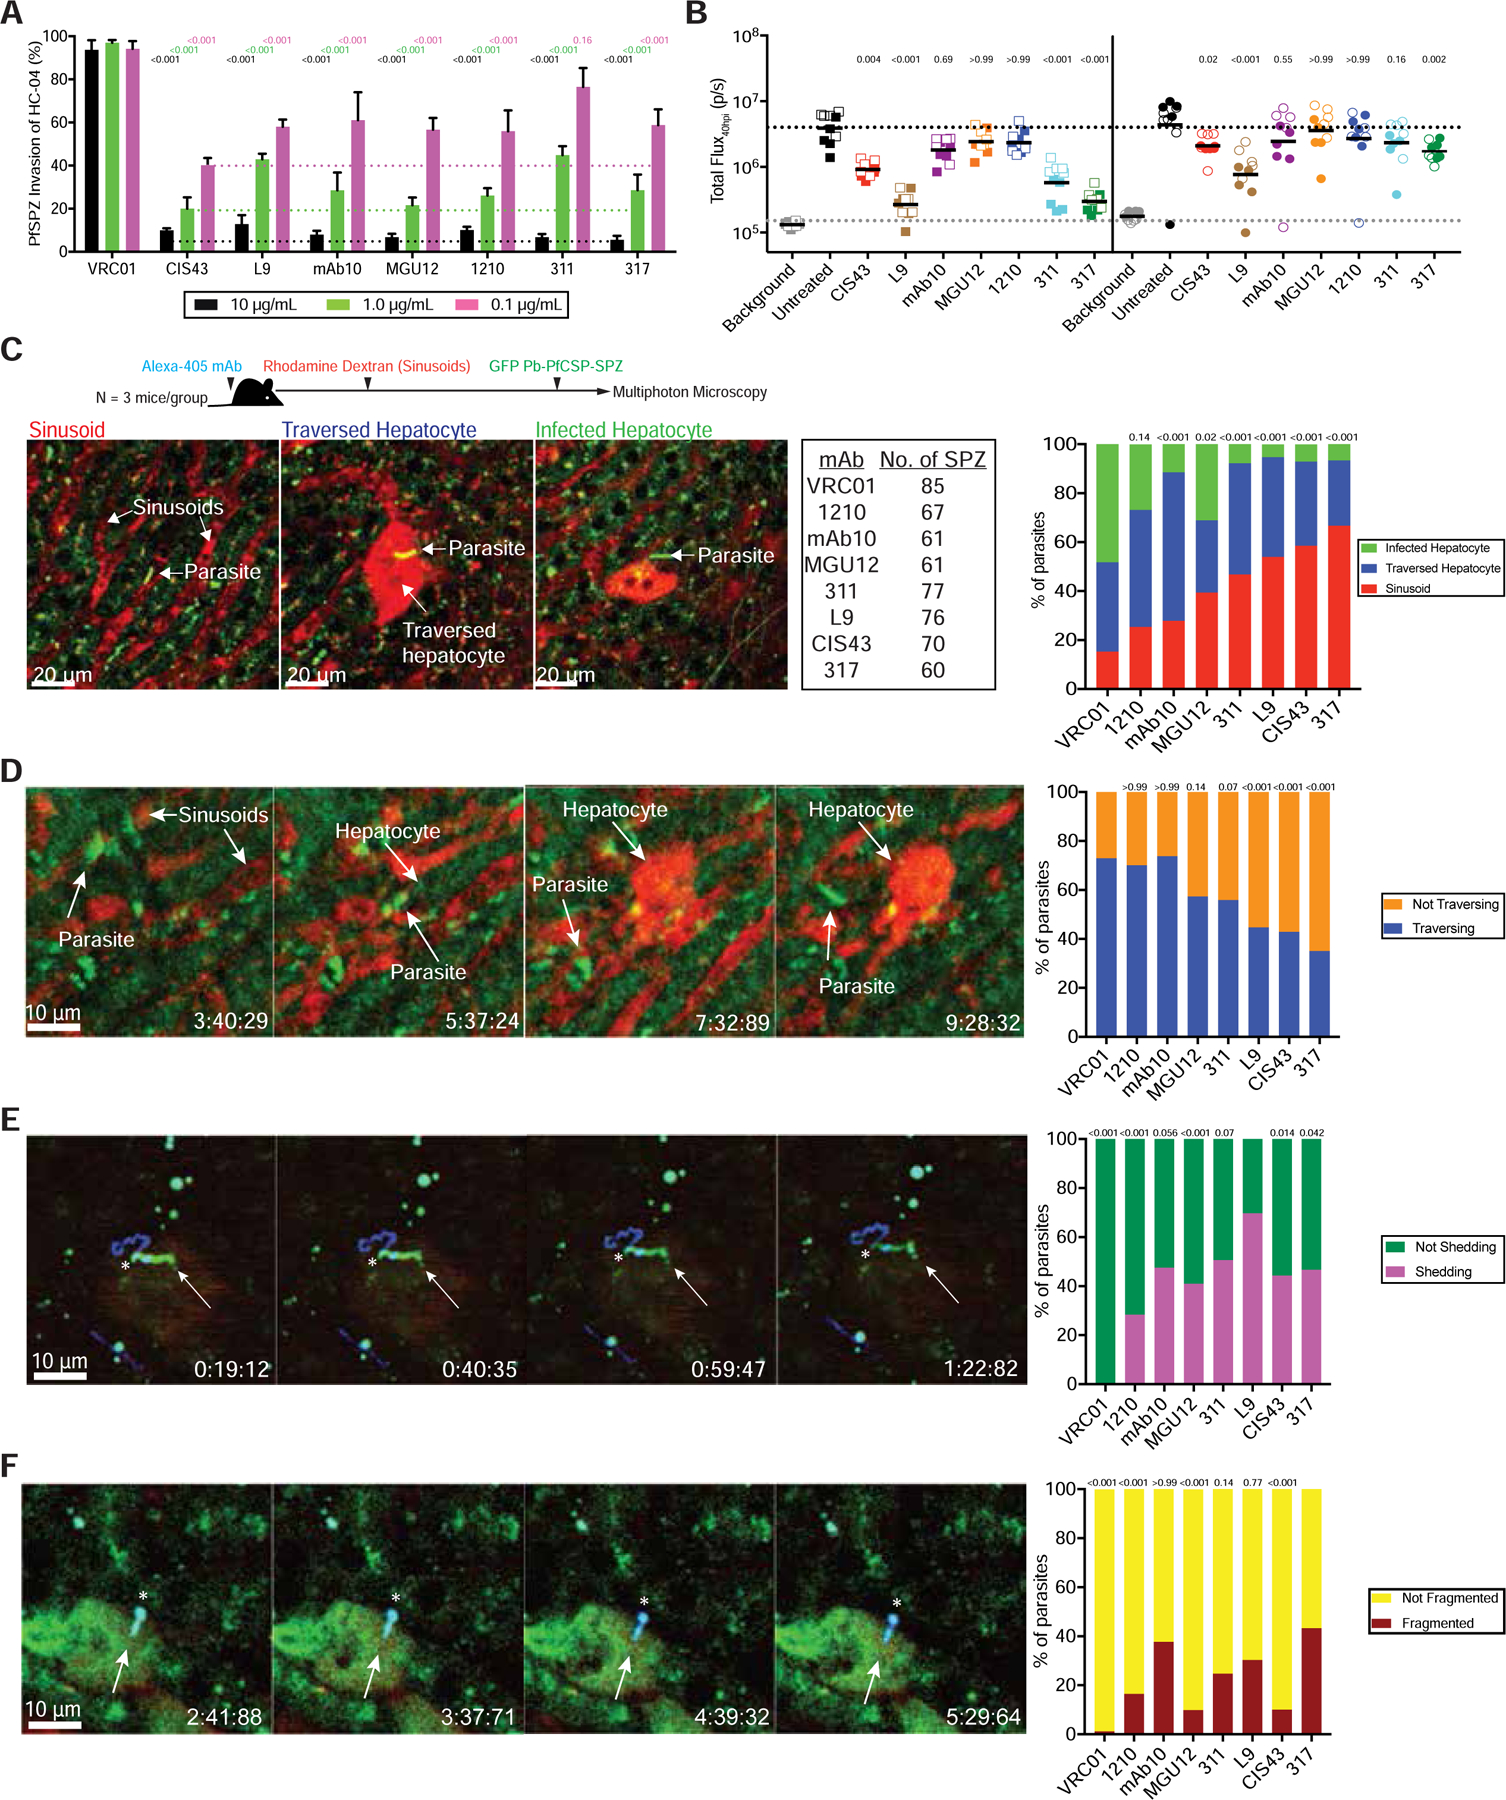
Figure 3. Cytotoxic PfCSP mAbs prevent SPZ from accessing and invading hepatocytes.

(A) Inhibition of PfSPZ invasion of HC-04 hepatocytes by 10, 1.0, and 0.1 µg/mL PfCSP mAbs. Data were combined from two independent experiments (triplicate wells/mAb). Bars represent the mean ± SEM; dotted lines indicate the highest mAb-mediated inhibition at each concentration. Each mAb was compared to the corresponding concentration of VRC01 using a two-way ANOVA with Bonferroni’s correction. (B) Liver burden reduction in mice 40 hpi (n=10/group; data pooled from two independent experiments, solid vs. open symbols; line represents geometric mean) mediated by 75 (squares) or 25 (circles) µg/mouse mAb administered 2 hours before IV challenge with 2,000 Pb-PfCSP-GFP/Luc-SPZ. Dotted lines indicate the geometric mean of the background and untreated controls. P-values were determined by comparing each mAb to untreated using the Kruskal-Wallis test with Dunn’s post-hoc correction. (C) Left: schema for intravital liver imaging in mice (N=3/group) sequentially administered 30 µg Alexa405-labeled mAb (blinded), 1 µg rhodamine-labeled dextran, and 100,000 Pb-PfCSP-GFP-SPZ. The number of SPZ (No. of SPZ) observed across the 3 independent experiments per mAb were combined for analysis. The locations of individual Pb-PfCSP-SPZ were noted; traversal was detected by dextran uptake into wounded hepatocytes. Representative images depict discrete Pb-PfCSP-SPZ in the sinusoid, traversing a dextran+ hepatocyte, or invading a dextran− hepatocyte. Right: locations of Pb-PfCSP-SPZ in the liver calculated as the percentage of total SPZ observed. (D-F) Left: representative time-lapse images (min:s:ms) of discrete Pb-PfCSP-SPZ (D) exiting a sinusoid and traversing a hepatocyte, (E) shedding a mAb-bound PfCSP tail in a CSPR, and (F) undergoing dotty death. Right: percentages of Pb-PfCSP-SPZ that (D) initiated traversal (i.e., traversed ≥1 hepatocyte), (E) underwent a CSPR, and (F) underwent dotty death. C-F: P-values were determined by comparing each mAb to VRC01, L9, or 317 using the chi-squared test with Bonferroni’s correction. E-F: arrow and star respectively indicate anterior and posterior ends of SPZ. See also Figure S3; Table S4.
