

Abstract
One of the forerunners that pioneered the revolution of high throughput genomic technologies is the genotyping microarray technology, which can genotype up to millions of single nucleotide variants simultaneously. Owing to apparent benefits such as high speed, low cost, and high throughput, the genotyping array has gained lasting applications in genome-wide association studies (GWAS) and thus accumulated an enormous amount of data. Empowered by the continuous manufactural upgrade and analytical innovation, unconventional applications of genotyping array data have emerged to address more diverse genetic problems, thus holding promise for boosting genetic research of human diseases through the re-mining of the rich accumulated data. Here, we review several unconventional genotyping array analysis techniques that have been built on the idea of large-scale multi-variant analysis and provide empirical application examples. These unconventional outcomes of genotyping arrays include polygenic score, runs of homozygosity/heterozygosity ratio, distant pedigree computation, and mitochondrial DNA copy number inference.
The Genotyping Array and Its Place in Genetic Discovery
High throughput genomic technology has been the driving force for biomedical research over the last twenty years. One of the first high throughput genomic technologies discovered was the microarray hybridization based genotyping array, which served as the backbone of the genome wide association studies (GWAS) during the GWAS era. As of March 2020, 4,298 GWAS have established 161,525 associations between 105,388 SNPs and 4,314 traits, as recorded by The NHGRI-EBI GWAS Catalog [1]. All 4,298 GWAS were conducted using genotyping arrays.
Even after high-throughput sequencing became the new standard of genomic studies, the genotyping array has retained a substantial role. At approximately one-tenth of the price of exome sequencing, the genotyping array remains an attractive instrument in large scale genetic studies, where the sequencing cost for tens of hundreds of subjects would be formidable. In addition, the evolving probe designs extend the research scope offered by SNP arrays. The old genotyping array designs targeting common variants did not focus on protein coding regions of the genome. For example, as one of the most popular instruments in the peak of the GWAS era, the Affymetrix Genome-Wide Human SNP Array 6.0 contained 906,600 SNPs, with only 1% of these variants located in the protein coding region. In the post-GWAS era, new generation arrays have shifted focus to exome and rare variants [2]. A typical example is the Illumina Infinium Exome Chip that was designed to target rare variants in the exome region. However, the processing of genotyping calls for rare variants introduced new complexities in quality control [2]. Lastly, the genome coverage can be extended up to 48 million variants by imputation [3]. Taken together, the continuous demand from researchers for cost-effective instruments, the steady bioinformatics support from the community, and the soaring capability to expand the data by imputation are all effective factors to prolong the influence of SNP arrays on genomic studies [2, 4–6].
According to PubMed publication records, genotyping arrays have resisted the technical superiority and growing popularity of exome sequencing to exert a prolonged superior influence on biomedical research as evidenced by the higher number of publications compared to exome sequencing (Figure 1). This observation may be surprising at first sight, but it can be reasonably attributed to the vast amount of genotyping data accumulated years before the onset of exome sequencing, as well as the higher cost of sequencing. It is a general trend that rapid accumulation of omics data calls forth alternative, innovative use of historical data. For example, alternative data mining methods and protocols using exome sequencing [7] and RNA-Seq [8, 9] data have been established and improved gradually. Likewise, the myriad of genotyping data accumulated also provides exciting new opportunities for secondary or alternative applications. While SNP data are conventionally used in GWAS, simply to compute SNP-trait or copy number-trait associations (Figure 2A), other multi-omic applications such as gene expression quantitative loci (eQTL) and methylation quantitative loci (meQTL) have recently become common (Figure 2B). Here, we outline a few less well-known applications of genotyping array data, all based on the idea of using the combined information from multiple genotyped variants, often at the genome level (Figure 2, C-F). We give empirical examples and methodological briefs, hoping to incite new research that takes advantage of the broad potential of genotyping array data.
Figure 1:

Momentum of genotype-centric studies/data in GWAS and post-GWAS era (1998-2019). Despite a declining trend past the peak year 2015, genotyping array based publications still largely surpass exome sequencing based publications in quantity. The growth of dbSNP is in line with the growth of genotyping and exome sequencing publications. The left y-axis denotes the number of publications (red), right y-axis denotes number of SNPs in dbSNP (blue), and x-axis denotes the year. When searching for genotyping array manuscripts, key words “genotyping array” or “SNP array” were used. When searching for exome sequencing manuscripts, key word “exome sequencing” was used.
Figure 2:
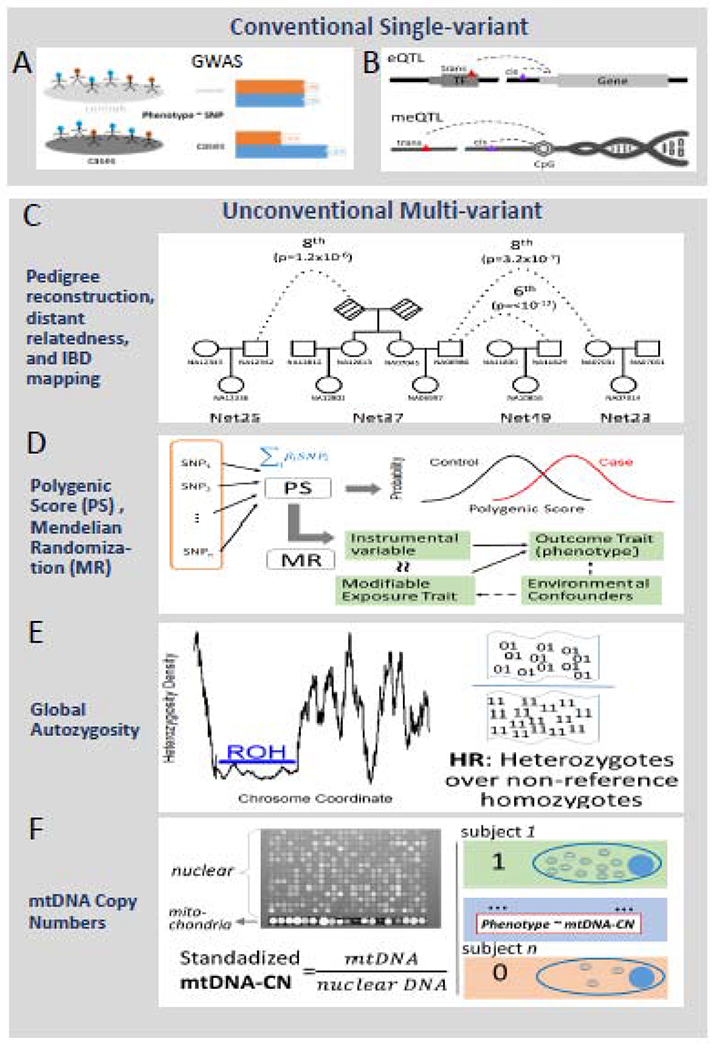
The overall concept of unconventional multi-variant approaches. The top panel of two horizontally arranged charts describes the most conventional single variant usage of SNP data which includes A) GWAS and B) eQTL/meQTL analysis. Of note, technically, eQTL and meQTL can be extended to a multi-variant manner, because multiple SNPs can be used to predict gene expression or methylation to increase accuracy. The bottom panel of four vertically arranged charts describes four major multi-variant methods in this review. From top to bottom, there are distant pedigree reconstruction, polygenic score with Mendelian randomization, global autozygosity, and mtDNA copy number. C) Pedigees and distant relationships that can be reconstructed from estimates of pairwise relatedness and leveraged in analysis of geneaology, population demographics and history, estimates of heritability, and family based disease gene mapping approaches. D) Polygenic scores are constructed from multiple SNPs with weights from previous GWAS studies. The polygenic score is essentially a genetic trait which can be used as standard case-control studies as demonstrated by the two normal distribution density curves. Or it can be used for Mendelian randomization studies. E) For global autozygosity, there are two major measurements, one for homozygosity as in Runs of Homozygosity and another for heterozygosity as in heterozygosity ratio. Runs of homozygosity describes long segments of the genome with no heterozygous SNPs as demonstrated in the genome coordinate vs heterozygosity density plot. The heterozygosity ratio is demonstrated as the ratio between the number of heterozygous SNP (“01”) vs the number of non-reference homozygous SNPs (“11”). F) The mitochondria copy number can be inferred from fluorescent intensity. Typically, the mitochondria probes have stronger signals than nuclear probes as demonstrated in the microarray figure. Based on this fact, the relative mtDNA copy number can be estimated and it can be further analyzed for association with a phenotype trait.
Population Structure Inference and Admixture Mapping
Early in the development of GWAS methods [10], it was realized that population substructure could greatly bias association studies, leading to the development of methods to limit the effects of population substructure through adding genetic principal component adjustments or simply restricting GWAS cohorts to a single racial and ethnic group. However, this sensitivity also points out the ability to use GWAS genotyping data to detect that population structure. Generally, this is done through clustering methods applied to genotyped cohorts, combined with either demographic or geographic data to interpret the meaning of the statistically defined clusters. These methods have found great use in anthropological and historical studies of population migration and mergers. A study [11] used Identity-by-Descent (IBD) clustering of 770,000 genotyped North Americans to genetically describe the migration of Europeans to North America over the past few hundred years. IBD-based methods are only useful for very recent population developments. Another study [12] used a very different method of iteratively pruned Principal Component Analysis to investigate the much older population structure of West Africa.
Admixture Mapping is essentially the reverse approach to that described in the previous paragraph. Instead of clustering the genetics of large numbers of individuals within a population, admixture mapping clusters the genetics of a single individual, in comparison to reference populations [13]. As with IBD-based methods, admixture mapping is only feasible for capturing recent population changes, within the past few hundred years. Admixture mapping identifies sections of chromosomes that have been inherited through ancestors from distinct global populations, such as Africa and Europe. This is one of the oldest usages of multi-variant genotyping data. In 2003, a study [14] used admixture mapping to identify genetic loci involved in systemic lupus. These examples show how an early quality control method for GWAS developed into a valuable research tool to extract complex information from GWAS genotyping data.
Pedigree Reconstruction and Identical-by-Descent Segment Mapping
Similar to its use in population structure reconstruction, array-based genetic data can be leveraged in pedigree reconstruction to more accurately predict genetic relationships, find the correct pedigree, and identify cryptic relatedness [15] (Figure 2C). In addition to improving the characterization of family and population histories [16], genetic relationships identified using array-based data can improve haplotype phase inference, detection of population structure, and genotype imputation [17–19]. Study designs such as identity-by-descent (IBD) mapping and tests to detect multiple rare and common variants that contribute to disease also leverage genomic sharing due to relationships [20, 21].
Genome-wide estimates of pairwise genotype sharing from genotyping array data can be used to ascertain the likely degree of relationship between pairs of individuals [15, 22]. These relationships can be used to break a cohort into discrete networks of people who are related to one another above a user-defined threshold and to reconstruct pedigrees for each network by adding individuals sequentially in positions genetically consistent with the degree of relationship. Knowledge of pedigrees enables traditional family-based genetic approaches such as LINKAGE [23], family-based association tests [24], or transmission disequilibrium tests [25], that have contributed enormously to mapping thousands of genes with phenotype-causing mutations [26]. Pedigrees can also be leveraged in generalized estimating equations that model family data and produce unbiased association results in the presence of complex data ascertainment strategies (e.g. collection by household and/or recent admixture) [27]. For example, pedigree reconstruction and relatedness estimation approaches were recently used to reconstruct 12,574 pedigrees from 92,455 people in the DiscovEHR cohort for multiple applications [28]. The identified pedigrees substantially improved the phasing accuracy of more than 20,000 sequenced rare, deleterious compound heterozygous mutations, and reconstructed nuclear families enabled the identification of more than 3,000 sequenced de novo mutations in almost 2,000 genes. These pedigrees were also used to demonstrate the segregation of known and suspected disease-causing mutations, including a duplication in LDLR that causes familial hypercholesterolemia [28].
IBD segments are sections of the genome shared by two or more individuals because they were inherited without recombination from a common ancestor. IBD segments can be large in closely related individuals but are detectable in distant relatives as well [29]. Today, there are some popular tools for rapidly identifying IBD segments in large datasets of GWAS array-based data [30–34], and the degree of distant relatedness can be inferred from a likelihood ratio test calculated from the number and lengths of autosomal genomic segments shared between two individuals [35]. There are typically enough IBD segments throughout the genome to allow relatedness detection for relationships as distant as 3rd cousins [36]; these inferences can be strengthened by leveraging known or detected pedigree information [36].
IBD mapping is an approach that utilizes patterns of IBD sharing in distantly related cases and controls to identify regions of the genome likely to harbor low-frequency variants associated with the disease [37]. Because IBD segments associated with a trait may harbor low-frequency causal variants, this approach enhances the ability to identify genes that are undetectable through GWAS analysis due to the low power of GWAS to detect effects at rare variants and low tolerance in GWAS for allelic heterogeneity. Also, neither close relatives nor a highly penetrant Mendelian model is required for IBD mapping [37–41]. From simulations, IBD mapping has a demonstrated advantage for identifying causal genes for diseases with high allelic heterogeneity, low-frequency causal variants, and high heritability [37]. Until recently, very little has been done to make use of distant relatedness for disease gene discovery. Today, IBD mapping has been successfully applied in schizophrenia [42], bipolar disorder [42], extreme short stature [38], and diastolic blood pressure [40]. For example, recently a study [43] genetically derived cryptic pedigrees and distant relatedness in the multi-ethnic BioMe biobank. Using IBD mapping and phenotypes derived from linked electronic health records, they discovered a locus associated with both elevated genetic relatedness and extreme short stature. They demonstrated that mutations in the gene COL27A1 cause a common collagen disorder causing short stature which impacts up to 2% of individuals of Puerto Rican ancestry. This genetic disease was previously thought to be rare and recessive [44]. Thus, leveraging IBD for novel disease gene mapping as well as refining genetic effects along the Mendelian-to-common-complex disease continuum represents a major untapped resource for the human genetics field and an underutilized use of the growing number of large genetic datasets for disease gene discovery.
The availability of IBD shared segment data for a large population can be a resource for more traditional gene discovery methods as well. In high-throughput sequencing studies designed to uncover the impact of rare genetic variation on human disease, causal variants are typically identified in a single family or even a single individual, creating a need to find additional carriers of the variant of interest for confirmation of its relationship with the studied trait [45]. When the discovery sample includes a sufficient number of observations of the minor allele (five or more are required [46]), genotype imputation provides an efficient and powerful solution to this problem. Because of the rarity of most variants of interest identified in high-throughput sequencing studies, the identification of additional carriers is arduous and often prohibitive. Using cheap and commonly available GWAS genotyping, shared segment-based approaches will enable the rapid identification of individuals who share segments IBD that are known to harbor putatively causal rare variants.
Polygenic Scores and Mendelian Randomization
Although highly successful at identifying SNPs associated with complex disease, the pragmatic usefulness of GWAS is under constant debate. In a 2009 article, Goldstein argued that the identified common SNPs only explained a small fraction of the risk for disease [47]. This is known as the famous missing heritability problem [48]. One explanation to the missing heritability problem is that many trait-associated SNPs with smaller effect sizes still remain to be uncovered and to uncover them a larger sample size in more diverse populations is required. This resolution assumes that traits are polygenic, affected by common variants in the number of hundreds to thousands. For example, there are currently 4,335 height associated SNPs in the GWAS catalog (3,277 SNPs with p ≤ 10−8, 1,058 SNPs with 10−8 < p ≤ 10−6) [49]. The concept of a polygenic score [50] was thus developed to account for the combined effects of multiple variants through a summation over weighted SNPs (Figure 2D). The most common formulation of a polygenic score can be written as , where m denotes the number of SNPs that have been previously found to be associated with the trait of interest; Xi assumes a value from 0-2 [51], representing the dose of the ith SNP in terms of the effective allele; and βi denotes the effect size of the ith SNP.
The concept of a polygenic score may seem simple, but the practical construction of this polygenic score often entails meticulous scrutiny and handling of prior data. Depending on the studies, the effect size reported may be odds ratios instead of beta coefficients, the unit of measurement may be variant (e. g. 10 cm vs 1 cm in height vs percentage of standard deviation), and the effective allele of the SNP may be inconsistent or even not reported [49]. Discrepancies in every aspect need to be reconciled before applying the polygenic score formula. Furthermore, it is worth noting that either only the strongest variant (based on sample size or p-value) among a group of variants in linkage disequilibrium (LD) goes into the score formula, or the weights must be adjusted to account for linkage. A Bayesian approach named LDpred [52] was employed to resolve the LD problem, by setting the weight for each variant to the expectation of its posterior distribution after LD has been accounted for. The authors of the study claimed that LDpred approach outperformed conventional approaches in a schizophrenia study [52]. There are many online resources to check for population-wise LD, such as the NIH-maintained LDlink [53]. The requirement for LD pruning or adjustment naturally makes application of polygenic scores across different populations problematic, since LD patterns vary greatly between different ethnic populations [54]. Finally, one must keep in mind that to avoid overfitting, the effect size should be selected from previous studies, and not from the current cohort. In scenarios where prior coefficients are not available, other statistical methods such as permutation or cross-validation should be used to adjust for the overfitting introduced by using coefficients defined from the same study cohort.
The concept of a polygenic score may be incorporated with Mendelian randomization to calibrate the possibly confounded association between an exposure and an outcome in the genetic epidemiology context [55] (Figure 2D). In brief, Mendelian randomization uses genetic variant(s) as an instrumental variable to test for the causative effect of an environment-modifiable exposure on a phenotype outcome. For example, the positive association between height and breast cancer risk is firmly established [56]. A Mendelian randomization study on a height genetic score further demonstrated that the genetic component of height is a risk factor for breast cancer and that the association between adult height and breast cancer risk is likely to be causal [57]. Another interesting example is obesity and breast cancer. The positive correlation between obesity and breast cancer risk has been well documented [58, 59]. In conventional breast cancer risk studies, obesity is often represented as BMI, a measured variable which is easily influenced by lifestyle and environmental exposures. In the scenario of Mendelian randomization, a polygenic score for BMI can be constructed using SNPs that are associated with BMI. Then the polygenic score is used as surrogate of measured BMI in the subsequent analysis. The results from such a Mendelian randomization study reveal the causal effect of a genetic trait rather than an observed trait, and the results can be counter-intuitive. For example, unlike measured BMI, the polygenic score of BMI was found to be negatively associated with breast cancer risk [60], which suggests a more complex relation between BMI and breast cancer risk than conventionally believed. This example highlights the importance of Mendelian randomization studies. With hundreds of genetic traits now reconstructable from SNP data based on published GWASs, many more complex trait-diseases associations can be revealed.
Global Homozygosity and Heterozygosity Analysis
Heterozygosity denotes the possession of two different alleles of a SNP by an individual, while homozygosity denotes the possession of the same allele. Homozygosity is often used to signify genome level variability in the form of Runs of Homozygosity (ROH) [61], which denotes a segment of the genome with continuous homozygous SNPs (Figure 2E). High level of ROH is a strong indicator of recent inbreeding, which magnifies the danger of presenting homozygous rare disease-causative SNPs. The associations between ROH and many phenotypical outcomes have been thoroughly established. ROH can be calculated through common toolboxes, such as PLINK [62] and BCFtools [63]. The computation of ROH is dependent on many factors such as the density and quality of the SNP data along the length of the chromosome. It has been demonstrated that ROH is highly sensitive to SNP density (the coverage of genome-wide SNPs by an array) and that genotyping arrays of different SNP density may produce different ROH results [64]. Furthermore, these inconsistencies in ROH computation may translate to contradictions in ROH association analyses [65–67]. An alternative measure to ROH is the Heterozygosity Ratio, computed as the ratio between the number of heterozygous SNPs and the number of non-reference homozygous SNPs. The Heterozygosity Ratio was originally proposed as a quality control parameter for SNP data because it has a theoretical expected value of two [68]. A subsequent study showed that the Heterozygosity Ratio is dependent on race, with only African ancestry individuals having a ratio close to two, whereas other races’ ratios are substantially lower than two in empirical data [69]. While ROH measures how homozygous a genome is, the Heterozygosity Ratio measures how heterozygous a genome is. Thus, we may expect ROH and Heterozygosity Ratio to have phenotype association results with opposite direction of effect. Indeed, height was shown to be negatively associated with ROH [70] yet positively associated with the Heterozygosity Ratio [64]. It was also demonstrated that the Heterozygosity Ratio is more robust than ROH against variable SNP density [64]. Overall, both ROH and Heterozygosity Ratio are important genetic measures that can be calculated easily from readily available GWAS SNP data, and they should be mined for association with a wider range of phenotypical outcomes.
Mitochondrial Copy Number Inference and Mitochondrial Heteroplasmy
Genotyping array data is well known for its ability to infer nuclear copy number variation (CNV) information from probe fluorescence intensities. These intensities can also be used to estimate two important mitochondrial measurements: mitochondrial DNA copy number and heteroplasmy. Mitochondrial copy number denotes the abundance of mitochondrial DNA (mtDNA) genomes relative to the number of nuclear DNA genomes contained in a DNA sample (Figure 2F). In contrast to the simple diploid nuclear genome, a plethora of mitochondria exist in each cell. The number of mtDNA per cell varies with cell type and can vary dynamically over time [71]. Mitochondria copy number variation has been linked to cardiovascular disease [72] and Parkinson’s disease [73]. Traditional measurement of mtDNA copy number involves quantitative real-time polymerase chain reaction measurements [74], but mtDNA copy number can also be estimated from traditional genotyping array data. Almost all genotyping array designs contain a set of mitochondrial DNA variants. A study of sudden cardiac death [75] used an estimate of mtDNA copy number defined from a comparison of nuclear and mtDNA probe intensities. Similarly, another study used an estimate of mtDNA copy number from GWAS data in a study of HIV infection, showing a highly significant association of mtDNA copy number with cognitive impairment [76]. The above examples demonstrated novel applications of the fluorescence intensity data from GWAS arrays-data that is generally ignored after it is used to generate variant calls.
Because mitochondria are maternally inherited, they contain a haploid genome. In theory, mitochondrial SNPs of one subject can only be observed with a single allele. However, heteroplasmy, which is the presence of more than one type of allele, can occur in mitochondria and has been associated with various diseases [77]. Mitochondrial heteroplasmy analysis is analogous to variant calling in the diploid autosomal chromosomes, with the extension that the heteroplasmy level is a nearly continuous measure ranging from 0-1; just as relative fluorescence intensity of the paired probes for a diploid variant can be used to call genotypes, the fluorescence intensity of the paired probes for mtDNA variants can be used to determine heteroplasmy. A recent study [78] showed that high level (> 40%) mitochondria heteroplasmies can be estimated from mitochondria SNP probe intensities and the results were verified with high-throughput sequencing technology. GWAS technology was developed for the specific purpose of calling the genotypes of the diploid autosomal chromosomes in a high throughput manner. The fact that we can also use this technology to assess the complex genetics of mitochondria illustrates the true flexibility of the GW As data.
Concluding Remarks
In the post GWAS era, the research focus has shifted from identifying trait associations, usually based on testing each variant association with the trait individually, to identifying the functional mechanisms of genetic influence on complex traits. While there is a great potential for further exploration within the accumulated GWAS genotyping data, it is also imperative to understand the limitations of these data. As the population of large countries becomes increasingly diversified, health outcome disparity also escalates. Unfortunately, a majority of the GWAS studies to date have focused on Caucasian populations. Of all subjects in GWAS studies documented in the GWAS catalog, 78% were Caucasian, 11% were Asian, and only 2.4% were Black and 1.3% were Hispanic while the rest were either not reported or of other minority groups [49]. The lack of diversity is also reflected by the genotyping array designs which are more focused on the Caucasian population. The lack of diversity is not a problem unique to genotyping data but is a common issue across many current genomic studies [79]. The good news is that the health outcome disparity problem has been well-acknowledged, and researchers are accordingly devoting more research focus to minority groups. Some of the alternative applications we have described tend to take the limitation of diversity within population into consideration. For example, it has been shown that a polygenic score is very sensitive to population stratification [80]. Biases and inaccuracies can be introduced when using polygenic scores to predict disease risk in a population different from the one used in the GWAS underpinning the polygenic scores [81].
High-throughput sequencing technology is undeniably superior to hybridization-based microarray technology. However, within the foreseeable future, it is unlikely for sequencing technology to edge past genotyping’s affordability. Thus, the genotyping array will still remain as the more affordable choice for conducting large scale genetic studies. Even after the genotyping array becomes obsolete, its historical data should serve as valuable resources. A vast amount of genotyping data have been accumulated in public repositories such as dbGAP and UK Biobank. Likely, these data have not been re-analyzed with the unconventional multi-variant methods we have described. There are 4,314 unique traits reported currently in the GWAS catalog that can be used for the construction of polygenic scores [82]. These resources provide rich untapped data mining opportunities. Furthermore, the majority of the multi-variant methods that we have described are not limited to genotyping data. SNP data detected through high-throughput sequencing are also suitable for these approaches except for the fluorescent intensity-based methods. With the steady development of new statistical and bioinformatics methods, the vast quantity of genotyping data that has been accumulated and which is often publicly available can be effectively data mined in many novel ways. These novel methods for using GWAS data beyond their original intention for single SNP association studies are still under development and many outstanding questions still remain. Both the methods of polygenic risk score calculation and their interpretation regarding trait risk are rapidly developing at this time. The use of GWAS probe fluorescence intensity to quantify mitochondrial DNA features is still in its infancy. The development of the distant pedigree reconstruction methods raises the tantalizing possibility that GWAS data strictly on common variants could also be used to identify genomic loci containing rare causal variants for disease phenotypes. With this wide frontier of novel usage of GWAS data open to exploration, we still have much to learn from this large scale and efficient genetics assay.
Oustanding questions.
How much variation of a trait can a polygenic score capture?
Can SNP density affect the computation of runs of homozygosity?
Is heterozygosity ratio a more robust measurement than runs of homozygosity?
Can distant pedigree computation assist in finding rare causal variants?
Can fluorescence intensities from genotyping array be used to accurately estimate mitochondrial copy number and heteroplasmy?
Highlights.
High throughput genotyping arrays have been the driving force for identifying genetic variant associations with traits and phenotypes, but they can be used for far more.
Novel statistics and bioinformatics methods have been developed to leverage the data from genotyping arrays, allowing a new and broader application of this established technology. These new techniques include polygenic scores, detection of runs of homozygosity or the heterozygosity ratio, distant pedigree reconstruction, and inference of mitochondrial DNA copy number and heteroplasmy.
A large amount of genotyping data has been accumulated in publicly accessible data repositories, forming a valuable resource for the use of these alternative applications to greatly extend the information that can be obtained from existing genetics studies.
Acknowledgment
This work is supported by the cancer center support grant P30CA118100.
Glossary
- eQTL
gene expression quantitative trait loci
- Genotype imputation
estimating missing genotypes for a human subject. With the knowledge of haplotypes in a population, the missing genotype of a polymorphism site can be imputed with some confidence from the genotypes of its upstream and downstream neighboring polymorphism sites
- GWAS
Genome wide association analysis
- Haplotype phase inference
inference of the combination of alleles of multiple polymorphism sites located sequentially and closely on a chromosome segment. Assume a chromosome segment contains k polymorphism sites each of which can have two alternative alleles, then theoretically there can be 2k sequential combinations or haplotypes; however, due to linkage disequilibrium, certain adjacent alleles are associated at a higher-than-random rate, thus there may be a much fewer number of haplotypes. The inference of specific allele sequence for a set of sequential polymorphism sites of one human subject is called haplotype phase inference
- Heterozygosity Ratio (HR)
Heterozygosity ratio is the ratio between the number of heterozygous SNP and the number of non-reference homozygous SNPs for one subject
- Identity-by-descent (IBD)
The inheritance of an identical haplotype from both parents owing to it having been passed without recombination from a common ancestor in the baseline population
- meQTL
methylation quantitative trait loci
- Mendelian randomization
A population is divided into distinct cohorts on account of the allele that a subject carries at a specific genomic variant locus, and a certain feature or outcome is compared between the distinct cohorts. This manner of sample division is not based on an environmentally modifiable factor and is believed to possess a degree of randomness due to the random genetic allocation of alleles
- Mitochondrial heteroplasmy
The phenomenon that single nucleotide variant locus within the mitochondrial genome harbors more than one allele
- mtDNA copy number
The abundance of mitochondrial DNA (mtDNA) genomes relative to the number of nuclear DNA genomes contained in a DNA sample
- Pedigree reconstruction
To use pairwise genome level relatedness and genetic sex determination to automatically construct potential pedigrees connecting groups of individuals
- Polygenic score
A polygenic score is a number based on variation in multiple variants and their associated weights computed from an existing GWAS
- Principal component analysis
Given original datapoints characterized in a k-dimension space, principal component analysis creates k new uncorrelated variables that successively preserves the maximal variance of the datapoints. The k new variables coincide with eigenvectors of the original matrix, and are called Principal Components. The process of finding Principal Components and transforming the original coordinate system to a new one based on the k principal components is Principal Component Analysis. At the cost of limited information loss, one can use a fewer number of master variables, sometimes just one or two, to characterize the datapoints, thus effectively reduces dimentionality and increases interpretability
- Runs of homozygosity (ROH)
Contiguous lengths of homozygous genotypes
Footnotes
Publisher's Disclaimer: This is a PDF file of an unedited manuscript that has been accepted for publication. As a service to our customers we are providing this early version of the manuscript. The manuscript will undergo copyediting, typesetting, and review of the resulting proof before it is published in its final form. Please note that during the production process errors may be discovered which could affect the content, and all legal disclaimers that apply to the journal pertain.
References
- 1.Buniello A et al. (2019) The NHGRI-EBI GWAS Catalog of published genome-wide association studies, targeted arrays and summary statistics 2019. Nucleic Acids Res 47 (D1), D1005–D1012. [DOI] [PMC free article] [PubMed] [Google Scholar]
- 2.Guo Y et al. (2014) Illumina human exome genotyping array clustering and quality control. Nat Protoc 9 (11), 2643–62. [DOI] [PMC free article] [PubMed] [Google Scholar]
- 3.Das S et al. (2016) Next-generation genotype imputation service and methods. Nat Genet 48 (10), 1284–1287. [DOI] [PMC free article] [PubMed] [Google Scholar]
- 4.Grove ML et al. (2013) Best practices and joint calling of the HumanExome BeadChip: the CHARGE Consortium. PLoS One 8 (7), e68095. [DOI] [PMC free article] [PubMed] [Google Scholar]
- 5.Zhao S et al. (2018) Strategies for processing and quality control of Illumina genotyping arrays. Brief Bioinform 19 (5), 765–775. [DOI] [PMC free article] [PubMed] [Google Scholar]
- 6.Wang J et al. (2017) StrandScript: evaluation of Illumina genotyping array design and strand correction. Bioinformatics 33 (15), 2399–2401. [DOI] [PubMed] [Google Scholar]
- 7.Samuels DC et al. (2013) Finding the lost treasures in exome sequencing data. Trends Genet 29 (10), 593–9. [DOI] [PMC free article] [PubMed] [Google Scholar]
- 8.Han L et al. (2015) Alternative applications for distinct RNA sequencing strategies. Brief Bioinform 16 (4), 629–39. [DOI] [PMC free article] [PubMed] [Google Scholar]
- 9.Vickers KC et al. (2015) Mining diverse small RNA species in the deep transcriptome. Trends Biochem Sci 40 (1), 4–7. [DOI] [PMC free article] [PubMed] [Google Scholar]
- 10.Price AL et al. (2006) Principal components analysis corrects for stratification in genome-wide association studies. Nature Genetics 38 (8), 904–909. [DOI] [PubMed] [Google Scholar]
- 11.Han E et al. (2017) Clustering of 770,000 genomes reveals post-colonial population structure of North America. Nat Commun 8, 14238. [DOI] [PMC free article] [PubMed] [Google Scholar]
- 12.Chaichoompu K et al. (2020) A different view on fine-scale population structure in Western African populations. Hum Genet 139 (1), 45–59. [DOI] [PMC free article] [PubMed] [Google Scholar]
- 13.Winkler CA et al. (2010) Admixture Mapping Comes of Age. Annual Review of Genomics and Human Genetics, Vol 11 11, 65–89. [DOI] [PMC free article] [PubMed] [Google Scholar]
- 14.Molokhia M et al. (2003) Relation of risk of systemic lupus erythematosus to west African admixture in a Caribbean population. Hum Genet 112 (3), 310–8. [DOI] [PubMed] [Google Scholar]
- 15.Staples J et al. (2014) PRIMUS: rapid reconstruction of pedigrees from genome-wide estimates of identity by descent. Am J Hum Genet 95 (5), 553–64. [DOI] [PMC free article] [PubMed] [Google Scholar]
- 16.Palamara PF et al. (2015) Leveraging Distant Relatedness to Quantify Human Mutation and Gene-Conversion Rates. American Journal of Human Genetics 97 (6), 775–789. [DOI] [PMC free article] [PubMed] [Google Scholar]
- 17.Saad M and Wijsman EM (2014) Combining Family- and Population-Based Imputation Data for Association Analysis of Rare and Common Variants in Large Pedigrees. Genetic Epidemiology 38 (7), 579–590. [DOI] [PMC free article] [PubMed] [Google Scholar]
- 18.Saad M and Wijsman EM (2014) Power of Family-Based Association Designs to Detect Rare Variants in Large Pedigrees Using Imputed Genotypes. Genetic Epidemiology 38 (1), 1–9. [DOI] [PMC free article] [PubMed] [Google Scholar]
- 19.O’Connell J et al. (2014) A General Approach for Haplotype Phasing across the Full Spectrum of Relatedness. Plos Genetics 10 (4). [DOI] [PMC free article] [PubMed] [Google Scholar]
- 20.Browning SR and Thompson EA (2012) Detecting Rare Variant Associations by Identity-by-Descent Mapping in Case-Control Studies. Genetics 190 (4), 1521–1531. [DOI] [PMC free article] [PubMed] [Google Scholar]
- 21.Browning SR and Browning BL (2012) Identity by Descent Between Distant Relatives: Detection and Applications. Annual Review of Genetics, Vol 46 46, 617–633. [DOI] [PubMed] [Google Scholar]
- 22.Staples J et al. (2015) PRIMUS: improving pedigree reconstruction using mitochondrial and Y haplotypes. Bioinformatics. [DOI] [PMC free article] [PubMed] [Google Scholar]
- 23.Gudbjartsson DF et al. (2005) Allegro version 2. Nat Genet 37 (10), 1015–6. [DOI] [PubMed] [Google Scholar]
- 24.Horvath S et al. (2001) The family based association test method: strategies for studying general genotype--phenotype associations. Eur J Hum Genet 9 (4), 301–6. [DOI] [PubMed] [Google Scholar]
- 25.Spielman RS and Ewens WJ (1996) The TDT and other family-based tests for linkage disequilibrium and association. Am J Hum Genet 59 (5), 983–9. [PMC free article] [PubMed] [Google Scholar]
- 26.Amberger JS et al. (2015) OMIM.org: Online Mendelian Inheritance in Man (OMIM (R)), an online catalog of human genes and genetic disorders. Nucleic Acids Research 43 (D1), D789–D798. [DOI] [PMC free article] [PubMed] [Google Scholar]
- 27.Lin DY et al. (2014) Genetic association analysis under complex survey sampling: the Hispanic Community Health Study/Study of Latinos. Am J Hum Genet 95 (6), 675–88. [DOI] [PMC free article] [PubMed] [Google Scholar]
- 28.Staples J et al. (2018) Profiling and Leveraging Relatedness in a Precision Medicine Cohort of 92,455 Exomes. American Journal of Human Genetics 102 (5), 874–889. [DOI] [PMC free article] [PubMed] [Google Scholar]
- 29.Staples J et al. (2016) PADRE: Pedigree-Aware Distant-Relationship Estimation. Am J Hum Genet 99 (1), 154–62. [DOI] [PMC free article] [PubMed] [Google Scholar]
- 30.Naseri A et al. (2019) RaPID: ultra-fast, powerful, and accurate detection of segments identical by descent (IBD) in biobank-scale cohorts. Genome Biol 20 (1), 143. [DOI] [PMC free article] [PubMed] [Google Scholar]
- 31.Gusev A et al. (2009) Whole population, genome-wide mapping of hidden relatedness. Genome Res 19 (2), 318–26. [DOI] [PMC free article] [PubMed] [Google Scholar]
- 32.Shemirani R et al. (2019) Rapid detection of identity-by-descent tracts for mega-scale datasets. bioRxiv, 749507. [DOI] [PMC free article] [PubMed] [Google Scholar]
- 33.Browning BL and Browning SR (2013) Improving the accuracy and efficiency of identity-by-descent detection in population data. Genetics 194 (2), 459–71. [DOI] [PMC free article] [PubMed] [Google Scholar]
- 34.Browning BL and Browning SR (2013) Detecting identity by descent and estimating genotype error rates in sequence data. Am J Hum Genet 93 (5), 840–51. [DOI] [PMC free article] [PubMed] [Google Scholar]
- 35.Hu H and Huff CD (2014) Detecting statistical interaction between somatic mutational events and germline variation from next-generation sequence data. Pac Symp Biocomput, 51–62. [PMC free article] [PubMed] [Google Scholar]
- 36.Staples J et al. (2016) PADRE: Pedigree-Aware Distant-Relationship Estimation. American Journal of Human Genetics 99 (1), 154–162. [DOI] [PMC free article] [PubMed] [Google Scholar]
- 37.Browning SR and Thompson EA (2012) Detecting rare variant associations by identity-by-descent mapping in case-control studies. Genetics 190 (4), 1521–31. [DOI] [PMC free article] [PubMed] [Google Scholar]
- 38.Belbin GM et al. (2017) Genetic identification of a common collagen disease in puerto ricans via identity-by-descent mapping in a health system. Elife 6. [DOI] [PMC free article] [PubMed] [Google Scholar]
- 39.Lin R et al. (2013) Identity-by-descent mapping to detect rare variants conferring susceptibility to multiple sclerosis. PLoS One 8 (3), e56379. [DOI] [PMC free article] [PubMed] [Google Scholar]
- 40.Liu XQ et al. (2016) Identity-by-descent mapping for diastolic blood pressure in unrelated Mexican Americans. BMC Proc 10 (Suppl 7), 263–267. [DOI] [PMC free article] [PubMed] [Google Scholar]
- 41.Westerlind H et al. (2015) Identity-by-descent mapping in a Scandinavian multiple sclerosis cohort. Eur J Hum Genet 23 (5), 688–92. [DOI] [PMC free article] [PubMed] [Google Scholar]
- 42.Francks C et al. (2010) Population-based linkage analysis of schizophrenia and bipolar case-control cohorts identifies a potential susceptibility locus on 19q13. Mol Psychiatry 15 (3), 319–25. [DOI] [PubMed] [Google Scholar]
- 43.Belbin GM et al. (2017) Genetic identification of a common collagen disease in puerto ricans via identity-by-descent mapping in a health system. Elife 6. [DOI] [PMC free article] [PubMed] [Google Scholar]
- 44.Gonzaga-Jauregui C et al. (2015) Mutations in COL27A1 cause Steel syndrome and suggest a founder mutation effect in the Puerto Rican population. Eur J Hum Genet 23 (3), 342–6. [DOI] [PMC free article] [PubMed] [Google Scholar]
- 45.Philippakis AA et al. (2015) The Matchmaker Exchange: a platform for rare disease gene discovery. Hum Mutat 36 (10), 915–21. [DOI] [PMC free article] [PubMed] [Google Scholar]
- 46.McCarthy S et al. (2016) A reference panel of 64,976 haplotypes for genotype imputation. Nat Genet 48 (10), 1279–83. [DOI] [PMC free article] [PubMed] [Google Scholar]
- 47.Goldstein DB (2009) Common genetic variation and human traits. N Engl J Med 360 (17), 1696–8. [DOI] [PubMed] [Google Scholar]
- 48.Manolio TA et al. (2009) Finding the missing heritability of complex diseases. Nature 461 (7265), 747–53. [DOI] [PMC free article] [PubMed] [Google Scholar]
- 49.(2020) GWAS catalog. https://www.ebi.ac.uk/gwas/, (accessed).
- 50.Dudbridge F (2013) Power and predictive accuracy of polygenic risk scores. PLoS Genet 9 (3), e1003348. [DOI] [PMC free article] [PubMed] [Google Scholar]
- 51.Zhang P et al. (2017) Estimating relative mitochondrial DNA copy number using high throughput sequencing data. Genomics 109 (5–6), 457–462. [DOI] [PubMed] [Google Scholar]
- 52.Vilhjalmsson BJ et al. (2015) Modeling Linkage Disequilibrium Increases Accuracy of Polygenic Risk Scores. American Journal of Human Genetics 97 (4), 576–592. [DOI] [PMC free article] [PubMed] [Google Scholar]
- 53.Machiela MJ and Chanock SJ (2015) LDlink: a web-based application for exploring population-specific haplotype structure and linking correlated alleles of possible functional variants. Bioinformatics 31 (21), 3555–7. [DOI] [PMC free article] [PubMed] [Google Scholar]
- 54.Shifman S et al. (2003) Linkage disequilibrium patterns of the human genome across populations. Human Molecular Genetics 12 (7), 771–776. [DOI] [PubMed] [Google Scholar]
- 55.Smith GD and Ebrahim S (2003) ‘Mendelian randomization’: can genetic epidemiology contribute to understanding environmental determinants of disease? Int J Epidemiol 32 (1), 1–22. [DOI] [PubMed] [Google Scholar]
- 56.Kabat GC et al. (2013) Adult height in relation to risk of cancer in a cohort of Canadian women. Int J Cancer 132 (5), 1125–32. [DOI] [PubMed] [Google Scholar]
- 57.Zhang B et al. (2015) Height and Breast Cancer Risk: Evidence From Prospective Studies and Mendelian Randomization. J Natl Cancer Inst 107 (11). [DOI] [PMC free article] [PubMed] [Google Scholar]
- 58.Huang Z et al. (1997) Dual effects of weight and weight gain on breast cancer risk. JAMA 278 (17), 1407–11. [PubMed] [Google Scholar]
- 59.Michels KB et al. (2006) Longitudinal study on the role of body size in premenopausal breast cancer. Arch Intern Med 166 (21), 2395–402. [DOI] [PubMed] [Google Scholar]
- 60.Guo Y et al. (2016) Genetically Predicted Body Mass Index and Breast Cancer Risk: Mendelian Randomization Analyses of Data from 145,000 Women of European Descent. Plos Medicine 13 (8). [DOI] [PMC free article] [PubMed] [Google Scholar]
- 61.Ceballos FC et al. (2018) Runs of homozygosity: windows into population history and trait architecture. Nature Reviews Genetics 19 (4), 220-+. [DOI] [PubMed] [Google Scholar]
- 62.Purcell S et al. (2007) PLINK: a tool set for whole-genome association and population-based linkage analyses. Am J Hum Genet 81 (3), 559–75. [DOI] [PMC free article] [PubMed] [Google Scholar]
- 63.Narasimhan V et al. (2016) BCFtools/RoH: a hidden Markov model approach for detecting autozygosity from next-generation sequencing data. Bioinformatics 32 (11), 1749–51. [DOI] [PMC free article] [PubMed] [Google Scholar]
- 64.Samuels DC et al. (2016) Heterozygosity Ratio, a Robust Global Genomic Measure of Autozygosity and Its Association with Height and Disease Risk. Genetics 204 (3), 893-+. [DOI] [PMC free article] [PubMed] [Google Scholar]
- 65.Vine AE et al. (2009) No evidence for excess runs of homozygosity in bipolar disorder. Psychiatric Genetics 19 (4), 165–170. [DOI] [PubMed] [Google Scholar]
- 66.Sims R et al. (2011) No Evidence that Extended Tracts of Homozygosity are Associated with Alzheimer’s Disease. American Journal of Medical Genetics Part B-Neuropsychiatric Genetics 156B (7), 764–771. [DOI] [PubMed] [Google Scholar]
- 67.Heron EA et al. (2014) No evidence that runs of homozygosity are associated with schizophrenia in an Irish genome-wide association dataset. Schizophrenia Research 154 (1–3), 79–82. [DOI] [PMC free article] [PubMed] [Google Scholar]
- 68.Guo Y et al. (2014) Three-stage quality control strategies for DNA re-sequencing data. Briefings in Bioinformatics 15 (6), 879–889. [DOI] [PMC free article] [PubMed] [Google Scholar]
- 69.Wang J et al. (2015) Genome measures used for quality control are dependent on gene function and ancestry. Bioinformatics 31 (3), 318–323. [DOI] [PMC free article] [PubMed] [Google Scholar]
- 70.Joshi PK et al. (2015) Directional dominance on stature and cognition in diverse human populations. Nature 523 (7561), 459–62. [DOI] [PMC free article] [PubMed] [Google Scholar]
- 71.Johnston IG and Burgstaller JP (2019) Evolving mtDNA populations within cells. Biochemical Society Transactions 47, 1367–1382. [DOI] [PMC free article] [PubMed] [Google Scholar]
- 72.Ashar FN et al. (2017) Association of Mitochondrial DNA Copy Number With Cardiovascular Disease. Jama Cardiology 2 (11), 1247–1255. [DOI] [PMC free article] [PubMed] [Google Scholar]
- 73.Pyle A et al. (2016) Reduced mitochondrial DNA copy number is a biomarker of Parkinson’s disease. Neurobiology of Aging 38. [DOI] [PMC free article] [PubMed] [Google Scholar]
- 74.Rooney JP et al. (2015) PCR Based Determination of Mitochondrial DNA Copy Number in Multiple Species. Mitochondrial Regulation: Methods and Protocols 1241, 23–38. [DOI] [PMC free article] [PubMed] [Google Scholar]
- 75.Zhang YY et al. (2017) Association between mitochondrial DNA copy number and sudden cardiac death: findings from the Atherosclerosis Risk in Communities study (ARIC). European Heart Journal 38 (46), 3443–3448. [DOI] [PMC free article] [PubMed] [Google Scholar]
- 76.Hulgan T et al. (2019) Peripheral Blood Mitochondrial DNA Copy Number Obtained From Genome-Wide Genotype Data Is Associated With Neurocognitive Impairment in Persons With Chronic HIV Infection. Jaids-Journal of Acquired Immune Deficiency Syndromes 80 (4), E95–E102. [DOI] [PMC free article] [PubMed] [Google Scholar]
- 77.Stewart JB and Chinnery PF (2015) The dynamics of mitochondrial DNA heteroplasmy: implications for human health and disease. Nature Reviews Genetics 16 (9), 530–542. [DOI] [PubMed] [Google Scholar]
- 78.Zhang P et al. (2016) Practicability of mitochondrial heteroplasmy detection through an Illumina genotyping array. Mitochondrion 31, 75–78. [DOI] [PubMed] [Google Scholar]
- 79.Popejoy AB and Fullerton SM (2016) Genomics is failing on diversity. Nature 538 (7624), 161–164. [DOI] [PMC free article] [PubMed] [Google Scholar]
- 80.Sohail M et al. (2019) Polygenic adaptation on height is overestimated due to uncorrected stratification in genome-wide association studies. Elife 8. [DOI] [PMC free article] [PubMed] [Google Scholar]
- 81.De La Vega FM and Bustamante CD (2018) Polygenic risk scores: a biased prediction? Genome Medicine 10. [DOI] [PMC free article] [PubMed] [Google Scholar]
- 82.Kong SW et al. (2015) Summarizing polygenic risks for complex diseases in a clinical whole-genome report. Genet Med 17 (7), 536–44. [DOI] [PMC free article] [PubMed] [Google Scholar]