

Abstract
Lung nodule segmentation is an essential step in any CAD system for lung cancer detection and diagnosis. Traditional approaches for image segmentation are mainly morphology based or intensity based. Motion-based segmentation techniques tend to use the temporal information along with the morphology and intensity information to perform segmentation of regions of interest in videos. CT scans comprise of a sequence of dicom 2-D image slices similar to videos which also comprise of a sequence of image frames ordered on a timeline. In this work, Farneback, Horn-Schunck and Lucas-Kanade optical flow methods have been used for processing the dicom slices. The novelty of this work lies in the usage of optical flow methods, generally used in motion-based segmentation tasks, for the segmentation of nodules from CT images. Since thin-sliced CT scans are the imaging modality considered, they closely approximate the motion videos and are the primary motivation for using optical flow for lung nodule segmentation. This paper also provides a detailed comparative analysis and validates the effectiveness of using optical flow methods for segmentation. Finally, we propose methods to further improve the efficiency of segmentation using optical flow methods on CT scans.
Keywords: Optical flow, Pulmonary nodule, Computed tomography, Segmentation
Introduction
Pulmonary nodules are oval-shaped lesions that occur in the lung. These nodules, which are smaller than 3 mm in diameter, are generally non-cancerous and are benign, and when they grow beyond 3 mm in diameter, are called pulmonary mass, and they pose a risk to be cancerous [11]. Lung cancer is associated with one of the highest mortality rates among patients who have cancer. The primary reason for this is the delayed diagnosis. Hence, there is a need for robust mechanisms for detecting lung cancer at the early stages.
Challenges to Lung Cancer Detection
Detection of a lung nodule, segmentation and classification only based on simple morphological and textural properties such as size or texture or shape features is not robust as suggested by Paing et al. [38] and does not reveal the exact magnitude of the underlying challenges in lung cancer detection and diagnosis. Researchers have used various techniques for lung nodule detection and segmentation such as 3D tensor filtering with local image feature analysis [18], global optimal active contour model [54], corner seeded region growing combined with differential evolution based optimal thresholding [35], connected component labelling with morphological operations and multilayer perceptron [21], sparse field level sets and boosting algorithm [39], adaptive ROI with multi-view residual learning [49], LBF active contour model with information entropy and joint vector [22] etc. including optical flow methods for evaluation of interval change in metastatic lung nodules [17], and segmentation by background subtraction [45]. A review of various lung nodule detection methods used by researchers can be found in [42, 52, 53]
Chromanska and Macura [10] have listed some of the imaging features of benign and malignant nodules/lesions. For instance, benign lesions usually have smooth and well-marginated borders, and malign nodules have ill-defined, irregular, or lobulated contours. Internal characteristics of the nodules such as the patterns of calcification such as central, diffuse solid, laminated denote benign patterns while a popcorn-like appearance may denote a malignant nodule with even some forms of lung metastases demonstrating benign patterns of calcification.
However, these features independently cannot be 100% used to distinguish benign and malignant nodules in a deterministic fashion. That is, the malignancy of a nodule cannot be simply estimated from observed features of the nodules such as size, spiculation and lobulation. For instance, the malignancy of ground-glass opacity or non solid nodules are independent of spiculation. Hu and Wang et al. [24] reported that 83.3% nodules that are spiculated are malignant and 61.5% nodules that are non-spiculated are malignant. In general, some of the features of malignant nodules are marked spiculation, marked lobulation, air cavity densities etc., aid in detection of malignancy of nodules but accurate detection of nodules requires careful characterization of nodules and grows with experience [51].
According to [11], based on their opacity features, the pulmonary nodules are classified into solid nodules and ground-glass opacity nodules. Rounded opacity and a diameter of < 3 cm characterize the solid nodules. Haziness in pixel intensity structures, as well as poorly defined boundaries, characterize ground opacity nodules. Pulmonary nodules which exist unattached are called isolated nodules. Those that exist attached with blood vessels or attached with the pleural tail of the lung, respectively, are called as juxtavascular and juxtapleural nodules. These wide variations in the intensity, shape, size, morphology, pose etc., along with other features such as growth patterns and opacity of nodules, make nodule detection and segmentation a challenging process in automated lung cancer diagnosis.
Architecture of a CAD System
The generic architecture of a computer-aided diagnostic and detection system (CAD) comprises five subsystems, namely acquisition, preprocessing, lung segmentation, nodule detection, nodule segmentation, feature extraction and classification [16]. Intensity-based, region-based, model-based, neighboring anatomy-based, and machine learning-based methods [32] are some of the broad types of approaches applied in the segmentation of nodules.
Lung Nodule Segmentation
According to Firmino et al. [15, 16], the two commonly used approaches for lung nodule segmentation are thresholding based and deformable model based. The thresholding-based approach uses a threshold intensity for segmentation. Deformable model-based methods use curves and surfaces which deform to perform the separation. In general, the challenges to these segmentation approaches are the intensity initialization process and the adaptation required in segmentation parameters to capture the variations in regional homogeneity of the lung.
Video Based Segmentation
Video sequences comprise a series of 2D images. Motion-based segmentation approaches use an estimate of the motion field to partition an image into regions of uniform motion. Images provide spatial information about image pixels (location of a pixel), but a video besides spatial information, also provides temporal information, such as how long a specific pixel was present at a location.
This additional information opens up opportunities for tracking the apparent motion of objects in a video as well as used in fields such as video compression, video stabilization. In general, the optical flow algorithms work based on three assumptions namely,
Brightness constancy constraint (intensity is constant between two frames)
Temporal constraint (points move very slow)
Spatial coherence constraint (points move as a group)
In this work, initially, we formulate the problem of using slices from CT scans as a series of frames and set up the template for studying the utility of motion-based method for segmentation of regions of interest, ie. Lung nodules. There on, we discuss various motion-based approaches from naive to sophisticated ones for object segmentation and analyze the resulting segmented images. Finally, we compare the results obtained and discuss the utility of the motion-based approaches for object segmentation and also propose methods for further study.
The “Literature Survey” section presents a literature survey on various conventional segmentation approaches, including spatial and temporal segmentation techniques using optical flow. The “Optical Flow-Based Analysis Model” section outlines an optical flow-based approach for nodule segmentation which uses three well known optical flow methods commonly applied for motion detection and object segmentation. The “?? ??” section discusses the overall methodology used in this paper for nodule segmentation along with a description of the techniques used for processing the image slices, including both optical flow as well as spatial domain algorithms. The “Results and Discussion” section describes the experimental methods and results and provides a detailed analysis. This is followed by conclusions and future directions in the “Conclusion” section.
Literature Survey
This section explains the literature survey on various segmentation methods used for nodule segmentation including a couple of optical flow methods for segmenting the lung nodules.
Lung Nodule Segmentation
Mansoor et al.[32] have classified the segmentation algorithms into thresholding-based, region-based, model-based, and machine learning-based methods.
Thresholding-based methods segment the CT images by creating binary images based on relative attenuation values of the CT structures measured in Hounsfield units. These methods do not take the structural characteristics of images into account and are very sensitive to noise and other imaging artifacts. Hence segmentation using thresholding-based methods is affected widely with abnormalities. On the other hand, thresholding-based methods are fast and least expensive. Sluimer et al. [44] have surveyed lung nodule segmentation approaches, and they note that thresholding-based methods are still one of the conventional approaches in the literature in addition to other approaches such as clustering, mathematical morphological operations, template matching.
Region-based methods [1] compare a selected seed point pixel with the neighboring pixels and group the pixels that satisfy the region criteria for a class. Region-based methods use techniques such as region growing, graph cuts, random walk, fuzzy connectedness to identify disconnected regions, given an image. Senthilkumar et al. [28] implemented an automatic morphological region growing segmentation algorithm for lung nodule segmentation for 20 patients with 25 malignant nodules. However, this method is good at detecting well-circumscribed nodules and fails to detect the nodules attached to the pleura of the lung. The same authors have proposed a novel edge bridge and fill technique to detect the nodules attached to the pleura of the lung. They achieved a sensitivity of 88% by correctly detecting 22 malignant nodules. Khordechi et al. [27] used a statistical region merging approach for segmenting the lung nodules, and they achieved a sensitivity of 92.5% on the ELCAP dataset consisting of 50 CT images and 92.4% on LIDC/IDRI dataset consisting of 800 CT images. Yuri Boykov and Marie-Pirre Jolly [7] implemented interactive organ segmentation using graph cuts for 2-D and 3-D medical images. They used the graph cut approach for separating the objects and background using the cheapest way of cutting the edges in the graph. Cha et al. [9] implemented a novel segmentation method on 4-D CT images by adding adaptive shape prior and motion information on the conventional graph cut methods. They used active shape models with signed distance function to extract the shape information and optical flow methods to capture the motion information. Pawel Badura and Ewa Pietka [3] developed a multilevel approach based on fuzzy connectedness principles for lung nodule segmentation consisting of 23 CT lung studies of LIDC/IDRI dataset to limit the computation time in searching the nodules. The same authors have also [4] implemented a soft computing approach using evolutionary computation on CT images for 3-D lung nodule segmentation. Li Guo et al. [20] implemented an improved random walk segmentation method for extracting the edge boundary of the lung nodules, and Grady et al. [19] have used random walks for image segmentation. The random walk methods are overly dependent on the proper selection of the seed point.
Shape-based methods are model/atlas-based, which consider the local and global variation of the shape, templates, textures, and they work well when the abnormalities are moderate. Ezhil E.Nithila and S.S.Kumar [37] used a region-based active contour model and fuzzy c-means clustering for the segmentation of lung nodules with a decrease in the error rate and increase in the similarity measure. Teramoto et al. [48] used an active contour filter, which has a deformable kernel shape for the detection of lung nodules and achieved a sensitivity of 97.2%. Bin Li et al. [29] used wavelet and texture features on the active contour model for the segmentation of ground-glass opacity nodules. They tested with 102 chest CT scans containing 23 ground-glass opacity nodules and achieved a true positive ratio of 85.02%. Farhangi et al. [13] implemented 3-D active contour lung nodule segmentation using sparse linear combination of training shapes (SCoTS) on 542 3-D lung nodule images on LIDC-IDRI dataset and achieved a sensitivity of 90.26%.
Neighboring anatomy and machine learning methods are appropriate for segmenting the lung structures with high abnormalities. Pafang Hua et al. [25] implemented a segmentation method for pathological and diseased lung images on CT images using graph search method consisting of intensity, gradient, smoothness and rib information and they tested and trained their method on thorax CT dataset by evaluating its sensitivity and specificity. Ulas Bagci [5] implemented hierarchical multi-object segmentation on 3-D anatomical structures, and they evaluated this method on clinical 3-D images consisting of 20 CT scans. Mansoor et al. [33] implemented a novel approach for pathological lung segmentation using fuzzy connectedness and estimated the rib cage information on 400 CT scans and measured their method’s performance using sensitivity and specificity.
Magalhaes et al. [36] implemented the segmentation of lung nodules using growing neural gas and 3-D distance transform on 48 nodules of the LIDC dataset. Javaid et al. [26] implemented a method consisting of thresholding, morphological operations, and k means clustering for lung nodule segmentation and achieved a sensitivity of 83.33%. Tajbakshi and Suzuki [46] implemented massive training artificial neural networks (MTANNs) for lung nodule segmentation on private, and LIDC 38 CT scans consisting of 1057 slices and achieved a sensitivity of 100%. Liu et al. [30] implemented spatial fuzzy c-means (SFCM) for lung nodule segmentation on the LIDC dataset consisting of 6400 slices from 80 CT scans. Wang et al. [50] implemented a central focused convolutional neural network (CF-CNN) for segmenting the lung nodules on the LIDC dataset consisting of 893 nodules and achieved a sensitivity of 92.75%.
Farag et al. [12] proposed a method for lung nodule segmentation based on level sets and 3-D morphological operations, and they observed that thresholding-based methods fail to segment the nodules connected to the neighboring anatomic structures of the lung due to the assumption that the pixel intensities of the nodule and the surrounding region are always different. Tan et al. [47] observed the same issue, and they proposed a rule-based approach for nodule segmentation by the combination of thresholding, watershed, active contours and Markov random model.
In summary, the challenges of lung nodule segmentation algorithms are,
Most of the traditional methods discussed above can only segment the isolated and well-circumscribed nodules accurately.
Some of the described methods perform well on juxta vascular and juxta pleural nodules but have been tested only with the small datasets.
The segmentation of the nodules connected to the neighboring structures of the lung is challenging.
Optical Flow-Based Segmentation
Cavalcanti et al. [8] have proposed a background estimation method for lung nodule segmentation. They estimated the background by using optical flow methods like Lucas-Kanade [31] and block matching methods like SubME. After estimating the background, the same is subtracted from the current segment to obtain the foreground. Cavalcanti et al. [8] have claimed 99% accuracy and less than 1% false-positive rate. While their work is novel, their idea intuitive and promising, the process of nodule segmentation is not fully automatic. Hence, in order to automate the entire process of nodule segmentation and classification, the framework requires the procedures concerning the following tasks:
Slice sequence segmentation is one of the significant steps in the entire process, and the same requires to be automated.
Their work mainly discusses the segmentation of nodules only after manual selection of a rectangular region of interest. Segmentation on the entire slice instead of only the selected region of interest would be appropriate.
Validation of the motion flow-based segmentation process using a common platform and evaluation criteria is required.
Our work in this paper addresses only tasks 2 and 3 among the three tasks mentioned above and the threefold objectives of our work are as follows:
To provide a formal framework for segmentation within the context of optical flow-based approaches by modeling the problem of background subtraction after the process of optical flow estimation from motion sequences.
To provide a methodology for optical flow-based segmentation without manual segmentation of the rectangular region of interest.
To validate the nodule segmentation process using optical flow algorithms by comparing three well-known optical flow approaches and compare and analyze the quantitative and qualitative results of segmentation.
The following section provides a general model for optical flow-based nodule segmentation along with an outline of the analysis approach taken by this research work.
Optical Flow-Based Analysis Model
This section describes the model central to this work in a formal framework and describes the methodology for nodule segmentation. The dataset used in this work is also briefly described.
Overview of Segmentation Model
Generally, a video is a sequence of frames, C captured by a video Camera. Consider a video V which consists of a series of frames (f1,f2..fn), captured at time t = 1,2..n, and it is represented by,
| 1 |
The task of object segmentation from videos is then to find the pixels corresponding to the object(s) of interest in each consecutive frame of a video taking advantage of the temporal component available with video. One of the popular approaches for the segmentation of moving objects in video is optical flow. A vanilla optical flow method identifies the pixels that move in successive frames. The moving pixels constitute the foreground, and the rest non-moving pixels form the static background. The static background pixels are then subtracted from the current image to segment the moving object. In case of a video, C, considering two frames at times t=t1 and t=t2, a voxel at location (x, y, t1 ) with intensity I (x, y, t1) may move by Δx and Δy, displacements in the x and y directions, to the new position (x+x, y+ Δx, t2 ) in frame at time t2. Then, the optical flow equation is given as
| 2 |
where U = dx/dt and V = dy/dt and ∂I/∂x, ∂I/∂y, and ∂I/∂t are the image gradients along the horizontal axis, the vertical axis, and the time axis respectively. Hence, we conclude with the problem of optical flow, that is, solving U(dx/dt) and V (dy/dt) to determine pixel movement over time.
Model for Nodule Segmentation from CT Images Using Optical Flow
Medical practitioners commonly use thin-slice CT images in the diagnosis of diseases. Specifically, in lung cancer detection, thin-slice CT images yield better detection of lung nodule lesions. The key novelty of the proposed work lies in processing the thin slices of the CT image volume using optical-flow techniques for video for the segmentation of the region of interest. The part of interest in the current study is lung nodules. These lung nodules are considered to be the moving objects or foreground in a specific CT scan. The rest of the region in a single CT scan slice is considered to be the background. In this respect, the problem of detecting the part of the object to be segmented is as below:
Consider a CT image of patient I which consists of multiple 2-D slices (s1,s2..sn) and it can be represented as a single thin slice video, W,
| 3 |
As per the above assumption, the lung nodule pixels are assumed to move/ vary (increase or decrease) in size over the slices while the rest of the regions remain constant. Hence, in case of this thin slice video, W,considering two slices at times t = t1 and t = t2, a voxel at location (x, y, t1 ) with intensity I (x, y, t1) may move by Δx and Δy, displacements in the x and y directions, to the new position (x+Δx, y+ Δx, t2 ) in slice at time t2. Then, the optical flow equation is given as
| 4 |
where u = dx/dt and v = dy/dt and ∂I/∂x, ∂I/∂y, and ∂I/∂t are the image gradients along the horizontal axis, the vertical axis, and the time axis respectively. Hence, we conclude with the problem of optical flow, that is, solving u(dx/dt) and v(dy/dt) to determine movement over time.
For any two chosen 2-D slices, for instance slice s and slice s + 1, optical flow between both the entire slices are computed, in terms of u and v components of flow vectors for every pixel at each position (x,y) of both the images as u(x,y) and v(x,y)
Then the length of these flow vectors for all the u and v components is computed as follows for every position (x,y).
| 5 |
By using an appropriate threshold, T, a binary image, B is computed for every position, (x,y)
| 6 |
Here the threshold, T which determines the segmentation binary image for the lesion was calculated based on trial and error and used for the entire dataset. The threshold T compares the magnitude of the length of the vector obtained from the optical flow components u and v to binarize the input image.
Motion Estimation Methods
Motion is an essential source of information available from the video sequences. Motion estimation is difficult since motion may be due to moving objects in a 3D scene or due to the camera movement. Hence, motion estimation methods recover the motion information by analyzing the content of two images.
Optical flow is the apparent motion of the brightness pattern and signifies the spatio-temporal variation in the image sequences. Pixel-based methods, region-based methods, block-based methods, transform domain-based methods [6] are some of the significant optical flow motion estimation methods. Pixel-based methods use dense motion fields, and they compute a motion vector for each pixel of the image. Region-based methods compute coherent motion fields at a specific region of the image. Block-based methods compare each block of pixels in the current frame with the reference frame. The motion vectors are calculated having the best-matched block with least mean absolute difference. Transform domain methods are frequency-based methods that estimate the motion in the transformed domain.
Dataset Used
Lung Image Database Consortium and Image Database Resource Initiative (LIDC-IDRI) public dataset [2] was used to evaluate the proposed methodology of nodule segmentation. There are 1018 subjects of thoracic and marked-up annotated lesions which is annotated by four radiologists are included in the dataset. Each CT image of a patient comprises several 512 × 512-dimensional slices whose slice thickness ranges from 0.6 to 5.0 mm. This work analyzes and compares the results using radiologist annotations/ segmentations, nodule size list, nodule counts, patient diagnosis, etc. for only the first 41 patient ids (from LIDC-IDRI-0001 to LIDC-IDRI-0041) comprising of selected 45 nodules (out of 50) with at least 4 annotations each.
Proposed Methodology—Steps in Lung Nodule Segmentation Using Optical Flow
The proposed methodology is shown in Fig. 1 and the major steps for the nodule segmentation from CT images using optical flow is as given below:
Preprocessing
Frame selection (reference and current)
Optical flow
Post processing
Fig. 1.

Proposed methodology
Preprocessing
The input to this module are raw images and the out of this module is a 3-D array of voxel intensities loaded in Hounsfield units. The LIDC-IDRI dataset is ordered in sequence from LIDC-IDRI 0001 to LIDC-IDRI-1018. Each of this comprises of image volume of an anonymized patient whose ids range from 0001 to 1018. One volume is read at a time as input. The volume is then sorted based on the patient position and the CT scans are read into 3-D array. The voxel intensities are present as Hounsfield units. The input to the overall nodule segmentation algorithm comprises of choice of patient-id, choice of mode (described in the “Image Pair Selection Based on Choice of Mode” section), choice of optical flow algorithm, choice of thresholding and visual output choice.
Parenchyma Segmentation
Generally, lung parenchyma segmentation [41] is one of the essential steps for segmenting the lung nodules as described in most of the literature and is performed in order to reduce the search space for locating the nodules which saves the time and increases the sensitivity of the detection. Lung parenchyma segmentation separates the right and left lobes of the lung from the neighboring anatomical structures of the lung. The output of the parenchyma segmentation is a binary mask which segments the input image into two regions namely, inside the lung region and outside the lung region. The steps for parenchyma segmentation are listed as below is repeated for every slice of the input 3-D array of voxel intensities.
Binary Image Creation—A threshold, 604 Hounsfield unit is selected to create a binary slice.
Clearing the border—The border is cleared by removing the blobs which are connected to the lung border.
Labelling the image—The image is labelled and the first two large labelled regions are preserved.
Erosion and Closing the image—Erosion is performed with a structuring element of radius 2 and closing operation is performed with a structuring element of radius 10.
Filling the holes—The edges are identified using Roberts edge operator and the small holes inside the lung region are filled.
Superimpose the mask—The binary mask hence obtained is superimposed on the original input slice.
Grayscale Conversion—In order to facilitate computation of the optical flow magnitudes, the masked pixel intensities of the image volume are converted from signed 16 bit integers to unsigned 8 bit intensity representations for gray scale values.
Thresholding—In order to achieve further reduction in the image space, an thresholding using groundtruth masked nodule minimal and maximal pixel intensities was also applied on the input image volume.
Frame Selection
The input to this module is a 3-D array of voxel intesities and the output is two frames selected from the 3-D array for further computation. There are two submodules in doing frame selection. The first is subvolume selection and the second is image pair selection.
Subvolume Selection
The 3-D array of voxel intensities are made of multiple 2-D slices. One array of slices are selected from the 2-D slices for every single nodule which will be further processed to perform nodule segmentation. Each selected array of slices will contain a nodule and these slices may range from 1 to n. There can be multiple nodules in an image and hence there may be multiple sets of arrays of these 2-D slices obtained in this module. Identifying an array of slices, from a larger array slices is not a trivial problem. An algorithm for sub-volume selection is to be formulated and may be a problem for further research. This may use either optical flow-based techniques or intensity-based or other techniques to perform this operation. Throughout this work, using the information about sequence of images containing nodules as marked by the physicians a series of image slices containing nodules was selected as the subvolume for further processing.
Image Pair Selection Based on Choice of Mode
The input to this module is one or more subsets of slices obtained through the sub-volume selection, the previous module. The optical flow algorithm, next module, takes two images as input and gives the flow vectors, u and v as the output. These two input images are reference image and the current image. Given these images, it is assumed that the background does not change between these two images and the foreground is the one whose pixel positions change with respect to these two images. Based on how the reference and current images are selected, four modes namely, mode 0, mode 1, mode 2 and mode 3. The reason for repeating the methodology over multiple modes is mainly because optical flow-based methods use a pair of frames as input to compute the optical flow and the pair of images selected are not two arbitrary pairs but which are related temporally or spatially (in our case). It then becomes imperative to select such pair of frames so that the resultant flow vectors may offer sufficient information for object segmentation or to identify the object of interest. Hence to obtain a method to select input pair of frames, (for computing optical flows) multiple modes (0, 1, 2, and 3—with varying strides representing the variations in spatial separation) were experimented with. Varying strides are used (over modes 0, 1, 2, and 3) to analyze the variations between stationary/moving background and moving foregrounds.
The modes mentioned before are defined as follows:
- Mode 0—Fixed reference slice mode This mode help us understand if there is huge variation in the background in the subsequent slices which may hinder the segmentation of nodules in the slides. Initially, the previous slice (which does not contain the nodule) to the first slice containing nodule, in the array of slices selected in subvolume selection, will then be included in each array as the first slice of the array (with zeroeth or first index) so that it is used as a reference image and rest all slices in that array containing nodules are used as current images. The added slice to the array of slices is considered as the reference slice and is fixed. The current slice iterates from the second slice to the last slice of the array. The reference slice, current slice together form the pair of images to be used in the next phase. The terms “no nodule slice” refers to a slice without any nodule and “nodule slice” refers to a slice containing at least a nodule.
7
where i varies from 1 to n slices having nodules.8 -
Mode 1—Moving reference slice mode—1 slice difference If there is differences in the backgrounds, this mode helps minimize the segmentation errors due to fine variations in the background since we move the background as we iterate over the current slice. Mode 1 differs from mode 0 with respect to how reference image slice and the current slice are selected. The initial selection of reference slice and current slice are similar in both these nodes but the reference slice does not remain fixed then after during every iteration. The current slice in previous iteration becomes the reference slice of the next iteration while the current slice keeps changing as in mode 0. The difference between the indices of the reference slice and current slice, current slice index − reference slice index, is a constant, 1.
The reference slice and current slices can be represented as,9
where i varies from 1 to n slices having nodules.10 -
Mode 2 and Mode 3—Moving reference slice mode—2 and 3 slice differences In order to capture the variations in the differences in the backgrounds, these modes are also incorporated. As depicted earlier in mode 1, the difference between the reference and current slice is 1. In mode 2 and mode 3, while the step of iteration is 1, the index difference between the reference and current slice is 2 and 3 in mode 2 and mode 3 to capture the coarse and coarser variations in the background respectively.
For Mode 2,11
where i varies from 1 to n slices having nodules.12
For Mode 3,
| 13 |
| 14 |
where i varies from 1 to n slices having nodules.
Optical Flow
Optical flow is defined as the shift in the apparent brightness of the pixels that have been observed. The objective of optical flow algorithm is to find the motion field of a moving object. The original motion field of an object in a 3D-scene will be a three dimensional vector. When viewing this motion in a video sequence, it is observed as a sequence of images which are 2-D projections of this 3-D motion field vectors and hence the actual 3-D motion field is not observed. The idea behind optical flow, is to observe a pair of 2-D slices and to estimate every pixel motion in 2-D.
Optical flow methods are one of the methods used for segmenting the foreground object from the background based on image motion. Optical flow estimation methods are feature based or pixel based. Feature-based methods use features like corners and edges and use these features for tracking between two frames. These methods are sparse methods and they are suitable when there are large image motions. Conventional Lucas-Kande [31] method is one of the sparse methods which works based on the the corners. In this work, a modification of the Lucas-Kanade called dense Lucas-Kanade is used. Pixel-based methods are dense methods which is responsible for calculating the motion vectors for each and every pixel of the image and they are suitable when there are small image motions. Horn-Schunck [23] and Gunner Farneback [14] based optical flow methods are pixel-based dense optical flow methods. The optical flow equation (2), brightness constancy constraint equation, requires two optical flow parameters U and V to be computed, given only one equation whose simplification leads to an ambiguity in solving the unknowns called as aperture problem. Hence, additional constraints such as spatial constraints and temporal constraints are introduced to compute the unknowns. In this work, three optical flow methods, namely Lucas-Kanade, Horn-Schunk and Farneback methods, have been used to segment the lung nodules.
Lucas-Kanade: Conventional Lucas-Kanade is the differential, sparse method for computing optical flow. Lucas-Kanade solves the aperture problem by considering the spatial coherence assumption. Lucas-Kanade calculates the motion vectors locally by considering a square window of pixels. Spatial Coherence constrains that these neighboring points move similarly along. Lucas-Kanade method of optical flow uses Shi Tomasi method for finding corners, to be used as feature for flow calculation.
Horn-Schunk: Horn-Schunk is a dense method of calculating the optical flow. Here, the optical flow is computed by assuming that the brightness intensity varies smoothly over the frames. The optical flow equation using this method can be solved by adding the smoothness constraint over the optical flow equation.
Gunner Farneback: Gunner Farneback method calculates the optical flow for all the pixels of the frame. He found a global displacement of pixel of two frames from the quadratic polynomial.
Post Processing
The output from the optical flow comprises of motion vectors given as u and v components which are projections of the motion in the x axis and the y axis of the image. Based on these motion vectors two kinds of visual outputs are generated, namely, patch and color visualisation.
Patch: Given the u and v components, the magnitude of the vector is found out and then its magnitude is thresholded to obtain a binary image. This binary image is representative of the segmented nodule mask.
Color visualisation: Similar to the patch computation the u and v components are used to compute the magnitude and the angle information. These are used to obtain an RGB representation.
Results and Discussion
This section presents the results obtained by applying the aforementioned procedure for segmentation and provides a detailed discussion and analysis on the same.
Graphical Results on LIDC-IDRI-0001
The input are a series of nodule and non-nodule dicom slices. Precisely, this input series comprises of a non-nodule slice followed by a sequence of nodule slices. The non-nodule slice is the reference slice. The reference slice of LIDC-IDRI-0001, slice number 85, is shown in Fig. 2. The current slice or noduled slice of LIDC-IDRI-0001, slice numbers 86, is shown in Fig. 3. A sample sequence from LIDC-IDRI-0001 comprising 6-dcm slices and their corresponding optical flow visualization is given in Fig. 4 and 5. Farneback, Horn-Schunck, Lucas-Kanade optical flow algorithms have been used for computing the flow vectors. The three columns in Figs. 4 and 5 show the visualisation of optical flow vectors obtained by applying the three discussed optical flow methods along with the nodule contour and the visualisation of optical flow vectors along the six rows show the the same computed between slice number 85 and the slice numbers 86 to 91 from LIDC-IDRI-0001 scan (Mode 0), The Fig. 4 shows the optical flow visualisation between parenchyma segmented image slice (in mode 0) without applying step 8 of the “?? ??” section and and the Fig. 5 shows the same applying step 8 of the “Parenchyma Segmentation” section and they are referred to as “without applying thresholding” (Fig. 4) and with applying thresholding (Fig. 5). As depicted in the visualisation, along first column of Figs. 4 and 5, the Farneback flow vector lengths are not unique to the nodule region. The flow vectors obtained from Horn-Schunk and Lucas-Kanade are more competitive in identifying the nodule region more precisely as depicted in columns 2 and 3 of Figs. 4 and 5.
Fig. 2.
Reference slice of LIDC-IDRI-0001, slice number 85
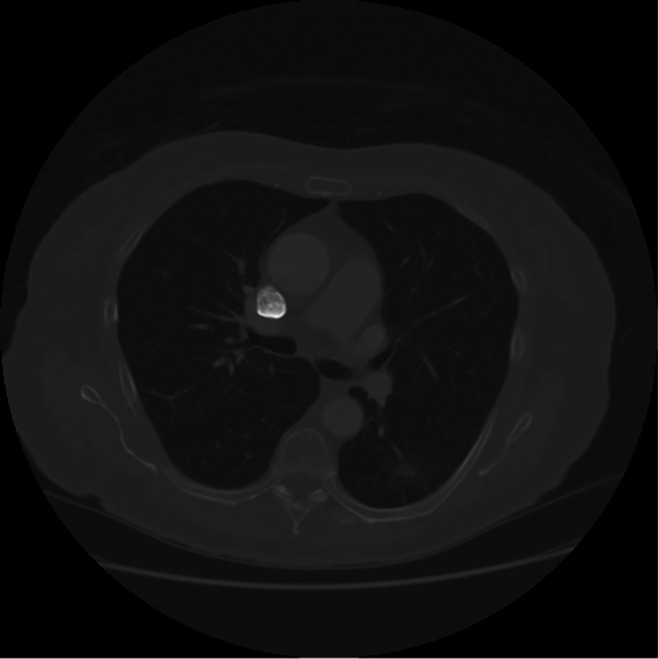
Fig. 3.

Current slice of LIDC-IDRI-0001, slice number 86
Fig. 4.

Visualization of the flow vectors of LIDC-IDRI-0001, obtained by applying the three discussed flow methods, namely Farneback, Horn-Schunk and dense Lucas-Kanade respectively with respect to slice numbers 86–91 obtained in reference to the reference slice 85 (mode 0) along with the nodule contour marked (in red) by the radiologist
Fig. 5.

Visualization of the flow vectors of LIDC-IDRI-0001, obtained by applying the three discussed flow methods, namely Farneback, Horn-Schunk and dense Lucas-Kanade respectively, with respect to thresholded slice numbers 86–91 obtained in reference to the reference slice 85 (mode 0) along with the nodule contour marked (in red) by the radiologist
Segmentation of Nodule Slices
Given the image volume, a series of the nodule slices are segmented from the input volume by identifying the noduled slices through the ground-truth image masks. In LIDC-IDRI-0001 image volume there was one nodule and the consensus region annotated by all four radiologists is identified as the nodule mask for six slices. These six slices range from slice index 86 to 91 of the input slice array and include reference image slice 85. A series of 2 noduled slices with the ground truth marked in red is shown in Fig. 6. The sample segmented mask obtained by applying optical flow (Horn-Schunck) is shown in Fig. 7.
Fig. 6.

Slice sequences of LIDC-IDRI-0001, slice numbers 86–87 along with the nodule contour (marked in red) as marked by the radiologist
Fig. 7.

Segmented Mask obtained by applying optical flow (Horn-Schunck)
Mode Selection
Given the series of 7 slices, after slice segmentation, these images are given as input for optical flow computation only in pairs. A pair of slices are chosen from the input series through different modes, mode 0, mode 1, mode 2 and mode 3. Mode 0 is fixed reference mode and rest modes are variable reference modes with difference between the index of reference slice and current slice being 1, 2, and 3 in mode 1, mode 2 and mode 3 respectively.
Table 1 lists the combination of reference slice, and current slice pairs in various modes. It can be observed that in mode 0, the reference slice remains fixed and in other modes the reference mode is changing.
Table 1.
Mode combinations of slice pairs
| Mode No. | Reference and current slice pairs | No. of pairs |
|---|---|---|
| 0 | (1,2), (1,3), (1,4), (1,5), (1,6), (1,7) | 6 |
| 1 | (1,2), (2,3), (3,4), (4,5), (5,6), (6,7) | 6 |
| 2 | (1,3), (2,4), (3,5), (4,6), (5,7) | 5 |
| 3 | (1,4), (2,5), (3,6), (4,7) | 4 |
Preprocessing
The selected slice pairs are preprocessed with parenchyma segmentation as discussed in the “Parenchyma Segmentation” section followed by optional thresholding. The results after applying preprocessing step using only segmentation are displayed in Fig. 8 or both segmentation and thresholding techniques.
Fig. 8.

LIDC-IDRI-0001, slice number 86—After applying parenchyma segmentation
Application of Dense Optical Flow and Output Segmented Mask
The so obtained, optionally segmented or optionally thresholded slices, are input to dense optical flow methods such as Farneback, Horn-Schunk and dense Lucas-Kanade methods to obtain the optical flow in terms of u and v matrices. These are then used to compute the Euclidean norm of the optical flow. These are then thresholded to obtain the output segmented mask. The results after applying optical flow and computing Euclidean norm and thresholding on one of the pairs are displayed in Fig. 7.
Statistical Optical Flow Results on Image Volumes
This subsection discusses and compares the results obtained after applying the three optical flow methods on LIDC-IDRI-0001. The sensitivity, specificity and accuracy statistics have been obtained by comparing the segmented image with the consensus image (of four radiologist) by considering it as the ground-truth image and the same has been listed in Tables 2, 3 and 4 for all three optical flow methods discussed. It can also observed that in general, the segmented mask after thresholding fare better than without thresholding.
Table 2.
Farneback optical flow method—Mode 0
| Reference slice | Current slice | Farneback optical flow (Min absolute flow—0.5, Max absolute flow—2) | ||||||
|---|---|---|---|---|---|---|---|---|
| TP | TN | FP | FN | Sensitivity | Specificity | Accuracy | ||
| 86 | 87 | 440 | 239,728 | 21,751 | 225 | 0.66 | 0.92 | 0.92 |
| 86 | 88 | 509 | 255,283 | 6071 | 281 | 0.64 | 0.98 | 0.98 |
| 86 | 89 | 67 | 257,433 | 3787 | 857 | 0.07 | 0.99 | 0.98 |
| 86 | 90 | 15 | 255,945 | 5310 | 874 | 0.02 | 0.98 | 0.98 |
| 86 | 91 | 103 | 255,650 | 5709 | 682 | 0.13 | 0.98 | 0.98 |
| 86 | 92 | 448 | 249,150 | 12,334 | 212 | 0.68 | 0.95 | 0.95 |
| 86 | 93 | 237 | 256,169 | 5522 | 216 | 0.52 | 0.98 | 0.98 |
| Average | 259.86 | 252,765.43 | 8640.57 | 478.14 | 0.39 | 0.97 | 0.97 | |
Table 3.
Horn-Schunck optical flow method—Mode 0
| Reference slice | Current slice | Horn-Schunck optical flow (Min absolute flow—1.5, Max absolute flow—22) | ||||||
|---|---|---|---|---|---|---|---|---|
| TP | TN | FP | FN | Sensitivity | Specificity | Accuracy | ||
| 86 | 87 | 552 | 246,614 | 14,865 | 113 | 0.83 | 0.94 | 0.94 |
| 86 | 88 | 473 | 242,616 | 18,738 | 317 | 0.6 | 0.93 | 0.93 |
| 86 | 89 | 443 | 238,300 | 22,920 | 481 | 0.48 | 0.91 | 0.91 |
| 86 | 90 | 425 | 242,458 | 18,797 | 464 | 0.48 | 0.93 | 0.93 |
| 86 | 91 | 328 | 248,886 | 12,473 | 457 | 0.42 | 0.95 | 0.95 |
| 86 | 92 | 408 | 247,445 | 14,039 | 252 | 0.62 | 0.95 | 0.95 |
| 86 | 93 | 341 | 247,398 | 14,293 | 112 | 0.75 | 0.95 | 0.95 |
| Average | 424.29 | 244,816.71 | 16,589.29 | 313.71 | 0.6 | 0.94 | 0.94 | |
Table 4.
Lucas-Kanade optical flow method—Mode 0
| Reference slice | Current slice | Lucas-Kanade optical flow (Min absolute flow—60, Max absolute flow—400) | ||||||
|---|---|---|---|---|---|---|---|---|
| TP | TN | FP | FN | Sensitivity | Specificity | Accuracy | ||
| 86 | 87 | 609 | 252,938 | 8541 | 56 | 0.92 | 0.97 | 0.97 |
| 86 | 88 | 560 | 256,922 | 4432 | 230 | 0.71 | 0.98 | 0.98 |
| 86 | 89 | 782 | 256,062 | 5158 | 142 | 0.85 | 0.98 | 0.98 |
| 86 | 90 | 756 | 257,133 | 4122 | 133 | 0.85 | 0.98 | 0.98 |
| 86 | 91 | 718 | 259,146 | 2213 | 67 | 0.91 | 0.99 | 0.99 |
| 86 | 92 | 517 | 259,444 | 2040 | 143 | 0.78 | 0.99 | 0.99 |
| 86 | 93 | 425 | 254,756 | 6935 | 28 | 0.94 | 0.97 | 0.97 |
| Average | 623.86 | 256,628.71 | 4777.29 | 114.14 | 0.85 | 0.98 | 0.98 | |
Comparison of Modes
Tables 5 and 6 list the sensitivity, specificity and accuracy values obtained by the four modes, the four pair selection strategies, for both with thresholding and without thresholding cases. Although the specificity and accuracy values are more or less similar across all modes, the sum total of these values are consistently higher for Mode 0 in both tables. Mode 1 comes close and is comparable with mode 0.
Table 5.
Mode comparison of three optical flow methods—without thresholding
| Mode No. | Farneback optical flow | Horn-Schunck optical flow | Lucas-Kanade optical flow | ||||||
|---|---|---|---|---|---|---|---|---|---|
| Sensitivity | Specificity | Accuracy | Sensitivity | Specificity | Accuracy | Sensitivity | Specificity | Accuracy | |
| 0 | 0.23 | 0.97 | 0.97 | 0.7 | 0.87 | 0.87 | 0.82 | 0.94 | 0.94 |
| 1 | 0.63 | 0.89 | 0.89 | 0.75 | 0.89 | 0.89 | 0.37 | 0.96 | 0.96 |
| 2 | 0.19 | 0.97 | 0.96 | 0.73 | 0.88 | 0.88 | 0.52 | 0.94 | 0.94 |
| 3 | 0.09 | 0.98 | 0.98 | 0.7 | 0.87 | 0.87 | 0.59 | 0.94 | 0.94 |
Table 6.
Mode comparison of three optical flow methods—with thresholding
| Mode No. | Farneback optical flow | Horn-Schunck optical flow | Lucas-Kanade optical flow | ||||||
|---|---|---|---|---|---|---|---|---|---|
| Sensitivity | Specificity | Accuracy | Sensitivity | Specificity | Accuracy | Sensitivity | Specificity | Accuracy | |
| 0 | 0.39 | 0.97 | 0.97 | 0.6 | 0.94 | 0.94 | 0.85 | 0.98 | 0.98 |
| 1 | 0.57 | 0.98 | 0.97 | 0.66 | 0.97 | 0.97 | 0.39 | 0.99 | 0.99 |
| 2 | 0.37 | 0.99 | 0.99 | 0.7 | 0.95 | 0.95 | 0.49 | 0.98 | 0.98 |
| 3 | 0.18 | 0.99 | 0.99 | 0.66 | 0.93 | 0.93 | 0.57 | 0.98 | 0.98 |
Comparison of Optical Flow Methods
Tables 5 and 6 also compare the results obtained after applying all three optical flow methods. When the average of sensitivity, specificity and accuracy are compared across all modes, the sensitivity of Horn-Schunk is higher than other optical flow methods but the specicifity and accuracy of Lucas-Kanade and Farneback are higher than average specicifity and accuracy of Horn-Schunck. The sensitivity of Lucas-Kanade is in between.
These results should be looked in conjunction with Tables 2, 3 and 4 which lists the True Positive, True Negative, False Positive and False Negative statistics required for computing Table 6. This clearly shows that the dense Lucas-Kanade optical flow method distinctly outperforms the other optical flow computational methods in terms of lower number of false positives and more number of true positives and true negatives. It can also be observed from table that the parameters, minimum optical flow vector magnitude and maximum optical flow vector magnitude used for obtaining these outputs are different for different optical flow methods. This is due to the variations in the u and v vectors obtained from these optical flow methods when applied on same pair of images. This difference in optical flow intensities can also be observed through the flow visualization images displayed in Figs. 4, 5.
Comparison of Thresholding and No Thresholding
It is fairly straightforward from Tables 5, 6 that the results are far better in case of thresholded images than those obtained without thresholding.
Comparison of Optical Flow Algorithms
Comparison of optical flow methods across 16 nodules from LIDC-0001 to LIDC-0041. The Tables 7, 8, 9 list the statistics for some 16 randomly selected nodules from LIDC-IDRI-0001 to LIDC-IDRI-0041. The average values on all the selected patient IDs are listed in Tables 7, 8, 9. For all volume of images, the specificity and accuracy using three optical flow methods are quite comparable. For LIDC-IDRI-0006, the Farnebak optical flow sensitivity is higher than other approaches. The sensitivity of Lucas-Kanade is higher for image volumes 0001,0016-nod1,006-nod5 and 0041. For the rest of the image volumes, Horn-Schunk performs better and overall Horn-Schunk performs better than other methods. This superior performance may be due to the addition of smoothness constraint in the method.
Table 7.
Average LIDC—Farneback optical flow
| Patient ID | Farneback optical flow (Min absolute flow—0.5, Max absolute flow—2) | ||||||
|---|---|---|---|---|---|---|---|
| TP | TN | FP | FN | Sensitivity | Specificity | Accuracy | |
| LIDC-IDRI-0001 | 259.86 | 252,765.43 | 8640.57 | 478.14 | 0.39 | 0.97 | 0.97 |
| LIDC-IDRI-0006 | 48.5 | 232,846.5 | 29,248.5 | 0.5 | 0.75 | 0.89 | 0.89 |
| LIDC-IDRI-0011-nod1 | 23 | 252,543.67 | 9534 | 43.33 | 0.38 | 0.96 | 0.96 |
| LIDC-IDRI-0011-nod2 | 33 | 232,087 | 30,024 | 0 | 1 | 0.89 | 0.89 |
| LIDC-IDRI-0011-nod3 | 44.6 | 253,809.8 | 8232 | 57.6 | 0.3 | 0.97 | 0.97 |
| LIDC-IDRI-0016-nod1 | 48.25 | 250,527.5 | 11,287.5 | 280.75 | 0.14 | 0.96 | 0.96 |
| LIDC-IDRI-0016-nod2 | 76.67 | 248,253 | 13,721.33 | 93 | 0.5 | 0.95 | 0.95 |
| LIDC-IDRI-0016-nod3 | 40 | 241,207 | 20,854 | 43 | 0.46 | 0.92 | 0.92 |
| LIDC-IDRI-0016-nod4 | 15 | 236,055 | 26,030 | 44 | 0.25 | 0.9 | 0.9 |
| LIDC-IDRI-0016-nod5 | 21.17 | 260,043 | 1806 | 273.83 | 0.12 | 1 | 1 |
| LIDC-IDRI-00021 | 7.2 | 25,193.2 | 5901 | 42.6 | 0.2 | 0.98 | 0.98 |
| LIDC-IDRI-0031-nod1 | 44.67 | 253,091.33 | 8969 | 39 | 0.55 | 0.97 | 0.97 |
| LIDC-IDRI-0031-nod2 | 5.33 | 251,450 | 10,662.33 | 26.33 | 0.33 | 0.96 | 0.96 |
| LIDC-IDRI-0031-nod3 | 4.88 | 256,146.13 | 5872.5 | 120.5 | 0.12 | 0.98 | 0.98 |
| LIDC-IDRI-00036 | 10.14 | 251,119.71 | 10,963.71 | 50.43 | 0.14 | 0.96 | 0.96 |
| LIDC-IDRI-00041 | 123 | 250,911 | 10,957.83 | 152.17 | 0.39 | 0.96 | 0.96 |
Table 8.
Average LIDC—Horn-Schunck optical flow
| Patient ID | Horn-Schunck optical flow (Min absolute flow—1.5, Max absolute flow—22) | ||||||
|---|---|---|---|---|---|---|---|
| TP | TN | FP | FN | Sensitivity | Specificity | Accuracy | |
| LIDC-IDRI-0001 | 424.29 | 244,816.71 | 16,589.29 | 313.71 | 0.6 | 0.94 | 0.94 |
| LIDC-IDRI-0006 | 21 | 217,355 | 44,740 | 28 | 0.71 | 0.83 | 0.83 |
| LIDC-IDRI-0011-nod1 | 45.33 | 248,427.67 | 13,650 | 21 | 0.63 | 0.95 | 0.95 |
| LIDC-IDRI-0011-nod2 | 16 | 235,029 | 27,082 | 17 | 0.48 | 0.9 | 0.9 |
| LIDC-IDRI-0011-nod3 | 88.6 | 240,627.2 | 21,414.6 | 13.6 | 0.86 | 0.92 | 0.92 |
| LIDC-IDRI-0016-nod1 | 237 | 231,701.75 | 30,113.25 | 92 | 0.72 | 0.89 | 0.89 |
| LIDC-IDRI-0016-nod2 | 157 | 228,708 | 33,266.33 | 12.67 | 0.89 | 0.88 | 0.88 |
| LIDC-IDRI-0016-nod3 | 69.5 | 232,368 | 29,693 | 13.5 | 0.84 | 0.89 | 0.89 |
| LIDC-IDRI-0016-nod4 | 17 | 239,454 | 22,631 | 42 | 0.29 | 0.91 | 0.91 |
| LIDC-IDRI-0016-nod5 | 239.17 | 248,354.83 | 13,494.17 | 55.83 | 0.83 | 0.95 | 0.95 |
| LIDC-IDRI-00021 | 33.4 | 243,613.4 | 18,480.8 | 16.4 | 0.73 | 0.93 | 0.93 |
| LIDC-IDRI-0031-nod1 | 76.67 | 234,963.33 | 27,097 | 7 | 0.91 | 0.9 | 0.9 |
| LIDC-IDRI-0031-nod2 | 27 | 246,694.67 | 15,417.67 | 4.67 | 0.83 | 0.94 | 0.94 |
| LIDC-IDRI-0031-nod3 | 102.38 | 241,660.88 | 20,357.75 | 23 | 0.87 | 0.92 | 0.92 |
| LIDC-IDRI-00036 | 56.57 | 240,896.71 | 21,186.71 | 4 | 0.93 | 0.92 | 0.92 |
| LIDC-IDRI-00041 | 218 | 228,866.33 | 33,002.5 | 57.17 | 0.81 | 0.87 | 0.87 |
Table 9.
Average LIDC—Lucas-Kanade optical flow
| Patient ID | Lucas-Kanade optical flow (Min absolute flow—60 , Max absolute flow—400) | ||||||
|---|---|---|---|---|---|---|---|
| TP | TN | FP | FN | Sensitivity | Specificity | Accuracy | |
| LIDC-IDRI-0001 | 623.86 | 256,628.71 | 4777.29 | 114.14 | 0.85 | 0.98 | 0.98 |
| LIDC-IDRI-0006 | 10.5 | 242,358.5 | 19,736.5 | 38.5 | 0.11 | 0.93 | 0.925 |
| LIDC-IDRI-0011-nod1 | 28 | 254,170 | 7907.67 | 38.33 | 0.38 | 0.97 | 0.97 |
| LIDC-IDRI-0011-nod2 | 0 | 252,232 | 9879 | 33 | 0 | 0.96 | 0.96 |
| LIDC-IDRI-0011-nod3 | 96 | 254,037 | 8004.8 | 6.2 | 0.82 | 0.97 | 0.97 |
| LIDC-IDRI-0016-nod1 | 305.25 | 245,907.75 | 15,907.25 | 23.75 | 0.93 | 0.94 | 0.94 |
| LIDC-IDRI-0016-nod2 | 140.33 | 247,829.67 | 14,144.67 | 29.33 | 0.76 | 0.94 | 0.94 |
| LIDC-IDRI-0016-nod3 | 52.5 | 248,817.5 | 13,243.5 | 30.5 | 0.63 | 0.95 | 0.95 |
| LIDC-IDRI-0016-nod4 | 3 | 254,306 | 7779 | 56 | 0.05 | 0.97 | 0.97 |
| LIDC-IDRI-0016-nod5 | 261 | 258,060.5 | 3788.5 | 34 | 0.85 | 0.99 | 0.99 |
| LIDC-IDRI-00021 | 28.8 | 256,069.8 | 6024.4 | 21 | 0.39 | 0.98 | 0.98 |
| LIDC-IDRI-0031-nod1 | 71.67 | 248,925 | 13,135.33 | 12 | 0.85 | 0.95 | 0.95 |
| LIDC-IDRI-0031-nod2 | 23.33 | 257,203.67 | 4908.67 | 8.33 | 0.62 | 0.98 | 0.98 |
| LIDC-IDRI-0031-nod3 | 108.25 | 255,588.38 | 6430.25 | 17.13 | 0.71 | 0.98 | 0.98 |
| LIDC-IDRI-00036 | 51.57 | 255,922.86 | 6160.57 | 9 | 0.61 | 0.98 | 0.98 |
| LIDC-IDRI-00041 | 256 | 242,930.5 | 18,938.33 | 19.17 | 0.92 | 0.93 | 0.93 |
Comparison with Other Nodule Segmentation Methods
Table 10 compares the nodule segmentation methods from the literature with the work described in this paper. The optical flow method considered for nodule segmentation is Horn-Schunk optical flow. As the comparison lists, the work by Sudipta et al. [34]. is comparable with the proposed approach. The proposed work presents better result in terms of sensitivity than Sudipta et al. [34]. The results with respect to accuracy and specificity are comparable with the results obtained by other methods. It can also be observed that the results published considered more nodules and the proposed work requires to be tested for more number of nodules and scans.
Table 10.
Comparison with other nodule segmentation methods
| SN | Reference | Approach | Dataset | Nodule information | Evaluation measures |
|---|---|---|---|---|---|
| 1 | Soudeh et al., 2014 [40] | Multiscale dot enhancement filter, 3D blob detector with log kernel and volumetric shape index (SI) | LIDC-IDRI | 42 scans, 7346 slices, 124 nodules | Accuracy: NA; Sensitivity: 0.959; Specificity: NA |
| 2 | Sudipta Mukhopadhyay et al., 2016 [34] | Thresholding, CCA and isotropic diffusion filter | LIDC-IDRI | 891 nodules | Accuracy: 0.99; Sensitivity: 0.58; Specificity: 0.99 |
| 3 | Firmino et al., 2016 [15] | Watershed and histogram of gradients | LIDC-IDRI | 1109 nodules | Accuracy: 0.97; Sensitivity: 0.944; Specificity: NA |
| 4 | Shaukat et al., 2017 [43] | Multiscale dot enhancement filter, optimal thresholding | LIDC-IDRI | 850 scans | Accuracy: NA; Sensitivity: 0.942; Specificity: NA |
| 5 | Naqi et al., 2018 [35] | Morphological operations, edge detection, bounding box and shape information | LIDC-IDRI | 567 scans | Accuracy: NA; Sensitivity: NA; Specificity: NA |
| 6 | Proposed work | Optical flow-based nodule segmentation (Horn-Schunk) | LIDC-IDRI | 41 scans, 16 nodules | Accuracy: 0.90; Sensitivity: 0.745; Specificity: 0.90 |
Summary of Observations
While the preliminary results are interesting, it has been observed that effect of thresholding on the results are highly significant. Whenever thresholding was applied the intensity threshold values were obtained by masking the nodule region using ground truth (consensus nodule region) and the maximum intensity and minimum intensity values were obtained. This was performed only to check the effectiveness of the optical flow methods. The threshold length to be applied on magnitude of optical flow to obtain patches were also obtained similarly. The dependence of the proposed optical flow-based nodule segmentation approach on thresholding is quite evident and this is mainly due to the sensitiveness of optical flow approaches to noise in images. This dependence requires to be reduced.
Conclusion
This paper has provided some preliminary results on applying optical flow methods to medical images, the thoracic images for nodule segmentation. Optical flow methods require two input image frames to compute the flow vector. To best choose a pair of images, four modes of operation were defined and used to select pairs of images from given set of input images. It was found that mode 0 outperforms other modes. Three optical flow methods namely Farneback, Horn-Schunk and Lucas-Kanade were used to compute the optical flows and Horn-Schunk was found to be more effective in detecting nodules. The major difficulty in using optical flow for segmentation is the effect of noise on optical flow computations. Hence there is a need for thresholding to mask the noise which reduces the generalized applicability of the algorithm. Further, this paper, while expands the work by Cavalcanti et al. [8] to check other optical flow algorithms for nodule segmentation, addresses two of three issues in their work. While the results obtained are encouraging, these also leave scope for further research in terms of comparing these methods by varying the preprocessing methods, modeling the background movement etc., which may improve the results obtained further.
Acknowledgements
This work was carried out at ABV-IIITM Gwalior, India with funding from DST, Govt. of India. The File Number is SR/WOSA/ET-153/2017
Compliance with Ethical Standards
Conflict of Interest
The authors declare that they have no conflict of interest.
Footnotes
Publisher’s Note
Springer Nature remains neutral with regard to jurisdictional claims in published maps and institutional affiliations.
Contributor Information
R. Jenkin Suji, Email: sujijenkin@gmail.com.
Sarita Singh Bhadouria, Email: saritamits61@yahoo.co.in.
Joydip Dhar, Email: jdhar@iiitm.ac.in.
W. Wilfred Godfrey, Email: godfrey@iiitm.ac.in.
References
- 1.Adams R, Bischof L. Seeded region growing. IEEE Trans Pattern Anal Mach Intell. 1994;16(6):641–647. [Google Scholar]
- 2.Armato SG, III, McLennan G, Bidaut L, McNitt-Gray MF, Meyer CR, Reeves AP, Zhao B, Aberle DR, Henschke CI, Hoffman EA, et al. The lung image database consortium (lidc) and image database resource initiative (idri): a completed reference database of lung nodules on ct scans. Med Phys. 2011;38(2):915–931. doi: 10.1118/1.3528204. [DOI] [PMC free article] [PubMed] [Google Scholar]
- 3.Badura P, Piętka E: Pre-and postprocessing stages in fuzzy connectedness-based lung nodule cad.. In: Information technologies in biomedicine. Springer, 2008, pp 192–199
- 4.Badura P, Pietka E. Soft computing approach to 3d lung nodule segmentation in ct. Comput Biol Med. 2014;53:230–243. doi: 10.1016/j.compbiomed.2014.08.005. [DOI] [PubMed] [Google Scholar]
- 5.Bagci U, Chen X, Udupa JK. Hierarchical scale-based multiobject recognition of 3-d anatomical structures. IEEE Trans Med Imaging. 2011;31(3):777–789. doi: 10.1109/TMI.2011.2180920. [DOI] [PubMed] [Google Scholar]
- 6.Béatrice P. P., Cagnazzo M, Dufaux F (2011) Motion estimation techniques. https://pdfs.semanticscholar.org/98ca/f8325abb40aa6bbddd0e7f5d3a6c366d03e6.pdf/
- 7.Boykov Y, Jolly MP: Interactive organ segmentation using graph cuts.. In: International conference on medical image computing and computer-assisted intervention. Springer, 2000, pp 276–286
- 8.Cavalcanti PG, Shirani S, Scharcanski J, Fong C, Meng J, Castelli J, Koff D. Lung nodule segmentation in chest computed tomography using a novel background estimation method. Quantitative Imaging in Medicine and Surgery. 2016;6(1):16. doi: 10.3978/j.issn.2223-4292.2016.02.06. [DOI] [PMC free article] [PubMed] [Google Scholar]
- 9.Cha J, Farhangi MM, Dunlap N, Amini AA. Segmentation and tracking of lung nodules via graph-cuts incorporating shape prior and motion from 4d ct. Medical Physics. 2018;45(1):297–306. doi: 10.1002/mp.12690. [DOI] [PubMed] [Google Scholar]
- 10.Choromańska A, Macura KJ. Evaluation of solitary pulmonary nodule detected during computed tomography examination. Polish Journal of Radiology. 2012;77(2):22. doi: 10.12659/pjr.882967. [DOI] [PMC free article] [PubMed] [Google Scholar]
- 11.Dhara AK, Mukhopadhyay S, Khandelwal N. Computer-aided detection and analysis of pulmonary nodule from ct images: A survey. IETE Tech Rev. 2012;29(4):265–275. [Google Scholar]
- 12.Farag AA, El Munim HEA, Graham JH, Farag AA. A novel approach for lung nodules segmentation in chest ct using level sets. IEEE Trans Image Process. 2013;22(12):5202–5213. doi: 10.1109/TIP.2013.2282899. [DOI] [PubMed] [Google Scholar]
- 13.Farhangi MM, Frigui H, Seow A, Amini AA. 3-d active contour segmentation based on sparse linear combination of training shapes (scots) IEEE Trans Med Imaging. 2017;36(11):2239–2249. doi: 10.1109/TMI.2017.2720119. [DOI] [PubMed] [Google Scholar]
- 14.Farnebäck G: Two-frame motion estimation based on polynomial expansion.. In: Scandinavian conference on Image analysis. Springer, 2003, pp 363–370
- 15.Firmino M, Angelo G, Morais H, Dantas MR, Valentim R. Computer-aided detection (cade) and diagnosis (cadx) system for lung cancer with likelihood of malignancy. Biomedical Engineering Online. 2016;15(1):2. doi: 10.1186/s12938-015-0120-7. [DOI] [PMC free article] [PubMed] [Google Scholar]
- 16.Firmino M, Morais AH, Mendoċa RM, Dantas MR, Hekis HR, Valentim R. Computer-aided detection system for lung cancer in computed tomography scans: review and future prospects. Biomedical Engineering Online. 2014;13(1):41. doi: 10.1186/1475-925X-13-41. [DOI] [PMC free article] [PubMed] [Google Scholar]
- 17.Galperin-Aizenberg M, Katz S, Shankla V, Wileyto E, Gefter W, Dougherty L, Torigian D, Barbosa Jr E (2020) Preliminary assessment of an optical flow method (ofm) for non-rigid registration and temporal subtraction (ts) of serial ct examinations to facilitate evaluation of interval change in metastatic lung nodules. Current Problems in Diagnostic Radiology [DOI] [PubMed]
- 18.Gong J, Liu JY, Wang L, Sun XW, Zheng B, Nie SD. Automatic detection of pulmonary nodules in ct images by incorporating 3d tensor filtering with local image feature analysis. Physica Medica. 2018;46:124–133. doi: 10.1016/j.ejmp.2018.01.019. [DOI] [PubMed] [Google Scholar]
- 19.Grady L (2006) Random walks for image segmentation. IEEE Transactions on Pattern Analysis & Machine Intelligence (11):1768–1783 [DOI] [PubMed]
- 20.Guo L, Zhang Y, Zhang Z, Li D, Li Y. An improved random walk segmentation on the lung nodules. International Journal of Biomathematics. 2013;6(06):1350043. [Google Scholar]
- 21.Gupta A, Saar T, Martens O, Moullec L. Automatic detection of multi–size pulmonary nodules in ct images: large scale validation of a multi–layer perceptron based false positive reduction step. Med Phys. 2018;45(3):1135–1149. doi: 10.1002/mp.12746. [DOI] [PubMed] [Google Scholar]
- 22.Hao R, Qiang Y, Yan X (2018) Juxta-vascular pulmonary nodule segmentation in pet-ct imaging based on an lbf active contour model with information entropy and joint vector. Computational and mathematical methods in medicine, pp 2018 [DOI] [PMC free article] [PubMed]
- 23.Horn BK, Schunck BG. Determining optical flow. Artificial Intelligence. 1981;17(1-3):185–203. [Google Scholar]
- 24.Hu H, Wang Q, Tang H, Xiong L, Lin Q. Multi-slice computed tomography characteristics of solitary pulmonary ground-glass nodules: Differences between malignant and benign. Thoracic Cancer. 2016;7(1):80–87. doi: 10.1111/1759-7714.12280. [DOI] [PMC free article] [PubMed] [Google Scholar]
- 25.Hua P, Song Q, Sonka M, Hoffman EA, Reinhardt JM: Segmentation of pathological and diseased lung tissue in ct images using a graph-search algorithm.. In: 2011 IEEE International Symposium on Biomedical Imaging: From Nano to Macro. IEEE, 2011, pp 2072–2075
- 26.Javaid M, Javid M, Rehman MZU, Shah SIA. A novel approach to cad system for the detection of lung nodules in ct images. Computer Methods and Programs in Biomedicine. 2016;135:125–139. doi: 10.1016/j.cmpb.2016.07.031. [DOI] [PubMed] [Google Scholar]
- 27.Khordehchi EA, Ayatollahi A, Daliri MR. Automatic lung nodule detection based on statistical region merging and support vector machines. Image Analysis & Stereology. 2017;36(2):65–78. [Google Scholar]
- 28.Krishnamurthy S, Narasimhan G, Rengasamy U. Three-dimensional lung nodule segmentation and shape variance analysis to detect lung cancer with reduced false positives. Proceedings of the Institution of Mechanical Engineers Part H: Journal of Engineering in Medicine. 2016;230(1):58–70. doi: 10.1177/0954411915619951. [DOI] [PubMed] [Google Scholar]
- 29.Li B, Chen K, Peng G, Guo Y, Tian L, Ou S, Wang L. Segmentation of ground glass opacity pulmonary nodules using an integrated active contour model with wavelet energy-based adaptive local energy and posterior probability-based speed function. Materials Express. 2016;6(4):317–327. [Google Scholar]
- 30.Liu JK, Jiang HY, He CG, Wang Y, Wang P, Ma H, et al. An assisted diagnosis system for detection of early pulmonary nodule in computed tomography images. Journal of Medical Systems. 2017;41(2):30. doi: 10.1007/s10916-016-0669-0. [DOI] [PubMed] [Google Scholar]
- 31.Lucas BD, Kanade T, et al. (1981) An iterative image registration technique with an application to stereo vision
- 32.Mansoor A, Bagci U, Foster B, Xu Z, Papadakis GZ, Folio LR, Udupa JK, Mollura DJ. Segmentation and image analysis of abnormal lungs at ct: current approaches, challenges, and future trends. RadioGraphics. 2015;35(4):1056–1076. doi: 10.1148/rg.2015140232. [DOI] [PMC free article] [PubMed] [Google Scholar]
- 33.Mansoor A, Bagci U, Xu Z, Foster B, Olivier KN, Elinoff JM, Suffredini AF, Udupa JK, Mollura DJ. A generic approach to pathological lung segmentation. IEEE Trans Med Imaging. 2014;33(12):2293–2310. doi: 10.1109/TMI.2014.2337057. [DOI] [PMC free article] [PubMed] [Google Scholar]
- 34.Mukhopadhyay S. A segmentation framework of pulmonary nodules in lung ct images. Journal of Digital Imaging. 2016;29(1):86–103. doi: 10.1007/s10278-015-9801-9. [DOI] [PMC free article] [PubMed] [Google Scholar]
- 35.Naqi SM, Sharif M, Yasmin M. Multistage segmentation model and svm-ensemble for precise lung nodule detection. Int J Comput Assist Radiol Surg. 2018;13(7):1083–1095. doi: 10.1007/s11548-018-1715-9. [DOI] [PubMed] [Google Scholar]
- 36.Netto SMB, Silva AC, Nunes RA, Gattass M. Automatic segmentation of lung nodules with growing neural gas and support vector machine. Comput Biol Med. 2012;42(11):1110–1121. doi: 10.1016/j.compbiomed.2012.09.003. [DOI] [PubMed] [Google Scholar]
- 37.Nithila EE, Kumar S. Segmentation of lung nodule in ct data using active contour model and fuzzy c-mean clustering. Alexandria Engineering Journal. 2016;55(3):2583–2588. [Google Scholar]
- 38.Paing MP, Hamamoto K, Tungjitkusolmun S, Visitsattapongse S, Pintavirooj C. Automatic detection of pulmonary nodules using three-dimensional chain coding and optimized random forest. Appl Sci. 2020;10(7):2346. [Google Scholar]
- 39.Saien S, Moghaddam HA, Fathian M. A unified methodology based on sparse field level sets and boosting algorithms for false positives reduction in lung nodules detection. Int J Comput Assist Radiol Surg. 2018;13(3):397–409. doi: 10.1007/s11548-017-1656-8. [DOI] [PubMed] [Google Scholar]
- 40.Saien S, Pilevar AH, Moghaddam HA. Refinement of lung nodule candidates based on local geometric shape analysis and laplacian of gaussian kernels. Comput Biol Med. 2014;54:188–198. doi: 10.1016/j.compbiomed.2014.09.010. [DOI] [PubMed] [Google Scholar]
- 41.Sellathamby D (2011) Lung segmentation data science bowl 2017. https://www.kaggle.com/dineshsellathamby/lung-segmentation/https://www.kaggle.com/dineshsellathamby/lung-segmentation/. Accessed 2019-08-10
- 42.Shaukat F, Raja G, Frangi AF. Computer-aided detection of lung nodules: A review. J Med Imaging. 2019;6(2):020901. [Google Scholar]
- 43.Shaukat F, Raja G, Gooya A, Frangi AF. Fully automatic detection of lung nodules in ct images using a hybrid feature set. Medical Phys. 2017;44(7):3615–3629. doi: 10.1002/mp.12273. [DOI] [PubMed] [Google Scholar]
- 44.Sluimer I, Prokop M, Van Ginneken B. Toward automated segmentation of the pathological lung in ct. IEEE Trans Med Imaging. 2005;24(8):1025–1038. doi: 10.1109/TMI.2005.851757. [DOI] [PubMed] [Google Scholar]
- 45.Suji RJ, Bhadouria SS, Dhar J, Godfrey WW: Optical flow based background subtraction method for lung nodule segmentation.. In: International conference on computer vision and image processing. Springer, 2019, pp 261–269
- 46.Tajbakhsh N, Suzuki K. Comparing two classes of end-to-end machine-learning models in lung nodule detection and classification: Mtanns vs. cnns. Pattern Recognition. 2017;63:476–486. [Google Scholar]
- 47.Tan Y, Schwartz LH, Zhao B. Segmentation of lung lesions on ct scans using watershed, active contours, and Markov random field. Med Physics. 2013;40(4):043502. doi: 10.1118/1.4793409. [DOI] [PMC free article] [PubMed] [Google Scholar]
- 48.Teramoto A, Fujita H, Yamamuro O, Tamaki T. Automated detection of pulmonary nodules in pet/ct images: Ensemble false-positive reduction using a convolutional neural network technique. Medical Phys. 2016;43(6Part1):2821–2827. doi: 10.1118/1.4948498. [DOI] [PubMed] [Google Scholar]
- 49.Usman M, Lee BD, Byon SS, Kim SH, IlLee B (2019) Volumetric lung nodule segmentation using adaptive roi with multi-view residual learning. arXiv:1912.13335 [DOI] [PMC free article] [PubMed]
- 50.Wang S, Zhou M, Liu Z, Liu Z, Gu D, Zang Y, Dong D, Gevaert O, Tian J. Central focused convolutional neural networks: Developing a data-driven model for lung nodule segmentation. Medical Image Analysis. 2017;40:172–183. doi: 10.1016/j.media.2017.06.014. [DOI] [PMC free article] [PubMed] [Google Scholar]
- 51.Wang YXJ, Gong JS, Suzuki K, Morcos SK. Evidence based imaging strategies for solitary pulmonary nodule. Journal of Thoracic Disease. 2014;6(7):872. doi: 10.3978/j.issn.2072-1439.2014.07.26. [DOI] [PMC free article] [PubMed] [Google Scholar]
- 52.Zhang G, Jiang S, Yang Z, Gong L, Ma X, Zhou Z, Bao C, Liu Q. Automatic nodule detection for lung cancer in ct images: A review. Comput Biol Med. 2018;103:287–300. doi: 10.1016/j.compbiomed.2018.10.033. [DOI] [PubMed] [Google Scholar]
- 53.Zhang J, Xia Y, Cui H, Zhang Y. Pulmonary nodule detection in medical images: a survey. Biomed ignal Process Control. 2018;43:138–147. [Google Scholar]
- 54.Zhang W, Wang X, Li X, Chen J. 3d skeletonization feature based computer-aided detection system for pulmonary nodules in ct datasets. Comput Biol Med. 2018;92:64–72. doi: 10.1016/j.compbiomed.2017.11.008. [DOI] [PubMed] [Google Scholar]