

Abstract
Determination of the magnitude of body iron stores helps to identify individuals at risk of iron-induced organ damage in Thalassemia patients. The most direct clinical method of measuring liver iron concentration (LIC) is through chemical analysis of needle biopsy specimens. Here we present a noninvasive method for the measurement of LIC in vivo using magnetic resonance imaging (MRI). Twenty-three pediatric Thalassemia major patients undergoing bone marrow transplantation at our centre were studied. All 23 patients had MRI T2* and R2* decay time for evaluation of LIC on a 1.5 Tesla MRI system followed by liver tissue biopsy for the assessment of iron concentration using an atomic absorption spectrometry. Simultaneously, serum ferritin levels were measured by enzymatic assay. We have correlated biopsy LIC with liver T2* and serum ferritin values with liver R2*. Of the 23 patients 11 were males, the mean age was 8.3 ± 3.7 years. The study results showed a significant correlation between biopsy LIC and liver T2* MRI (r = 0.768; p < 0.001). Also, there was a significant correlation between serum ferritin levels and liver R2* MRI (r = 0.5647; p < 0.01). Two patients had high variance in serum ferritin levels (2100 and 4100 mg/g) while their LIC was around 24 mg/g, whereas the difference was not seen in T2* MRI. Hence, the liver T2* MRI is a better modality for assessing LIC. Serum ferritin is less reliable than quantitative MRI. The liver T2* MRI is a safe, reliable, feasible and cost-effective method compared to liver tissue biopsy for LIC assessment.
Keywords: Thalassemia, Bone marrow transplant, Liver iron concentration, Magnetic resonance image, T2* MRI, R2* MRI
Introduction
Iron overload is associated with hereditary hemochromatosis, Thalassemia, sickle cell disease, aplastic anemia, myelodysplasia, and others [1]. The body iron burden is a principal determinant of clinical outcome in all forms of systemic iron overload, whether from red blood cell transfusion or increased dietary iron absorption or both. Accurate assessment of the body iron burden is an essential step for managing iron chelation therapy to prevent iron toxicity and to avoid the adverse effects of excess chelator administration. In Thalassemia Major patients, determination of the magnitude of body iron stores permits identification of individuals at risk of iron-induced organ damage who would benefit from chelation therapy.
The simplest methods available for assessment of body iron levels are biochemical measurements of the serum iron concentration, transferrin saturation, and ferritin concentration [2, 3]. However, tissue iron levels may not be accurately identified by serum biochemical tests due to confounding factors such as infection, inflammation, and malignancy [4, 5]. Measurement of the liver iron concentration (LIC) is the reference method for evaluating the magnitude of body iron load in systemic iron overload patients. The most direct clinical method of measuring LIC is through chemical analysis of needle biopsy specimens [6]. The biopsy sample can also be used for detection of liver fibrosis and cirrhosis, which have important prognostic implications for survival and risk of hepatocellular carcinoma. Though biopsy based LIC is the most accurate method for estimation of hepatic iron load, it is uneven in case of cirrhosis and it is an invasive procedure may require hospitalization due to complications in some cases. However, these measurements are subject to sampling variability, owing mainly to the small size of the biopsy relative to the whole liver.
The variation in LIC throughout the liver increases as iron loading increases and with the development of cirrhosis. Ideally, multiple sites samples are required to get the mean LIC [7]. The coefficient of variation for multiple needle biopsy measurements of LICs from individual liver ranges from an average of 19% for disease-free liver to an average of more than 40% for end-stage liver disease for typical needle biopsy sample dry masses of less than 4 mg [8]. The analytical component of the variability has been estimated to be in the region of 3 to 7% [9]. Furthermore, the invasive nature and risks associated with liver needle biopsy preclude serial observations.
Here we present a noninvasive method for the measurement of LICs in vivo through the measurement of gradient echo (GRE) decay of signal, computed using magnetic resonance imaging (MRI) [10]. In this present study we compared iron overload in the liver by liver biopsy (invasive method) and MRI (non-invasive method) in Thalassemia Major patients undergoing Bone Marrow Transplantation (BMT) at our centre.
Materials and Methods
Patients
Twenty-three pediatric Thalassemia Major patients undergoing BMT at a tertiary care teaching hospital in Bangalore, India, were studied. This study included patients aged 2–18 years, since the centre predominantly perform BMT for pediatric age group in case of Thalassemia Major. Patients who had infection or coagulopathy and non-Thalassemia patients were excluded from the study. This study was approved by an independent institutional ethics committee and review board.
Liver Iron Measurement by MRI
All patients underwent MRI study in a 1.5 Tesla MR system (GE Signa HD, Milwaukee, WI, USA). Body coil was used to avoid signal drop-off and to ensure the highest uniformity in the signal-to-noise ratio throughout the scanned volume. Electrocardiogram (ECG) leads were connected to patient’s chest wall. Localizers were performed to ascertain imaging plane. These were followed by calibration images.
'White blood' non-ECG gated imaging of the chest and upper abdomen was performed in free breathing. Variant T2* imaging of heart and liver were performed in single breath hold technique. Images of the heart were performed in the short axis plane while the images of the liver were obtained in the standard axial plane. Imaging is performed at different millisecond (ms) intervals to assess the magnitude and speed of the decay of signal. This decay of signal is influenced by the amount of paramagnetic substance such as iron within the tissue. In areas with high concentration of iron, there is quick and significant decay of signal leading to a short T2* value which is calculated in ms (Figs. 1, 2). T2* values were derived by using an average of three region of interests (Fig. 3) as previously described by Garbowski et al. [11]. A R2* value was also calculated from the T2* with the following formula: R2* = 1000/T2*. The scan parameters include TE = variable ranging from 1 to 16 ms, TR = 18–37 ms, flip angle = 20–25, FOV = 50–400 mm, matrix (frequency × phase) 256 × 256 pixels, slice thickness = 5–8 mm and band width = 125. The total scan time was 5 to 10 min with an average of 8 min.
Fig. 1.

Image showing decay of signal (liver getting darker) with time in a patient with moderate LIC
Fig. 2.

Image showing decay of signal (liver getting darker) with time in a patient with severe LIC
Fig. 3.

Magnetic resonance image with three regions of interests where the signal was pcalculated to determine the magnitude and speed of the signal decay
Determination of Liver Iron Concentration by Liver Biopsy
All biopsies for biochemical LIC measurement were performed within a 30-day interval from the MRI date. Biopsies were obtained in a routine clinical manner from the right liver lobe using an 18-gauge biopsy needle and placed in a 10% buffered formalin solution. Both histological analysis and LIC measurement were performed in-house hospital laboratory from the biopsy sample. For the LIC measurement, an approximately 1 cm core of the needle biopsy specimen was dried in a microwave oven, ashed and weighed. The average weight of the specimen in biochemical analysis was 1.34 mg. The iron concentration analysis of the specimens was performed in histopathology laboratory by using an atomic absorption spectrometry.
Serum ferritin level was measured in-house laboratory by chemiluminescence immunoassay (Siemens Healthcare Diagnostic Inc., Tarrytown, NY, USA). Mean value of serum ferritin level was recorded during last 3 months and it was measured in patients who showed no evidence of bacterial or viral infection.
Statistical Analysis
The statistical analysis were performed by STATA 11.2 (College Station, TX, USA) and Microsoft Excel 2007. Pearson correlation coefficient was used to find the relationship between the Biopsy LIC with MRI LIC, serum ferritin with liver R2* and serum ferritin with biopsy LIC. Kruskal–Wallis test was used to find the significant difference between the hepatic load with serum ferritin and biopsy. Fisher exact test was used to measure the association between the hepatic load and cardiac load. Demographic characters of age and gender were analyzed. A p value < 0.05 was considered statistically significant.
Results
Out of 23 Thalassemia Major patients, 11 (46%) were males, the mean age was 8.3 ± 3.7 (range 2–18) years. Sixteen (70%) patients were below 10 years of age, complete details of baseline characteristics are presented in Table 1. LIC grading calculated from T2* MRI was compared with biopsy LIC and categorized to mild, moderate and severe according to iron load (Table 2). Six (26%) patients had shown mild hepatic iron overload, 10 (45%) patients showed moderate hepatic iron overload and 7 (30%) had patients showed severe hepatic iron overload. The mean biopsy LIC value was 1.41 ± 1.23 mg Fe/g (mild), 2.14 ± 1.18 mg Fe/g (moderate) and 4.19 ± 2.29 mg Fe/g (severe).
Table 1.
Basic demographics and clinical details of the study patients
| Sl. no. | Age (years) | Sex | Liver T2* (ms) | Liver R2* (Hz) | Hepatic load grade | MRI LIC (mg/g) | Serum ferritin (ng/mL) | Biopsy LIC (mg/g) |
|---|---|---|---|---|---|---|---|---|
| 1 | 6 | M | 1.3 | 769 | Mild | 24.48 | 2157.3 | 6.325 |
| 2 | 12 | F | 4.5 | 222.2 | Moderate | 6.95 | 1812.2 | 3.428 |
| 3 | 13 | F | 3.6 | 277.8 | Moderate | 8.71 | 3355.5 | 3.868 |
| 4 | 7 | F | 3.3 | 303 | Mild | 9.52 | 1629.9 | 1.503 |
| 5 | 8 | F | 10 | 100 | Moderate | 3.09 | 729.6 | 0.743 |
| 6 | 9 | M | 3.1 | 322.6 | Severe | 10.14 | 645.2 | 1.513 |
| 7 | 5 | M | 1.5 | 666.7 | Mild | 21.17 | 1934 | 5.274 |
| 8 | 6 | M | 5.6 | 178.6 | Moderate | 5.57 | 1246.7 | 1.25 |
| 9 | 4 | F | 2.3 | 434.8 | Moderate | 13.73 | 3182.9 | 2.548 |
| 10 | 5 | F | 4.1 | 243.9 | Moderate | 7.64 | 1639.1 | 0 |
| 11 | 2 | M | 4.3 | 232.6 | Severe | 7.28 | 2240.1 | 1.8 |
| 12 | 8 | M | 1.8 | 555.6 | Mild | 17.6 | 2213.5 | 1.7 |
| 13 | 8 | F | 14 | 71.4 | Mild | 2.2 | 884.2 | 0.49 |
| 14 | 5 | F | 11 | 90.9 | Severe | 2.81 | 394.2 | 0.256 |
| 15 | 11 | M | 2 | 500 | Severe | 15.82 | 4740 | 2.912 |
| 16 | 9 | F | 1 | 1000 | Moderate | 31.94 | 5595.4 | 7.515 |
| 17 | 10 | M | 4.3 | 232.6 | Moderate | 7.28 | 3354.8 | 3.213 |
| 18 | 14 | M | 2.3 | 434.8 | Moderate | 13.73 | 784 | 1.02 |
| 19 | 14 | M | 3.1 | 322.6 | Severe | 10.14 | 3984 | 2.7 |
| 20 | 12 | F | 1.3 | 769.2 | Severe | 24.48 | 4032 | 4.114 |
| 21 | 18 | F | 1.9 | 526.3 | Moderate | 16.66 | 2240 | 1.527 |
| 22 | 8 | M | 2.5 | 400 | Mild | 12.61 | 1534.2 | 3.194 |
| 23 | 10 | F | 15 | 66.7 | Mild | 2.05 | 2717 | 2.304 |
LIC, liver iron concentration; MRI, magnetic resonance image; M, male; F, female; T2*, T2 star; R2*, R2 star
Table 2.
Measurement of LIC by different MRI parameters
| Hepatic iron overload grade | T2* liver MRI (ms) | R2* liver MRI (Hz) | LIC (mg/g) |
|---|---|---|---|
| Normal | > 15.4 | < 65 | < 2 |
| Mild | 4.5–15.4 | 65–224 | 2–7 |
| Moderate | 2.1–4.5 | 224–475 | 7–15 |
| Severe | < 2.1 | > 475 | > 15 |
LIC, liver iron concentration; MRI, magnetic resonance image; T2*, T2 star; R2*, R2 star
There was a significant correlation between the biopsy LIC and MRI T2* (r = 0.768; p < 0.001), and serum ferritin with MRI R2* (r = 0.5647; p < 0.01 (Fig. 4). But at an individual level, there was high variance in serum ferritin value for a given biopsy LIC. There is a linear correlation with increase in 1 mg/g of LIC and variance of 212 serum ferritin. Lowest serum ferritin in patient with severe LIC was 2157 ng/dL.
Fig. 4.
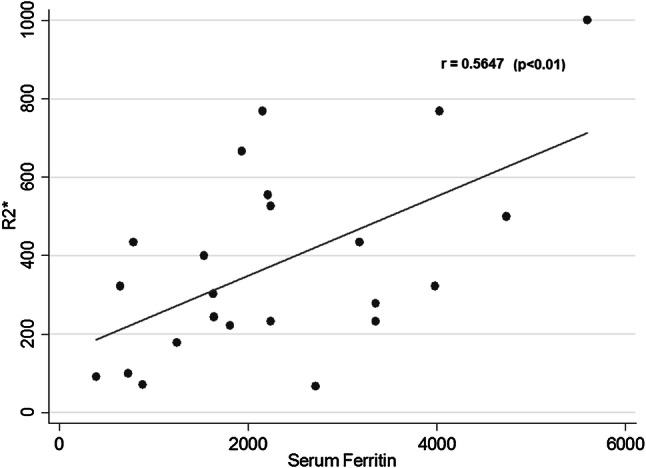
Correlation between serum ferritin and R2* (r = 0.5647; p < 0.01)
Liver T2* MRI had a better correlation with biopsy LIC than serum ferritin with biopsy LIC. However, two patients had high variance in serum ferritin levels for a given LIC (2100 vs 4100, whose LIC was around 24 mg/g), whereas the difference was not seen in liver T2* MRI.
The hepatic iron load in mild (n = 6), moderate (n = 10) and severe (n = 7) group was 1297.32 ± 847.56, 2234.97 ± 1169.63 and 3273.17 ± 1491.59 mg/g, respectively. The correlation between T2* MRI and serum ferritin was statistically significant (p < 0.01). On the other hand, cardiac iron overload was assessed by the same method and myocardial iron concentration was calculated accordingly. There was no association between the hepatic iron load and myocardial iron concentration (p = 1.000).
Discussion
Liver biopsy is a routine procedure followed at our centre before BMT to know the fibrosis and grading of Thalassemia Major patients according to Pessaro classification. To overcome this invasive procedure, especially in pediatric patients, there is a need for an alternative and effective method. Non-invasive assessment of LIC is increasingly used as an alternative to biopsy, and for clinicians to have evidence-based guidelines for the management of iron overload [12, 13]. It is important that LIC measurements are comparable across studies and treatment centers. Recently, considerable effort has been undertaken to standardize the assessment of myocardial iron with T2* across centers internationally, but knowledge about different measures of LIC comparison is relatively limited. It is convenient for patients and clinicians if LIC can be assessed by MRI at the same time as myocardial T2* [14]. However, the measurement of LIC by T2*, as originally described in 2001, was undertaken as a proof of concept: namely that tissue T2* was related to tissue iron concentrations [15]. To the best of our knowledge this is the first such study being reported in the Indian subcontinent.
The variability of needle biopsy LIC is dependent on the biopsy specimen size [16]. The covariance is approximately 19% when < 4 mg/g dry weight [7] and 9% when > 9 mg/g dry weight [17] on fibrosis content, and > 40% in the presence of cirrhosis [7]. In this present study, 23 patients had both liver biopsy and liver MRI (T2* and R2*) examinations performed uneventfully. Liver MRI examinations averaged 5–10 min; no liver biopsy related complications were noticed throughout the study. Eghbali et al. [18] showed a significant correlation between serum ferritin levels and liver T2* MRI (r = − 0.297, p < 0.05) in 60 β-Thalassemia Major patients. Whereas another study found no correlation (r = 0.2655, 95% CI 0.1570 to 0.6059, p = 0.1995) between mean ferritin and LIC using the Spearman test [14]. The probable reason would be that those patients were under chelation therapy.
In our study, we found a significant correlation between serum ferritin and R2* MRI (r = 0.5647, p < 0.01) as shown in the previous literatures. However, at an individual level we observed high variance in serum ferritin levels for a given LIC. There was a linear correlation with increase in 1 mg/g of LIC and variance of 189 ng/dL serum ferritin. Lowest serum ferritin in patient with severe LIC was 1934 ng/dL. These weak associations, are lower than other associations with liver biopsy, supports that the ferritin cannot be an accurate predictor of LIC. Existing literatures has shown that, there is a significant correlation between R2*MRI value and biopsy LIC [19, 20], and a less significant relationship between biopsy LIC and serum ferritin [20].
Our study results had shown association between serum ferritin with R2* MRI with slight variation among association, might be due to smaller sample size, this was supported by existing studies [18, 21]. In contrast, another study reported no correlation among the serum ferritin with R2 (T2*) MRI [14]. This is a retrospective study also included Thalassemia intermedia patients in the analysis, but in our present study, we have excluded those patients and preformed a prospective evaluation. The difference could be due to the patient’s inclusion criteria. Some literatures showed that there is a positive correlation (r = 0.69 to 0.76) between serum ferritin and biopsy LIC in Thalassemia patients. But there was a wide variation in correlation at an individual level [22, 23]. The present study showed, a significant correlation between the liver tissue biopsy and serum ferritin (r = 0.661; p < 0.001) (Fig. 5) and also significant correlation between biopsy LIC and liver T2* MRI (r = 0.768; p < 0.001) (Fig. 6).
Fig. 5.

Correlation between biopsy LIC and serum ferritin (r = 0.661; p < 0.001)
Fig. 6.

Correlation between biopsy LIC and MRI LIC (r = 0.768; p < 0.001)
At an individual level, we have noticed a high variance in serum ferritin value for a given LIC (two patients had a serum ferritin of 2100 and 4100 while LIC was around 24 mg/g). There is a linear correlation with increase in 1 mg/g of LIC, the lowest serum ferritin level in patient with severe LIC was 2157 ng/dL, which was consistent and comparable with other discussed studies. Among the above mentioned three correlations, between liver T2* MRI and biopsy LIC is strongly correlated than the other correlations, such as serum ferritin with MRI and biopsy LIC with serum ferritin. Also, there was no wide variation in LIC (mg/g) values at an individual level what had been seen with serum ferritin in other two objectives in comparison with patients.
Mandal et al. [24] from India reported significant negative correlation between liver T2* and serum ferritin levels, and moderate negative correlation between cardiac T2* and serum ferritin in pediatric Thalassemia Major patients. The authors also reported moderate positive correlation between LIC and serum ferritin levels.
Another study from Iran reported significant positive correlation between serum ferritin levels with LIC, and significant negative correlation with cardia T2* and liver T2* in Thalassemia patients [25]. This study included both Thalassemia Major and Intermedia patients. But in our study, we have included only Thalassemia Major patients. Majd et al. [25] study focused to find out whether serum ferritin levels can be used as a parameter for detecting liver and cardiac iron load.
In contrast, our study focused on, liver T2* (R2*) MRI can be used as an alternative to liver tissue biopsy measurement of LIC. We also studied the correlation between cardiac T2* MRI with Hepatic and serum ferritin and we did not find any correlation between these parameters. The correlation was not significant, it could be due to the smaller sample size. However, our finding was similar to the other published larger study where they reported no correlation between the cardiac T2*MRI with serum ferritin and hepatic load [18, 26].
While considering liver tissue biopsy procedures, hemorrhagic complications are most commonly associated with liver biopsies in the reported literatures [16, 27, 28]. All these studies performed the procedure with imaging in operation room under anesthesia. However, in our study we didn’t find any hemorrhagic complications, or any other complication or mortality related to procedure. We safely obtained sufficient hepatic tissue by percutaneous liver biopsy.
Use of MRI to monitor iron overload, says that the complication rate is acceptable, typically about 0.5%, but life-threatening hemorrhages occur [16]. The single greatest limitation of this method is spatial heterogeneity of tissue iron deposition in the liver that can result in high sampling variability, even in the absence of significant liver disease.
The estimated cost of MRI liver and cardiac for iron overload in our centre is approximately 3500 Indian rupees (60 USD) while the biopsy of liver tissue for LIC is around 12,500 Indian rupees (200 USD). Hence, the cost effectiveness and safety profile for MRI is justified by the optimal accuracy of the iron quantification assay by MRI, and lack of reliability of serum ferritin as an indicator of iron overload.
The present study included only Thalassemia Major patients who undergo bone marrow transplant. Though the sample size is smaller, but it is comparable to existing published literatures with 25 patients [11, 14] and another study with 8 patients [6].
Conclusions
Here we present a noninvasive method for the measuring liver iron overload using clinical magnetic resonance imaging. Our study findings confirm that there is a significant correlation between iron overload measured by MRI and liver biopsy. Hence, MRI can be used as an alternative to liver biopsy method for the measurement of iron overload in Thalassemia Major patients undergoing bone marrow transplantation. However, a larger population study is required to strengthen our findings.
Limitations of the study
This study included only pediatric Thalassemia Major patients.
Funding
This research did not receive any specific grant from government of private funding agencies.
Compliance with Ethical Standards
Conflict of interest
The authors declare that they have no conflict of interest.
Footnotes
Publisher's Note
Springer Nature remains neutral with regard to jurisdictional claims in published maps and institutional affiliations.
References
- 1.Brittenham GM, Badman DG, National Institute of Diabetes and Digestive and Kidney Diseases ( NIDDK. ) Workshop Noninvasive measurement of iron: report of an NIDDK workshop. Blood. 2003;101:15–19. doi: 10.1182/blood-2002-06-1723. [DOI] [PubMed] [Google Scholar]
- 2.Worwood M. The laboratory assessment of iron status—an update. Clin Chim Acta Int J Clin Chem. 1997;259:3–23. doi: 10.1016/S0009-8981(96)06488-1. [DOI] [PubMed] [Google Scholar]
- 3.Brittenham GM, Sheth S, Allen CJ, Farrell DE. Noninvasive methods for quantitative assessment of transfusional iron overload in sickle cell disease. Semin Hematol. 2001;38:37–56. doi: 10.1016/S0037-1963(01)90059-9. [DOI] [PubMed] [Google Scholar]
- 4.Lee MH, Means RT. Extremely elevated serum ferritin levels in a university hospital: associated diseases and clinical significance. Am J Med. 1995;98:566–571. doi: 10.1016/S0002-9343(99)80015-1. [DOI] [PubMed] [Google Scholar]
- 5.Olive A, Junca J. Elevated serum ferritin levels: associated diseases and clinical significance. Am J Med. 1996;101:120. [PubMed] [Google Scholar]
- 6.Villeneuve JP, Bilodeau M, Lepage R, Côté J, Lefebvre M. Variability in hepatic iron concentration measurement from needle-biopsy specimens. J Hepatol. 1996;25:172–177. doi: 10.1016/S0168-8278(96)80070-5. [DOI] [PubMed] [Google Scholar]
- 7.Emond MJ, Bronner MP, Carlson TH, Lin M, Labbe RF, Kowdley KV. Quantitative study of the variability of hepatic iron concentrations. Clin Chem. 1999;45:340–346. doi: 10.1093/clinchem/45.3.340. [DOI] [PubMed] [Google Scholar]
- 8.Kreeftenberg HG, Koopman BJ, Huizenga JR, van Vilsteren T, Wolthers BG, Gips CH. Measurement of iron in liver biopsies—a comparison of three analytical methods. Clin Chim Acta Int J Clin Chem. 1984;144:255–262. doi: 10.1016/0009-8981(84)90061-5. [DOI] [PubMed] [Google Scholar]
- 9.Koh TS, Benson TH, Judson GJ. Trace element analysis of bovine liver: interlaboratory survey in Australia and New Zealand. J Assoc Off Anal Chem. 1980;63:809–813. [PubMed] [Google Scholar]
- 10.Clark PR, Chua-anusorn W, St Pierre TG. Bi-exponential proton transverse relaxation rate (R2) image analysis using RF field intensity-weighted spin density projection: potential for R2 measurement of iron-loaded liver. Magn Reson Imaging. 2003;21:519–530. doi: 10.1016/S0730-725X(03)00080-8. [DOI] [PubMed] [Google Scholar]
- 11.Garbowski MW, Carpenter JP, Smith G, Roughton M, Alam MH, He T, et al. Biopsy-based calibration of T2* magnetic resonance for estimation of liver iron concentration and comparison with R2 Ferriscan. J Cardiovasc Magn Reson. 2014;16:40–51. doi: 10.1186/1532-429X-16-40. [DOI] [PMC free article] [PubMed] [Google Scholar]
- 12.Fischer R, Harmatz PR. Non-invasive assessment of tissue iron overload. Hematol Am Soc Hematol Educ Program. 2009 doi: 10.1182/asheducation-2009.1.215. [DOI] [PubMed] [Google Scholar]
- 13.Gianesin B, Zefiro D, Musso M, Rosa A, Bruzzone C, Balocco M, et al. Measurement of liver iron overload: noninvasive calibration of MRI-R2* by magnetic iron detector susceptometer. Magn Reson Med. 2012;67:1782–1786. doi: 10.1002/mrm.23148. [DOI] [PubMed] [Google Scholar]
- 14.Angulo IL, Covas DT, Carneiro AA, Baffa O, Elias Junior J, Vilela G. Determination of iron-overload in thalassemia by hepatic MRI and ferritin. Rev Bras Hematol E Hemoter. 2008;30:449–452. [Google Scholar]
- 15.Anderson LJ, Holden S, Davis B, Prescott E, Charrier CC, Bunce NH, et al. Cardiovascular T2-star (T2*) magnetic resonance for the early diagnosis of myocardial iron overload. Eur Heart J. 2001;22:2171–2179. doi: 10.1053/euhj.2001.2822. [DOI] [PubMed] [Google Scholar]
- 16.Angelucci E, Baronciani D, Lucarelli G, Baldassarri M, Galimberti M, Giardini C, et al. Needle liver biopsy in thalassaemia: analyses of diagnostic accuracy and safety in 1184 consecutive biopsies. Br J Haematol. 1995;89:757–761. doi: 10.1111/j.1365-2141.1995.tb08412.x. [DOI] [PubMed] [Google Scholar]
- 17.Barry M, Sherlock S. Measurement of liver-iron concentration in needle-biopsy specimens. Lancet Lond Engl. 1971;1:100–103. doi: 10.1016/S0140-6736(71)90838-5. [DOI] [PubMed] [Google Scholar]
- 18.Eghbali A, Taherahmadi H, Shahbazi M, Bagheri B, Ebrahimi L. Association between serum ferritin level, cardiac and hepatic T2-star MRI in patients with major β-thalassemia. Iran J Pediatr Hematol Oncol. 2014;4:17–21. [PMC free article] [PubMed] [Google Scholar]
- 19.St Pierre TG, Clark PR, Chua-Anusorn W. Measurement and mapping of liver iron concentrations using magnetic resonance imaging. Ann N Y Acad Sci. 2005;1054:379–385. doi: 10.1196/annals.1345.046. [DOI] [PubMed] [Google Scholar]
- 20.Alexopoulou E, Stripeli F, Baras P, Seimenis I, Kattamis A, Ladis V, et al. R2 relaxometry with MRI for the quantification of tissue iron overload in beta-thalassemic patients. J Magn Reson Imaging. 2006;23:163–170. doi: 10.1002/jmri.20489. [DOI] [PubMed] [Google Scholar]
- 21.Hankins JS, McCarville MB, Loeffler RB, Smeltzer MP, Onciu M, Hoffer FA, et al. R2* magnetic resonance imaging of the liver in patients with iron overload. Blood. 2009;113:4853–4855. doi: 10.1182/blood-2008-12-191643. [DOI] [PMC free article] [PubMed] [Google Scholar]
- 22.Brittenham GM, Cohen AR, McLaren CE, Martin MB, Griffith PM, Nienhuis AW, et al. Hepatic iron stores and plasma ferritin concentration in patients with sickle cell anemia and thalassemia major. Am J Hematol. 1993;42:81–85. doi: 10.1002/ajh.2830420116. [DOI] [PubMed] [Google Scholar]
- 23.Nielsen P, Fischer R, Engelhardt R, Tondüry P, Gabbe EE, Janka GE. Liver iron stores in patients with secondary haemosiderosis under iron chelation therapy with deferoxamine or deferiprone. Br J Haematol. 1995;91:827–833. doi: 10.1111/j.1365-2141.1995.tb05396.x. [DOI] [PubMed] [Google Scholar]
- 24.Mandal S, Sodhi KS, Bansal D, Sinha A, Bhatia A, Trehan A, et al. MRI for quantification of liver and cardiac iron in Thalassemia Major patients: pilot study in Indian population. Indian J Pediatr. 2017;84:276–282. doi: 10.1007/s12098-017-2310-8. [DOI] [PubMed] [Google Scholar]
- 25.Majd Z, Haghpanah S, Ajami GH, Matin S, Namazi H, Bardestani M, et al. Serum ferritin levels correlation with heart and liver MRI and LIC in patients with transfusion-dependent Thalassemia. Iran Red Crescent Med J. 2015;17:e24959. doi: 10.5812/ircmj.17(4)2015.24959. [DOI] [PMC free article] [PubMed] [Google Scholar]
- 26.Akcay A, Salcioglu Z, Oztarhan K, Tugcu D, Aydogan G, Ayaz NA, et al. Cardiac T2* MRI assessment in patients with thalassaemia major and its effect on the preference of chelation therapy. Int J Hematol. 2014;99:706–713. doi: 10.1007/s12185-014-1575-1. [DOI] [PubMed] [Google Scholar]
- 27.Kliewer MA, Sheafor DH, Paulson EK, Helsper RS, Hertzberg BS, Nelson RC. Percutaneous liver biopsy: a cost-benefit analysis comparing sonographic and CT guidance. AJR Am J Roentgenol. 1999;173:1199–1202. doi: 10.2214/ajr.173.5.10541088. [DOI] [PubMed] [Google Scholar]
- 28.Gilmore IT, Burroughs A, Murray-Lyon IM, Williams R, Jenkins D, Hopkins A. Indications, methods, and outcomes of percutaneous liver biopsy in England and Wales: an audit by the British Society of Gastroenterology and the Royal College of Physicians of London. Gut. 1995;36:437–441. doi: 10.1136/gut.36.3.437. [DOI] [PMC free article] [PubMed] [Google Scholar]