Abstract
This study aimed to construct a breast ultrasound computer-aided prediction model based on the convolutional neural network (CNN) and investigate its diagnostic efficiency in breast cancer. A retrospective analysis was carried out, including 5000 breast ultrasound images (benign: 2500; malignant: 2500) as the training group. Different prediction models were constructed using CNN (based on InceptionV3, VGG16, ResNet50, and VGG19). Additionally, the constructed prediction models were tested using 1007 images of the test group (benign: 788; malignant: 219). The receiver operating characteristic curves were drawn, and the corresponding areas under the curve (AUCs) were obtained. The model with the highest AUC was selected, and its diagnostic accuracy was compared with that obtained by sonographers who performed and interpreted ultrasonographic examinations using 683 images of the comparison group (benign: 493; malignant: 190). In the model test with the test group images, the AUCs of the constructed InceptionV3, VGG16, ResNet50, and VGG19 models were 0.905, 0.866, 0.851, and 0.847, respectively. The InceptionV3 model showed the largest AUC, with statistically significant differences compared with the other models (P < 0.05). In the classification of the comparison group images, the AUC (0.913) of the InceptionV3 model was larger than that (0.846) obtained by sonographers, showing a statistically significant difference (P < 0.05). The breast ultrasound computer-aided prediction model based on CNN showed high accuracy in the prediction of breast cancer.
Keywords: Breast cancer, Computer prediction model, Convolutional neural network, Diagnosis, Ultrasound
Introduction
Breast cancer is the most common cause of tumor and cancer deaths in females [1, 2]. Early detection, diagnosis, and treatment are the key to the diagnosis and treatment of breast cancer [2–4]. Ultrasonic examination is an important means for breast cancer screening because of its noninvasion, nonradiation, convenience, high efficiency, and low cost [4]. Ultrasound equipment has been widely used in China and is the first choice for breast cancer screening. However, the uneven distribution of medical resources and the uneven level of employees affect the screening effect. In addition, although the number of sonographers who perform ultrasonographic examinations, interpret the images, and issue diagnostic reports has increased currently, they cannot keep up with the growth in the requirement of ultrasound examinations. This has greatly increased the workload of sonographers and the probability of errors. The rapid development of artificial intelligence technology, such as deep learning, provides a new way to solve the aforementioned deficiency.
Artificial intelligence technology has developed rapidly in recent years. Image recognition is being widely used in daily life. Convolutional neural networks (CNNs) play an important role in image recognition [5]. Medical image data occupy the majority of medical data and have increased rapidly [6]. Deep learning, especially CNN, is being increasingly applied in this field [7].
At present, the application of deep learning in ultrasound has not been certificated by the State Food and Drug Administration of China, and not many products are available in the field of breast ultrasound. Previous studies on the application of deep learning in ultrasound achieved some results. However, most data sets used were small, and the training and validation sets were mostly data from the same institution. Moreover, most medical information (such as the lesion size and pathological type) was unknown, and the research results were difficult to measure.
This study aimed to construct a computer-aided prediction model based on ultrasound images mainly through breast ultrasound imaging and multiple classical CNNs. The predictive accuracy of the constructed models was compared, and the prediction model with the highest AUC was selected. Moreover, the diagnostic accuracy of the selected model was compared with that of previous sonographers.
Materials and Methods
Participants
This study was approved by the ethics committee of the relevant institutions. The breast ultrasound images of the training group were collected from other hospitals by the science and technology team in advance, which could not be disclosed. The breast ultrasound images of the test group were randomly extracted from the ultrasound workstation of the hospital from August 2016 to January 2017. The images of the comparison group were partial data of the test group with diagnostic conclusions of sonographers. The inclusion criteria were as follows: all cases with breast ultrasound examination had puncture biopsy or postoperative pathological conclusions, and the ultrasound images corresponded to pathological conclusions. The exclusion criteria were as follows: cases with the pathological diagnosis of a borderline tumor, unclear pathological diagnosis, or inconsistent pathological conclusions related to the lesion location described in the ultrasound report, as well as the cases receiving neoadjuvant chemotherapy for breast cancer. In addition, the images with multiple-color Doppler blood flow signals, markers for mass measurement, and traces of interventional operation were excluded. All the images included in this study were in Portable Network Graphics (PNG) format (compression algorithm: DEFLATE Compressed Data Format Specification version 1.3).
The breast ultrasound images included in this study were as follows: 5000 breast ultrasound images (benign: 2500; malignant: 2500) in the training group (for the construction of training and prediction model based on CNN); 1007 breast ultrasound images (benign: 788; malignant: 219) in the test group (for the test and comparison of CNN-based models); and 683 breast ultrasound images (benign: 493; malignant: 190) in the comparison group (for comparing CNN-based prediction model with sonographers).
The patients in both the test and the comparison groups were all female. The age of the patients in the test group was 12–76 years, with a mean age of 42.62 years. The mean age of the patients in the comparison group was 42.71 years, ranging from 12 to 76 years.
The masses in the test and comparison groups were classified according to the Breast Imaging Reporting and Data System (BI-RADS) proposed by the American College of Radiology (ACR) [8]. The BI-RADS classification and the long-diameter distribution of the aforementioned masses are shown in Tables 1 and 2. The main pathological types of all the masses in the test group and the comparison group are shown in Table 3.
Table 1.
BI-RADS classification and long-diameter distribution of the masses in the test group
| Long-diameter of the masses | Total | ||||
|---|---|---|---|---|---|
| ≤ 2 cm | 2–5 cm | ≥ 5 cm | |||
| BI-RADS category | 2 | 7 | 5 | 0 | 12 |
| 3 | 158 | 18 | 1 | 177 | |
| 4A | 363 | 141 | 4 | 508 | |
| 4B | 113 | 65 | 2 | 180 | |
| 4C | 42 | 78 | 4 | 124 | |
| 5 | 0 | 4 | 2 | 6 | |
| Total | 683 | 311 | 13 | 1007 | |
Table 2.
BI-RADS classification and long-diameter distribution of the masses in the comparison group
| Long-diameter of the masses | Total | ||||
|---|---|---|---|---|---|
| ≤ 2 cm | 2–5 cm | ≥ 5 cm | |||
| BI-RADS category | 2 | 7 | 5 | 0 | 12 |
| 3 | 92 | 14 | 0 | 106 | |
| 4A | 234 | 93 | 4 | 331 | |
| 4B | 68 | 48 | 2 | 118 | |
| 4C | 37 | 70 | 4 | 111 | |
| 5 | 0 | 3 | 2 | 5 | |
| Total | 438 | 233 | 12 | 683 | |
Table 3.
Histologies of the masses in the test and comparison groups
| Histology | Test group (n = 1007) | Comparison group (n = 683) |
|---|---|---|
| Fibrocystic breast disease | 320 | 195 |
| Fibroadenoma | 179 | 121 |
| Adenosis | 135 | 80 |
| Inflammatory lesions | 37 | 25 |
| Proliferative breast lesions | 17 | 12 |
| Benign phyllodes tumor | 7 | 7 |
| Cyst | 7 | 7 |
| Intraductal papilloma | 6 | 3 |
| Benign (not further specified) | 80 | 43 |
| Nonspecific invasive carcinoma | 172 | 151 |
| Ductal carcinoma in situ | 26 | 23 |
| Invasive lobular carcinoma | 8 | 7 |
| Mucinous carcinoma | 5 | 4 |
| Intraductal papillary carcinoma | 4 | 2 |
| Lymphoma | 2 | 2 |
| Paget’s disease | 1 | 1 |
| Solid papillary carcinoma | 1 | 0 |
Instruments and Methods
Instruments
The ultrasound instruments used in this study were Philips iU22 and HDI 5000 (Philips Medical Systems, WA, USA), VISION Preirus (Hitachi Medical, Tokyo, Japan), Esaote MyLab 90 (Esaote, Genova, Italy), and GE Logiq E9 (General Electric Healthcare, WI, USA). A high-frequency linear-array probe with a frequency of 5–15 MHz was used. The following equipment were used for the construction of the prediction models: a central processing unit, core I7-8700 (Intel, CA, USA); a graphics processing unit, GeForce GTX 1070 (NVIDIA, CA, USA); system, ubuntu 16.04; framework, TensorFLow (https://www.tensorflow.org); application programming interface, Keras; programing language, Python 3.6 (https://www.python.org); and integrated development environment, PyCharm.
Treatment by the medical team
Image labeling
Considering pathological diagnosis as the gold standard, each image was labeled as benign or malignant.
-
(2)
Desensitization of image data
Sensitive information, such as name and examination number of the patients, obtained during the breast ultrasound image acquisition was removed.
-
(3)
Manual marking of the region of interest
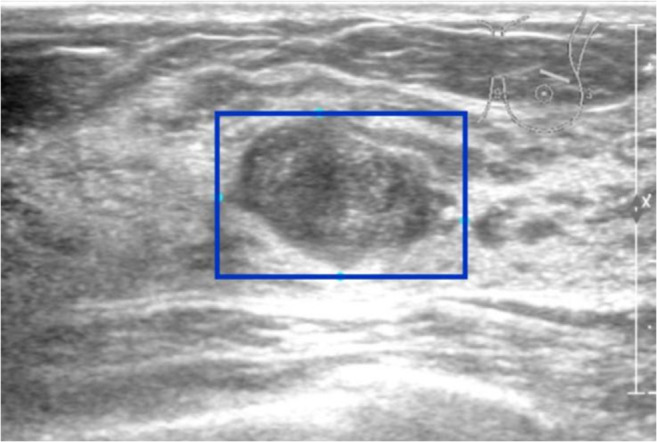
The regions of interest (ROIs) were selected in the images to reduce the processing time and increase the accuracy in subsequent processing steps. The whole lesion was accommodated in a rectangular frame (Fig. 1).
-
(4)
Statistics of diagnostic efficacy of previous sonographers
Fig. 1.

Manual marking of ROI (blue rectangular frame)
The diagnostic results of benign and malignant cases obtained by previous sonographers in the comparison group were evaluated, and the accuracy, sensitivity, specificity, positive predictive value, negative predictive value, misdiagnosis rate, and missed diagnosis rate were calculated.
Processing by the science and technology team
Interception of ROI
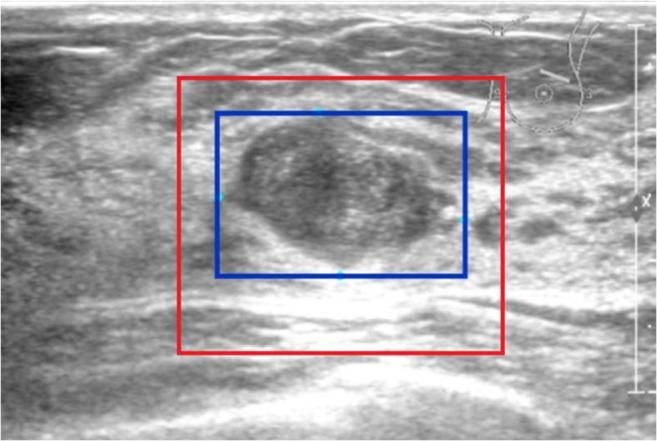
ROIs were separated from the original image (Fig. 2).
-
(2)
Data enhancement
Fig. 2.

Interception of ROI (red rectangular frame)
Some random transformations were made for the intercepted ROIs to increase the diversity of images, including random flipping, random rotation, random brightness, and random contrast.
-
(3)
Scaling of intercepted ROI
The size of the intercepted ROI was scaled to 224 × 224 (algorithm: Bilinear Interpolation), facilitating the computer to uniformly allocate the same computing resources so as to improve the training speed of the CNNs.
-
(4)
Construction of the prediction models
The images of the training group were input into the CNN-based VGG16, VGG19, ResNet50, and InceptionV3 models. In this study, two new full-connection layers were connected to the convolution layer of the original network. The softmax classifier was used to classify the features of breast masses in ultrasound images captured by CNN for the final classification of benign and malignant tumors. This study used five-fold cross-validation for transfer learning through ImageNet image set pre-trained CNN to construct the breast ultrasound computer-aided prediction model based on the aforementioned CNN.
-
(5)
Test
The images of the test group which contained the comparison group were input into the constructed breast ultrasound computer-aided prediction model based on CNN, and the corresponding prediction probability of breast cancer was obtained.
Statistical Methods
With the prediction probability of the prediction model for breast cancer as the test variable and the image label as the classification variable, the receiver operating characteristic (ROC) curve was drawn, and the corresponding area under the curve (AUC) was obtained. The AUCs of ROCs of different prediction models were compared using the DeLong’s nonparametric test. The diagnostic indicators of CNN (sensitivity, specificity, accuracy, positive predictive value, negative predictive value, misdiagnosis rate, and missed diagnosis rate) were calculated using the maximum Youden index as the critical point. The prediction model with the highest AUC was selected, and its prediction probability to the images in the comparison group was evaluated. Then, the ROC was drawn and compared with the diagnostic accuracy of previous sonographers, which was expressed as the AUC, just like the comparisons between the models. The aforementioned ROC analysis was performed using MedCalc 18.11, and the diagnostic index was calculated using SPSS 20.0. A P value < 0.05 was considered statistically significant.
Results
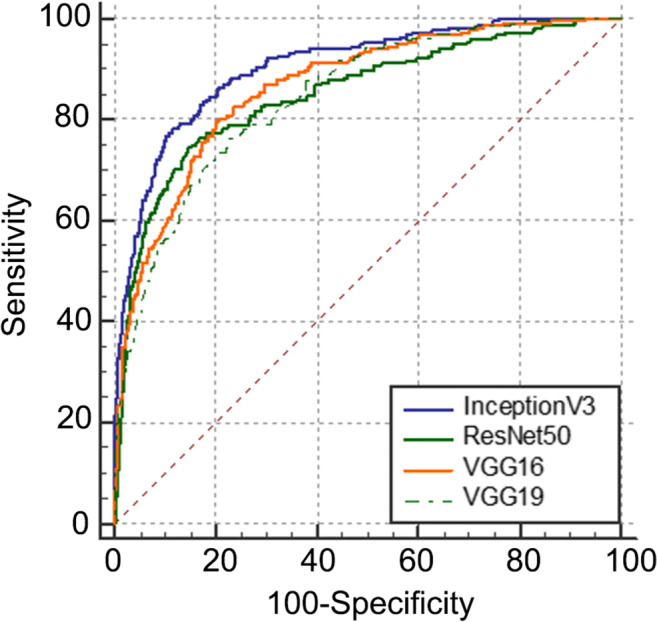
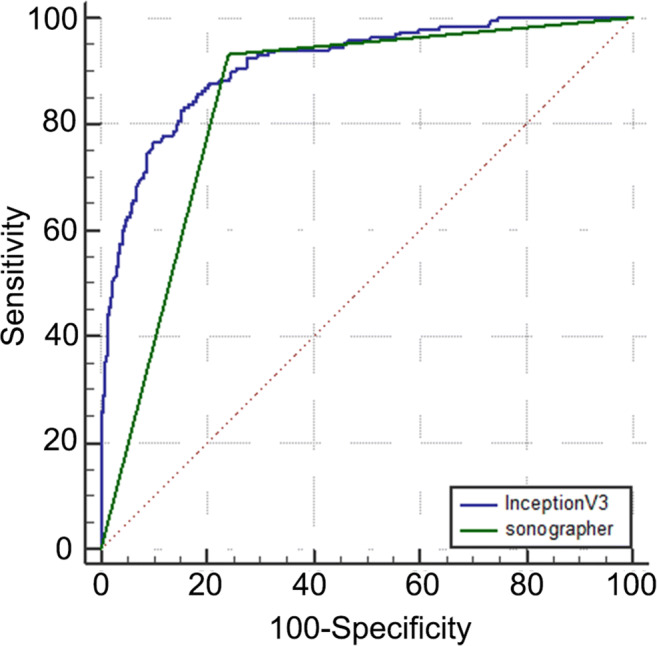
In the classification of breast lesions in the test group, the AUCs of InceptionV3, VGG16, ResNet50, and VGG19 models were 0.905, 0.866, 0.851, and 0.847, respectively (Fig. 3). Pairwise comparison showed statistical differences in AUC values between the InceptionV3 model and the other three models (P < 0.05), but no statistical differences were found in the AUCs among VGG16, ResNet50, and VGG19 models (P > 0.05). After that, in the diagnosis of breast lesions in the comparison group, the AUC (0.913) of the InceptionV3 model was higher than that (0.846) obtained by the sonographers (P < 0.05) (Fig. 4). The sensitivity, specificity, accuracy, positive predictive value, negative predictive value, misdiagnosis rate, and missed diagnosis rate of the InceptionV3 model were 85.8%, 81.5%, 82.8%, 64.2%, 93.7%, 18.5%, and 14.2%, respectively, with the maximum Youden index as the critical point. The corresponding diagnostic indicators obtained by the sonographers were 93.2%, 76.1%, 80.8%, 60.0%, 96.6%, 23.9%, and 6.8%, respectively.
Fig. 3.

ROC of the prediction models (InceptionV3, VGG16, ResNet50, and VGG19)
Fig. 4.

ROC obtained by the sonographers and the prediction model InceptionV3
Discussion
The findings of this study revealed that the prediction accuracy of the breast ultrasound computer-aided prediction model constructed based on CNN was higher than that obtained by sonographers, and it had high specificity but high missed diagnosis rate.
Deep learning network contains massive parameters and needs considerable data training. It is very difficult to obtain a large amount of medical data labeled by sonographers because of the particularity of medical data [9]. In addition to the data enhancement methods, such as flipping and rotation, increasing data volume, and improving model generalization ability, this study adopted transfer learning. The parameters of the pre-training model of nonmedical images, which were labeled manually and considerably in the ImageNet dataset, were transferred to the new model, and then the training of professional images was supplemented to improve efficiency and avoid starting from the beginning. Ting Xiao et al. [10] believed that transferring parameters from a large-scale pre-training network was superior to direct training of small-scale ultrasound data, and the final accuracy could be improved by 7%–11%.
The InceptionV3 model showed the highest classification accuracy in this study, and its AUC exceeded 0.90. Compared with the findings by Xiao et al. [10], ResNet50 and InceptionV3, which also received transfer learning, achieved the same good results, and the AUC reached 0.91. In the study by Becker et al. [11] using ViDi Suite v. 2.0 software based on deep learning, the AUC was only 0.84. When Han et al. [12] applied GoogLeNet to classify the benign and malignant tumors in breast images, the AUC was as high as 0.96. These might be caused by the differences in training data and CNN models.
In recent years, the accuracy of medical image recognition by artificial intelligence has exceeded that reported by sonographers. However, sonographers cannot diagnose lesions only by observing medical images, but by combining comprehensive information, such as inquiry and physical examination. This study compared the predictive results of the breast ultrasound computer-aided prediction model based on deep learning technology with those obtained by previous sonographers in the same samples (the comparison group). The results demonstrated that the accuracy of the results obtained by the InceptionV3 model was significantly higher than that obtained by the sonographers (AUC, 0.913 vs 0.846), with a statistically significant difference. The sensitivity, specificity, and accuracy of the InceptionV3 model were all more than 80% with the maximum Youden index as the critical point, but the missed diagnosis rate was high. However, the diagnostic sensitivity of the results obtained by sonographers in the same samples was more than 90%, and the rate of missed diagnosis was less than 10%. The sensitivity, specificity, and accuracy of GoogLeNet were 83%, 95%, and 90%, respectively, in the study of Han et al. [12] The sensitivity, specificity, and accuracy of the ResNet50 model obtained by Xiao et al. [10] were 77.39%, 88.74%, and 84.94%, respectively, while the corresponding values of the InceptionV3 model were 77.44%, 89.06%, and 85.13%, respectively. Although the differences in these diagnostic levels could not be directly compared, the sensitivity of CNN diagnosis obtained in the aforementioned studies was mostly low, despite its high accuracy. This was not in line with the needs of the actual study. In the prediction of breast cancer, the harm of missed diagnosis of breast cancer was far greater than that of misdiagnosis. Therefore, improving the sensitivity as far as possible with certain specificity is necessary. Thus, it may need improvement in the practice of using the maximum Youden index as the optimal critical point in research.
This study had some limitations. First, the ultrasound images included in this study were labeled by professionals, which was inefficient and not conducive to future large-scale data research. Second, the application of deep learning technology in interpretability was insufficient. What rules CNN learned in training and what factors were used to determine benign and malignant breast masses were unknown. Additionally, as a retrospective study, the breast ultrasound images included in this study were collected from a previous study. Lack of uniform image acquisition standards might have had a certain impact on the results of the study. Although this study used breast ultrasound images from other institutions for CNN training, unfortunately, in addition to the amount of benign and malignant images, the specific pathological type, mass size, and other information were not known.
Conclusions
The breast ultrasound computer-aided prediction model based on CNN had high accuracy for breast cancer prediction. It may be used in multicenter clinical research through the transformation of scientific research results.
Acknowledgments
We gratefully acknowledge the kind cooperation of Haihong Intellimage Medical Technology (Tianjin) Co., Ltd., in terms of software and technical service.
Funding
This work was supported by the Achievement Conversion and Guidance Project of Chengdu Science and Technology Bureau (No.2017-CY02-00027-GX).
Compliance With Ethical Standards
Conflict of Interest
The authors declare that they have no conflict of interest.
Ethical Approval Retrospective Studies
This study was approved by the ethics committee of the relevant institutions.
Informed Consent
Informed consent was obtained from all individual participants included in the study.
Footnotes
Publisher’s Note
Springer Nature remains neutral with regard to jurisdictional claims in published maps and institutional affiliations.
References
- 1.Bray F, Ferlay J, Soerjomataram I, Siegel RL, Torre LA, Jemal A. Global cancer statistics 2018: GLOBOCAN estimates of incidence and mortality worldwide for 36 cancers in 185 countries. CA Cancer J Clin. 2018;68:394–424. doi: 10.3322/caac.21492. [DOI] [PubMed] [Google Scholar]
- 2.Sadoughi F, Kazemy Z, Hamedan F, Owji L, Rahmanikatigari M, Azadboni TT. Artificial intelligence methods for the diagnosis of breast cancer by image processing: a review. Breast Cancer (Dove Med Press) 2018;10:219–230. doi: 10.2147/BCTT.S175311. [DOI] [PMC free article] [PubMed] [Google Scholar]
- 3.Abdel-Zaher AM, Eldeib AM. Breast cancer classification using deep belief networks. Expert Systems with Applications. 2016;46:139–144. doi: 10.1016/j.eswa.2015.10.015. [DOI] [Google Scholar]
- 4.Seung Yeon S, Soochahn L, Il Dong Y, Sun Mi K, Kyoung Mu L. Joint weakly and semi-supervised deep learning for localization and classification of masses in breast ultrasound images. IEEE Trans Med Imaging. 2019;38:762–774. doi: 10.1109/TMI.2018.2872031. [DOI] [PubMed] [Google Scholar]
- 5.Fujioka T, Kubota K, Mori M, Kikuchi Y, Katsuta L, Kasahara M, et al. Distinction between benign and malignant breast masses at breast ultrasound using deep learning method with convolutional neural network. Jpn J Radiol. 2019;37:466–472. doi: 10.1007/s11604-019-00831-5. [DOI] [PubMed] [Google Scholar]
- 6.Pehrson LM, Lauridsen C, Nielsen MB. Machine learning and deep learning applied in ultrasound. Ultraschall Med. 2018;39:379–381. doi: 10.1055/a-0642-9545. [DOI] [PubMed] [Google Scholar]
- 7.Byra M, Galperin M, Ojeda-Fournier H, Olson L, O'Boyle M, Comstock C, et al. Breast mass classification in sonography with transfer learning using a deep convolutional neural network and color conversion. Med Phys. 2019;46:746–755. doi: 10.1002/mp.13361. [DOI] [PMC free article] [PubMed] [Google Scholar]
- 8.Mendelson E, Böhm-Vélez M, Berg W. ACR BI-RADS® Atlas, Breast Imaging Reporting and Data System. Reston: American College of Radiology; 2013. ACR BI-RADS® Ultrasound. [Google Scholar]
- 9.He J, Baxter SL, Xu J, Xu J, Zhou X, Zhang K. The practical implementation of artificial intelligence technologies in medicine. Nat Med. 2019;25:30–36. doi: 10.1038/s41591-018-0307-0. [DOI] [PMC free article] [PubMed] [Google Scholar]
- 10.Xiao T, Liu L, Li K, Qin W, Yu S, Li Z. Comparison of transferred deep neural networks in ultrasonic breast masses discrimination. Biomed Res Int. 2018;4605191:2018. doi: 10.1155/2018/4605191. [DOI] [PMC free article] [PubMed] [Google Scholar]
- 11.Becker AS, Mueller M, Stoffel E, Marcon M, Ghafoor S, Boss A. Classification of breast cancer in ultrasound imaging using a generic deep learning analysis software: a pilot study. Br J Radiol. 2018;91:20170576. doi: 10.1259/bjr.20170576. [DOI] [PMC free article] [PubMed] [Google Scholar]
- 12.Han S, Kang HK, Jeong JY, Park MH, Kim W, Bang WC, et al. A deep learning framework for supporting the classification of breast lesions in ultrasound images. Phys Med Biol. 2017;62:7714–7728. doi: 10.1088/1361-6560/aa82ec. [DOI] [PubMed] [Google Scholar]


