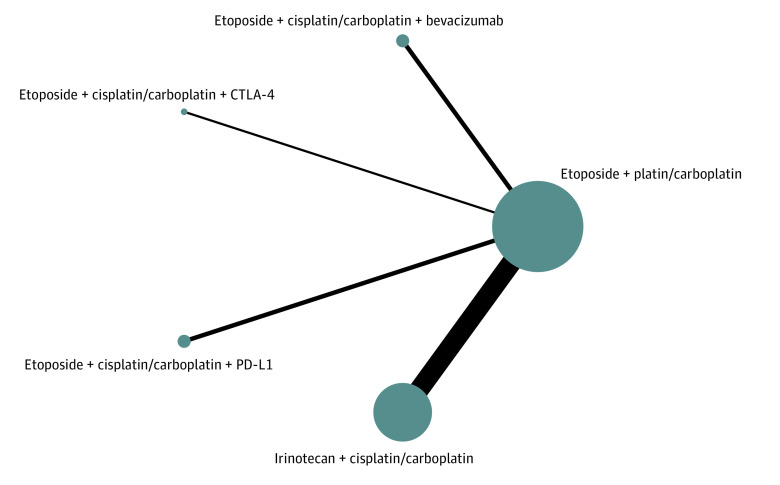
Figure 1. Network Plot of Multiple Therapies in the First-Line Treatment of Extensive-Stage Small Cell Lung Cancer.
The size of each dot represents the number of patients receiving the corresponding intervention. The width of each line represents the number of corresponding comparison studies. CTLA-4 indicates T-cell lymphocyte antigen 4; and PD-L1, programmed cell death ligand 1.

