

SUMMARY
Pancreatic ductal adenocarcinoma (PDAC) is characterized by extensive fibrosis and hypovascularization, resulting in significant intratumoral hypoxia (low oxygen) that contributes to its aggressiveness, therapeutic resistance, and high mortality. Despite oxygen being a fundamental requirement for many cellular and metabolic processes, and the severity of hypoxia in PDAC, the impact of oxygen deprivation on PDAC biology is poorly understood. Investigating how PDAC cells survive in the near absence of oxygen, we find that PDAC cell lines grow robustly in oxygen tensions down to 0.1%, maintaining mitochondrial morphology, membrane potential, and the oxidative metabolic activity required for the synthesis of key metabolites for proliferation. Disrupting electron transfer efficiency by targeting mitochondrial respiratory supercomplex assembly specifically affects hypoxic PDAC proliferation, metabolism, and in vivo tumor growth. Collectively, our results identify a mechanism that enables PDAC cells to thrive in severe, oxygen-limited microenvironments.
Graphical Abstract
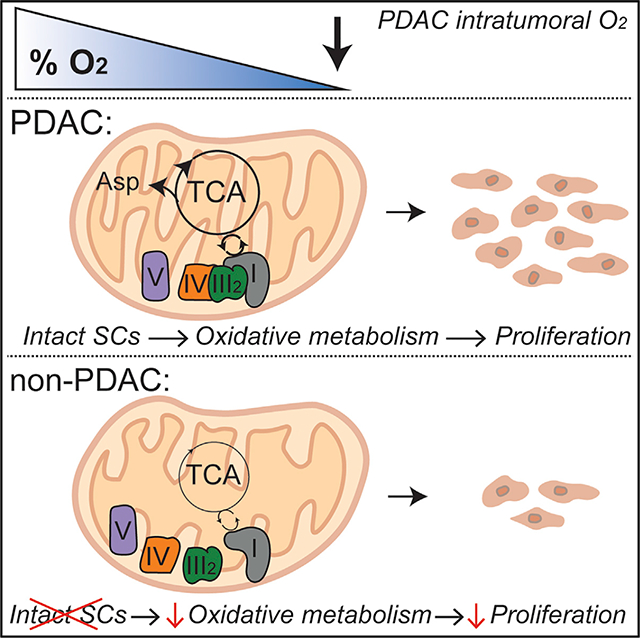
In Brief
Pancreatic ductal adenocarcinoma (PDAC) is severely hypoxic to an extent predicted to have significant implications for the biology of these tumors. Hollinshead et al. demonstrate a role for mitochondrial respiratory supercomplexes in maintaining growth and oxidative mitochondrial metabolism in severely hypoxic pancreatic cancer cells.
INTRODUCTION
Hypoxia is a microenvironmental feature common to many solid tumors that arises as cancer cells outgrow their blood supply of oxygen and directly contributes to increased metastasis, therapy resistance, and mortality (Vaupel et al., 2004). Oxygen measurements in human pancreatic ductal adenocarcinoma (PDAC) tumors demonstrate that pancreatic cancer is severely hypoxic to an extent predicted to have significant implications for the growth and metabolism of these tumors, with a median pO2 of ~2 mm Hg (Koong et al., 2000). For adequate oxygen supply, cancer cells must be within 100–200 μm of functional vasculature, representing the diffusion limit for oxygen in tissues (Carmeliet and Jain, 2000; Yu et al., 2014). These diffusion limitations are exacerbated in pancreatic cancer by extensive desmoplastic stroma that results in a highly dysfunctional vasculature (Olive et al., 2009). Significant metabolic reprogramming occurs outside of the oxygen diffusion range, primarily through the stabilization of a small family of heterodimeric transcription factors known as hypoxia-inducible factors (HIFs). During conditions of low oxygen, HIFs localize in the nucleus for the transcriptional activation of target genes involved in angiogenesis, glycolysis, invasion/migration, and survival (Semenza, 2007). These cellular adaptations to hypoxia are rapid and highly conserved, and HIFs are stabilized at oxygen tensions above those limiting for cell growth to prepare cells for oxygen depletion and to delay the development of anoxia (Gnaiger et al., 1998).
Hypoxic tumors are well characterized by a switch to aerobic glycolysis to support oxygen-independent ATP production (Semenza, 2010), mediated by HIF-induced expression of glucose transporters (SLC2A1 and SLC2A3) and virtually all glycolytic genes (Tennant et al., 2010). However, a functional electron transport chain (ETC) and glutamine-derived carbon are required for the proliferation of most transformed cells (Fan et al., 2013; Weinberg et al., 2010) and drive the tumorigenesis of multiple cancers under physiological oxygen concentrations. It remains unclear whether activity of the ETC is required for the proliferation of PDAC cells in low-oxygen environments.
Here we demonstrate that pancreatic cancer cells maintain growth and oxidative metabolism during conditions of severe hypoxia; phenotypes rely on the presence and function of mitochondrial respiration. Furthermore, mitochondrial number and morphology are uniquely sustained in pancreatic cancer cells exposed to extremely low oxygen tensions. Disrupting respiratory supercomplex formation by genetic targeting of supercomplex assembly factor 1 (SCAF1, or COX7A2L) reduces mitochondrial efficiency specifically in conditions of low oxygen without affecting expression of individual ETC complexes. Perturbing respiration in this manner reduces the metabolic efficiency of pancreatic cells, preventing hypoxic growth in vitro and in vivo.
RESULTS
Pancreatic Cancer Cells Maintain Growth and Oxidative Metabolism during Severe Hypoxia
To understand how pancreatic cancer cells adapt to such severely oxygen limited environments, we cultured PDAC cell lines in a pathophysiological oxygen tension of 0.1%, consistent with intratumoral oxygen measurements in pancreatic cancer (Koong et al., 2000). Strikingly, we found that all PDAC cell lines tested sustain robust growth at 0.1% oxygen at ≥50% of the normoxic rates (Figures 1A and S1A). This was unlike cell lines derived from less hypoxic tumor types, such as lung (A549) and colon (HCT116 and DLD-1), which exhibited a marked reduction in proliferation during severe hypoxia (10%–30% that of normoxia) (Figures 1A and S1B). Metastatic breast cancer cell lines (MDA-MB-468 and MDA-MB-231) exhibit a growth-deficient intermediate between lung/colon and PDAC cell lines (Figures 1A, S1A, and S1B). However, all cell lines were capable of proliferating in more modest hypoxia (Figures S1A and S1B), suggesting that PDAC cells exhibit a unique adaptation to extreme hypoxia. Although lung, colon, and breast cancer cells all likely encounter tumor hypoxia in vivo, none have been suggested to show the same level of hypoxia as pancreatic cancers (Vaupel and Mayer, 2007). Because oxygen is a fundamental metabolic requirement for anabolism and proliferation, we hypothesized that cells cannot sustain growth in complete oxygen deprivation (anoxia) but may be conditioned to survive. To test this hypothesis, we cultured cells in anoxia, achieved by depletion of oxygen using a palladium catalyst to maintain levels of 3–5 ppm (<0.001%). All cell lines regardless of tumor type were unable to grow in the absence of oxygen (Figures S1A and S1B); however, we found that all PDAC cell lines, along with some other cancer cell types (e.g., MDA-MB-231, MDAMB-468, and DLD-1), were capable of maintaining viability over several days in anoxia (Figure 1B). Collectively, these data suggest that cell lines derived from extremely hypoxic environments have evolved robust mechanisms/metabolic pathways to sustain proliferation and viability in oxygen-depleted microenvironments. Furthermore, our data highlight the requirement of oxygen-consuming cellular processes for the growth of cancer cells.
Figure 1. Pancreatic Cancer Cells Sustain Growth during Severe Hypoxia.
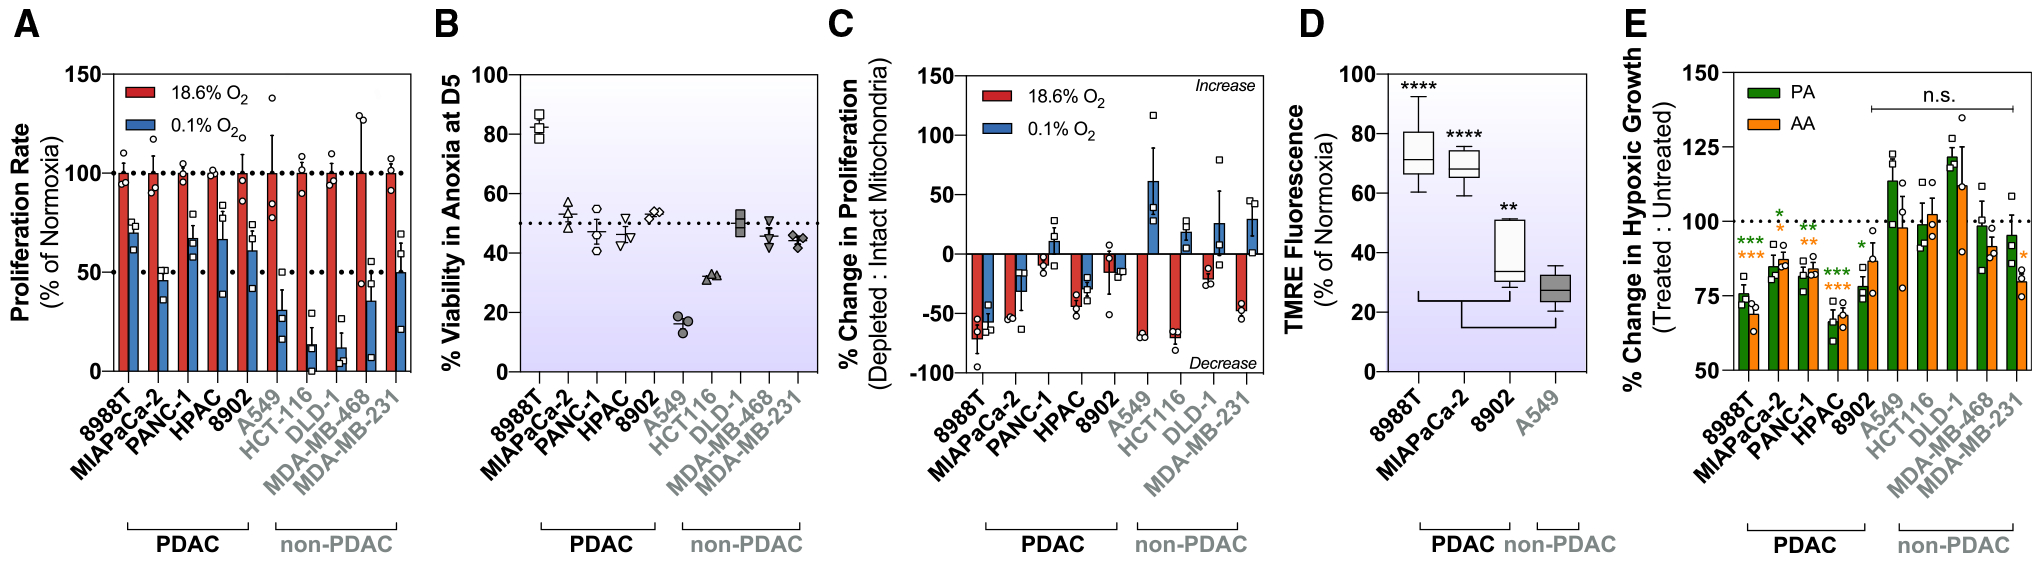
(A) Relative proliferation rates of cells exposed to 0.1% oxygen, shown as a percentage of normoxic growth (mean ± SEM, n = 3). Proliferation rates were calculated using the exponential growth equation from three independent growth curves shown in Figure S1.
(B) Percentage of viable cells after 5 days (D5) in anoxia (0% O2) (mean ± SEM, n = 3).
(C) Change in normoxic and hypoxic (0.1% O2) growth in cells with intact or depleted mitochondria (p0). p0 is shown as a percentage of intact mitochondria (mean ± SEM, n = 3).
(D) Membrane potential measurements using tetramethylrhodamine (TMRE) in normoxic and hypoxic (0.1% O2) conditions. 10–20 fields recorded per condition. Hypoxic data are shown as a percentage of normoxic conditions.
(E) Hypoxic (0.1% O2) cells treated with ETC inhibitors piericidin A (25 nM), and antimycin A (50 nM) for 5 days. Treated cells are shown as a percentage of untreated cells (mean ± SEM, n = 3).
Significance was determined using Dunnett’s multiple comparison test in (D) and (E), where n.s. ≥ 0.05, *p < 0.05, **p < 0.01, ***p < 0.001, and ****p ≤ 0.0001.
Mitochondria are central oxygen-consuming organelles within the mammalian cell that use oxygen as an electron acceptor to sustain intracellular bioenergetics and key biosynthetic reactions. Cellular respiration is generally regarded as the most significant oxygen-consuming pathway in cells (Wagner et al., 2011). To understand the requirement of mitochondrial activity in sustaining PDAC proliferation during severe hypoxia, we generated mitochondrial DNA-deficient cells (p0), which lack key respiratory chain catalytic subunits that are encoded in the mitochondrial genome (King and Attardi, 1989, 1996). Respiration-incompetent cells exhibited decreased proliferative capacity compared with their respiration-competent counterparts under normoxic conditions (Figure 1C). We found that the proliferation of p0 pancreatic cancer cells was similarly affected by mitochondrial depletion in both normoxia and severe hypoxia (Figure 1C). In contrast, non-PDAC p0 cells under hypoxia appeared to gain a proliferative advantage in the presence of exogenous uridine and pyruvate (Figure 1C). These data suggest that mitochondrial activity is essential for PDAC proliferation independent of oxygen availability.
Given our observations that PDAC cells sustain proliferation in severe hypoxia, but not anoxia (Figures 1A, S1A, and S1B), and require respiration competency to do so (Figure 1C), we hypothesized that PDAC cells maintain ETC activity as a mechanism for enhanced proliferation in severe hypoxia. To test this hypothesis, we conducted hypoxic live-cell imaging using tetramethylrhodamine (TMRE) to quantify mitochondrial membrane potential in response to severe hypoxia as an indicator of intact ETC functionality. In severe hypoxia, PDAC cells showed a striking ability to sustain TMRE fluorescence intensity (Figure 1D), indicative of active mitochondrial ETC activity. To determine whether ETC function was required for PDAC cell proliferation, we treated cells with piericidin A and antimycin A to inhibit ETC complex I and III, respectively (Figure S1C), and we found that PDAC cells remained significantly sensitive to ETC inhibition in severe hypoxia, whereas other tumor cell lines appeared insensitive (Figure 1E). These results support that PDAC cells require ETC functionality for growth in severe hypoxia.
It has been suggested that a major function of the mitochondrial respiratory chain is to regenerate electron acceptors for the production of aspartate (Birsoy et al., 2015; Sullivan et al., 2015), because aspartate has been reported to be limiting for both hypoxic growth in vitro and growth of some solid tumors in vivo (Garcia-Bermudez et al., 2018; Sullivan et al., 2018). Consistent with these reports, supplementation with the exogenous electron acceptor pyruvate, which provides a means of oxidizing excess cytoplasmic NADH (King and Attardi, 1989), significantly increased cancer cell growth in 0.1% oxygen (Figure S1D). Addition of systemic or mitochondrially targeted anti-oxidants failed to improve cancer cell proliferation under these conditions (Figure S1D). We hypothesized that PDAC cells maintain ETC activity and therefore can sustain aspartate biosynthesis during conditions of severe hypoxia. Indeed, we observed a 70%–90% decrease in aspartate levels when cells were exposed to hypoxia (Figure S2A), in line with previous findings that argue aspartate is limiting for hypoxic growth (Birsoy et al., 2015; Sullivan et al., 2015). However, to assess whether limitations in aspartate production give rise to the decrease in aspartate levels and to better understand how PDAC cells rewire the central carbon metabolism in severe hypoxia, we employed stable-isotope-labeled tracing. Unlike normoxic conditions, in which 20%–50% of citrate carbon is derived from uniformly labeled 13C6 glucose (Figure S2B), a significant decrease was observed in mitochondrial glucose utilization across all cell lines exposed to severe hypoxia (Figure S2B). This was accompanied by a decrease in mitochondrial pyruvate oxidation (Figure S2C) consistent with the well-reported inhibition of pyruvate dehydrogenase (PDH) activity through canonical HIF1α-mediated transcription of pyruvate dehydrogenase kinase 1 (PDK1) (Kim et al., 2006). It has been suggested that in some cellular contexts, the activity of pyruvate carboxylase (PC) is increased as a compensatory anaplerotic mechanism in response to PDH inactivation (Cardaci et al., 2015; Lussey-Lepoutre et al., 2015). However, we found that this increase in PC activity was not universal to all PDAC cell lines but was consistently observed in the non-PDAC cell lines tested (Figures S2D and S2E). Collectively, these data would suggest that hypoxic PDAC cells undergo canonical rewiring of glucose metabolism and do not primarily use glucose to synthesize aspartate in response to severe hypoxia. Quantitative proteomics analysis of hypoxic pancreatic cancer cells revealed consistent increases in HIF1α levels and enrichment in downstream targets, confirming that PDAC cells undergo canonical HIF-dependent adaptation to severe hypoxia (Figures S2F–S2H).
Our lab previously reported that PDAC cells exhibit a high glutamine dependency (Son et al., 2013). Mitochondrial glutamine-derived aspartate, produced by mitochondrial aspartate aminotransferase 2 (GOT2), is exchanged with cytosolic malate to generate oxaloacetate by cytosolic aspartate aminotransferase (GOT1) for production of cytosolic NADPH through the conversion to malate and pyruvate (Son et al., 2013). To examine the contribution of glutamine-derived carbon to the aspartate pool during hypoxic conditions, we next employed a uniformly labeled 13C5-glutamine tracer. We found that PDAC cells sustain most of their aspartate production in the mitochondria through the activity of GOT2 (Figure 2A), whereas other tumor types increase cytosolic aspartate production through the activity of GOT1 in response to hypoxia (Figures 2B and 2C). Irrespectively, GOT1 and GOT2 expression was not consistently changed in any cell lines upon exposure to severe hypoxia (Figures S2I and S2J), although there was a trend toward increased GOT1 expression at 0.1% oxygen. Loss of GOT2 using RNAi (Figure S2K) specifically decreased aspartate levels (Figure S2L) and hypoxic growth (Figure S2M) in PDAC cell lines, consistent with a role in aspartate production. Moreover, activity of GOT2 during hypoxia positively correlated with the hypoxic growth rate (Figure 2D). These observations imply that pancreatic cancer cells sustain glutamine anaplerosis to maintain oxidative glutamine metabolism despite significant oxygen deprivation. Furthermore, the maintenance of oxidative glutamine metabolism is a key determinant of severely hypoxic PDAC cell growth.
Figure 2. Pancreatic Cancer Cells Uniquely Maintain Oxidative Metabolism during Severe Hypoxia.
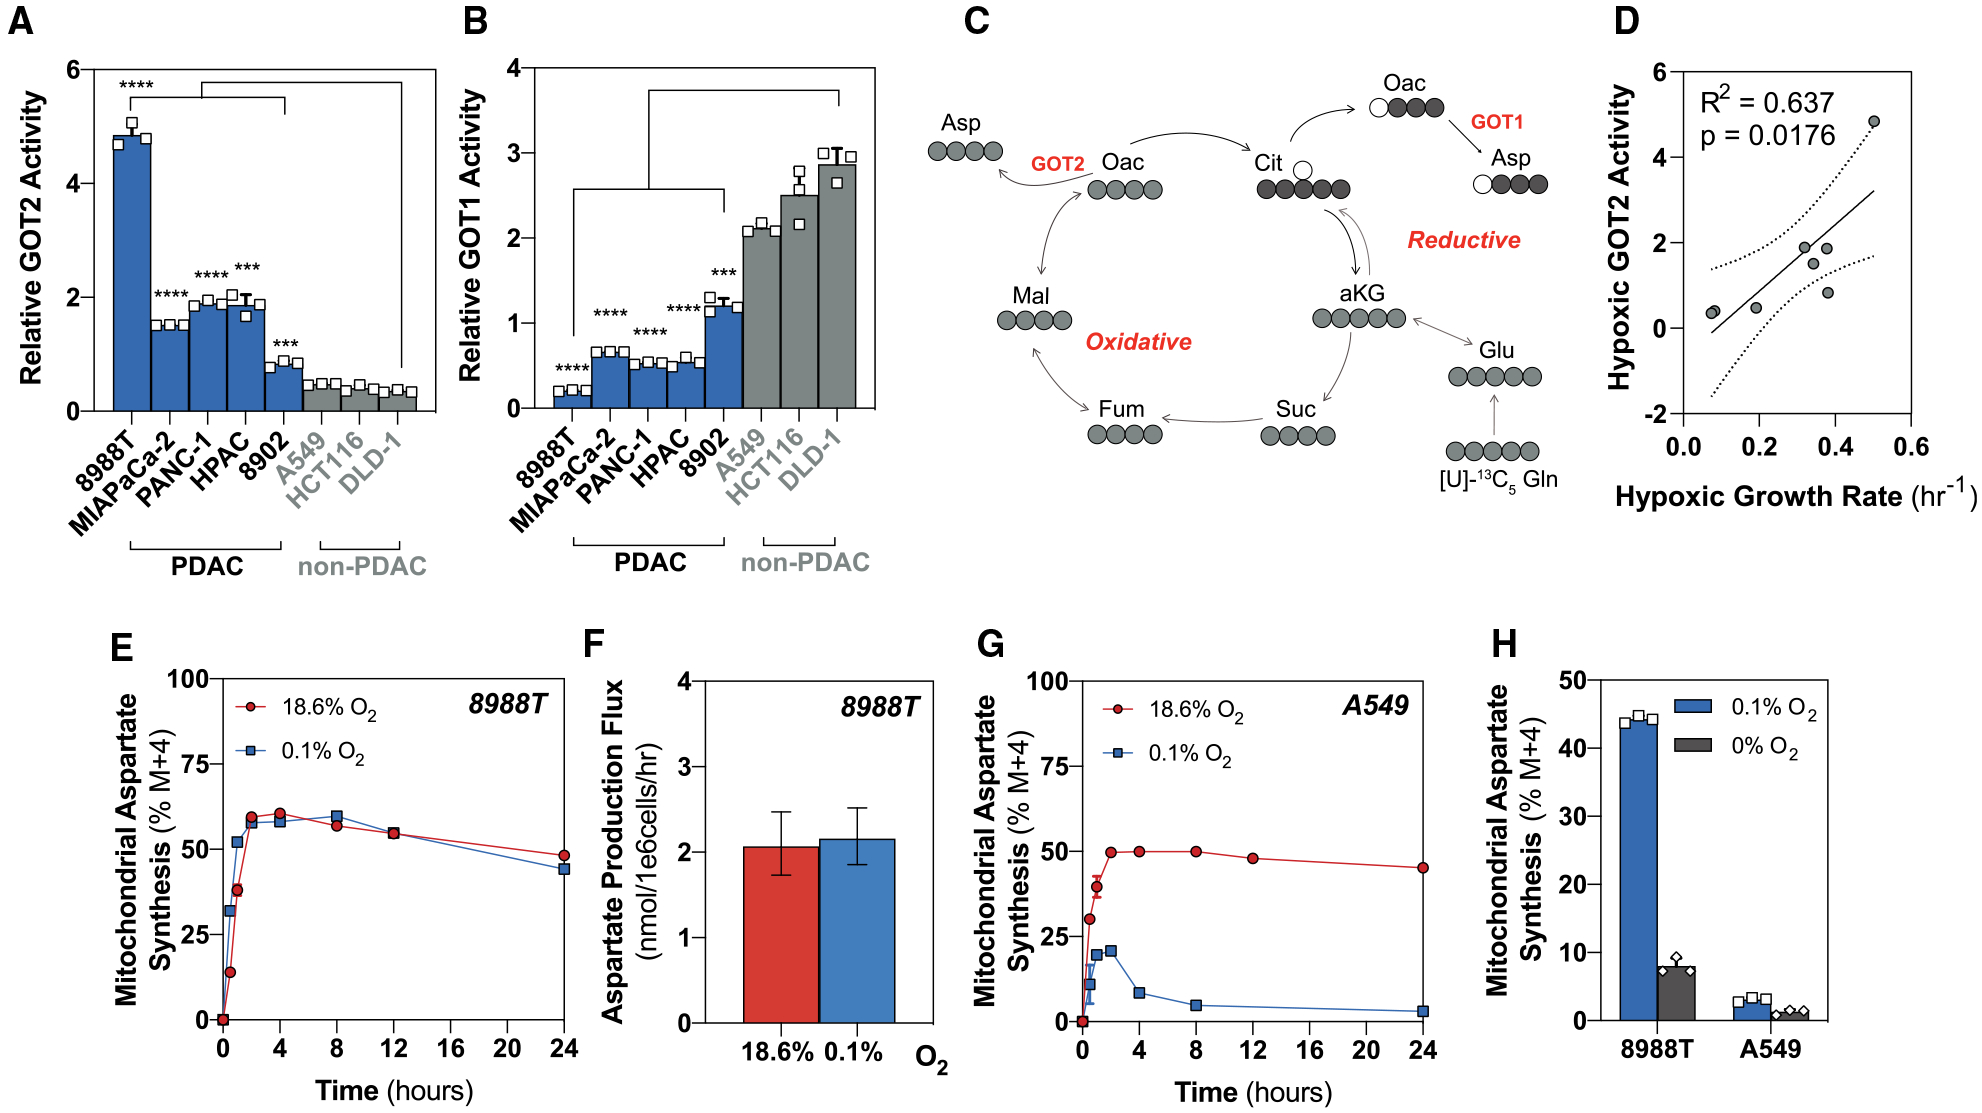
(A) Relative GOT2 activity after 24 h in hypoxia (0.1% O2) determined by calculating the fraction of M+4:M+3 at steady state from [U]-13C5 glutamine (mean ± SD, n = 3).
(B) Relative GOT1 activity after 24 h in hypoxia (0.1% O2) determined by calculating the fraction of M+3:M+4 at steady state from [U]-13C5 glutamine (mean ± SD, n = 3).
(C) Schematic to show downstream label incorporation from [U]-13C5 glutamine. M+4 is produced through the oxidative activity of mitochondrial aspartate aminotransferase 2 (GOT2) (light gray), and M+3 is produced through the reductive activity of cytosolic aspartate aminotransferase (GOT1) (dark gray).
(D) Linear regression between hypoxic (0.1% O2) GOT2 activity (M+4:M+3) and the hypoxic (0.1% O2) growth rate (per hour). Hypoxic (0.1% O2) growth rates were calculated from the growth curves in Figure S1.
(E) Kinetic labeling data in normoxic and severely hypoxic (0.1% O2) 8988T cells using [U]-13C5 glutamine (mean ± SD, n = 3).
(F) Aspartate production flux in normoxic and severely hypoxic (0.1% O2) 8988T cells calculated from [U]-13C5 glutamine (mean ± 95% confidence interval [CI], n = 3).
(G) Kinetic labeling data in normoxic and severely hypoxic (0.1% O2) A549 cells using [U]-13C5 glutamine (mean ± SD, n = 3).
(H) Percentage of aspartate (M+4) from [U]-13C5 glutamine in 8988T and A549 cells at steady state after 24 h in anoxic (0% O2) or hypoxic (0.1% O2) conditions (mean ± SD, n = 3). Values for hypoxic (0.1% O2) 8988T and A549 are shown in (E) and (G).
Significance was determined using Dunnett’s multiple comparison test in (A) and (B), where ***p < 0.001 and ****p ≤ 0.0001.
To assess whether pancreatic cancer cells are able to sustain adequate production of mitochondrial aspartate during severe hypoxia, we performed kinetic flux profiling (KFP) to measure the dynamics of isotope labeling from 13C5 glutamine into downstream metabolites. The resulting kinetic labeling data combined with absolute metabolite levels was used to quantify synthetic fluxes in cells exposed to oxygen tensions of 0.1%. We found that PDAC cells maintain aspartate production flux (Figures 2E and 2F), in which most aspartate is derived from glutamine (Figure S2N). Metabolite-level changes are not necessarily related to a change in flux, and our data suggest that although aspartate levels drop precipitously in hypoxia, production flux is sustained, arguing against a biosynthetic limitation of aspartate for hypoxic PDAC cell growth. At steady state, the flux of a metabolite’s production is equal to that of its consumption. Therefore, the significant decrease in aspartate concentration despite sustained production flux may indicate altered aspartate utilization and cellular demand. Because aspartate fuels pyrimidine biosynthesis required for proliferation, the ability of hypoxic PDAC cells to produce aspartate during extreme hypoxia would also imply that PDAC cells can sustain nucleotide synthesis. We observed sustained nucleobase synthesis in hypoxia in PDAC cells relative to non-PDAC cells, suggesting sustained metabolic pathway activity downstream of aspartate production (Figure S2O). Strikingly, the A549 lung cancer cell line exhibited an unstable kinetic labeling pattern of aspartate from 13C5 glutamine in severe hypoxia that prevented accurate estimation of synthesis flux (Figure 2G). Acutely after labeling media were introduced, A549 cells attempt to sustain oxidative aspartate (M+4) labeling kinetics similar to normoxic culture conditions. However, the labeling pattern quickly (in ~1 h) shifts to establish a distinct steady state, whereby M+4 production is dramatically reduced and approaches 0% (Figure 2G). These data suggest that A549 cells have significant and relatively static oxygen consumption that rapidly exhausts the available oxygen required to sustain M+4 production.
To understand whether reductive glutamine metabolism was compensating for a decrease in oxidative GOT2-dependent aspartate biosynthesis, we quantified the mole percent enrichment (MPE), which is the total contribution of glutamine carbon to aspartate over time. Unlike 8988T cells, which sustained both M+4 labeling (Figure 2E) and MPE from glutamine (Figure S2P), A549 cells exhibit an ~30% reduction in glutamine contribution to aspartate biosynthesis (Figure S2P) in severe hypoxia and were not compensated by an increase in reductive cytosolic aspartate (M+3) production (Figure S2Q). We therefore hypothesized that PDAC cells may maintain oxidative metabolism through efficient utilization of the oxygen that is available in hypoxic microenvironments. Steady-state analysis of 13C incorporation from 13C5 glutamine in PDAC cells in anoxia showed that oxidative production of aspartate significantly decreases in the absence of oxygen (Figure 2H) to an extent similar to that observed in non-PDAC cells at 0.1% oxygen, suggesting increased efficiency in PDAC oxygen consumption. Such increased efficiency of oxygen consumption during hypoxia would extend oxygen availability in tumors, conferring oxidative metabolism and proliferative capacity in tumors in which diffusion from vessels becomes limited.
Mitochondrial Respiratory Supercomplexes Support Efficient Electron Transfer in Pancreatic Cancer during Severe Hypoxia
Our results indicate that oxidative mitochondrial metabolism is retained specifically in pancreatic cancer cells during conditions of low oxygen to permit growth. We hypothesized that for this to occur, PDAC cells must use mechanisms to preserve healthy mitochondrial pools and enable efficient use of the low concentration of oxygen available. Transmission electron microscopy (TEM) analysis revealed that 8988T cells maintain mitochondrial number (Figures 3A and 3B) and morphology (Figure 3) during severe hypoxia. However, A549 cells, which were unable to proliferate or maintain viability in oxygen-limiting conditions, exhibited significant decreases in mitochondrial numbers, cristae density, and morphology, indicative of decreased mitochondrial fitness (Figure 3). Maintenance of healthy mitochondrial pools requires a dynamic balance of biogenesis, fission, fusion, and degradation. A disparity in these processes can compromise cell viability, suggesting that mitochondrial dynamics remain intact in severely hypoxic pancreatic cancer cells and are likely to be a critical component of the observed growth and oxidative mitochondrial activity.
Figure 3. Pancreatic Cancer Cells Maintain Mitochondrial Morphology During Severe Hypoxia.
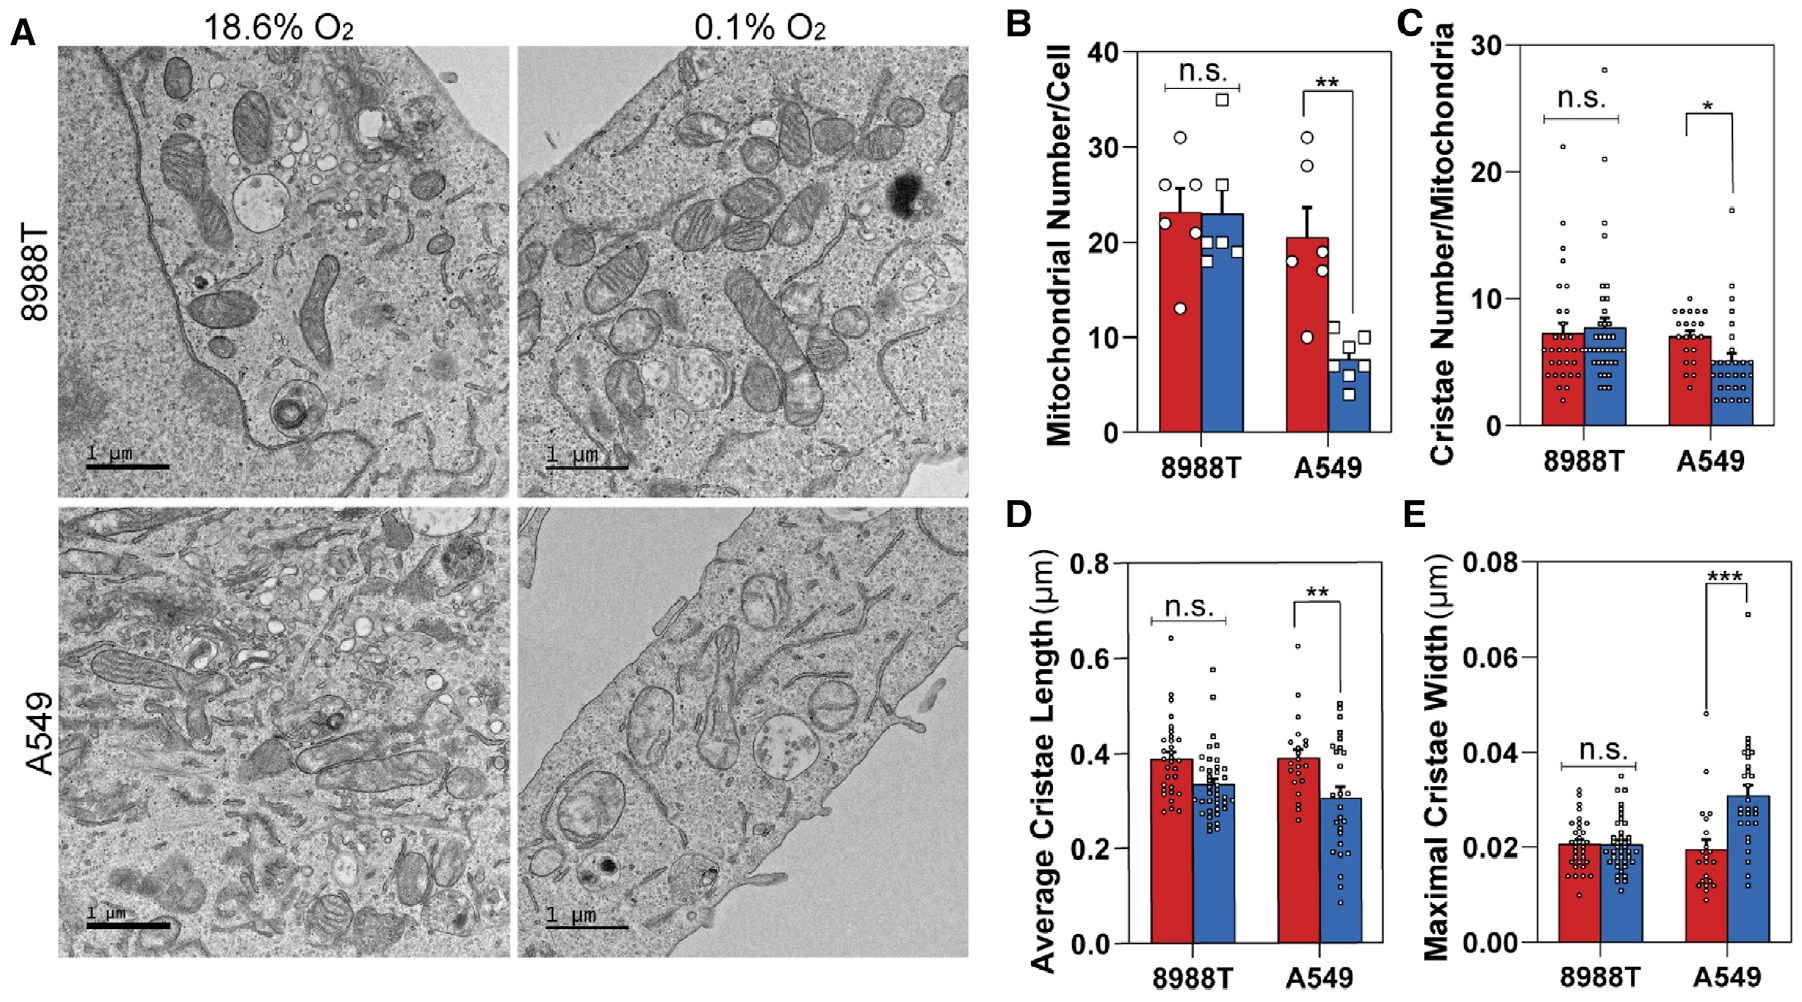
(A) Representative TEM images of 8988T (upper) and A549 (lower) cell lines after 24 h in normoxia (left) or severe hypoxia (0.1% O2) (right).
(B) Quantification of mitochondrial number per cell in 8988T and A549 cells in normoxia or severe hypoxia (0.1% O2). A minimum of six images were collected per condition at 3,400× magnification in a user-blinded fashion (mean ± SEM, n = 6).
(C) Quantification of cristae number per mitochondria in 8988T and A549 cells in normoxia or severe hypoxia (0.1% O2). Cristae numbers from 21–39 mitochondria were counted per condition at random from images collected in a user-blinded fashion (mean ± SEM, n > 20).
(D) Quantification of average cristae length in 8988T and A549 cells in normoxia or severe hypoxia (0.1% O2). Average cristae length was calculated from 21–39 mitochondria per condition at random from images collected in a user-blinded fashion (mean ± SEM, n > 20).
(E) Quantification of maximal cristae width in 8988T and A549 cells in normoxia or severe hypoxia (0.1% O2). Maximal cristae width was calculated from 21–39 mitochondria per condition at random from images collected in a user-blinded fashion (mean ± SEM, n > 20).
Significance was determined using an unpaired Student’s two-tailed t test in (B)–(E), where n.s. ≥ 0.05, *p < 0.05, **p < 0.01, and ***p < 0.001.
Respiratory chain complexes assemble into quaternary structures called supercomplexes within the folds of the inner mitochondrial membrane (Enríquez, 2016). It has been previously reported that mitochondrial cristae shape determines respiratory chain supercomplex assembly and respiratory efficiency (Cogliati et al., 2013). Because mitochondrial and cristae morphology appeared unaltered in hypoxic pancreatic cancer cells, we hypothesize that mitochondrial supercomplexes are present and may contribute to increased ETC efficiency. A comparative analysis of supercomplex formation by blue native PAGE (BN-PAGE) confirmed the presence of respiratory supercomplexes in hypoxic PDAC cells, in which the abundance and composition of respiratory supercomplexes did not appear to be substantially affected by oxygen tension (Figures S3A and S3B). However, a significant decrease in the abundance of high-molecular-weight supercomplexes was observed in hypoxic A549 cells (Figures S3A and S3B). Key determinants for the stabilization of mitochondrial respiratory supercomplexes are specific assembly factors, such as SCAF1. SCAF1 is the long isoform of COX7A2 (COX7A2L) and is a bona fide supercomplex assembly factor required for the stabilization of complex III- and complex IV-containing supercomplexes (Cogliati et al., 2016). Because HIF has been reported to regulate cytochrome c oxidase (COX) isoform expression to optimize respiratory efficiency in low oxygen through more efficient electron transfer (Fukuda et al., 2007), we assessed the expression of COX7A2L in response to severe hypoxia. Consistent with these reports, we detected an increase in the mRNA expression of COX4–2 (Figure S3C), along with a concomitant decrease in COX4–1 (Figure S3D) across all cell lines exposed to 0.1% oxygen. Unlike PDAC cells, a decrease in both mRNA and protein expression of COX7A2L was observed in lung cancer cells (Figures S3E and S3F), consistent with the observed decrease in mitochondrial number in extremely low oxygen. Collectively, these results suggest that PDAC cell lines sustain mitochondrial number and morphology during severe hypoxia, maintaining respiratory activity and the assembly of mitochondrial supercomplexes.
We postulated that disrupting supercomplex assembly through genetic targeting of COX7A2L may sensitize PDAC cell lines to low-oxygen environments by reducing the efficiency of the ETC. Using two independent hairpins against COX7A2L (Figures 4A and S4A), we identified a decrease in complex I-linked and complex IV-linked respiration (Figure S4B) without significantly affecting basal respiration (Figure S4C). This was observed along with a decrease in complex III- and complex IV-containing supercomplexes (Figure S4D), suggesting on-target effects of both hairpins. TEM analysis revealed a significant decrease in cristae length (Figure S4E) and an increase in maximal cristae width upon loss of COX7A2L (Figure S4F), which did not significantly affect the mitochondrial number (Figure S4G) or the number of cristae per mitochondria (Figure S4H), irrespective of oxygen tension. Importantly, loss of COX7A2L did not affect the expression of endogenous ETC complexes I, III, and IV (Figure 4A), implying that loss of supercomplex assembly through genetic targeting of COX7A2L provides a mechanism to uncouple supercomplex activity from that of individual ETC complexes.
Figure 4. Mitochondrial Respiratory Supercomplexes Are Required for Metabolic Fitness in Severely Hypoxic Pancreatic Cancer Cells.
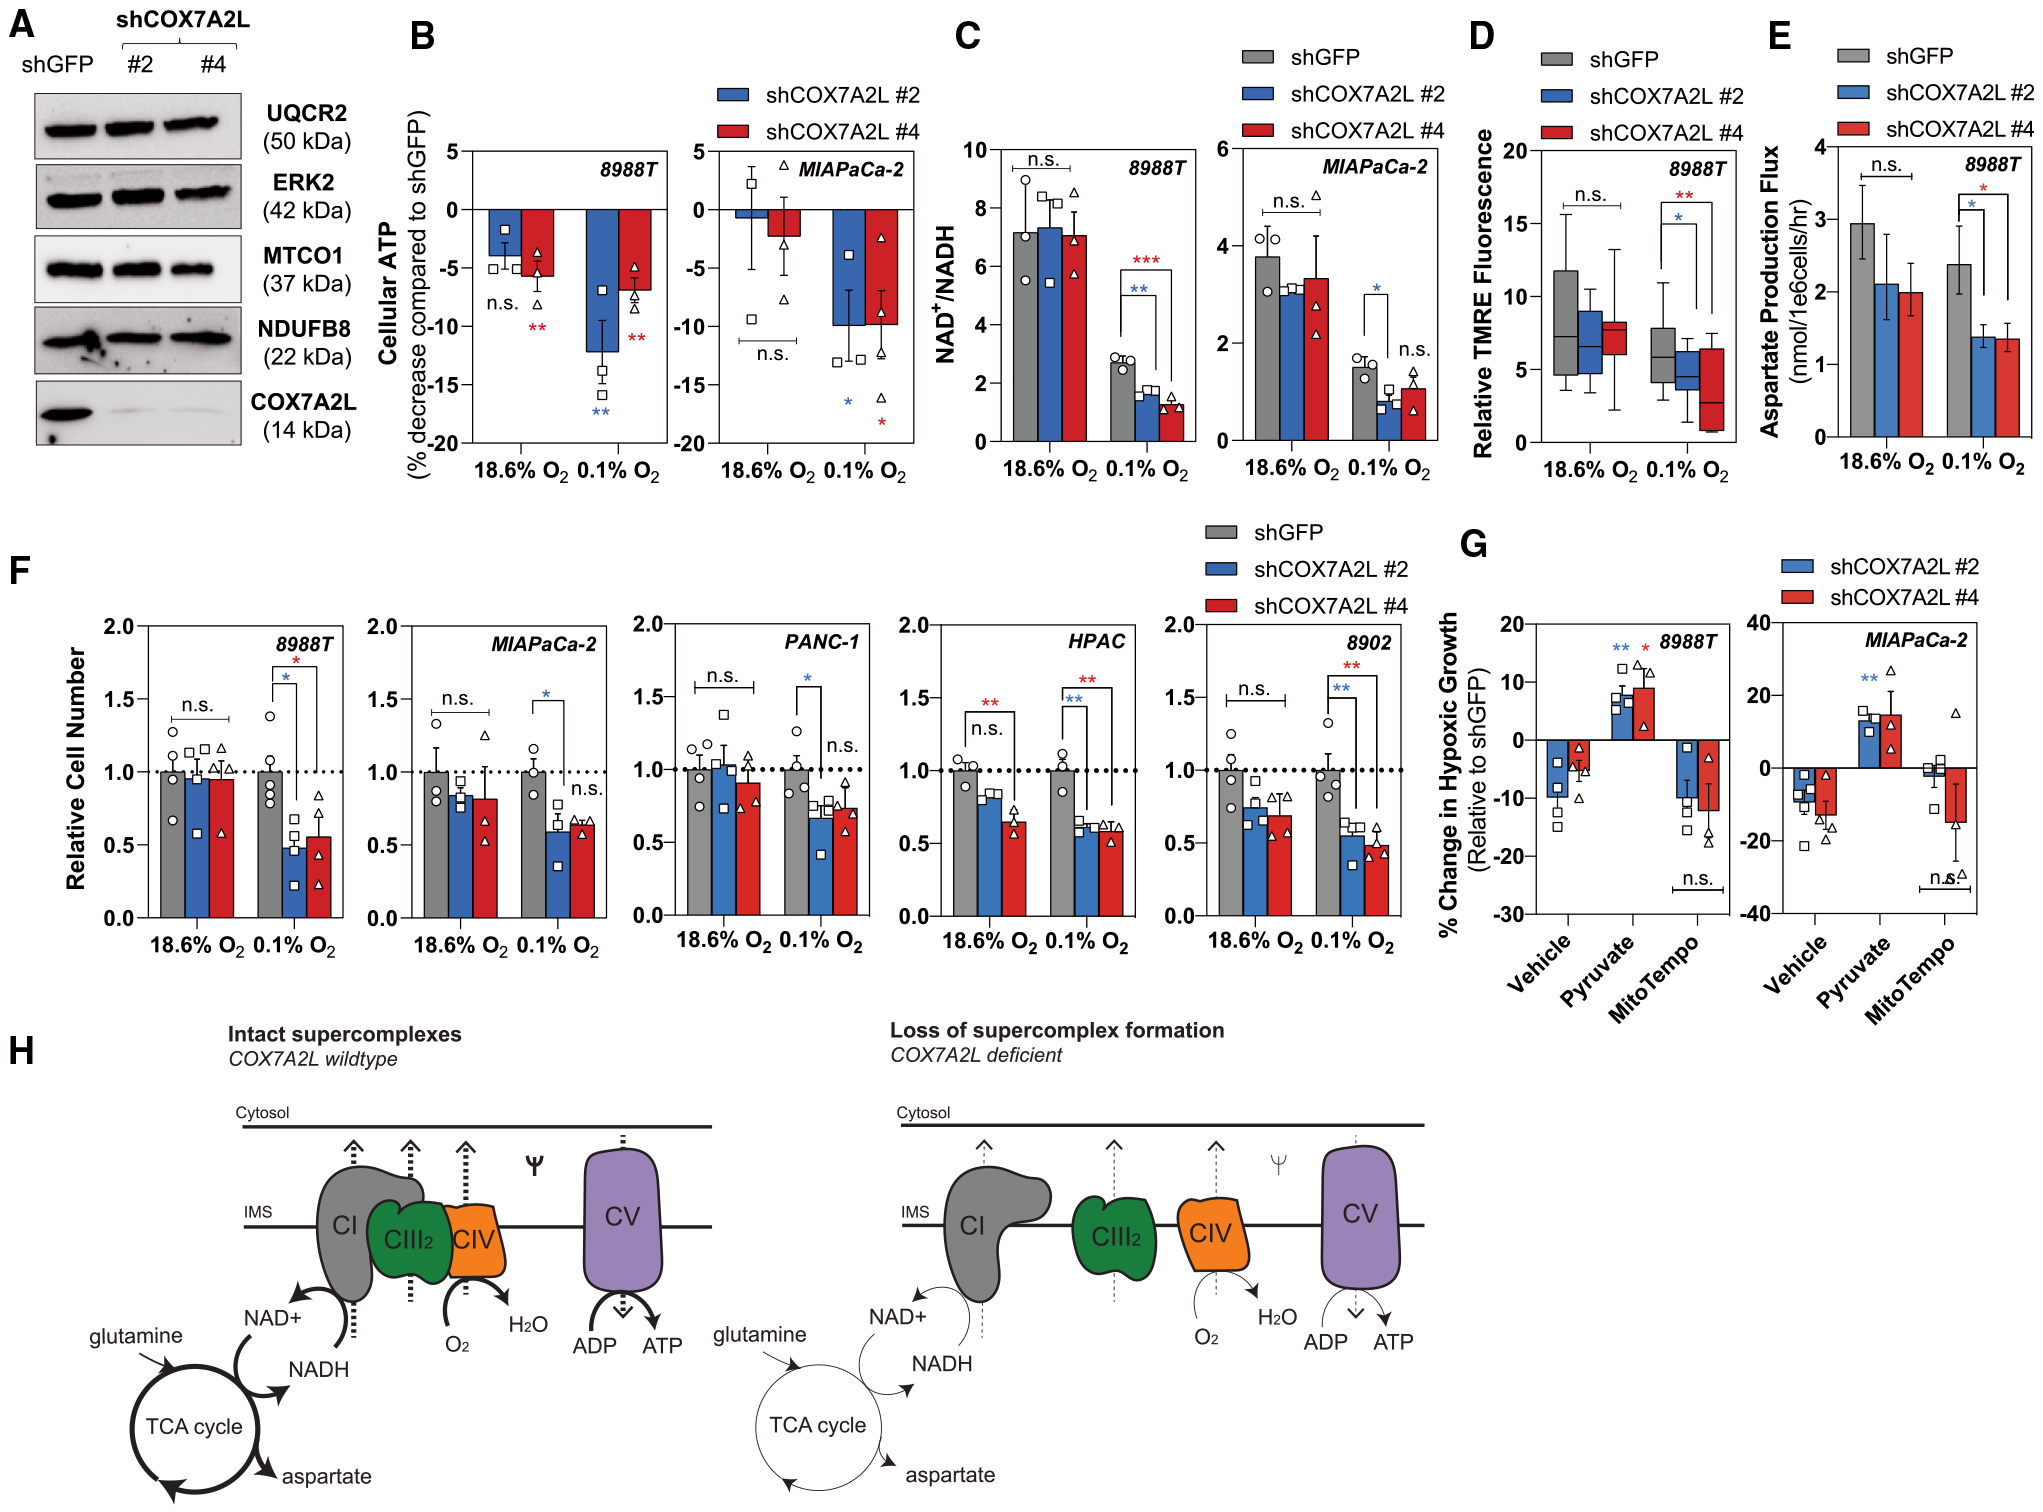
(A) Representative western blot demonstrating COX7A2L knockdown in 8988T cells with unchanged expression of endogenous complex I (NDUFB8), complex III (UQCR2), and complex IV (MTCO1). ERK2 used as a loading control.
(B) Percentage decrease in cellular ATP levels in 8988T cells (left) and MIAPaCa-2 cells (right) with loss of COX7A2L after 24 h of severe hypoxia (0.1% O2). ATP levels were normalized to protein content. Data are shown as a percentage of shGFP (green fluorescent protein) (mean ± SEM, n = 3).
(C) Ratio of NAD+/NADH in 8988T cells (left) and MIAPaCa-2 cells (right) on loss of COX7A2L after 8 h of severe hypoxia (0.1% O2) (mean ± SD, n = 3).
(D) Relative TMRE fluorescence in 8988T cells on knockdown of COX7A2L in normoxia and severe hypoxia (0.1% O2). TMRE values were normalized to mitochondrial size and FCCP treatment. 12–22 fields recorded per condition.
(E) Aspartate production flux in 8988T cells with loss of COX7A2L in normoxia and severe hypoxia (0.1% O2) quantified using [U]-13C5 glutamine (mean ± 95% CI, n = 3).
(F) Relative cell number of 8988T, MIAPaCa-2, PANC-1, HPAC, and 8902 cells with knockdown of COX7A2L after 5 days in normoxic or severely hypoxic (0.1% O2) conditions. Data are shown relative to shGFP control (mean ± SEM, n ≥ 3).
(G) Percentage of change in cellular growth of 8988T cells (left) and MIAPaCa-2 cells (right) with loss of COX7A2L (vehicle) treated with exogenous pyruvate (0.25 mM) or mitoTempo (20 μM) for 5 days in severe hypoxia (0.1% O2). Data are shown relative to shGFP (mean ± SEM, n > 3).
(H) Schematic illustrating the metabolic consequences from loss of supercomplex formation in hypoxic pancreatic cancer cells. Intact supercomplexes (left) and loss of supercomplexes (right) are demonstrated using the respirasome (complexes I, III2, and IV).
Significance was determined using Dunnett’s multiple comparison test in (B)–(G), where n.s. ≥ 0.05, *p < 0.05, **p < 0.01, and ***p < 0.001.
To assess the functional implications on loss of supercomplex formation, we characterized the metabolism of COX7A2L-deficient PDAC cells. Loss of COX7A2L significantly decreased ATP levels (Figure 4B), with a more profound decrease observed in severe hypoxia, suggesting that depletion of respiratory supercomplexes selectively affects mitochondrial efficiency under these oxygen tensions. We next reasoned that redox homeostasis (oxidation-reduction reactions) would also be perturbed upon loss of COX7A2L. Hypoxia decreases the mitochondrial NAD+/NADH ratio through slowing of electron transport and consequent reduction in the rate of NADH oxidation (Chance and Williams, 1955; Mayevsky, 1984). In addition to the observed decrease in NAD+/NADH in hypoxia, loss of COX7A2L decreased in the NAD+/NADH ratio specifically in low oxygen (Figure 4C). We therefore postulated that COX7A2L-deficient cells exhibit decreased mitochondrial efficiency that would limit the capacity of PDAC cells to proliferate in severe hypoxia. We found that COX7A2L-deficient cells exhibited significantly decreased membrane potential (Figure 4D) and aspartate production flux (Figure 4E) in 0.1% oxygen. In addition, we observed a significantly reduced proliferative capacity in COX7A2L-deficient PDAC cells specifically in low oxygen (Figure 4F), which was consistently rescued by addition of pyruvate (Figure 4G), but not mitoTempo (Figure 4G). To address whether exogenous expression of COX7A2L could rescue hypoxic growth, we over-expressed COX7A2L in the 8902 cell line (Figure S4I), which exhibits low levels of endogenous COX7A2L compared with other PDAC cell lines (Figure S3D). Modest overexpression of COX7A2L increased basal, complex III-linked and complex IV-linked respiration (Figures S4J and S4K), leading to increased proliferative capacity irrespective of oxygen tension (Figure 4L). Collectively, these data suggest that the maintenance of mitochondrial supercomplexes is important for severely hypoxic growth by providing pancreatic cancer cells with a metabolic advantage (Figure 4H).
Efficient Electron Transfer Is Important for In Vivo Tumor Growth by Reducing Oxidative Stress and Increasing Metabolic Efficiency
Because decreasing oxygen tension increased the functional relevance of mitochondrial respiratory supercomplexes in pancreatic cancer cells, we hypothesized that perturbing supercomplex formation would affect tumor growth. To validate the presence of tumor hypoxia in the subcutaneous tumor model, we performed photoacoustic imaging to distinguish areas of oxy- and deoxy-hemoglobin (Figure S4M). Subcutaneous tumors displayed similar patterns of oxygenation, in which tissue oxygenation was higher around the proliferating rim and consistently lower toward the core of the tumor (Figure S4M). To determine whether loss of supercomplex formation reduced tumor growth, we subcutaneously implanted pancreatic cancer cells with COX7A2L knockdown and assessed tumor progression. Loss of COX7A2L in pancreatic cancer cells resulted in significantly decreased tumor growth kinetics and burden (Figures 5A–5D), in which a more profound effect was observed in the hairpin that resulted in stronger COX7A2L knockdown (Figure S4N). Conversely, overexpression of COX7A2L enhanced tumor growth kinetics (Figures S4O and S4P). These results suggest that efficient electron transfer through supercomplex assembly is important for in vivo tumor growth. To confirm the role of supercomplexes in maintaining ETC efficiency in vivo, we assessed for the generation of reactive oxygen species (ROS), which results from impairment of the ETC, using malondialdehyde (MDA), a marker of lipid peroxidation. MDA staining in subcutaneous tumors lacking COX7A2L was increased compared with controls (Figure S4Q). This was observed in addition to an increase in staining for cleaved caspase-3 (Figure S4R). However, there were no significant differences in staining for Ki67 (Figure S4S). These results suggest that loss of supercomplex formation increases ROS-mediated damage and cell death as a result of impaired ETC efficiency.
Figure 5. Respiratory Efficiency through Supercomplex Assembly Is Important for In Vivo Growth.
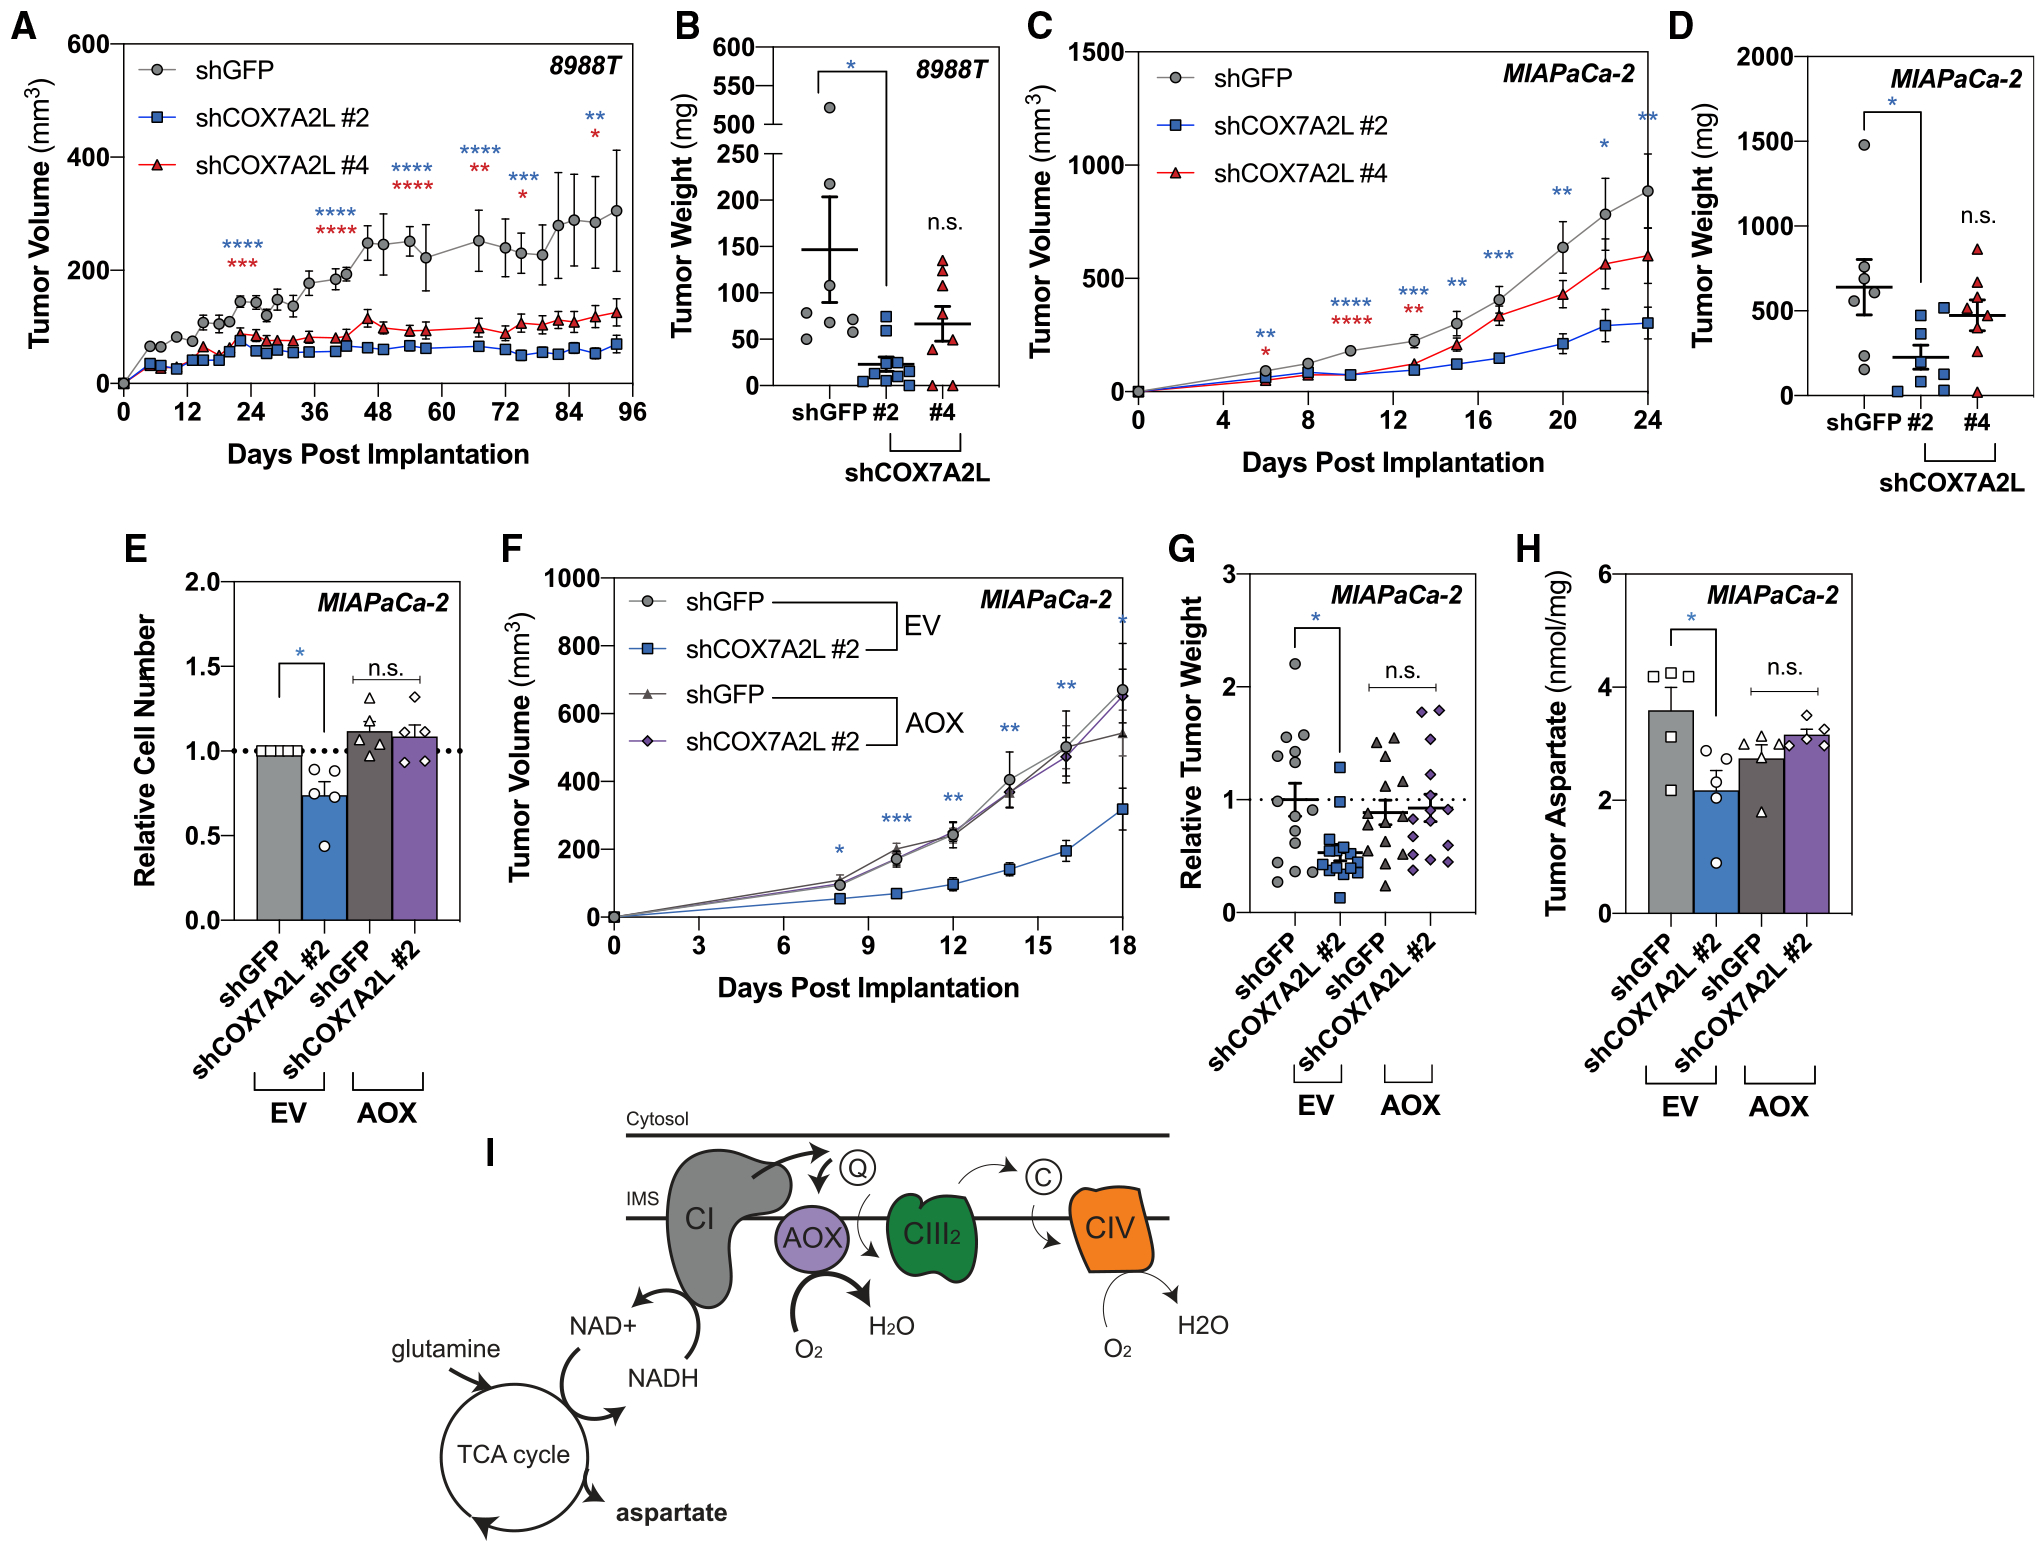
(A) Measurements to determine tumor volume were recorded to assess tumor growth after 2 × 10⁶ 8988T cells with loss of COX7A2L were implanted subcutaneously (mean SEM, n ≥ 8 per group, p = 0.015 at day 93).
(B) Tumor weight was measured at the endpoint (mean SEM, n ≥ 8 per group, p = 0.021 at day 93).
(C) Measurements to determine tumor volume were recorded to assess tumor growth after 2 × 10⁶ MIAPaCa-2 cells with loss of COX7A2L were implanted subcutaneously (mean SEM, n ≥ 7 per group, p = 0.0059 at day 24).
(D) Tumor weight was measured at the endpoint (mean SEM, n ≥ 7 per group, p = 0.0302 at day 24).
(E) Relative cell number after 5 days of proliferation at 1% oxygen in MIAPaCa-2 cells expressing empty vector (EV) or AOX on loss of COX7A2L (mean ± SEM, n = 5, p = 0.0223).
(F) Measurements to determine tumor volume were recorded to assess tumor growth after 2 × 10⁶ MIAPaCa-2 cells expressing EV or AOX on loss of COX7A2L were implanted subcutaneously (mean SEM, n ≥ 9 per group, p = 0.0271 at day 18).
(G) Tumor weight was measured at the endpoint from two independent experiments (mean SEM, n ≥ 14 per group, p = 0.0147).
(H) Tumor aspartate levels quantified by gas chromatography-mass spectrometry (GC-MS) from 5 mg of tissue harvested at day 12 (mean SEM, n = 5, p = 0.0116).
(I) Schematic demonstrating how AOX-expressing pancreatic cancer cells rescue the metabolic and proliferative defects associated with loss of supercomplex formation in hypoxic pancreatic cancer cells.
Significance was determined using Dunnett’s multiple comparison test in (A)–(G), where n.s. ≥ 0.05, *p < 0.05, **p < 0.01, ***p < 0.001, and ****p ≤ 0.0001.
In addition to the COX-dependent respiratory pathway found in all eukaryotes, plants and lower organisms conduct an alternative respiratory pathway through an alternative oxidase (AOX). AOX enables electron transfer from ubiquinol to oxygen without contributing to the proton gradient, thereby bypassing endogenous complex III and IV activity. Because the presence of AOX does not affect NADH-linked oxidative phosphorylation, neither membrane potential/integrity nor supercomplex assembly is affected. In the presence of endogenous ETC complexes, AOX competes for electrons. However, AOX has a lower affinity for ubiquinol compared with complex III (0.53–0.38 mM compared with <20 μM) (Chretien et al., 2004; Kay and Palmer, 1985); therefore, it does not accept electrons when complex III and the downstream cytochrome pathway are functionally intact (Bahr and Bonner, 1973a, 1973b). Transport of electrons from ubiquinol to oxygen by AOX only occurs when ubiquinol is overly reduced, for example, when complex III or IV is dysfunctional (Maxwell et al., 1999).
To determine whether bypassing complex III and IV of the ETC could alleviate the growth defects observed in hypoxic pancreatic cancer cells on disruption of supercomplex assembly, we ectopically expressed AOX from Ciona intestinalis in PDAC cells. To ensure AOX functionality, cells were treated with complex III inhibitor antimycin A. Pancreatic cancer cells expressing AOX were able to restore oxygen consumption (Figure S5A), growth (Figure S5B), and aspartate abundance (Figure S5C) in the presence of antimycin A, implying proper function of AOX in the presence of endogenous complex III. Because AOX has a lower affinity for oxygen compared with COX (1–2 μM compared with 0.1–0.15 μM) (Bârzu and Satre, 1970; Bendall and Bonner, 1971; Ikuma et al., 1964; Millar et al., 1994), we increased the oxygen tension for our in vitro studies from 0.1% to 1% to ensure AOX functionality. In cells exposed to 1% oxygen, expression of AOX restored aspartate levels (Figures S5D and S5E) and significantly rescued hypoxic growth (Figure 5E) in COX7A2L-deficient cells. Importantly, no difference was observed in COX7A2L wild-type cells, suggesting that AOX does not participate in electron transfer in the presence of intact supercomplexes. These results show that the presence of AOX can bypass the metabolic and growth defects associated with loss of supercomplex formation under conditions of hypoxic stress in vitro.
To determine whether expression of AOX could rescue in vivo growth on knockdown of COX7A2L, we subcutaneously implanted control or AOX-expressing cells with loss of COX7A2L to assess tumor growth. We found that AOX expression rescued the in vivo growth defect of COX7A2L knockdown in terms of both tumor progression and weight (Figures 5F and 5G). We next assessed intratumoral aspartate levels and found that loss of COX7A2L reduced intratumoral aspartate, consistent with in vitro data, that was fully rescued on addition of AOX (Figure 5H). Furthermore, there was no difference in growth or size between control and AOX-expressing tumors with intact supercomplex assembly, suggesting that AOX only becomes functionally active on disruption of supercomplex formation. Collectively, these data suggest that loss of supercomplex assembly affects ETC efficiency/functionality in vivo, enabling AOX activity that rescues the growth and metabolic defects associated with loss of COX7A2L (Figure 5I).
DISCUSSION
Pancreatic cancers are severely hypoxic to an extent that is predicted to have significant implications on the biology of these tumors. Our data demonstrate that pancreatic cancer cells maintain robust proliferation in extremely hypoxic environments (0.1% oxygen), in which the ability to grow in such extreme hypoxia paradoxically depends on the activity and maintenance of oxidative metabolism and mitochondrial respiration.
Hypoxia is a physiological condition that can apply to major organs and tissues, resulting in lower oxygen tensions than air saturation. Tissue oxygenation ranges between ~3% and 7% (Ast and Mootha, 2019) but can be as low as 0.5%, for example, in the large intestine. Oxygen levels become rate limiting at 0.3% for ETC activity (Wilson et al., 1988); however, COX has a remarkably high affinity for oxygen with an apparent KM value closer to 0.1% oxygen (Cooper, 1990). We show that pancreatic cancer cells efficiently respire at nearly anoxic levels, a phenomenon that is not universal to other less hypoxic tumor types, and the requirement for efficient respiration dictates pancreatic cancer hypoxic growth.
Our work demonstrates that respiratory efficacy is facilitated by the formation of mitochondrial supercomplexes through genetic targeting of COX7A2L. However, this does not exclude the possibility that perturbation of other assembly factors in other contexts may also result in decreased mitochondrial fitness (Ameri et al., 2015). The formation of mitochondrial supercomplexes appeared to be redundant in normoxic pancreatic cancer cells, suggesting that efficient electron transfer becomes increasingly important in conditions of limited oxygen. Consistent with our findings, mitochondrial supercomplexes have recently been described to increase hypoxia tolerance in breast and endometrial cancer (Ikeda et al., 2019). Moreover, we show that these tumor types maintain remarkable viability during conditions of anoxia, illustrating the severity of hypoxia in pancreatic cancer and highlighting an additional reason it is challenging to eradicate these tumors. Our data suggest that oxygen is required for growth, but not necessarily to maintain viability, which may have important implications for tumor biology.
Without intact or functional mitochondria, cells would be forced to rely on exogenous nutrient sources for cellular processes such as repair and proliferation. Pancreatic cancer is characterized by high basal levels of autophagy and macropinocytosis, which is thought to increase in hypoxia (Frezza et al., 2011; Mazure and Pouysségur, 2010), to supply cellular metabolites. Our results suggest that independent of this, pancreatic cancer cells are uniquely capable of maintaining oxidative mitochondrial metabolism for continued anabolism and growth in hypoxia. Furthermore, it is possible that this phenotype is independent of Kirsten rat sarcomas (KRAS) status, because most non-PDAC cell lines used in the study are KRAS mutant, with the exception of MDA-MB-468. Aspartate is reported to be limiting for the growth of some tumor types in vivo, but this was not found to be the case in pancreatic cancer (Sullivan et al., 2018). By regulating mitochondrial redox to permit TCA cycling and sustain aspartate synthesis, mitochondrial efficiency in pancreatic cancer may provide one explanation as to why this is the case. HIF1α has been reported to directly repress aspartate biosynthesis by suppressing GOT1 and GOT2 activity and expression (Meléndez-Rodríguez et al., 2019). Although we observed canonical HIF1α stabilization in all cell lines tested, we did not observe universal suppression in either GOT1 or GOT2 expression (Figure S2J).
An increase in reductive carboxylation has been well described in cells with mitochondrial dysfunction (Mullen et al., 2011) and in hypoxic cells (Filipp et al., 2012; Metallo et al., 2011; Wise et al., 2011). It has been postulated that an increase in reductive carboxylation occurs in response to a decrease in mitochondrial NAD+/NADH (Fendt et al., 2013) to divert carbon from oxidative TCA cycle metabolism, increase de novo lipogenesis, and regenerate NADH via malate dehydrogenases to sustain glycolysis (Gaude et al., 2018). Because our data suggest that pancreatic cancer cells do not induce reductive carboxylation to the same extent as other cell types during hypoxia, it may suggest that they more efficiently maintain NAD(H) homeostasis (Fendt et al., 2013).
Our findings demonstrate that respiratory supercomplexes in PDAC are necessary for metabolic efficiency in severely hypoxic conditions. Cell lines unable to sustain proliferation in severe hypoxia or viability in anoxia undergo physiological decreases in both mitochondrial number and morphology, predicted to negatively affect respiratory function. Hypoxia is reported to induce mitochondrial fission to promote mitophagy, effectively eliminating damaged mitochondria by autophagy to limit ROS generation (Fuhrmann and Brüne, 2017). By extension, this could suggest that pancreatic cancer cells have evolved robust cellular mechanisms to reduce mitochondrial ROS and/or damage (Humpton et al., 2019). Although our data strongly support that PDAC cells maintain intact ETC functionality under severe hypoxia, measuring mitochondrial membrane potential by TMRE fluorescence intensity can be confounded by differences in mitochondrial morphology, localization, or mass (Perry et al., 2011). Furthermore, membrane potential can be maintained by reversal of the ATP synthase in unhealthy mitochondria with compromised energetics (Nicholls and Ward, 2000).
Collectively, our study demonstrates that mitochondrial respiratory supercomplexes are important components of pancreatic cancer cell growth in severe hypoxia both in vitro and in vivo. Disrupting the formation of supercomplexes by targeting key proteins that facilitate their assembly or maintain their stability may have therapeutic applications for this deadly disease.
STAR★METHODS
RESOURCE AVAILABILITY
Lead Contact
Further information and requests for resources and reagents should be directed to and fulfilled by the Lead Contact, Alec C. Kimmelman (alec.kimmelman@nyulangone.org).
Materials Availability
This study did not generate unique reagents.
Data and Code Availability
The mass spectrometry proteomics dataset generated during this study has been deposited to the ProteomeXchange Consortium via the PRIDE partner repository with the dataset identifier PXD020990 (Perez-Riverol et al., 2019).
EXPERIMENTAL MODEL AND SUBJECT DETAILS
Cell culture
MIAPaCa-2, PANC-1, HPAC, A549, HCT116, DLD-1, MDA-MB-468 and MDA-MB-231 cell lines were obtained from ATCC. Pa-Tu-8988T and Pa-Tu-8902 cellswere obtained from the DSMZ. Cell lineswere routinely tested formycoplasma by PCR and cultured in DMEM (Corning) supplemented with 10% FBS (Atlanta Biologicals S11550H, Lot No. C18030) in a humidified incubator maintained at 37°C. Low passage cultures were maintained in a centralized cell bank and cell lines were authenticated by visual inspection and STR fingerprinting.
Mice
All mouse studies were approved by the NYU Institutional Animal Care and Use Committee (IACUC) under protocol numbers IA16–00507 and IA16–01331. Female nude mice (NCr-Foxn1nu sp/sp) were purchased from Taconic at 7–8 weeks of age and maintained in the animal facility at NYU School of Medicine.
METHOD DETAILS
Hypoxic and anoxic studies
All oxygen-regulated studies were performed in a highly controlled chamber (Coy Labs), which was calibrated every 3–4 months using a 2-step calibration of pre-ordered gas tanks at 5% and 0.1% oxygen. For anoxic studies, an anaerobic environment was achieved using a 5% hydrogen gas mix and a palladium catalyst to eliminate excess oxygen (0–5 ppm) through the formation of water.
No hypoxic or anoxic experiments were performed by exposing samples to ambient conditions.
Cell proliferation and viability
Cells were plated in 24-well plates at 5,000–10,000 cells per well depending on cell line. For assessment of hypoxic growth, cells were transferred to hypoxia the following day. Cells were fixed in 10% formalin and stained with 0.1% crystal violet. Dye was extracted with 10% acetic acid, and relative proliferation was determined by measuring OD at 595 nm using a FLUOstar Omega plate reader (BMG Labtech). Absorbance measurements were background corrected and curves determined by normalizing to day zero absorbance measurements.
Cell viability was determined by trypan blue exclusion where cells were seeded overnight at 20,000 per 6 cm dish and transferred to anoxia for 5 days after the media had been replaced. Cells were trypsinized and resuspended in their own media. Trypan blue (Gibico) positive cells were counted and viability was assessed using Countess II FL (Invitrogen).
Proliferation rates (k) were calculated using the exponential growth equation:
Where Y is final cell number, Y0 is initial cell number, and t is the number of days.
p0 cell generation
To generate p0 cells, cells were depleted of mitochondria by culturing in DMEM containing 10% FBS, 50 ng/ml ethidium bromide, 1 mM pyruvate and 100 μg/ml uridine for 4–6 weeks. The inactivation of mitochondrial DNA was confirmed by cell death when cells were cultured in media lacking glucose but supplemented with 25 mM galactose for 48 h.
Lentivirus-mediated shRNAs
All shRNA vectors were obtained from the Sigma MISSION TRC shRNA library as a glycerol stock. The target sequence and TRC number for each shRNA are as follows: shGFP GCAAGCTGACCCTGAAGTTCAT; shGOT1 #1 GCAGAGTTCCAAGACAGGATA (TRCN0000034784); shGOT1 #2 GCGTTGGTACAATGGAACAAA (TRCN0000034785); shGOT2 #1 TTTGCAGACCATAGTGAAGGC (TRCN0000034824); shGOT2 #2; TTTGGGCAGAAAGACATCTCG (TRCN0000034825) shCOX7A2L #2 CGATTCCACAGTGTATGATT (TRCN0000300340); shCOX7A2L #4 CTGCCTGACCAAATGCTTTA (TRCN0000046302). These shRNAs were selected after screening 1–5 shRNAs by qPCR and western blot.
Lentivirus were produced by transfecting 293T cells with pLKO constructs, pMD2.G (Addgene, plasmid #12259), and psPAX2 (Addgene, plasmid #12260) using standard jetPEI protocol (Polyplus). All experiments were conducted using pools of cells after selection.
Retrovirus-mediated rescue experiments
Retroviral vectors were generated by ligation of fragments PCR-amplified from COX7A2L cDNA (Dharmacon, clone ID 4251503) construct into a pBABE-puromycin retroviral vector (Addgene, plasmid #1764) digested with BamHI and Sal1.
AOX PWI GFP plasmids were a gift from Navdeep Chandel and have been described previously (Martínez-Reyes et al., 2016).
Quantitative reverse-transcription PCR
Total RNA was extracted using PureLink RNA Mini kit (Thermo Fisher Scientific) and reversed transcribed using Superscript Vilo IV (Thermo Fisher Scientific) with oligo-dT primers. Quantitative PCR was performed with SYBR Green Supermix (Bio-Rad) on the CFX96 real-time PCR machine (Bio-Rad). Comparative analysis was calculated using the ΔCt method and normalized using the 18S ribosomal RNA sequence as a control.
Antibodies and western blot
Cells were scraped on ice in RIPA buffer (Millipore), containing protease and phosphatase inhibitors (Roche). Proteins were separated in 4%–20% SDS-PAGE gels and transferred onto nitrocellulous membranes (GE Healthcare). After blocking in 5% dry milk in TBST, membranes were incubation with the following primary antibodies and dilutions overnight at 4°C: anti-COX7A2L (Protein-tech, 11416, 1:500), anti-HIF1α (BD Biosciences, 610959, 1:500), anti-GOT1 (Novus Biologics, NBPI-54778, 1:500), anti-GOT2 (Novus Biologics, NBP1–47469, 1:500), anti-ERK2 (Abcam, ab32081, 1:1,000), anti-NDUFB8 (Abcam, 1:1,000, ab110242), anti-UQCRC2 (1:1,000, ab14745, Abcam), anti-MTCO1 (1:1,000, ab14705, Abcam) and anti-Actin (Sigma, A5441, 1:5,000). Membranes were washed with TBST, incubated with the appropriate peroxidase-conjugated secondary antibody (Cell Signaling Technologies, 1:5,000, 7045S or 7076S) for 1 h and developed using the enhanced chemiluminescence (ECL) detection system (Bio-Rad, 1705061) using a ChemiDoc (Bio-Rad).
Mitochondrial Isolation and BN-PAGE
Mitochondria were isolated using Biovision Mitochondria/Cytosol Fractionation Kit (Biovision, K256). Briefly, 5 × 10⁷ cells were collected and homogenized using an ice-cold douncer in mitochondrial isolation buffer containing DTT and protease inhibitors. After 40 strokes, samples were centrifuged at 700 g for 10 min at 4°C and the supernatant were centrifuged at 10,000 g for 30 min at 4°C to obtain the mitochondrial fraction. Pellets were resuspended in 100 μl 1x PBS for protein quantification. 50 μg of mitochondrial fraction was prepared bya centrifugation at10,000 g for 10min at4°C,and resuspended in 20 μl NativePAGE samplebuffer containing 5% digitonin (Invitrogen). BN-PAGE was performed as previously described (Jha et al., 2016). To detect CIII and CIV of the electron transport chain, antibodies were selected based on the amino acid sequence-identity of the used immunogens to generate the antibodies. Anti-UQCRC2 (1:1,000, ab14745, Abcam) and anti-MTCO1 (1:1,000, ab14705, Abcam) were used. After incubation with the primary antibody dilution, the membrane was washed and developed using the WesternBreeze Chromogenic Western Blot Immunodetection Kit (Invitrogen).
Transmission electron microscopy
Cells were plated at 3 × 10⁶ and left overnight to adhere to the plate surface before transferring to hypoxia (0.1% O2) for 24 h. Cells were fixed in 1 mL 0.1 M sodium cacodylate buffer (pH 7.4) containing 2.5% glutaraldehyde and 2% paraformaldehyde for 2 h and post-fixed with 1% osmium tetroxide and 1% potassium ferrocyanide for 1 h at 4°C, then block stained in 0.25% aqueous uranyl acetate, processed in a standard manner and embedded in Embed 812 (Electron Microscopy Sciences, Hatfield, PA.). Ultrathin sections (70 nm) were cut, mounted on copper grids and stained with uranyl acetate and lead citrate. Stained grids were examined under Talos120C transmission electron microscope (ThermoFisher Scientific, Hillsboro, OR) with Gatan (4k × 4k) OneView Camera. For morphometric analysis, mitochondria and cristae were identified manually from high-resolution, high magnification images acquired in a user-blinded fashion. Mitochondrial cristae length and maximal cristae width were measured using Fiji in 23 – 39 mitochondria per condition (Sood et al., 2014).
TMRE measurements
Cells ectopically expressing a mitochondrial GFP tag (3xHA-EGFP-OMP25; Addgene #83356) were seeded in a glass bottom, 4 compartment dish and incubated in DMEM containing TMRE (25 nM; Invitrogen) and verapamil (10 μM; Caymen Chemicals), to facilitate the loading of TMRE into cells, 40 min prior to imaging. Cells were additionally treated with carbonyl cyanide 4-(trifluoromethoxy) phenylhydrazone (FCCP; 10 μM; Sigma) for 30 min before imaging. Hypoxic cell samples were sealed in a portable microscope stage sealed within the hypoxia chamber. Further transfer of the stage to the microscope was achieved by flooding the stage with a pre-made gas tank of 0.1% O2 and 5% CO2 maintained at positive pressure. Images were collected with a Nikon Ti microscope with a Plan Apo 20x N.A. 0.75 DIC lens and an Andor Zyla 5.5 sCMOS camera. Using Fiji software (http://fiji.sc/), TMRE fluorescence was calculated by subtracting basal fluorescence (FCCP treated) and normalized to mitochondrial content by dividing GFP fluorescence intensity. The number of visual fields analyzed per experimental condition are outlined in the figure legends.
ATP and NAD+/NADH measurements
ATP measurements were performed using CellTiter-Glo (Promega, G7572) analysis as per manufacturer’s protocol. NAD+/NADH measurements were performed using the NAD/NADH Glo Assay (Promega, G9071) as per manufacturer’s protocol. Luminescence was measured using a FLUOstar Omega plate reader (BMG Labtech). Luminescence measurements were background corrected. ATP measurements were normalized to protein content.
Stable-isotope tracing, kinetic flux profiling and tumor metabolite quantification
For stable-isotope labeling experiments, cells were seeded overnight at 100,000 cells per well. Media was replaced after 24 h in basic DMEM supplemented with 10% dialyzed FBS (Gibico 26400044) with either 10 mM [U]-13C6-glucose or 2 mM [U]-13C5-glutamine and transferred to hypoxia for a further 24 h.
For kinetic flux profiling, cells were seeded overnight in 6-well plates at 250,000 cells per well. For hypoxic samples, basic DMEM supplemented with 10% dialyzed FBS cells (Gibico 26400044), 20 mM glucose and 2 mM [U]-13C5-glutamine was pre-incubated for 24–48 h prior to starting the time-course. Hypoxic plates were left in the hypoxia chamber overnight prior to addition of isotope labeled media. Samples were extracted in triplicate at various time-points. Unlabeled metabolite (M0) versus time (t) were plotted and the data were fitted to an equation as previously described (Yuan et al., 2008) to quantify the metabolite turnover rate (t−1):
Where α is the percentage of unlabeled (M0) metabolite at steady-state, k is the metabolite turnover rate and t is time.
Metabolite flux was quantified by multiplying the decay rate by the intracellular metabolite abundance. Metabolite abundance [Xm] was determined using the following equation:
Where Xstd is the molar amount of isotope labeled standard and %M0x is the relative abundance of unlabeled metabolite × corrected for natural isotope abundance.
Cellular metabolites were extracted after a brief wash with 0.9% ice-cold saline solution to remove media contaminants using a methanol/water/chloroform extraction method, as previously described (Metallo et al., 2011). After a 15 min vortex at 4°C, aqueous and inorganic layers were separated by cold centrifugation for 15 min. 250 μl of the aqueous layer containing polar metabolites was transferred to sample vials (Agilent 5190–2243) and evaporated by SpeedVac (Savant Thermo SPD111V).
For quantification of tumor metabolites, mice were fasted 6 h prior to euthanasia, surgical resection and tumor harvest. Tumors were extracted in methanol/water/chloroform using the QIAGEN TissueLyser LT, evaporated to dryness and resuspended in 80% ice-cold methanol. The equivalent volume for 5 mg of tissue was further extracted in 80% ice-cold methanol mixture containing isotope-labeled standards and evaporated to dryness.
Metabolite derivitzation using MOX-tBDMS was conducted as previously described (Lewis et al., 2014). Derivatized samples were analyzed by GC-MS using a DB-35MS column (30 m × 0.25 mm i.d. × 0.25 μm) installed in an Agilent 7890B gas chromatograph (GC) interfaced with an Agilent 5977B mass spectrometer as previously described (Grassian et al., 2014) and corrected for natural abundance using in-house algorithms adapted from Fernandez et al. (1996).
Mole percent enrichment (MPE) represents the contribution of carbons from a specific source (i.e., glucose) to a metabolite (e.g., citrate) and is calculated using the following equation:
Where xi represents the fractional enrichment of an isotopologue (M1 + M2 + … Mn) summed over the number of carbons “n.”
Quantitative proteomics
Quantitative whole-cell proteomics of 8988T and MIAPaCa-2 cell lines was performed as previously described (An et al., 2019; Paulo et al., 2017). After 24 h in normoxia or severe hypoxia (0.1%), cells were lysed in 8 M urea buffer (8 M urea, 1 M Tris pH 7.4, 5 M NaCl) containing protease and phosphatase inhibitors (Roche) followed by sonication at 4°C. The sonicated lysate was clarified by centrifugation at 13,000 rpm for 10 min at 4°C. Protein concentration was estimated by Bradford assay and 100 μg of total protein was used for each replicate. 100 μg of clarified lysate for each sample was then reduced and alkylated by the addition of 5 mM TCEP for 30 min at 37°C and 20 mM chloroacetamide for 20 min at room temperature, followed by methanol-chloroform precipitation at a 3:1 ratio to the lysate. The protein precipitate was washed thrice with ice cold methanol and resuspended in 200 mM HEPES pH 8.5 for protein digestion. Protein digestion was carried out by 1:100 protease to protein ratio of Lys-C for 2 h at 37°C followed by trypsin overnight. Each sample was then labeled with TMT reagent (TMT10 reagent, ThermoFisher Scientific, 90110) for 1 h, and the reaction was quenched with hydroxylamine at a final concentration of 0.3% w/v. 1% of each sample was mixed in a 1:1:1:1:1:1:1:1:1:1 ratio and a ‘ratio-check’ analysis using LC-MS/MS was performed to determine if the samples were present in equal ratios. Based on this result, the volumes of the remaining sample were adjusting and combined so as to maintain the 1:1:1:1:1:1:1:1:1:1 ratio. This combined sample was then dried to completeness using a vacuum centrifuge and acidified with 5% w/v formic acid. Digested peptides were cleaned up using C18 SPE (Sep-Pak, Waters) and separated using basic pH reversed-phase HPLC and pooled into 24 fractions. All 24 fractions were vacuum dried to completeness and subject to the C18 stage tip method prior to loading on the mass-spectrometer. Data was obtained using an Orbitrap fusion Lumos mass spectrometer linked with a Proxeon EASY-nLC 1200 LC pump. Peptides were separated on a 75 μM inner diameter microcapillary tube packed with 35 cm of Accucore C18 resin (2.6 μm, 100A, Thermo Fisher Scientific). The data was acquired using the MS3 method as outlined in McAlister et al. (2014).
Raw mass spectra obtained were processed using an in-house software pipeline as described in Huttlin et al. (2010) and Paulo et al. (2015). Values for protein quantification were exported and processed using Perseus to calculate Log fold changes and p values. Volcano plots using these values were plotted in excel. Each comparison was subjected to gene set enrichment analysis (GSEA) via Broad GSEA software (4.0) using Transcription Factor Targets (c3.tft.v7.1.symbols.gmt) from MsigDB.
Oxygen consumption rate
Oxygen consumption rates (OCR) were measured using a Seahorse XFe96 analyzer (Agilent) where cells were seeded into Seahorse XFe96 plates at 10,000 – 20,000 per well overnight depending on the cell line. Respiration in intact cells was measured in DMEM (Sigma #5030) supplemented with 10 mM glucose and 2 mM glutamine. Where indicated, cells were pre-treated with 2 μM Antimycin A 15 minutes prior to initial measurements. Respiratory rates were measured in response to sequential injections of oligomycin (2 μM), FCCP (0.5 μM) and rotenone / antimycin A (1 μM) (all Cayman Chemicals). Permeabilized cell respiratory rates were measured after cells were washed and resuspended in 1x MAS buffer containing either substrates pyruvate (10 mM) and malate (1 mM) or ascorbate and TMPD, along with ADP (4 mM) and XF PMP Reagent (1 nM) (Agilent Technologies). Phosphorylating (“State 3”) respiration was measured as described in Divakaruni et al. (2014). Cells were immediately lysed in 25 μL/well Reagent A (Bio-Rad) after each assay, and protein quantified using the DC protein assay kit (Bio-Rad). OCR was normalized to micrograms total protein, as quantified by a standard curve.
In vivo xenograft
For subcutaneous xenografts, cells were infected with lentivirus. After 3 days of selection with puromycin (2 μg/ml) or FACS sorting for GFP expression, 2 × 10⁶ cells were suspended in HBSS, mixed with Matrigel (BD Biosciences) at 1:1 ratio, and subcutaneously injected into the lower flanks of 7–8 weeks old nude female mice (Nu/Nu; Taconic) in a final volume of 100 μl. Tumor length and width were measured 2–3 times a week using caliper. Tumor volumes were calculated using the formula (L × W2)/2.
Photoacoustic imaging
Photoacoustic (PA) imaging was performed as previously described (Gerling et al., 2014). Briefly, mice bearing subcutaneous tumors were anesthetized under 98% oxygen and 2% isoflurane. Ultrasound gel was applied and imaged with the LZ250 transducer. The tumor was located in B-mode and the transducer aligned to the largest axial cross-section. A 3D image series was acquired with ultrasound B-mode and PA dual wavelength imaging at 750 nm (oxy-haemoglobin) and 805 nm (deoxy-haemoglobin) using a 3D motor. Co-registered B-mode image series were used to assign regions of interest around the tumor.
Immunohistochemistry
Tumors resected from mice were fixed in five volumes of 10% formalin at 4°C for 48 h with gentle agitation. Tumors were washed in five volumes of 70% ethanol prior to processing, embedding and sectioning. IHC was performed on 5 μm sections. Tissues were deparaffinized and rehydrated, and antigen retrieval was performed in a steamer for 15 minutes in 10 mM pH 6.0 citrate buffer containing 0.05% Tween-20. Slides were incubated in 3% hydrogen peroxide and 50% methanol for 30 minutes and blocked in 5% goat serum and 1% bovine serum albumin in TBST for 30 minutes at room temperature. Primary antibody (anti-MDA, 1:500, Abcam, anti-Ki67 1:100, Biolegend, anti-cleaved caspase 3, CST, 1:500) was diluted in blocking buffer and added to sections at 4°C overnight. Sections were washed in TBST before incubation with biotin-conjugated secondary antibody (anti-rabbit 1:200; Vector Labs PK-1000) for 30 minutes at room temperature followed by Avidin-Biotin Complexes (Vector Labs PK-4000) for a further 30 minutes. Slides were developed by 3,3-diaminobenzidine hematoxylin staining for 3–5 minutes. Sections were dehydrated and mounted in permount mounting medium (Thermo Fisher Scientific SP15–100) and allowed to dry overnight before slide imagining. MDA staining was quantified by DAB color deconvolution and quantification of optical density using ImageJ.
QUANTIFICATION AND STATISTICAL ANALYSIS
Unless otherwise indicated, data are presented as mean ± standard error of the mean (SEM) and repeated in at least three independent experiments. Statistical analysis was performed using GraphPad Prism. A one-way ANOVA test was performed for the comparison of multiple groups to a single control group, followed by the Dunnett’s multiple comparison test. An unpaired, two-tailed Student’s t test was performed when comparing two groups to each other. All p values and n are reported in the figure legends. For all significance analyses, groups were considered significantly different in p value < 0.05.
Supplementary Material
KEY RESOURCES TABLE
| REAGENT or RESOURCE | SOURCE | IDENTIFIER |
|---|---|---|
| Antibodies | ||
| Rabbit polyclonal anti-GOT1 | Novus Biologicals | Cat#NBPI-54778; Lot#QC19370–43530; RRID:AB_11006805 |
| Rabbit monoclonal anti-GOT2 | Novus Biologicals | Cat#NBPI-47469; Lot#160630; RRID:AB_10010421 |
| Rabbit polyclonal anti-COX7A2L | Proteintech | 11416–1-AP; RRID:AB_2245402 |
| Rabbit polyclonal anti-LRRPRC | Sigma-Aldrich | Cat#SAB2700419; Lot#GT40023 |
| Mouse monoclonal anti-ACTIN | Sigma-Aldrich | Cat#A5441; RRID:AB_476744 |
| Mouse monoclonal anti-NDUFB8 | Abcam | Cat#ab110242; Lot#GR187601–16; RRID:AB_10859122 |
| Mouse monoclonal anti-UQCR2 | Abcam | Cat#ab14745; Lot#GR3216455–3; RRID:AB_2213640 |
| Mouse monoclonal anti-MTCO1 | Abcam | Cat#ab14705; Lot#GR3299196–3; RRID:AB_2084810 |
| Total OXPHOS rodent antibody cocktail | Abcam | Cat#110413; Lot#M9023; RRID:AB_2629281 |
| Rabbit monoclonal anti-ERK2 | Abcam | Cat#ab32081; RRID:AB_732210 |
| Mouse monoclonal anti-HIF1α | BD Biosciences | Cat#610959; Lot#6214690; RRID:AB_398272 |
| Rabbit polyclonal anti-MDA | Abcam | Cat#ab6463; RRID:AB_305484 |
| Rat polyclonal anti-Ki67 | Biolegend | Cat#652402; RRID:AB_11204254 |
| Rabbit polyclonal anti-cleaved caspase 3 | Cell Signaling Technology | Cat#9661S; RRID:AB_2341188 |
| Rabbit monoclonal anti-mouse secondary | Cell Signaling Technology | Cat#7076S; RRID:AB_330924 |
| Rabbit monoclonal anti-rabbit secondary | Cell Signaling Technology | Cat#7074S; RRID:AB_2099233 |
| Biotinylated goat anti-rabbit Ig antibody | Vector Labs | Cat#BA-1000; RRID:AB_2313606 |
| Biotinylated rabbit anti-rat Ig antibody | Vector Labs | Cat#BA-4001; RRID:AB_10015300 |
| Bacterial and Virus Strains | ||
| pMD2.G | Addgene | Cat#12259; RRID: Addgene_12259 |
| psPAX2 | Addgene | Cat#12260; RRPID: Addgene_12260 |
| 3xHA-EGFP-OMP25 | Addgene; (Chen et al., 2016) | Cat#83356; RRID: Addgene_83356 |
| pBABE-puro | Addgene; (Morgenstern and Land, 1990) | Cat#1764; RRID: Addgene_1764 |
| pWPI-EV-GFP | Navdeep Chandel; (Martínez-Reyes et al., 2016) | N/A |
| pWPI-AOX-GFP | Navdeep Chandel(Martínez-Reyes et al., 2016) | N/A |
| Biological Samples | ||
| Fetal Bovine Serum | Atlanta Biologicals | Cat#S11550H; Lot#C18030 |
| Dialyzed Fetal Bovine Serum | Gibico | Cat#26400044 |
| Chemicals, Peptides, and Recombinant Proteins | ||
| Trypan Blue | Gibico | 15250061 |
| Pyruvate | Gibico | 11360070 |
| Uridine | Sigma-Aldrich | U3750 |
| Ethidium Bromide | Alfa Aesar | AAJ62282AB |
| Galactose | Sigma-Aldrich | G5388 |
| Piercidin A | Cayman Chemicals | 15379 |
| Anitmycin A | Sigma-Aldrich | A8674 |
| FCCP | Cayman Chemicals | 15218 |
| Seahorse XF Plasma Membrane Permeabilizer | Agilent | 102504 |
| Seahorse XF Media | Agilent | 103575–100 |
| D-Glucose (U-13C6, 99%) | Cambridge Isotope Laboratories | Cat#CLM-1396; CAS:110187-42-3 |
| L-Glutamine (U-13C5, 99%) | Cambridge Isotope Laboratories | Cat#CLM-1822; CAS:184161-19-1 |
| Metabolomics Amino Acid Mix Standard | Cambridge Isotope Laboratories | Cat#MSK-A2–1.2 |
| Methoxyamine hydrochloride | Sigma-Aldrich | 226904 |
| N-tert-Butyldimethylsilyl-N-methyltrifluoroacetamide with 1% tert-Butyldimethylchlorosilane | Sigma-Aldrich | 375934 |
| TMRE | Thermo Fisher Scientific | T669 |
| Verapamil | Cayman Chemicals | Cat#14288; CAS:152-11-4 |
| Crystal Violet | Sigma-Aldrich | C0775 |
| RIPA Buffer | Millipore Sigma | 20–188 |
| cOmplete, Mini, EDTA-free Protease Inhibitor Cocktail | Roche | 4693159001 |
| PhosStop Phosphatase Inhibitor Cocktail Tablets | Roche | 04906845001 |
| TMT10 Reagent | Thermo Fisher Scientific | 90110 |
| Avidin Biotin Complexes | Vector Labs | PK-4000 |
| NativePAGE sample buffer (4x) | Thermo Fisher Scientific | BN2003 |
| Digitonin | Thermo Fisher Scientific | BN2006 |
| Critical Commercial Assays | ||
| NAD+/NADH | Promega | G9071 |
| CellTiterGlow | Promega | G7572 |
| Mitochondria/Cytosol Fractionation | Biovision | K256 |
| Deposited Data | ||
| Hypoxia TMT Proteomics on Pancreatic Cancer Cell Lines | This paper | PXD020990 |
| Experimental Models: Cell Lines | ||
| Pa-Tu-8988T | DSMZ | ACC 162 |
| MIAPaCa-2 | ATCC | ATCC CRL-1420 |
| PANC-1 | ATCC | ATCC CRL-1469 |
| HPAC | ATCC | ATCC CRL-2119 |
| Pa-Tu-8902 | DSMZ | ACC 179 |
| A549 | ATCC | ATCC CLL-185 |
| HCT116 | ATCC | ATCC CCL-247 |
| DLD-1 | ATCC | ATCC CLL-221 |
| MDA-MB-468 | ATCC | ATCC HTB-132 |
| MDA-MB-231 | ATCC | ATCC HTB-26 |
| Experimental Models: Organisms/Strains | ||
| Mouse: NCRNU-F: NCr-Foxn1nu sp/sp | Taconic | N/A |
| Oligonucleotides | ||
| 18S F: GTAACCCGTTGAACCCCATT | Integrated DNA Technologies | http://idtdna.com |
| 18S R: CCATCCAATCGGTAGTAGCG | Integrated DNA Technologies | http://idtdna.com |
| COX7A2L F: CACCAACTAAACTGACCTCCG | Integrated DNA Technologies | http://idtdna.com |
| COX7A2L R: GGGCACACCATCAGCTTTCT | Integrated DNA Technologies | http://idtdna.com |
| COX4–1 F: GAGAAAGTCGAGTTGTATCGCA | Integrated DNA Technologies | http://idtdna.com |
| COX4–1 R: GCTTCTGCCACATGATAACGA | Integrated DNA Technologies | http://idtdna.com |
| COX4–2 F: CCGTCGCTCCAATGAGTGG | Integrated DNA Technologies | http://idtdna.com |
| COX4–2 R: CGTCCGTCAAGGTGATCGG | Integrated DNA Technologies | http://idtdna.com |
| Recombinant DNA | ||
| MGC cDNA COX7A2L | Dharmacon | Cat#MHS6278–202840345; Clone:4251503 |
| Software and Algorithms | ||
| ImageJ 1.52 | ImageJ | http://fiji.sc/ |
| MATLAB 2020a | MathWorks | http://www.mathworks.com/products/matlab.html |
| Graphpad Prism 8 | Graphpad | http://www.graphpad.com |
| GSEA 3.0 | Broad Institute | https://www.gsea-msigdb.org/gsea/index.jsp |
Highlights.
PDAC cells maintain proliferation and oxidative metabolism during severe hypoxia
Mitochondrial supercomplexes increase the metabolic efficiency of hypoxic PDAC cells
Inhibiting supercomplex formation impairs hypoxic PDAC growth and tumor formation
AOX expression rescues the growth defects observed upon loss of supercomplex formation
ACKNOWLEDGMENTS
This work was supported by National Cancer Institute grants R01CA157490, R01CA188048, P01CA117969, P30CA016087, and R35CA232124; ACS research scholar grant RSG-13-298-01-TBG; NIH grant R01GM095567; the Lustgarten Foundation; and SUC2 (to A.C.K.). We thank the NYU Langone Health DART Microscopy Lab, Alice Liang, Chris Petzold, and Kristen Dancel-Manning for their assistance with TEM work. In addition, we thank NYU Langone Health Experimental Pathology, Cynthia Loomis, Mark Alu, Branka Dabovic, and Shanmugapriya Selvaraj for their assistance with processing, embedding, tissue sectioning, and imaging of slides. These cores are partially funded by an NYU Cancer Center support grant and NIH/NCI P30CA016087 and P01A1080192. We acknowledge Dr. Steven Gygi for use of CORE for mass spectrometry data analysis software. V.V.E. acknowledges support by the Jane Coffin Childs Memorial Fund. Lastly, we thank Teri Conte and Melissa Yin from Fujifilm, Visualsonics Inc., for assisting with the photoacoustic imaging, along with Catriona Dowling and Lin Wu for critically reading the manuscript.
Footnotes
SUPPLEMENTAL INFORMATION
Supplemental Information can be found online at https://doi.org/10.1016/j.celrep.2020.108231.
DECLARATION OF INTERESTS
A.C.K. has financial interests in Vescor Therapeutics. A.C.K. is an inventor on patents pertaining to KRAS-regulated metabolic pathways, redox control pathways in pancreatic cancer, targeting GOT1 as a therapeutic approach, and the autophagy control of iron metabolism. A.C.K. is on the Scientific Advisory Board of Rafael/Cornerstone Pharmaceuticals. A.C.K. is a consultant for Deciphera. The other authors declare no competing interests.
REFERENCES
- Ameri K, Jahangiri A, Rajah AM, Tormos KV, Nagarajan R, Pekmezci M, Nguyen V, Wheeler ML, Murphy MP, Sanders TA, et al. (2015). HIGD1A Regulates Oxygen Consumption, ROS Production, and AMPK Activity during Glucose Deprivation to Modulate Cell Survival and Tumor Growth. Cell Rep. 10, 891–899. [DOI] [PMC free article] [PubMed] [Google Scholar]
- An H, Ordureau A, Paulo JA, Shoemaker CJ, Denic V, and Harper JW (2019). TEX264 Is an Endoplasmic Reticulum-Resident ATG8-Interacting Protein Critical for ER Remodeling during Nutrient Stress. Mol. Cell 74, 891–908.e10. [DOI] [PMC free article] [PubMed] [Google Scholar]
- Ast T, and Mootha VK (2019). Oxygen and mammalian cell culture: are we repeating the experiment of Dr. Ox? Nat. Metab 1, 858–860. [DOI] [PubMed] [Google Scholar]
- Bahr JT, and Bonner WD Jr. (1973a). Cyanide-insensitive respiration. I. The steady states of skunk cabbage spadix and bean hypocotyl mitochondria. J. Biol. Chem 248, 3441–3445. [PubMed] [Google Scholar]
- Bahr JT, and Bonner WD Jr. (1973b). Cyanide-insensitive respiration. II. Control of the alternate pathway. J. Biol. Chem 248, 3446–3450. [PubMed] [Google Scholar]
- Bârzu O, and Satre M (1970). Determination of oxygen affinity of respiratory systems using oxyhemoglobin as oxygen donor. Anal. Biochem 36, 428–433. [DOI] [PubMed] [Google Scholar]
- Bendall DS, and Bonner WD (1971). Cyanide-insensitive Respiration in Plant Mitochondria. Plant Physiol. 47, 236–245. [DOI] [PMC free article] [PubMed] [Google Scholar]
- Birsoy K, Wang T, Chen WW, Freinkman E, Abu-Remaileh M, and Sabatini DM (2015). An Essential Role of the Mitochondrial Electron Transport Chain in Cell Proliferation Is to Enable Aspartate Synthesis. Cell 162, 540–551. [DOI] [PMC free article] [PubMed] [Google Scholar]
- Cardaci S, Zheng L, MacKay G, van den Broek NJF, MacKenzie ED, Nixon C, Stevenson D, Tumanov S, Bulusu V, Kamphorst JJ, et al. (2015). Pyruvate carboxylation enables growth of SDH-deficient cells by supporting aspartate biosynthesis. Nat. Cell Biol 17, 1317–1326. [DOI] [PMC free article] [PubMed] [Google Scholar]
- Carmeliet P, and Jain RK (2000). Angiogenesis in cancer and other diseases. Nature 407, 249–257. [DOI] [PubMed] [Google Scholar]
- Chance B, and Williams GR (1955). Respiratory enzymes in oxidative phosphorylation. III. The steady state. J. Biol. Chem 217, 409–427. [PubMed] [Google Scholar]
- Chen WW, Freinkman E, Wang T, Birsoy K, and Sabatini DM (2016). Absolute Quantification of Matrix Metabolites Reveals the Dynamics of Mitochondrial Metabolism. Cell 166, 1324–1337. [DOI] [PMC free article] [PubMed] [Google Scholar]
- Chretien D, Slama A, Brière JJ, Munnich A, Rötig A, and Rustin P (2004). Revisiting pitfalls, problems and tentative solutions for assaying mitochondrial respiratory chain complex III in human samples. Curr. Med. Chem 11, 233–239. [DOI] [PubMed] [Google Scholar]
- Cogliati S, Frezza C, Soriano ME, Varanita T, Quintana-Cabrera R, Corrado M, Cipolat S, Costa V, Casarin A, Gomes LC, et al. (2013). Mitochondrial cristae shape determines respiratory chain supercomplexes assembly and respiratory efficiency. Cell 155, 160–171. [DOI] [PMC free article] [PubMed] [Google Scholar]
- Cogliati S, Calvo E, Loureiro M, Guaras AM, Nieto-Arellano R, Garcia-Poyatos C, Ezkurdia I, Mercader N, Vázquez J, and Enriquez JA (2016). Mechanism of super-assembly of respiratory complexes III and IV. Nature 539, 579–582. [DOI] [PubMed] [Google Scholar]
- Cooper CE (1990). The steady-state kinetics of cytochrome c oxidation by cytochrome oxidase. Biochim. Biophys. Acta 1017, 187–203. [DOI] [PubMed] [Google Scholar]
- Divakaruni AS, Rogers GW, and Murphy AN (2014). Measuring Mitochondrial Function in Permeabilized Cells Using the Seahorse XF Analyzer or a Clark-Type Oxygen Electrode. Curr. Protoc. Toxicol 60, 25.2.1–25.2.16. [DOI] [PubMed] [Google Scholar]
- Enríquez JA (2016). Supramolecular Organization of Respiratory Complexes. Annu. Rev. Physiol 78, 533–561. [DOI] [PubMed] [Google Scholar]
- Fan J, Kamphorst JJ, Mathew R, Chung MK, White E, Shlomi T, and Rabinowitz JD (2013). Glutamine-driven oxidative phosphorylation is a major ATP source in transformed mammalian cells in both normoxia and hypoxia. Mol. Syst. Biol 9, 712. [DOI] [PMC free article] [PubMed] [Google Scholar]
- Fendt SM, Bell EL, Keibler MA, Olenchock BA, Mayers JR, Wasylenko TM, Vokes NI, Guarente L, Vander Heiden MG, and Stephanopoulos G (2013). Reductive glutamine metabolism is a function of the a-ketoglutarate to citrate ratio in cells. Nat. Commun 4, 2236. [DOI] [PMC free article] [PubMed] [Google Scholar]
- Fernandez CA, Des Rosiers C, Previs SF, David F, and Brunengraber H (1996). Correction of 13C mass isotopomer distributions for natural stable isotope abundance. J. Mass Spectrom 31, 255–262. [DOI] [PubMed] [Google Scholar]
- Filipp FV, Scott DA, Ronai ZA, Osterman AL, and Smith JW (2012). Reverse TCA cycle flux through isocitrate dehydrogenases 1 and 2 is required for lipogenesis in hypoxic melanoma cells. Pigment Cell Melanoma Res. 25, 375–383. [DOI] [PMC free article] [PubMed] [Google Scholar]
- Frezza C, Zheng L, Tennant DA, Papkovsky DB, Hedley BA, Kalna G, Watson DG, and Gottlieb E (2011). Metabolic profiling of hypoxic cells revealed a catabolic signature required for cell survival. PLoS ONE 6, e24411. [DOI] [PMC free article] [PubMed] [Google Scholar]
- Fuhrmann DC, and Brüne B (2017). Mitochondrial composition and function under the control of hypoxia. Redox Biol. 12, 208–215. [DOI] [PMC free article] [PubMed] [Google Scholar]
- Fukuda R, Zhang H, Kim JW, Shimoda L, Dang CV, and Semenza GL (2007). HIF-1 regulates cytochrome oxidase subunits to optimize efficiency of respiration in hypoxic cells. Cell 129, 111–122. [DOI] [PubMed] [Google Scholar]
- Garcia-Bermudez J, Baudrier L, La K, Zhu XG, Fidelin J, Sviderskiy VO, Papagiannakopoulos T, Molina H, Snuderl M, Lewis CA, et al. (2018). Aspartate is a limiting metabolite for cancer cell proliferation under hypoxia and in tumours. Nat. Cell Biol 20, 775–781. [DOI] [PMC free article] [PubMed] [Google Scholar]
- Gaude E, Schmidt C, Gammage PA, Dugourd A, Blacker T, Chew SP, Saez-Rodriguez J, O’Neill JS, Szabadkai G, Minczuk M, et al. (2018). NADH Shuttling Couples Cytosolic Reductive Carboxylation of Glutamine with Glycolysis in Cells with Mitochondrial Dysfunction. Mol. Cell 69, 581–593. [DOI] [PMC free article] [PubMed] [Google Scholar]
- Gerling M, Zhao Y, Nania S, Norberg KJ, Verbeke CS, Englert B, Kuiper RV, Bergström A, Hassan M, Neesse A, et al. (2014). Real-time assessment of tissue hypoxia in vivo with combined photoacoustics and high-frequency ultrasound. Theranostics 4, 604–613. [DOI] [PMC free article] [PubMed] [Google Scholar]
- Gnaiger E, Lassnig B, Kuznetsov A, Rieger G, and Margreiter R (1998). Mitochondrial oxygen affinity, respiratory flux control and excess capacity of cytochrome c oxidase. J. Exp. Biol 201, 1129–1139. [DOI] [PubMed] [Google Scholar]
- Grassian AR, Parker SJ, Davidson SM, Divakaruni AS, Green CR, Zhang X, Slocum KL, Pu M, Lin F, Vickers C, et al. (2014). IDH1 mutations alter citric acid cycle metabolism and increase dependence on oxidative mitochondrial metabolism. Cancer Res. 74, 3317–3331. [DOI] [PMC free article] [PubMed] [Google Scholar]
- Humpton TJ, Alagesan B, DeNicola GM, Lu D, Yordanov GN, Leon-hardt CS, Yao MA, Alagesan P, Zaatari MN, Park Y, et al. (2019). Oncogenic KRAS Induces NIX-Mediated Mitophagy to Promote Pancreatic Cancer. Cancer Discov. 9, 1268–1287. [DOI] [PMC free article] [PubMed] [Google Scholar]
- Huttlin EL, Jedrychowski MP, Elias JE, Goswami T, Rad R, Beausoleil SA, Villén J, Haas W, Sowa ME, and Gygi SP (2010). A tissue-specific atlas of mouse protein phosphorylation and expression. Cell 143, 1174–1189. [DOI] [PMC free article] [PubMed] [Google Scholar]
- Ikeda K, Horie-Inoue K, Suzuki T, Hobo R, Nakasato N, Takeda S, and Inoue S (2019). Mitochondrial supercomplex assembly promotes breast and endometrial tumorigenesis by metabolic alterations and enhanced hypoxia tolerance. Nat. Commun 10, 4108. [DOI] [PMC free article] [PubMed] [Google Scholar]
- Ikuma H, Schindler FJ, and Bonner WD (1964). Kinetic Analysis of Oxidases in Tightly Coupled Plant Mitochondria. Plant Physiol. 39, R60. [Google Scholar]
- Jha P, Wang X, and Auwerx J (2016). Analysis of Mitochondrial Respiratory Chain Supercomplexes Using Blue Native Polyacrylamide Gel Electrophoresis (BN-PAGE). Curr. Protoc. Mouse Biol 6, 1–14. [DOI] [PMC free article] [PubMed] [Google Scholar]
- Kay CJ, and Palmer JM (1985). Solubilization of the alternative oxidase of cuckoo-pint (Arum maculatum) mitochondria. Stimulation by high concentrations of ions and effects of specific inhibitors. Biochem. J 228, 309–318. [DOI] [PMC free article] [PubMed] [Google Scholar]
- Kim JW, Tchernyshyov I, Semenza GL, and Dang CV (2006). HIF-1-mediated expression of pyruvate dehydrogenase kinase: a metabolic switch required for cellular adaptation to hypoxia. Cell Metab. 3, 177–185. [DOI] [PubMed] [Google Scholar]
- King MP, and Attardi G (1989). Human cells lacking mtDNA: repopulation with exogenous mitochondria by complementation. Science 246, 500–503. [DOI] [PubMed] [Google Scholar]
- King MP, and Attardi G (1996). Isolation of human cell lines lacking mitochondrial DNA. Methods Enzymol. 264, 304–313. [DOI] [PubMed] [Google Scholar]
- Koong AC, Mehta VK, Le QT, Fisher GA, Terris DJ, Brown JM, Bastidas AJ, and Vierra M (2000). Pancreatic tumors show high levels of hypoxia. Int. J. Radiat. Oncol. Biol. Phys 48, 919–922. [DOI] [PubMed] [Google Scholar]
- Lewis CA, Parker SJ, Fiske BP, McCloskey D, Gui DY, Green CR, Vokes NI, Feist AM, Vander Heiden MG, and Metallo CM (2014). Tracing compartmentalized NADPH metabolism in the cytosol and mitochondria of mammalian cells. Mol. Cell 55, 253–263. [DOI] [PMC free article] [PubMed] [Google Scholar]
- Lussey-Lepoutre C, Hollinshead KER, Ludwig C, Menara M, Morin A, Castro-Vega LJ, Parker SJ, Janin M, Martinelli C, Ottolenghi C, et al. (2015). Loss of succinate dehydrogenase activity results in dependency on pyruvate carboxylation for cellular anabolism. Nat. Commun 6, 8784. [DOI] [PMC free article] [PubMed] [Google Scholar]
- Martínez-Reyes I, Diebold LP, Kong H, Schieber M, Huang H, Hensley CT, Mehta MM, Wang T, Santos JH, Woychik R, et al. (2016). TCA Cycle and Mitochondrial Membrane Potential Are Necessary for Diverse Biological Functions. Mol. Cell 61, 199–209. [DOI] [PMC free article] [PubMed] [Google Scholar]
- Maxwell DP, Wang Y, and McIntosh L (1999). The alternative oxidase lowers mitochondrial reactive oxygen production in plant cells. Proc. Natl. Acad. Sci. USA 96, 8271–8276. [DOI] [PMC free article] [PubMed] [Google Scholar]
- Mayevsky A (1984). Brain NADH redox state monitored in vivo by fiber optic surface fluorometry. Brain Res 319, 49–68. [DOI] [PubMed] [Google Scholar]
- Mazure NM, and Pouysségur J (2010). Hypoxia-induced autophagy: cell death or cell survival? Curr. Opin. Cell Biol 22, 177–180. [DOI] [PubMed] [Google Scholar]
- McAlister GC, Nusinow DP, Jedrychowski MP, Wühr M, Huttlin EL, Erickson BK, Rad R, Haas W, and Gygi SP (2014). MultiNotch MS3 enables accurate, sensitive, and multiplexed detection of differential expression across cancer cell line proteomes. Anal. Chem 86, 7150–7158. [DOI] [PMC free article] [PubMed] [Google Scholar]
- Meléndez-Rodríguez F, Urrutia AA, Lorendeau D, Rinaldi G, Roche O, Böğürcü-Seidel N, Ortega Muelas M, Mesa-Ciller C, Turiel G, Bouthelier A, et al. (2019). HIF1α Suppresses Tumor Cell Proliferation through Inhibition of Aspartate Biosynthesis. Cell Rep. 26, 2257–2265.e4. [DOI] [PubMed] [Google Scholar]
- Metallo CM, Gameiro PA, Bell EL, Mattaini KR, Yang J, Hiller K, Jewell CM, Johnson ZR, Irvine DJ, Guarente L, et al. (2011). Reductive glutamine metabolism by IDH1 mediates lipogenesis under hypoxia. Nature 481, 380–384. [DOI] [PMC free article] [PubMed] [Google Scholar]
- Millar AH, Bergersen FJ, and Day DA (1994). Oxygen-Affinity of Terminal Oxidases in Soybean Mitochondria. Plant Physiol. Biochem 32, 847–852. [Google Scholar]
- Morgenstern JP, and Land H (1990). Advanced mammalian gene transfer: high titre retroviral vectors with multiple drug selection markers and a complementary helper-free packaging cell line. Nucleic Acids Res. 18, 3587–3596. [DOI] [PMC free article] [PubMed] [Google Scholar]
- Mullen AR, Wheaton WW, Jin ES, Chen PH, Sullivan LB, Cheng T, Yang Y, Linehan WM, Chandel NS, and DeBerardinis RJ (2011). Reductive carboxylation supports growth in tumour cells with defective mitochondria. Nature 481, 385–388. [DOI] [PMC free article] [PubMed] [Google Scholar]
- Nicholls DG, and Ward MW (2000). Mitochondrial membrane potential and neuronal glutamate excitotoxicity: mortality and millivolts. Trends Neurosci. 23, 166–174. [DOI] [PubMed] [Google Scholar]
- Olive KP, Jacobetz MA, Davidson CJ, Gopinathan A, McIntyre D, Honess D, Madhu B, Goldgraben MA, Caldwell ME, Allard D, et al. (2009). Inhibition of Hedgehog signaling enhances delivery of chemotherapy in a mouse model of pancreatic cancer. Science 324, 1457–1461. [DOI] [PMC free article] [PubMed] [Google Scholar]
- Paulo JA, Gaun A, and Gygi SP (2015). Global Analysis of Protein Expression and Phosphorylation Levels in Nicotine-Treated Pancreatic Stellate Cells. J. Proteome Res 14, 4246–4256. [DOI] [PMC free article] [PubMed] [Google Scholar]
- Paulo JA, Mancias JD, and Gygi SP (2017). Proteome-Wide Protein Expression Profiling Across Five Pancreatic Cell Lines. Pancreas 46, 690–698. [DOI] [PMC free article] [PubMed] [Google Scholar]
- Perez-Riverol Y, Csordas A, Bai J, Bernal-Llinares M, Hewapathirana S, Kundu DJ, Inuganti A, Griss J, Mayer G, Eisenacher M, et al. (2019). The PRIDE database and related tools and resources in 2019: improving support for quantification data. Nucleic Acids Res. 47 (D1), D442–D450. [DOI] [PMC free article] [PubMed] [Google Scholar]
- Perry SW, Norman JP, Barbieri J, Brown EB, and Gelbard HA (2011). Mitochondrial membrane potential probes and the proton gradient: a practical usage guide. Biotechniques 50, 98–115. [DOI] [PMC free article] [PubMed] [Google Scholar]
- Semenza GL (2007). Hypoxia-inducible factor 1 (HIF-1) pathway. Sci. STKE 2007, cm8. [DOI] [PubMed] [Google Scholar]
- Semenza GL (2010). HIF-1: upstream and downstream of cancer metabolism. Curr. Opin. Genet. Dev 20, 51–56. [DOI] [PMC free article] [PubMed] [Google Scholar]
- Son J, Lyssiotis CA, Ying H, Wang X, Hua S, Ligorio M, Perera RM, Ferrone CR, Mullarky E, Shyh-Chang N, et al. (2013). Glutamine supports pancreatic cancer growth through a KRAS-regulated metabolic pathway. Nature 496, 101–105. [DOI] [PMC free article] [PubMed] [Google Scholar]
- Sood A, Jeyaraju DV, Prudent J, Caron A, Lemieux P, McBride HM, Laplante M, Tóth K, and Pellegrini L (2014). A Mitofusin-2-dependent inactivating cleavage of Opa1 links changes in mitochondria cristae and ER contacts in the postprandial liver. Proc. Natl. Acad. Sci. USA 111, 16017–16022. [DOI] [PMC free article] [PubMed] [Google Scholar]
- Sullivan LB, Gui DY, Hosios AM, Bush LN, Freinkman E, and Vander Heiden MG (2015). Supporting Aspartate Biosynthesis Is an Essential Function of Respiration in Proliferating Cells. Cell 162, 552–563. [DOI] [PMC free article] [PubMed] [Google Scholar]
- Sullivan LB, Luengo A, Danai LV, Bush LN, Diehl FF, Hosios AM, Lau AN, Elmiligy S, Malstrom S, Lewis CA, and Vander Heiden MG (2018). Aspartate is an endogenous metabolic limitation for tumour growth. Nat. Cell Biol 20, 782–788. [DOI] [PMC free article] [PubMed] [Google Scholar]
- Tennant DA, Durán RV, and Gottlieb E (2010). Targeting metabolic transformation for cancer therapy. Nat. Rev. Cancer 10, 267–277. [DOI] [PubMed] [Google Scholar]
- Vaupel P, and Mayer A (2007). Hypoxia in cancer: significance and impact on clinical outcome. Cancer Metastasis Rev. 26, 225–239. [DOI] [PubMed] [Google Scholar]
- Vaupel P, Mayer A, and Höckel M (2004). Tumor hypoxia and malignant progression. Methods Enzymol. 381, 335–354. [DOI] [PubMed] [Google Scholar]
- Wagner BA, Venkataraman S, and Buettner GR (2011). The rate of oxygen utilization by cells. Free Radic. Biol. Med 51, 700–712. [DOI] [PMC free article] [PubMed] [Google Scholar]
- Weinberg F, Hamanaka R, Wheaton WW, Weinberg S, Joseph J, Lopez M, Kalyanaraman B, Mutlu GM, Budinger GRS, and Chandel NS (2010). Mitochondrial metabolism and ROS generation are essential for Kras-mediated tumorigenicity. Proc. Natl. Acad. Sci. USA 107, 8788–8793. [DOI] [PMC free article] [PubMed] [Google Scholar]
- Wilson DF, Rumsey WL, Green TJ, and Vanderkooi JM (1988). The oxygen dependence of mitochondrial oxidative phosphorylation measured by a new optical method for measuring oxygen concentration. J. Biol. Chem 263, 2712–2718. [PubMed] [Google Scholar]
- Wise DR, Ward PS, Shay JE, Cross JR, Gruber JJ, Sachdeva UM, Platt JM, DeMatteo RG, Simon MC, and Thompson CB (2011). Hypoxia promotes isocitrate dehydrogenase-dependent carboxylation of α-ketoglutarate to citrate to support cell growth and viability. Proc. Natl. Acad. Sci. USA 108, 19611–19616. [DOI] [PMC free article] [PubMed] [Google Scholar]
- Yu B, Shah A, Wang B, Rajaram N, Wang Q, Ramanujam N, Palmer GM, and Dewhirst MW (2014). Measuring tumor cycling hypoxia and angio-genesis using a side-firing fiber optic probe. J. Biophotonics 7, 552–564. [DOI] [PMC free article] [PubMed] [Google Scholar]
- Yuan J, Bennett BD, and Rabinowitz JD (2008). Kinetic flux profiling for quantitation of cellular metabolic fluxes. Nat. Protoc 3, 1328–1340. [DOI] [PMC free article] [PubMed] [Google Scholar]
Associated Data
This section collects any data citations, data availability statements, or supplementary materials included in this article.
Supplementary Materials
Data Availability Statement
The mass spectrometry proteomics dataset generated during this study has been deposited to the ProteomeXchange Consortium via the PRIDE partner repository with the dataset identifier PXD020990 (Perez-Riverol et al., 2019).