

This genome-wide association study identifies additional Alzheimer disease risk loci in African American individuals using the African Genome Resource panel.
Key Points
Question
What genetic variants, genes, and pathways increase or decrease risk of Alzheimer disease in African American individuals?
Findings
In this genome-wide association meta-analysis of 2748 individuals with Alzheimer disease and 5222 controls, several novel genetic loci and pathways associated with Alzheimer disease in African American individuals were identified.
Meaning
While the major pathways involved in Alzheimer disease etiology in African American individuals are largely similar to those in non-Hispanic White individuals, many of the disease-associated loci within these pathways differ.
Abstract
Importance
Compared with non-Hispanic White individuals, African American individuals from the same community are approximately twice as likely to develop Alzheimer disease. Despite this disparity, the largest Alzheimer disease genome-wide association studies to date have been conducted in non-Hispanic White individuals. In the largest association analyses of Alzheimer disease in African American individuals, ABCA7, TREM2, and an intergenic locus at 5q35 were previously implicated.
Objective
To identify additional risk loci in African American individuals by increasing the sample size and using the African Genome Resource panel.
Design, Setting, and Participants
This genome-wide association meta-analysis used case-control and family-based data sets from the Alzheimer Disease Genetics Consortium. There were multiple recruitment sites throughout the United States that included individuals with Alzheimer disease and controls of African American ancestry. Analysis began October 2018 and ended September 2019.
Main Outcomes and Measures
Diagnosis of Alzheimer disease.
Results
A total of 2784 individuals with Alzheimer disease (1944 female [69.8%]) and 5222 controls (3743 female [71.7%]) were analyzed (mean [SD] age at last evaluation, 74.2 [13.6] years). Associations with 4 novel common loci centered near the intracellular glycoprotein trafficking gene EDEM1 (3p26; P = 8.9 × 10⁻⁷), near the immune response gene ALCAM (3q13; P = 9.3 × 10⁻⁷), within GPC6 (13q31; P = 4.1 × 10⁻⁷), a gene critical for recruitment of glutamatergic receptors to the neuronal membrane, and within VRK3 (19q13.33; P = 3.5 × 10⁻⁷), a gene involved in glutamate neurotoxicity, were identified. In addition, several loci associated with rare variants, including a genome-wide significant intergenic locus near IGF1R at 15q26 (P = 1.7 × 10⁻⁹) and 6 additional loci with suggestive significance (P ≤ 5 × 10⁻⁷) such as API5 at 11p12 (P = 8.8 × 10⁻⁸) and RBFOX1 at 16p13 (P = 5.4 × 10⁻⁷) were identified. Gene expression data from brain tissue demonstrate association of ALCAM, ARAP1, GPC6, and RBFOX1 with brain β-amyloid load. Of 25 known loci associated with Alzheimer disease in non-Hispanic White individuals, only APOE, ABCA7, TREM2, BIN1, CD2AP, FERMT2, and WWOX were implicated at a nominal significance level or stronger in African American individuals. Pathway analyses strongly support the notion that immunity, lipid processing, and intracellular trafficking pathways underlying Alzheimer disease in African American individuals overlap with those observed in non-Hispanic White individuals. A new pathway emerging from these analyses is the kidney system, suggesting a novel mechanism for Alzheimer disease that needs further exploration.
Conclusions and Relevance
While the major pathways involved in Alzheimer disease etiology in African American individuals are similar to those in non-Hispanic White individuals, the disease-associated loci within these pathways differ.
Introduction
Large-scale genomic studies identified more than 20 modest-effect Alzheimer disease (AD) risk loci besides the APOE gene.1,2,3,4,5,6,7,8 However, these studies were predominantly conducted in individuals of non-Hispanic White ancestry and, taken together, the identified loci explain only 30% to 40% of the genetic contribution to AD,9,10 substantially less than the heritability estimates from twin studies ranging from 60% to 80%.11 Compared with non-Hispanic White individuals, African American individuals from the same community are twice as likely to develop AD.12 Supporting the notion that there are many genetic loci with small effect sizes contributing to these observed ancestral differences in disease risk, we recently demonstrated that AD cases in African American individuals show higher levels of African ancestry than unaffected individuals, both globally and locally at AD-relevant loci.13
Various additional observations provide support for the genetic architecture of AD being partially ancestry-specific. In the largest genome-wide association study conducted to date and to our knowledge in African American individuals comprising 5896 participants from the Alzheimer Disease Genetics Consortium, we previously confirmed ABCA7 and APOE, notably with substantial differences in odds ratios compared with non-Hispanic White individuals, and identified a novel intergenic locus at 5q35.14 Of the additional common loci originally discovered in data sets of non-Hispanic White individuals, only a subset (CR1, BIN1, EPHA1, CD33, TREM2) replicated with nominal significance.14,15 Importantly, the population differences in the effect of APOE ɛ4 appear to be explained by the ancestral background on which the allele lies, as we have recently shown that APOE ɛ4 alleles on an African background confer lower risk than those on a non-Hispanic White background.16 Population-specific associations with AD in rare or low-frequency variants also have been identified. Several rare risk variants found in non-Hispanic White individuals do not show association with risk in African American individuals, possibly because they are extremely rare in African American individuals.15,17 In a recent targeted sequencing study of ABCA7, we identified a novel 44 base pair frameshift deletion (rs142076058) in ABCA7 in the same linkage disequilibrium block as the African American individuals’ variant (rs115550680) identified by our previous genome-wide association study (GWAS)18 that is common and associated with disease in African American individuals but present in very few non-Hispanic White individuals (minor allele frequency [MAF] = 0.12%). Two additional missense variants in ABCA7 have been associated with AD in a separate African American population.19 Finally, separate association studies of AD in African American individuals identified novel rare and low-frequency associations in AKAP9,20 COBL, and SLC10A221 that appear specific to African American individuals. Neuropathologic differences in AD between populations22,23,24,25,26 may also point toward population-specific risk loci for AD. The aim of the present analyses is to identify additional loci modulating risk in African American individuals.
Methods
To identify additional AD risk loci in African American individuals, we conducted a GWAS meta-analysis with a 37% increased sample size including individuals with AD and controls recruited from several case-control and family-based studies of African American individuals. A detailed description of the original cohorts and summary demographics of all samples included in this analysis are provided in the eAppendix and eTables 1-3 in Supplement 1. Written informed consent was obtained from all participants, and all study protocols were approved by the respective institutional review boards. Imputation was performed with the African Genome Resources panel,27 which contains all African and non-African populations from 1000 Genomes phase 3 and more than 2000 individuals from various African regions, providing better coverage of ancestral haplotypes than the 1000 Genomes–based reference panels used in previous studies. In line with this notion, comparison of imputation quality of 1000 Genomes and African Genome Resources vs available whole-exome sequencing data in 800 participants demonstrated higher accuracy in the African Genome Resources (eTable 2 in Supplement 1). The final single-nucleotide variant set for analysis included 29 610 185 genotyped and imputed variants, more than doubling the number of variants from our previous analysis.14 Genotype dosages were analyzed within each data set and subsequently meta-analyzed, adjusting for age, sex, and PCs for population substructure (model 1), and subsequently in addition for APOE genotype (model 2). Additional details on these analyses and the methods for gene, pathway, and expression association analyses can be found in the eMethods in Supplement 1. P values were 2-sided, and the standard GWAS threshold of 5 × 10⁻⁸ was used to define genome-wide significance. Analysis started October 2018 and ended September 2019.
Results
A total of 2784 individuals (1944 female [69.8%]) with AD and 5222 (3743 female [71.7%]) were analyzed (mean [SD] age at last evaluation, 74.2 [13.6] years). Single-variant meta-analyses replicated the APOE locus and both African American individuals’ risk loci (rs115550680 [ABCA7] and rs145848414 [5q35]) from our previous analyses at P < 5 × 10⁻⁶ (Table 1 and Figure).14 In addition, single-marker meta-analyses yielded 1 novel genome-wide significant (P ≤ 5 × 10⁻⁸) disease locus associated with rare variants and 10 novel disease-associated loci (4 common variant loci, 6 rare variant loci) associated at P ≤ 5 × 10⁻⁷ (Table 1; eFigures 1-2 in Supplement 1). There was no evidence for genomic inflation (model 1: λ = 0.94; model 2: λ = 0.96); see eFigure 3 in Supplement 1 for QQ plots). The 4 common loci were centered at (1) EDEM1 on chromosome 3p26 (rs168193; MAF = 0.25; P = 8.9 × 10⁻⁷), a known linkage region for AD,28 (2) ALCAM on chromosome 3q13 (rs2633682; MAF = 0.33; P = 9.3 × 10⁻⁷), (3) within GPC6 on chromosome 13q31 (rs9516245; MAF = 0.04; P = 4.1 × 10⁻⁷), and (4) within VRK3 on chromosome 19q13.33 (rs3745495; MAF = 0.10; P = 3.5 × 10⁻⁷). Three of 4 loci have strong regional support by variants in linkage disequilibrium (eFigure 1A in Supplement 1), and all 4 have consistent directions of effect across most individual data sets (eFigure 2A in Supplement 1). While VRK3 is located approximately 5 megabases downstream of APOE, the APOE-adjusted model and analyses showing that rs3745495 is not in linkage disequilibrium with variants within APOE (eFigure 4 in Supplement 1) suggest that it represents an independent AD-associated signal in African American individuals. The identified rare variants include a genome-wide significant intergenic locus at 15q26 close to ARRDC4 and IGF1R (rs570487962; MAF = 0.01; P = 1.69 × 10⁻⁹) and 6 loci with associations of P < 5 × 10⁻⁷ close to SIPA1L2, WDR70, API5, ACER3, PIK3C2G, and RBFOX1 (Table 1 and eFigures 1 and 2 in Supplement 1). Repeating the analyses stratified by APOEe4 carrier status revealed the association with RBFOX1 was only present in cases without an APOEe4 allele, while the intergenic association at ARRDC4/IGF1R was only found in carriers of the APOEe4 allele (eTables 4-5 in Supplement 1). These results should be interpreted with caution because of the small sample sizes obtained after stratification on APOEe4 status (eTable 5 in Supplement 1).
Table 1. Results of SV Meta-analysis.
| Closest gene(s) | Marker | dbSNP | Major/minimum allele | MAF | Model 1a | Model 2b | NHW P valuec | |||||||
|---|---|---|---|---|---|---|---|---|---|---|---|---|---|---|
| OR (95% CI) | P value | Directiond | P value for I2, % | OR (95% CI) | P value | Directiond | P value for I2, % | SV | Gene | |||||
| Novel common loci | ||||||||||||||
| EDEM1 | 3:5302077 | rs168193 | A/G | 0.25 | 0.79 (0.72-0.87) | 8.9 × 10⁻⁷ | −−−−−−+−−−−−+− | 0.50 | 0.81 (0.74-0.90) | 9.0 × 10⁻⁵ | −−−−−−+−−+−−+− | .48 | .47 | .90 |
| ALCAM | 3:104409208 | rs2633682 | C/A | 0.33 | 0.78 (0.71-0.86) | 9.3 × 10⁻⁷ | −−−−?−−−−−−−−− | 0.86 | 0.85 (0.78-0.92) | 2.0 × 10⁻⁴ | −−−−−−−−−−−−−− | .78 | .61 | .64 |
| GPC6 | 13:94159800 | rs9516245 | T/C | 0.04 | 1.61 (1.32-1.96) | 2.5 × 10⁻⁶ | ++++++++++++++ | 0.22 | 1.73 (1.39-2.15) | 4.0 × 10⁻⁷ | ++++++++++++++ | .15 | .94 | .04 |
| VRK3 | 19:50524332 | rs3745495 | A/G | 0.10 | 1.32 (1.17-1.48) | 7.4 × 10⁻⁶ | −+−−−−+−−−+−+− | 0.21 | 1.39 (1.23-1.56) | 3.5 × 10⁻⁷ | −+−−−−+−−−−−+− | .09 | .37 | .31 |
| Novel rare loci | ||||||||||||||
| SIPA1L2 | 1:232376163e | rs115684722 | A/T | 0.01 | 12.6 (4.66-34.45) | 6.3 × 10⁻⁷ | ?+++?+?+++???+ | 0.70 | 3.70 (1.59-8.60) | 2.4 × 10⁻³ | ??+++??+++???+ | .35 | .29 | .32 |
| WDR70 | 5:37483940 | rs184179037 | C/T | 0.006 | 5.00 (2.27-9.18) | 1.8 × 10⁻⁷ | +++?++?+++???? | 0.64 | 5.41 (2.78-10.55) | 4.6 × 10⁻⁷ | +++?++?+++???? | .38 | .05 | .18 |
| API5 | 11:43166842e | rs569584007 | T/G | 0.01 | 3.06 (1.26-7.40) | .013 | ????+??+++?+?+ | 0.92 | 10.48 (4.42-24.83) | 8.8 × 10⁻⁸ | ????+??+++?+?+ | .07 | NP | .98 |
| ACER3 | 11:76541840e | rs115816806 | A/G | 0.01 | 4.71 (2.15-10.31) | 1.0 × 10⁻⁴ | ?−+−?++?+?????+ | 0.42 | 6.55 (3.17-13.53) | 5.1 × 10⁻⁷ | ?−+?++?++????+ | .15 | NP | .28 |
| PIK3C2G | 12:18471546 | rs75739461 | G/A | 0.01 | 2.45 (1.59-3.78) | 3.0 × 10⁻⁵ | +++?++−+++???+ | 0.94 | 3.03 (1.93-4.76) | 9.9 × 10⁻⁷ | −++?++−+++???+ | .88 | NP | .03 |
| ARRDC4 | 15:97992685e | rs570487962 | NA | 0.01 | 0.20 (0.10-0.37) | 6.4 × 10⁻⁷ | ??−?−+?−+??−?? | 0.32 | 0.10 (0.05-0.22) | 1.6 × 10⁻⁹ | ??−?−+?−+??−?? | .10 | NP | 0.25 |
| IGF1R | 0.93 | |||||||||||||
| RBFOX1 | 16:8288401 | rs79537509 | G/T | 0.007 | 3.85 (2.22-6.67) | 1.5 × 10⁻⁶ | −−++++?+++???+ | 0.69 | 4.61 (2.51-8.47) | 5.3 × 10⁻⁷ | −?++++?+++???+ | .67 | .07 | .84 |
| Loci reported in Reitz et al14 | ||||||||||||||
| NSG2 | 5:174014114 | rs145848414 | G/A | 0.03 | 1.78 (1.41-2.25) | 1.5 × 10⁻⁶ | ++++++++++?+++ | 0.94 | 1.06 (0.83-1.34) | 2.6 × 10⁻⁶ | ++++++++++?+++ | .87 | NP | 0.04 |
| MSX2 | 0.66 | |||||||||||||
| ABCA7 | 19:1050420 | rs115550680 | A/G | 0.07 | 1.41 (1.21-1.65) | 3.2 × 10⁻⁵ | +++−++−++++++− | 0.08 | 1.58 (1.32-1.88) | 4.0 × 10⁻⁷ | +++−++−+++++++ | .07 | NP | 1.8 × 10⁻¹² |
| APOE | 19:45423934 | rs157591 | G/A | 0.12 | 1.93 (1.72-2.17) | 1.8 × 10⁻²⁵ | ++++++−+++++++ | 0.20 | 0.94 (0.80-1.10) | .485 | ++−++−−−−−++++ | .37 | NP | 1.4 × 10−154 |
Abbreviations: dbSNP, Single Nucleotide Polymorphism Database; MAF, minor allele frequency; NA, not applicable; NHW, non-Hispanic White; NP, not present; OR, odds ratio; SV, single variant.
Model 1 is adjusted for PCs, age, and sex.
Model 2 is adjusted for PCs, age, sex, and APOE genotype.
P value for NHW individuals’ SV and gene-based tests adjusted for PCs, age, and sex.
Study-specific direction of the single-nucleotide variant β coefficient.
Variant was not assessed in Reitz et al.14
Figure. Association Plots From Single-Variant Meta-analysis.
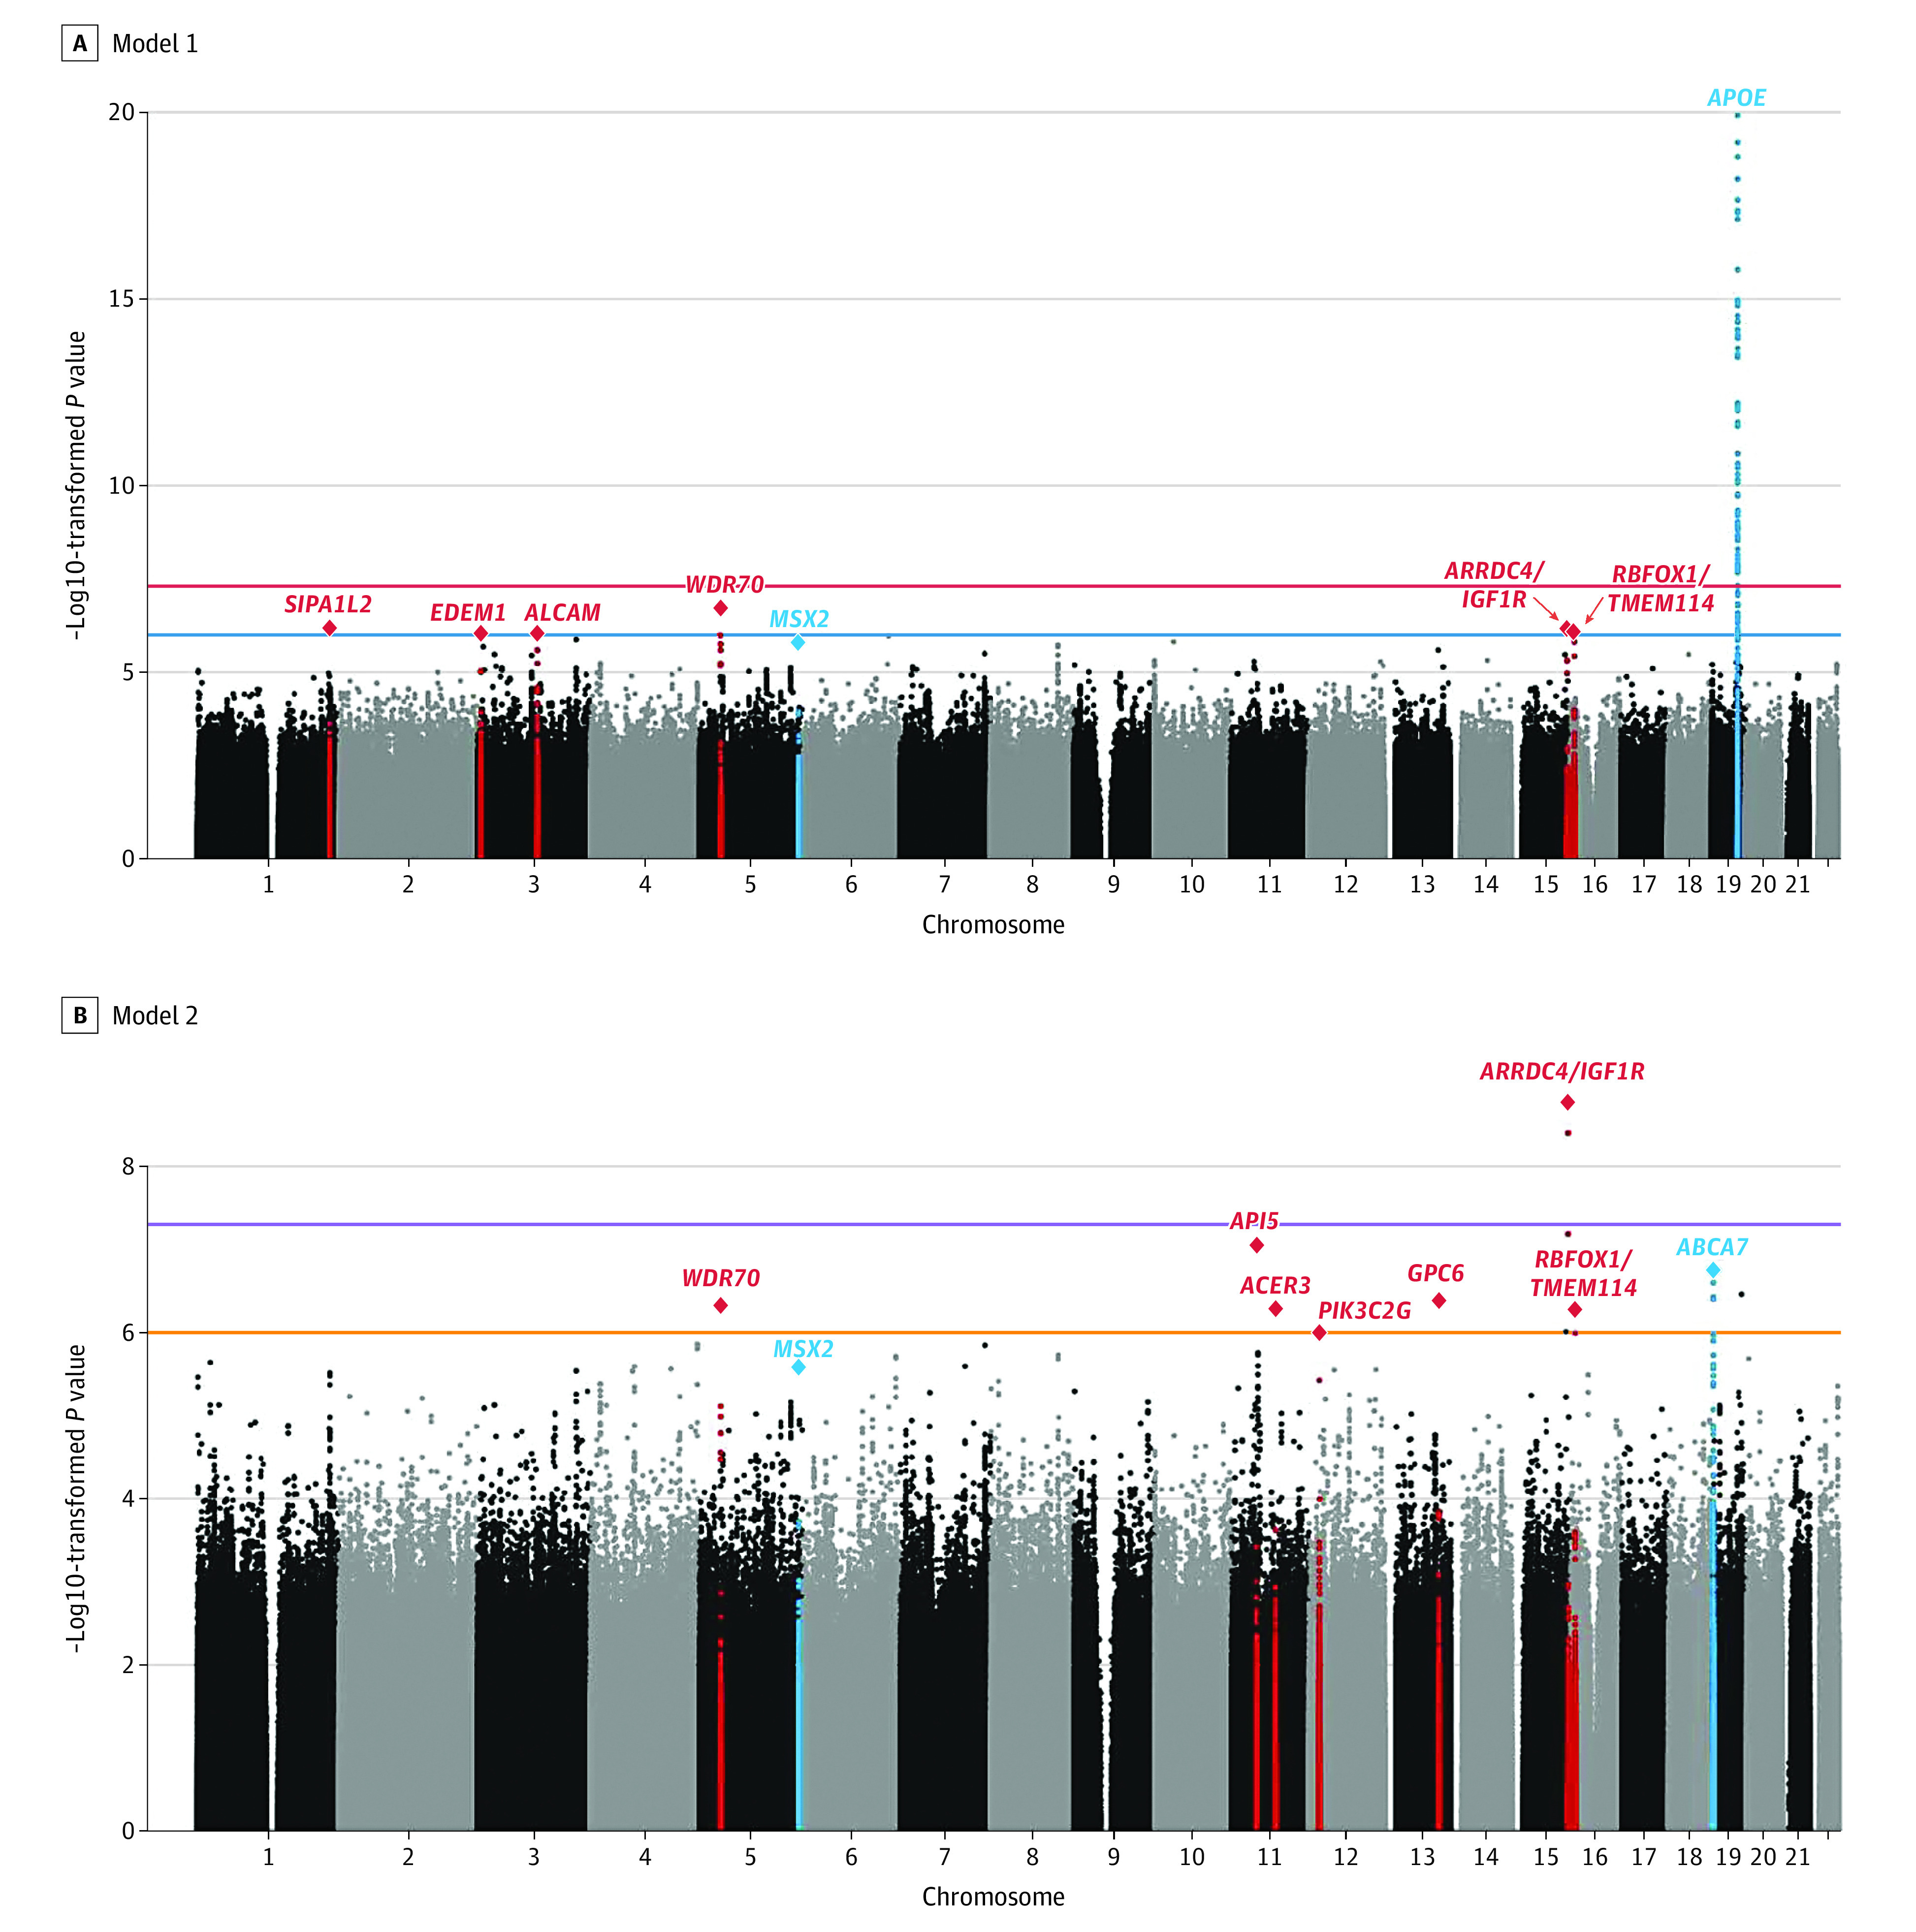
Manhattan plots showing negative log10–transformed P values from the single-variant meta-analysis adjusted for age, sex, and population stratification (A, model 1) and age, sex, population stratification, and APOE (B, model 2). The horizontal lines represent the genome-wide significance threshold (P = 5 × 10⁻⁸; red) and suggestive threshold (P = 1 × 10⁻⁶; orange). Loci are labeled with the closest gene(s) to the sentinel variant. Known loci are in blue and novel loci are in red. The y-axis is truncated, and the lowest P value on chromosome 19 was 1.8 × 10⁻²⁵.
Of the variants previously implicated in AD in African American individuals by other studies,15,17,20,21 rs112404845 in COBL showed association (P = 5.4 × 10⁻⁶), and 2 variants each in TREM2 (rs7748513; P = 3.6 × 10⁻⁵ and rs2234256; P = .001) and AKAP9 (rs149979685; P = .005 and rs914662445; P = .01) were replicated with at P < .05 (eTable 6 in Supplement 1). A low-frequency TREM2 stop-gain variant previously reported at P = .08 in a sample of 906 load cases and 2487 controls, was associated at P = 1.4 × 10⁻³ (rs2234258).17 Of the GWAS loci implicated in non-Hispanic White individuals besides APOE and ABCA7,7 only the variants in BIN1 (P = 9 × 10⁻⁴), CD2AP (P = .02), FERMT2 (P = .01), and WWOX (P = .04) showed nominal association in this African American sample (eTable 6 in Supplement 1).
Gene-Based Analyses
Gene-based analyses confirmed at gene-wide significance the TREM2 gene, originally identified in non-Hispanic White populations,5,29 as an AD risk locus in African American individuals (P = 9.89 × 10⁻⁶) and identified 8 loci (TRANK1, FABP2, LARP1B, TSRM, ARAP1, STARD10, SPHK1, and SERPINB13) with associations of P ≤ 1 × 10⁻⁴ (Table 2 and eFigure 2 in Supplement 1). Of the other risk loci previously reported in African American or non-Hispanic White individuals besides TREM2, only C2DAP (P = .03) was significant at P ≤ .05 (eTable 7 in Supplement 1). Full summary statistics for the complete set of single-marker and gene-based analyses are available through the National Institute on Aging Genetics of Alzheimer Disease Data Storage Site.30
Table 2. Novel Top Loci Identified in Gene-Based Analyses.
| Gene | Chromosome | Start BP (hg37) | Stop BP (hg37) | No. | Model 1a | Model 2b | Pathway | ||||
|---|---|---|---|---|---|---|---|---|---|---|---|
| No. of SNVs | z Statistic | P value | No. of SNVs | z Statistic | P value | ||||||
| TRANK1 | 3 | 36 858 311 | 37 021 548 | 7984 | 1221 | 2.83 | 2.2 × 10⁻³ | 1201 | 3.83 | 6.4 × 10⁻⁵ | Neuronal development |
| FABP2 | 4 | 120 228 405 | 120 278 545 | 7984 | 411 | 2.66 | 3.8 × 10⁻³ | 452 | 4.00 | 3.1 × 10⁻⁵ | Lipid metabolism |
| LARP1B | 4 | 128 947 423 | 129 154 086 | 7984 | 1071 | 4.11 | 1.9 × 10⁻⁵ | 1334 | 1.93 | 2.6 × 10⁻² | RNA transcription |
| TSRM | 7 | 113 056 127 | 113 101 457 | 7984 | 334 | 3.62 | 1.4 × 10⁻⁴ | 334 | 4.02 | 2.7 × 10⁻⁵ | Zinc finger domain-related protein |
| ARAP1 | 11 | 72 386 114 | 72 539 644 | 7984 | 1294 | 3.74 | 9.1 × 10⁻⁵ | 1281 | 3.62 | 1.4 × 10⁻⁴ | Endocytosis/intracellular trafficking |
| STARD10 | 11 | 72 455 774 | 72 539 726 | 7984 | 664 | 3.94 | 3.9 × 10⁻⁵ | 660 | 3.50 | 2.3 × 10⁻⁴ | Lipid metabolism |
| SPHK1 | 17 | 74 337 665 | 74 393 941 | 7984 | 485 | 3.73 | 9.3 × 10⁻⁵ | 482 | 3.48 | 2.5 × 10⁻⁴ | Immune response |
| SERPINB13 | 18 | 61 219 223 | 61 281 873 | 7984 | 633 | 3.10 | 9.4 × 10⁻⁴ | 626 | 3.79 | 7.4 × 10⁻⁵ | Protease inhibition, immune response |
Abbreviations: BP, base pair; SNV, single-nucleotide variant.
Model 1 is adjusted for PCs, age, and sex.
Model 2 is adjusted for PCs, age, sex, and APOE genotype.
Validation and Prioritization of Identified Loci
To validate the identified loci and evaluate their biological significance, we examined differential expression of amyloid and tau pathology in AD vs control brains and conducted pathway analyses.
To explore differential expression, we capitalized on postmortem brain pathology quantified by immunohistochemistry and expression data from 478 individuals of European ancestry from the ROS/MAP study.31 Covarying for sex, age at death (age at last visit for clinical AD diagnosis), postmortem interval, RNA integrity, APOE ε4 status, and first 3 genomic principal components, higher expression of ALCAM (β = 0.038; P = .003) and ARAP1 (β = 0.058; P = 2.0 × 10⁻⁴) and lower expression of GPC6 (β = −0.035; P = .001) and RBFOX1 (β = −0.055; P = .001) were associated with brain amyloid load after correction for multiple testing (Table 3; Bonferroni P value threshold for significance: P = .05/19 tested genes = .003). Higher expression of STARD10 was associated with higher tau pathology burden (β = 0.050; P = 8.46 × 10⁻⁵). When covarying in addition for differences in cell type composition across samples, associations for ALCAM (β = 0.033; P = .004), ARAP1 (β = 0.06; P = 9.3 × 10⁻⁶), GPC6 (β = −0.034; P = .002), and RBFOX1 (β = −0.050; P = .001) with brain amyloid load remained unchanged; association of STARD10 with tau pathology burden was slightly attenuated (β = 0.03; P = .01).
Table 3. Association of Gene Expression at Suggestive Loci With Neuropathological Measures of Alzheimer Disease in the ROS/MAP Data Set31.
| Chromosome | Band | Symbol | Amyloid pathology | Tau pathology | ||
|---|---|---|---|---|---|---|
| βa | P value | βa | P value | |||
| 1 | q42.2 | SIPA1L2 | –0.004 | .72 | –0.018 | .08 |
| 3 | p22.2 | TRANK1 | –0.057 | .005 | –0.046 | .007 |
| 3 | p26.1 | EDEM1 | 0.002 | .84 | –0.022 | .01 |
| 3 | q13.11 | ALCAM | 0.038 | .003 | –0.023 | .03 |
| 4 | q26.2 | FABP2 | Not detected in DLPFC | Not detected in DLPFC | ||
| 4 | q28.2 | LARP1B | –0.017 | .21 | 0.019 | .10 |
| 5 | p13.2 | WDR70 | –0.028 | .05 | 0.036 | .004 |
| 11 | p12 | API5 | 0.009 | .24 | –0.013 | .04 |
| 11 | q13.4 | ARAP1 | 0.058 | 2.0 × 10⁻⁴ | 0.019 | .11 |
| 11 | q13.4 | STARD10 | 0.005 | .71 | 0.050 | 8.46 × 10⁻⁵ |
| 11 | q13.5 | ACER3 | 0.027 | .08 | –0.002 | .91 |
| 12 | p12.3 | PIK3C2G | –0.011 | .09 | –0.001 | .88 |
| 13 | q31.3 | GPC6 | –0.035 | .001 | 0.001 | .91 |
| 15 | q26.2 | ARRDC4 | 0.017 | .32 | –0.023 | .11 |
| 15 | q26.2 | IGF1R | 0.031 | .005 | –0.005 | .61 |
| 16 | p13.3 | RBFOX1 | –0.055 | .001 | 0.008 | .57 |
| 17 | q25.2 | SPHK1 | 0.067 | .01 | 0.015 | .50 |
| 18 | q21.33 | SERPINB13 | Not detected in DLPFC | Not detected in DLPFC | ||
| 19 | q13.33 | VRK3 | –0.001 | .91 | –0.022 | .03 |
Abbreviation: DLPFC, dorsolateral prefrontal cortex.
β Coefficient for the association between the expression of the gene and amyloid or tau pathology is reported. A positive β coefficient reflects an increased pathology burden in the presence of higher gene expression, and a negative β coefficient reflects an inverse association.
Pathway analyses conducted using Multi-marker Analysis of GenoMic Annotation32 identified 8 main functional groups at P < 1 × 10⁻³ (Table 4): (1) intracellular trafficking, (2) lipid and phospholipid metabolism, (3) transcription/DNA repair, (4) nervous system development/synaptic plasticity, (5) cell division, (6) immune response, (7) cellular signaling, and (8) kidney system development. With the exception of kidney system development, these pathways overlap with the key molecular mechanisms identified in the large-scale genomic studies in non-Hispanic White individuals.7,33 However, enrichment of amyloid precursor protein/amyloid (A)-β and tau pathways, which recently emerged as top molecular pathways in the large-scale rare variant meta-analysis in non-Hispanic White individuals conducted by the International Genomics of Alzheimer Project (IGAP),7 are notably absent among the top disease-associated pathways observed in this data set of African American individuals.
Table 4. Top Associated Pathways Derived From MAGMA Pathway Analysis.
| Pathway (GO) | Model | No. of genes | P value | Pathway description |
|---|---|---|---|---|
| GO:0045898 | 2 | 13 | 2.0 × 10⁻⁵ | Transcription |
| GO:0051004 | 1 | 15 | 4.9 × 10⁻⁵ | Lipoprotein metabolism |
| GO:0072017 | 1, 2 | 12 | 1.0 × 10⁻⁴ | Kidney system development |
| GO:0072207 | 1 | 20 | 2.2 × 10⁻⁴ | Kidney system development |
| GO:0033363 | 1 | 27 | 3.4 × 10⁻⁴ | Intracellular trafficking |
| GO:0015693 | 2 | 11 | 3.4 × 10⁻⁴ | Magnesium ion transport |
| GO:0048169 | 1 | 23 | 3.5 × 10⁻⁴ | Synaptic plasticity |
| GO:0051785 | 2 | 62 | 4.3 × 10⁻⁴ | Cell division |
| GO:0009395 | 1 | 29 | 4.6 × 10⁻⁴ | Phospholipid metabolism |
| GO:0006266 | 2 | 16 | 4.7 × 10⁻⁴ | DNA repair |
| GO:0042493 | 2 | 422 | 5.2 × 10⁻⁴ | Drug response |
| GO:0044304 | 2 | 58 | 5.6 × 10⁻⁴ | Nervous system development |
| GO:1903533 | 1 | 296 | 5.7 × 10⁻⁴ | Intracellular trafficking |
| GO:0052743 | 1 | 10 | 6.5 × 10⁻⁴ | ITPKB/Ins(1,3,4,5)P4/ERK signaling |
| GO:0051717 | 1 | 10 | 6.5 × 10⁻⁴ | Cellular signaling |
| GO:1990782 | 1 | 55 | 6.5 × 10⁻⁴ | Cellular signaling |
| GO:0002281 | 2 | 11 | 6.6 × 10⁻⁴ | Immune response |
| GO:0046475 | 1 | 13 | 7.3 × 10⁻⁴ | Phospholipid metabolism |
| GO:0051103 | 2 | 12 | 8.4 × 10⁻⁴ | DNA repair |
| GO:0032386 | 1 | 597 | 8.8 × 10⁻⁴ | Intracellular trafficking |
| GO:0008143 | 2 | 12 | 9.3 × 10⁻⁴ | Transcription |
| GO:0045840 | 1 | 51 | 9.7 × 10⁻⁴ | Cell division |
Abbreviations: ERK, extracellular signal-related kinase; MAGMA, Multi-marker Analysis of GenoMic Annotation.
Examination of Identified Single-Variant, Gene-Based, and Pathway Associations in the IGAP Data Set of Non-Hispanic White Individuals
Comparison of the top single-variant associations in African American individuals with the results of the latest GWAS of non-Hispanic White individuals from the IGAP consortium (n = 94 437)7 revealed nominal replication of the single-variant association in the WDR70 gene (P = .05) and nearly nominal replication of the RBFOX1 locus (P = .07) (eTable 8 in Supplement 1). Gene-based testing of loci resulting from the single-variant analysis of African American individuals revealed PIK3C2G and GPC6 to have significance at P < .05. For the gene-based loci, the only result with nominal replication in IGAP was STARD10 (P = .02), although ARAP1 also approached significance at P < .05. Of the 21 pathways associated at P < 10−4 in African American individuals, only 2 replicated at a nominal level: inositol tetrakisphosphate phosphatase activity (P = .02) and positive regulation of nuclear division (P = .05), suggesting that while the major pathways are similar between African American and non-Hispanic White individuals, the subpathways defining these functions may differ slightly because of the specific genes involved.
Discussion
In the largest AD GWAS study on African American individuals conducted to date and to our knowledge, we confirmed ABCA7, the intergenic locus on chromosome 5q35, and several variants in or near COBL, TREM2, and AKAP9 as associated with AD and identified 1 novel genome-wide significant disease locus and 10 novel disease-associated loci associated at P ≤ 5 × 10⁻⁷. Gene-based analyses also confirmed TREM2 as a risk locus in this population and nominated 8 additional loci with associations of P ≤ 1 × 10⁻⁴. For 4 of these 8 novel loci, gene expression analysis from brain tissue demonstrated significant association with burden of brain amyloid (ALCAM, ARAP1, GPC6, RBFOX1), a key pathological hallmark of AD. Of 25 known loci in non-Hispanic White individuals,7,34 only APOE, ABCA7, TREM2, BIN1, CD2AP, FERMT2, and WWOX were implicated at a nominal significance level or stronger in this African American sample.
Notably, the majority of novel loci identified in this study cluster in pathways was also implicated in non-Hispanic White individuals. The 4 common loci that were, because of their high allele frequencies, robustly present in all contributing data sets, cluster near or in genes involved in intracellular trafficking, immune response, and glutamatergic synaptic transmission. EDEM1, located in a known AD linkage region (3q26),35 encodes a protein that sequesters misfolded proteins, including the amyloid precursor protein, away from productive folding cycles and redirects them to endoplasmic reticulum–associated degradation.36,37,38 There is evidence that upregulation of endoplasmic reticulum–associated degradation leads to amyloid precursor protein degradation and reduced Aβ production.39 ALCAM encodes CD166 antigen promoting T-cell activation, maturation of the immunological synapse, and axon growth. A recent GWAS on cognitive decline in older adults free of dementia identified a suggestive signal in the ALCAM gene region (rs34476301; P = 6.5 × 10⁻⁶) associated with longitudinal changes in the memory domain.40 GPC6 encodes glypican 6 belonging to a conserved family of heparan sulfate proteoglycans. Secreted by astrocytes, GPC6 regulates recruitment of glutamate (GluA1 AMPA) receptors to the neuronal surface and promotes formation of excitatory synapses in neurons.41 The locus at 19q13 shows different local ancestry with regard to AD status in African American individuals,13 providing significant support for the importance of this region in AD etiology in this ethnic group. The signal falls within VRK3 encoding a serine/threonine kinase modulating the activity of extracellular signal-regulated kinases42 involved in the regulation of synaptic protein synthesis, dendritic morphology, and synaptic plasticity.43,44 Dysregulation of glutamate-induced extracellular signal-regulated kinase signaling via VRK3 is associated with Aβ accumulation,45 and VRK3 itself has been suggested as a potential therapeutic target for AD.45 In expression data from the ROS/MAP study,31 ALCAM and GPC6 expression was associated with amount of brain amyloid pathology. Codeposition and association of various heparan sulfate proteoglycans with Aβ has long been described,46,47,48 and in vitro studies have shown that heparan sulfate proteoglycans can regulate Aβ production49,50 and aggregation.49,51
The 7 identified rare variant loci include the 2 top loci identified in this study, centered in a noncoding RNA (LINC02254) near the IGF1R gene on chromosome 15q26 (P = 1.69 × 10⁻⁹) and API5 on chromosome 11p12 (P = 8.81 × 10⁻⁸). The associated variants near IGF1R are all African-specific according to the Genome Aggregation Database.52 Interestingly, a GWAS of cognitive flexibility, an AD-linked phenotype,53 identified a genome-wide significant association approximately 80 kilobases upstream of this rare variant signal in African American individuals but not in non-Hispanic White individuals,54 lending support to this locus as an AD locus specific to African American individuals. IGF1R is a receptor for insulinlike growth factor I (IGF-I) controlling stress resistance, aging, and lifespan.55 Brains of individuals with AD show abnormalities in IGF1R expression and downstream signaling molecules, insulin and IGF1 resistance,56,57 and long-term inhibition of IGF signaling supports neuronal function and neuroprotection.57,58 Lifespan-extending heterozygous IGF1R knockout alleviates AD pathology through Aβ clearance,56 confers neuroprotection against Aβ proteotoxicity, and improves behavior in mice with AD.59,60 In this study, association of IGF1R expression with amyloid load was close to Bonferroni-corrected significance (P = .005). Apoptosis inhibitor-5 (API5) is a nuclear protein highly expressed in the brain whose expression prevents apoptotic cell death.61
While the top disease-associated variant at the chromosome 16p13 locus is located approximately 500 kilobases downstream of RBFOX1, analysis of expression data and findings from epidemiologic, animal, and experimental studies nominate RBFOX1 as a potential candidate gene at this locus that warrants further scrutiny. RBFOX1 is a critical regulator of splicing and cytoplasmic mRNA stability in neurons62,63 that has been implicated across a series of neurodevelopmental and psychiatric disorders.64 There is evidence from experimental studies that downregulation of RBFOX1 leads to destabilization of messenger RNAs encoding for proteins involved in synaptic transmission and diminished synaptic function in AD65,66 and that RBFOX1 might regulate splicing of amyloid precursor protein.67 Notably, a GWAS of positron emission tomography amyloid levels in individuals without dementia reported by Raghavan et al68 nominates RBFOX1 as a locus for brain amyloidosis, in line with this notion and our GWAS and brain amyloid pathology analyses.
Gene-based analyses confirmed TREM2 as an AD risk gene in African American individuals and identified an additional 8 novel loci with associations of P ≤ 1 × 10⁻⁴ (eFigure 5 in Supplement 1). Notably, also these genes largely cluster in AD pathways implicated by genomic studies in non-Hispanic White populations. While TRANK1 at 3p22.2 is a known GWAS risk locus for bipolar disorder and schizophrenia69,70,71,72 and potentially modulates expression of genes involved in neural development and differentiation,73 FABP2 and STARD10 are involved in lipid metabolism, SPHK1 and SERPINB13 in immune response, LARP1B in RNA transcription, and ARAP1 in endocytosis and intracellular trafficking. Finally, the results of our pathway analyses also support the notion that the principal molecular pathways (eg, immunity, lipid processing, intracellular trafficking) underlying AD in African American individuals overlap with those observed in non-Hispanic White individuals, albeit largely with different disease-associated genes within these pathways. A novel AD pathway emerging from this pathway analyses is kidney system development. This finding is particularly interesting given the observation that African American individuals are 3 times more likely to experience kidney failure compared with the non-Hispanic White population,74 and along with Hispanic populations, have a higher rate of comorbidity for dementia and kidney disease.75 Impaired kidney clearance of peripherally circulating Aβ results in elevated cerebral Aβ retention.76 Determining the contribution of this comorbid condition to AD risk, and whether misdiagnosis of AD plays a role in this association,77 could have important implications for the prevention and treatment of AD in African American individuals.
Compared with our previous analyses based on the 1000 Genomes panel (June 2011), the African Genome Resources reference panel used in the current analysis allowed us to include both a higher number of common variants and a significant set of low-frequency variants previously not included. While some of the newly identified common variants were assessed in the previous analyses but now reached genome-wide significance because of increased statistical power, most of the newly identified variants with rarer minor allele frequencies were previously not assessed. For all novel identified disease-associated variants, imputation quality was excellent. There was also no evidence of inflation in our study when including low-frequency variants, minimizing the likelihood that the observed associations are spurious.
Limitations
This study has limitations. First, given the paucity of available African American samples for genomic research on AD and the need to maximize sample size to reach sufficient statistical power to identify variants with low frequency or effect sizes, we combined all samples into 1 discovery set and relied on the IGAP data on non-Hispanic White individuals and ROS/MAP brain expression data sets for replication.7,78 Additional validation will likely need to be derived from experimental studies. Second, while this is the largest GWAS data set on African American individuals to date and to our knowledge, our sample size was underpowered to detect associations with very rare single variants or rare variants exerting very small effects. Consequently, it is possible that there remain unidentified disease-associated variants.
Conclusions
Our study strongly suggests that the principal molecular pathways implicated in AD etiology in African American individuals largely overlap with those in non-Hispanic White individuals but that the disease-associated loci within these pathways differ. These observations are critical for several reasons. First, they provide significant support for the importance of native immune response, intracellular trafficking, lipid metabolism, nervous system development, and synaptic plasticity in AD etiology and suggest that these pathways are not ethnicity-specific but critical in disease etiology across ethnic groups. Second, this study suggests that there might also be pathways whose contributions to disease differ between ethnic groups. While amyloid and tau pathology did not emerge as top pathways in this data set on African American individuals, kidney system development was identified as a novel, plausible disease mechanism. Interestingly, cerebrospinal fluid concentrations of tau have been observed to be lower in African American individuals affected with AD compared with non-Hispanic White individuals with AD.24 Finally, these observations strongly suggest that polygenic risk scores developed for non-Hispanic White populations will likely not be applicable to this ethnic group and vice versa but that polygenic risk scores need to be developed and applied as ethnic group–specific. While additional validation is needed, the identified genomic loci and pathways significantly help to disentangle AD etiology in African American individuals, aid to clarify the molecular mechanisms underlying observed health disparities, and help to pinpoint molecular targets for therapeutic intervention in this ethnic group.
eAppendix. Description of cohorts
eMethods.
eTable 1. Genotyping Platforms used in the individual data sets
eTable 2. Comparison of imputation quality of 1000G Phase 2 and AGR reference vs whole-exome sequencing data in 800 subjects
eTable 3. Demographic characteristics of data sets
eTable 4. APOEe4-stratified results for top loci
eTable 5. Sample sizes for APOEe4-stratified analyses
eTable 6. Single-marker meta-analysis results for previously reported variants
eTable 7. Gene-based results for AD genes previously identified in non-Hispanic Whites or African Americans
eTable 8. Results of top African-American (A) single variant associations, (B) gene-based associations and (C) pathways in the IGAP non-Hispanic white data set
eFigure 1. Regional association plots for the (A) three novel common and (B) seven rare loci identified in single-variant meta-analysis
eFigure 2. Forest Plots of Odds Ratios (ORs) for the (A) three novel common and (B) seven rare loci identified in single-variant meta-analysis
eFigure 3. Quantile-quantile plots for single marker association analyses based (A) on the model adjusted for age, sex and population stratification and (B) age, sex, population stratification and APOE showing the deviation of observed from expected P values
eFigure 4. Linkage disequilibrium analyses between the top associated variant in 19q13.33 (rs3745495) and three variants in APOE: A) The top associated AA variant within APOE (rs147491), and B) The two variants that define the APOE genotype (rs429358 and rs7412). Analyses were done using LDLink
eFigure 5. Manhattan plot of gene-based analysis results. Model 1 (a) is adjusted for age, sex and population stratification; Model 2 (b) is adjusted for age, sex, population stratification and APOE
eReferences.
Nonauthor Collaborators. Alzheimer Disease Genetics Consortium (ADGC) collaborators.
References
- 1.Seshadri S, Fitzpatrick AL, Ikram MA, et al. ; CHARGE Consortium; GERAD1 Consortium; EADI1 Consortium . Genome-wide analysis of genetic loci associated with Alzheimer disease. JAMA. 2010;303(18):1832-1840. doi: 10.1001/jama.2010.574 [DOI] [PMC free article] [PubMed] [Google Scholar]
- 2.Naj AC, Jun G, Beecham GW, et al. Common variants at MS4A4/MS4A6E, CD2AP, CD33 and EPHA1 are associated with late-onset Alzheimer’s disease. Nat Genet. 2011;43(5):436-441. doi: 10.1038/ng.801 [DOI] [PMC free article] [PubMed] [Google Scholar]
- 3.Harold D, Abraham R, Hollingworth P, et al. Genome-wide association study identifies variants at CLU and PICALM associated with Alzheimer’s disease. Nat Genet. 2009;41(10):1088-1093. doi: 10.1038/ng.440 [DOI] [PMC free article] [PubMed] [Google Scholar]
- 4.Hollingworth P, Harold D, Sims R, et al. ; Alzheimer’s Disease Neuroimaging Initiative; CHARGE consortium; EADI1 consortium . Common variants at ABCA7, MS4A6A/MS4A4E, EPHA1, CD33 and CD2AP are associated with Alzheimer’s disease. Nat Genet. 2011;43(5):429-435. doi: 10.1038/ng.803 [DOI] [PMC free article] [PubMed] [Google Scholar]
- 5.Jonsson T, Stefansson H, Steinberg S, et al. Variant of TREM2 associated with the risk of Alzheimer’s disease. N Engl J Med. 2013;368(2):107-116. doi: 10.1056/NEJMoa1211103 [DOI] [PMC free article] [PubMed] [Google Scholar]
- 6.Lambert JC, Heath S, Even G, et al. ; European Alzheimer’s Disease Initiative Investigators . Genome-wide association study identifies variants at CLU and CR1 associated with Alzheimer’s disease. Nat Genet. 2009;41(10):1094-1099. doi: 10.1038/ng.439 [DOI] [PubMed] [Google Scholar]
- 7.Kunkle BW, Grenier-Boley B, Sims R, et al. Genetic meta-analysis of diagnosed Alzheimer's disease identifies new risk loci and implicates Aβ, tau, immunity and lipid processing. Nat Genet. 2019;51(3):414-430. doi: 10.1038/s41588-019-0358-2 [DOI] [PMC free article] [PubMed] [Google Scholar]
- 8.Sims R, van der Lee SJSJ, Naj ACACAC, et al. ; ARUK Consortium; GERAD/PERADES, CHARGE, ADGC, EADI . Rare coding variants in PLCG2, ABI3, and TREM2 implicate microglial-mediated innate immunity in Alzheimer’s disease. Nat Genet. 2017;49(9):1373-1384. doi: 10.1038/ng.3916 [DOI] [PMC free article] [PubMed] [Google Scholar]
- 9.Ridge PG, Mukherjee S, Crane PK, Kauwe JS; Alzheimer’s Disease Genetics Consortium . Alzheimer’s disease: analyzing the missing heritability. PLoS One. 2013;8(11):e79771. doi: 10.1371/journal.pone.0079771 [DOI] [PMC free article] [PubMed] [Google Scholar]
- 10.So HC, Gui AH, Cherny SS, Sham PC. Evaluating the heritability explained by known susceptibility variants: a survey of ten complex diseases. Genet Epidemiol. 2011;35(5):310-317. doi: 10.1002/gepi.20579 [DOI] [PubMed] [Google Scholar]
- 11.Gatz M, Reynolds CA, Fratiglioni L, et al. Role of genes and environments for explaining Alzheimer disease. Arch Gen Psychiatry. 2006;63(2):168-174. doi: 10.1001/archpsyc.63.2.168 [DOI] [PubMed] [Google Scholar]
- 12.Tang M-X, Cross P, Andrews H, et al. Incidence of AD in African-Americans, Caribbean Hispanics, and Caucasians in northern Manhattan. Neurology. 2001;56(1):49-56. doi: 10.1212/WNL.56.1.49 [DOI] [PubMed] [Google Scholar]
- 13.Hohman TJ, Cooke-Bailey JN, Reitz C, et al. ; Alzheimer Disease Genetics Consortium . Global and local ancestry in African-Americans: implications for Alzheimer’s disease risk. Alzheimers Dement. 2016;12(3):233-243. doi: 10.1016/j.jalz.2015.02.012 [DOI] [PMC free article] [PubMed] [Google Scholar]
- 14.Reitz C, Jun G, Naj A, et al. ; Alzheimer Disease Genetics Consortium . Variants in the ATP-binding cassette transporter (ABCA7), apolipoprotein E ϵ4,and the risk of late-onset Alzheimer disease in African Americans. JAMA. 2013;309(14):1483-1492. doi: 10.1001/jama.2013.2973 [DOI] [PMC free article] [PubMed] [Google Scholar]
- 15.Reitz C, Mayeux R; Alzheimer’s Disease Genetics Consortium . TREM2 and neurodegenerative disease. N Engl J Med. 2013;369(16):1564-1565. doi: 10.1056/NEJMc1306509 [DOI] [PMC free article] [PubMed] [Google Scholar]
- 16.Rajabli F, Feliciano BE, Celis K, et al. Ancestral origin of ApoE ε4 Alzheimer disease risk in Puerto Rican and African American populations. PLoS Genet. 2018;14(12):e1007791. doi: 10.1371/journal.pgen.1007791 [DOI] [PMC free article] [PubMed] [Google Scholar]
- 17.Jin SC, Carrasquillo MM, Benitez BA, et al. TREM2 is associated with increased risk for Alzheimer’s disease in African Americans. Mol Neurodegener. 2015;10(1):19. doi: 10.1186/s13024-015-0016-9 [DOI] [PMC free article] [PubMed] [Google Scholar]
- 18.Cukier HN, Kunkle BW, Vardarajan BN, et al. ; Alzheimer’s Disease Genetics Consortium . ABCA7 frameshift deletion associated with Alzheimer disease in African Americans. Neurol Genet. 2016;2(3):e79. doi: 10.1212/NXG.0000000000000079 [DOI] [PMC free article] [PubMed] [Google Scholar]
- 19.N’Songo A, Carrasquillo MM, Wang X, et al. African American exome sequencing identifies potential risk variants at Alzheimer disease loci. Neurol Genet. 2017;3(2):e141. doi: 10.1212/NXG.0000000000000141 [DOI] [PMC free article] [PubMed] [Google Scholar]
- 20.Logue MW, Schu M, Vardarajan BN, et al. ; Alzheimer Disease Genetics Consortium; Alzheimer Disease Genetics Consortium . Two rare AKAP9 variants are associated with Alzheimer’s disease in African Americans. Alzheimers Dement. 2014;10(6):609-618.e11. doi: 10.1016/j.jalz.2014.06.010 [DOI] [PMC free article] [PubMed] [Google Scholar]
- 21.Mez J, Chung J, Jun G, et al. ; Alzheimer’s Disease Genetics Consortium . Two novel loci, COBL and SLC10A2, for Alzheimer’s disease in African Americans. Alzheimers Dement. 2017;13(2):119-129. doi: 10.1016/j.jalz.2016.09.002 [DOI] [PMC free article] [PubMed] [Google Scholar]
- 22.Santos OA, Pedraza O, Lucas JA, et al. Ethnoracial differences in Alzheimer’s disease from the FLorida Autopsied Multi-Ethnic (FLAME) cohort. Alzheimers Dement. 2019;15(5):635-643. doi: 10.1016/j.jalz.2018.12.013 [DOI] [PMC free article] [PubMed] [Google Scholar]
- 23.Barnes LL, Leurgans S, Aggarwal NT, et al. Mixed pathology is more likely in black than white decedents with Alzheimer dementia. Neurology. 2015;85(6):528-534. doi: 10.1212/WNL.0000000000001834 [DOI] [PMC free article] [PubMed] [Google Scholar]
- 24.Morris JC, Schindler SE, McCue LM, et al. Assessment of racial disparities in biomarkers for Alzheimer disease. JAMA Neurol. 2019;76(3):264-273. doi: 10.1001/jamaneurol.2018.4249 [DOI] [PMC free article] [PubMed] [Google Scholar]
- 25.Filshtein TJ, Dugger BN, Jin LW, et al. Neuropathological diagnoses of demented Hispanic, Black, and non-Hispanic white decedents seen at an Alzheimer’s disease center. J Alzheimers Dis. 2019;68(1):145-158. doi: 10.3233/JAD-180992 [DOI] [PMC free article] [PubMed] [Google Scholar]
- 26.Graff-Radford NR, Besser LM, Crook JE, Kukull WA, Dickson DW. Neuropathologic differences by race from the National Alzheimer’s Coordinating Center. Alzheimers Dement. 2016;12(6):669-677. doi: 10.1016/j.jalz.2016.03.004 [DOI] [PMC free article] [PubMed] [Google Scholar]
- 27.The African Partnership for Chronic Disease Research. Data. Accessed September 4, 2020. https://www.apcdr.org/data/
- 28.Blacker D, Bertram L, Saunders AJ, et al. ; NIMH Genetics Initiative Alzheimer’s Disease Study Group . Results of a high-resolution genome screen of 437 Alzheimer’s disease families. Hum Mol Genet. 2003;12(1):23-32. doi: 10.1093/hmg/ddg007 [DOI] [PubMed] [Google Scholar]
- 29.Guerreiro R, Wojtas A, Bras J, et al. ; Alzheimer Genetic Analysis Group . TREM2 variants in Alzheimer’s disease. N Engl J Med. 2013;368(2):117-127. doi: 10.1056/NEJMoa1211851 [DOI] [PMC free article] [PubMed] [Google Scholar]
- 30.NIAGADS. Explore genetics and genomics of Alzheimer’s Disease. Accessed September 4, 2020. https://www.niagads.org/
- 31.Yu L, Chibnik LB, Srivastava GP, et al. Association of Brain DNA methylation in SORL1, ABCA7, HLA-DRB5, SLC24A4, and BIN1 with pathological diagnosis of Alzheimer disease. JAMA Neurol. 2015;72(1):15-24. doi: 10.1001/jamaneurol.2014.3049 [DOI] [PMC free article] [PubMed] [Google Scholar]
- 32.de Leeuw CA, Mooij JM, Heskes T, Posthuma D. MAGMA: generalized gene-set analysis of GWAS data. PLoS Comput Biol. 2015;11(4):e1004219. doi: 10.1371/journal.pcbi.1004219 [DOI] [PMC free article] [PubMed] [Google Scholar]
- 33.International Genomics of Alzheimer's Disease Consortium (IGAP); Jones L, Lambert J-C, Wang L-S, et al. Convergent genetic and expression data implicate immunity in Alzheimer’s disease. Alzheimers Dement. 2015;11(6). doi: 10.1016/j.jalz.2014.05.1757 [DOI] [PMC free article] [PubMed] [Google Scholar]
- 34.Lambert J-C, Ibrahim-Verbaas CA, Harold D, et al. ; European Alzheimer’s Disease Initiative (EADI); Genetic and Environmental Risk in Alzheimer’s Disease; Alzheimer’s Disease Genetic Consortium; Cohorts for Heart and Aging Research in Genomic Epidemiology . Meta-analysis of 74,046 individuals identifies 11 new susceptibility loci for Alzheimer’s disease. Nat Genet. 2013;45(12):1452-1458. doi: 10.1038/ng.2802 [DOI] [PMC free article] [PubMed] [Google Scholar]
- 35.Cummings AC, Jiang L, Velez Edwards DR, et al. Genome-wide association and linkage study in the Amish detects a novel candidate late-onset Alzheimer disease gene. Ann Hum Genet. 2012;76(5):342-351. doi: 10.1111/j.1469-1809.2012.00721.x [DOI] [PMC free article] [PubMed] [Google Scholar]
- 36.Lamriben L, Oster ME, Tamura T, et al. EDEM1's mannosidase-like domain binds ERAD client proteins in a redox-sensitive manner and possesses catalytic activity. J Biol Chem. 2018;293(36):13932-13945. doi: 10.1074/jbc.RA118.004183 [DOI] [PMC free article] [PubMed] [Google Scholar]
- 37.Molinari M, Calanca V, Galli C, Lucca P, Paganetti P.. Role of EDEM in the release of misfolded glycoproteins from the calnexin cycle. Science. 2003;299(5611):1397-1400. doi: 10.1126/science.1079474 [DOI] [PubMed] [Google Scholar]
- 38.Cormier JH, Tamura T, Sunryd JC, Hebert DN. EDEM1 recognition and delivery of misfolded proteins to the SEL1L-containing ERAD complex. Mol Cell. 2009;34(5):627-633. doi: 10.1016/j.molcel.2009.05.018 [DOI] [PMC free article] [PubMed] [Google Scholar]
- 39.Kaneko M, Koike H, Saito R, Kitamura Y, Okuma Y, Nomura Y. Loss of HRD1-mediated protein degradation causes amyloid precursor protein accumulation and amyloid-beta generation. J Neurosci. 2010;30(11):3924-3932. doi: 10.1523/JNEUROSCI.2422-09.2010 [DOI] [PMC free article] [PubMed] [Google Scholar]
- 40.Kamboh MI, Fan KH, Yan Q, et al. Population-based genome-wide association study of cognitive decline in older adults free of dementia: identification of a novel locus for the attention domain. Neurobiol Aging. 2019;84:239.e15-239.e24. doi: 10.1016/j.neurobiolaging.2019.02.024 [DOI] [PMC free article] [PubMed] [Google Scholar]
- 41.Allen NJ, Bennett ML, Foo LC, et al. Astrocyte glypicans 4 and 6 promote formation of excitatory synapses via GluA1 AMPA receptors. Nature. 2012;486(7403):410-414. doi: 10.1038/nature11059 [DOI] [PMC free article] [PubMed] [Google Scholar]
- 42.Kang TH, Kim KT. Negative regulation of ERK activity by VRK3-mediated activation of VHR phosphatase. Nat Cell Biol. 2006;8(8):863-869. doi: 10.1038/ncb1447 [DOI] [PubMed] [Google Scholar]
- 43.Wu GY, Deisseroth K, Tsien RW. Spaced stimuli stabilize MAPK pathway activation and its effects on dendritic morphology. Nat Neurosci. 2001;4(2):151-158. doi: 10.1038/83976 [DOI] [PubMed] [Google Scholar]
- 44.Thomas GM, Huganir RL. MAPK cascade signalling and synaptic plasticity. Nat Rev Neurosci. 2004;5(3):173-183. doi: 10.1038/nrn1346 [DOI] [PubMed] [Google Scholar]
- 45.Song H, Kim W, Kim SH, Kim KT. VRK3-mediated nuclear localization of HSP70 prevents glutamate excitotoxicity-induced apoptosis and Aβ accumulation via enhancement of ERK phosphatase VHR activity. Sci Rep. 2016;6:38452. doi: 10.1038/srep38452 [DOI] [PMC free article] [PubMed] [Google Scholar]
- 46.van Horssen J, Wesseling P, van den Heuvel LP, de Waal RM, Verbeek MM. Heparan sulphate proteoglycans in Alzheimer’s disease and amyloid-related disorders. Lancet Neurol. 2003;2(8):482-492. doi: 10.1016/S1474-4422(03)00484-8 [DOI] [PubMed] [Google Scholar]
- 47.van Horssen J, Otte-Höller I, David G, et al. Heparan sulfate proteoglycan expression in cerebrovascular amyloid beta deposits in Alzheimer’s disease and hereditary cerebral hemorrhage with amyloidosis (Dutch) brains. Acta Neuropathol. 2001;102(6):604-614. doi: 10.1007/s004010100414 [DOI] [PubMed] [Google Scholar]
- 48.van Horssen J, Kleinnijenhuis J, Maass CN, et al. Accumulation of heparan sulfate proteoglycans in cerebellar senile plaques. Neurobiol Aging. 2002;23(4):537-545. doi: 10.1016/S0197-4580(02)00010-6 [DOI] [PubMed] [Google Scholar]
- 49.Beckman M, Holsinger RM, Small DH. Heparin activates beta-secretase (BACE1) of Alzheimer’s disease and increases autocatalysis of the enzyme. Biochemistry. 2006;45(21):6703-6714. doi: 10.1021/bi052498t [DOI] [PubMed] [Google Scholar]
- 50.Leveugle B, Ding W, Durkin JT, et al. Heparin promotes beta-secretase cleavage of the Alzheimer’s amyloid precursor protein. Neurochem Int. 1997;30(6):543-548. doi: 10.1016/S0197-0186(96)00103-9 [DOI] [PubMed] [Google Scholar]
- 51.Castillo GM, Ngo C, Cummings J, Wight TN, Snow AD. Perlecan binds to the beta-amyloid proteins (A beta) of Alzheimer’s disease, accelerates A beta fibril formation, and maintains A beta fibril stability. J Neurochem. 1997;69(6):2452-2465. doi: 10.1046/j.1471-4159.1997.69062452.x [DOI] [PubMed] [Google Scholar]
- 52.Karczewski KJ, Francioli LC, Tiao G, et al. Variation across 141,456 human exomes and genomes reveals the spectrum of loss-of-function intolerance across human protein-coding genes. bioRxiv. Preprint posted online August 13, 2019. doi: 10.1101/531210 [DOI]
- 53.Tatsuoka C, Tseng H, Jaeger J, et al. ; Alzheimer’s Disease Neuroimaging Initiative . Modeling the heterogeneity in risk of progression to Alzheimer’s disease across cognitive profiles in mild cognitive impairment. Alzheimers Res Ther. 2013;5(2):14. doi: 10.1186/alzrt168 [DOI] [PMC free article] [PubMed] [Google Scholar]
- 54.Zhang H, Zhou H, Lencz T, Farrer LA, Kranzler HR, Gelernter J. Genome-wide association study of cognitive flexibility assessed by the Wisconsin Card Sorting Test. Am J Med Genet B Neuropsychiatr Genet. 2018;177(5):511-519. doi: 10.1002/ajmg.b.32642 [DOI] [PMC free article] [PubMed] [Google Scholar]
- 55.Holzenberger M, Dupont J, Ducos B, et al. IGF-1 receptor regulates lifespan and resistance to oxidative stress in mice. Nature. 2003;421(6919):182-187. doi: 10.1038/nature01298 [DOI] [PubMed] [Google Scholar]
- 56.Talbot K, Wang H-Y, Kazi H, et al. Demonstrated brain insulin resistance in Alzheimer’s disease patients is associated with IGF-1 resistance, IRS-1 dysregulation, and cognitive decline. J Clin Invest. 2012;122(4):1316-1338. doi: 10.1172/JCI59903 [DOI] [PMC free article] [PubMed] [Google Scholar]
- 57.Freude S, Hettich MM, Schumann C, et al. Neuronal IGF-1 resistance reduces A beta accumulation and protects against premature death in a model of Alzheimer’s disease. FASEB J. 2009;23(10):3315-3324. doi: 10.1096/fj.09-132043 [DOI] [PubMed] [Google Scholar]
- 58.De Magalhaes Filho CD, Kappeler L, Dupont J, et al. Deleting IGF-1 receptor from forebrain neurons confers neuroprotection during stroke and upregulates endocrine somatotropin. J Cereb Blood Flow Metab. 2017;37(2):396-412. doi: 10.1177/0271678X15626718 [DOI] [PMC free article] [PubMed] [Google Scholar]
- 59.Cohen E, Paulsson JF, Blinder P, et al. Reduced IGF-1 signaling delays age-associated proteotoxicity in mice. Cell. 2009;139(6):1157-1169. doi: 10.1016/j.cell.2009.11.014 [DOI] [PMC free article] [PubMed] [Google Scholar]
- 60.Gontier G, George C, Chaker Z, Holzenberger M, Aïd S. Blocking IGF signaling in adult neurons alleviates Alzheimer’s Disease pathology through amyloid-β clearance. J Neurosci. 2015;35(33):11500-11513. doi: 10.1523/JNEUROSCI.0343-15.2015 [DOI] [PMC free article] [PubMed] [Google Scholar]
- 61.Garcia-Jove Navarro M, Basset C, Arcondéguy T, et al. Api5 contributes to E2F1 control of the G1/S cell cycle phase transition. PLoS One. 2013;8(8):e71443. doi: 10.1371/journal.pone.0071443 [DOI] [PMC free article] [PubMed] [Google Scholar]
- 62.Auweter SD, Fasan R, Reymond L, et al. Molecular basis of RNA recognition by the human alternative splicing factor Fox-1. EMBO J. 2006;25(1):163-173. doi: 10.1038/sj.emboj.7600918 [DOI] [PMC free article] [PubMed] [Google Scholar]
- 63.Hamada N, Ito H, Iwamoto I, Morishita R, Tabata H, Nagata K. Role of the cytoplasmic isoform of RBFOX1/A2BP1 in establishing the architecture of the developing cerebral cortex. Mol Autism. 2015;6:56. doi: 10.1186/s13229-015-0049-5 [DOI] [PMC free article] [PubMed] [Google Scholar]
- 64.Gandal MJ, Zhang P, Hadjimichael E, et al. Transcriptome-wide isoform-level dysregulation in ASD, schizophrenia, and bipolar disorder. Science. 2018;362(6420):eaat8127. doi: 10.1126/science.aat8127 [DOI] [PMC free article] [PubMed] [Google Scholar]
- 65.Alkallas R, Fish L, Goodarzi H, Najafabadi HS. Inference of RNA decay rate from transcriptional profiling highlights the regulatory programs of Alzheimer’s disease. Nat Commun. 2017;8(1):909. doi: 10.1038/s41467-017-00867-z [DOI] [PMC free article] [PubMed] [Google Scholar]
- 66.Lee JA, Damianov A, Lin CH, et al. Cytoplasmic Rbfox1 regulates the expression of synaptic and autism-related genes. Neuron. 2016;89(1):113-128. doi: 10.1016/j.neuron.2015.11.025 [DOI] [PMC free article] [PubMed] [Google Scholar]
- 67.Alam S, Suzuki H, Tsukahara T. Alternative splicing regulation of APP exon 7 by RBFox proteins. Neurochem Int. 2014;78:7-17. doi: 10.1016/j.neuint.2014.08.001 [DOI] [PubMed] [Google Scholar]
- 68.Raghavan NS, Dumitrescu L, Mormino E, et al. ; Alzheimer’s Disease Neuroimaging Initiative . Association between common variants in RBFOX1, an RNA-binding protein, and brain amyloidosis in early and preclinical Alzheimer disease. JAMA Neurol. Published online June 22, 2020. doi: 10.1001/jamaneurol.2020.1760 [DOI] [PMC free article] [PubMed] [Google Scholar]
- 69.Forstner AJ, Hecker J, Hofmann A, et al. Identification of shared risk loci and pathways for bipolar disorder and schizophrenia. PLoS One. 2017;12(2):e0171595. doi: 10.1371/journal.pone.0171595 [DOI] [PMC free article] [PubMed] [Google Scholar]
- 70.Chen DT, Jiang X, Akula N, et al. ; BiGS . Genome-wide association study meta-analysis of European and Asian-ancestry samples identifies three novel loci associated with bipolar disorder. Mol Psychiatry. 2013;18(2):195-205. doi: 10.1038/mp.2011.157 [DOI] [PubMed] [Google Scholar]
- 71.Ruderfer DM, Fanous AH, Ripke S, et al. ; Schizophrenia Working Group of the Psychiatric Genomics Consortium; Bipolar Disorder Working Group of the Psychiatric Genomics Consortium; Cross-Disorder Working Group of the Psychiatric Genomics Consortium . Polygenic dissection of diagnosis and clinical dimensions of bipolar disorder and schizophrenia. Mol Psychiatry. 2014;19(9):1017-1024. doi: 10.1038/mp.2013.138 [DOI] [PMC free article] [PubMed] [Google Scholar]
- 72.Goes FS, Hamshere ML, Seifuddin F, et al. ; Bipolar Genome Study (BiGS) . Genome-wide association of mood-incongruent psychotic bipolar disorder. Transl Psychiatry. 2012;2:e180. doi: 10.1038/tp.2012.106 [DOI] [PMC free article] [PubMed] [Google Scholar]
- 73.Jiang X, Detera-Wadleigh SD, Akula N, et al. Sodium valproate rescues expression of TRANK1 in iPSC-derived neural cells that carry a genetic variant associated with serious mental illness. Mol Psychiatry. 2019;24(4):613-624. doi: 10.1038/s41380-018-0207-1 [DOI] [PMC free article] [PubMed] [Google Scholar]
- 74.Laster M, Shen JI, Norris KC. Kidney disease among African Americans: a population perspective. Am J Kidney Dis. 2018;72(5)(suppl 1):S3-S7. doi: 10.1053/j.ajkd.2018.06.021 [DOI] [PMC free article] [PubMed] [Google Scholar]
- 75.McAdams-DeMarco MA, Daubresse M, Bae S, Gross AL, Carlson MC, Segev DL. Dementia, Alzheimer’s disease, and mortality after hemodialysis initiation. Clin J Am Soc Nephrol. 2018;13(9):1339-1347. doi: 10.2215/CJN.10150917 [DOI] [PMC free article] [PubMed] [Google Scholar]
- 76.Pirici D, Stanaszek L, Garz C, et al. Common impact of chronic kidney disease and brain microhemorrhages on cerebral Aβ pathology in SHRSP. Brain Pathol. 2017;27(2):169-180. doi: 10.1111/bpa.12384 [DOI] [PMC free article] [PubMed] [Google Scholar]
- 77.Beach TG, Monsell SE, Phillips LE, Kukull W. Accuracy of the clinical diagnosis of Alzheimer disease at National Institute on Aging Alzheimer Disease Centers, 2005-2010. J Neuropathol Exp Neurol. 2012;71(4):266-273. doi: 10.1097/NEN.0b013e31824b211b [DOI] [PMC free article] [PubMed] [Google Scholar]
- 78.Bennett DA, Schneider JA, Arvanitakis Z, Wilson RS. Overview and findings from the religious orders study. Curr Alzheimer Res. 2012;9(6):628-645. doi: 10.2174/156720512801322573 [DOI] [PMC free article] [PubMed] [Google Scholar]
Associated Data
This section collects any data citations, data availability statements, or supplementary materials included in this article.
Supplementary Materials
eAppendix. Description of cohorts
eMethods.
eTable 1. Genotyping Platforms used in the individual data sets
eTable 2. Comparison of imputation quality of 1000G Phase 2 and AGR reference vs whole-exome sequencing data in 800 subjects
eTable 3. Demographic characteristics of data sets
eTable 4. APOEe4-stratified results for top loci
eTable 5. Sample sizes for APOEe4-stratified analyses
eTable 6. Single-marker meta-analysis results for previously reported variants
eTable 7. Gene-based results for AD genes previously identified in non-Hispanic Whites or African Americans
eTable 8. Results of top African-American (A) single variant associations, (B) gene-based associations and (C) pathways in the IGAP non-Hispanic white data set
eFigure 1. Regional association plots for the (A) three novel common and (B) seven rare loci identified in single-variant meta-analysis
eFigure 2. Forest Plots of Odds Ratios (ORs) for the (A) three novel common and (B) seven rare loci identified in single-variant meta-analysis
eFigure 3. Quantile-quantile plots for single marker association analyses based (A) on the model adjusted for age, sex and population stratification and (B) age, sex, population stratification and APOE showing the deviation of observed from expected P values
eFigure 4. Linkage disequilibrium analyses between the top associated variant in 19q13.33 (rs3745495) and three variants in APOE: A) The top associated AA variant within APOE (rs147491), and B) The two variants that define the APOE genotype (rs429358 and rs7412). Analyses were done using LDLink
eFigure 5. Manhattan plot of gene-based analysis results. Model 1 (a) is adjusted for age, sex and population stratification; Model 2 (b) is adjusted for age, sex, population stratification and APOE
eReferences.
Nonauthor Collaborators. Alzheimer Disease Genetics Consortium (ADGC) collaborators.