

Abstract
Background:
Hippocampal atrophy is presented in Alzheimer’s disease (AD) and dementia with Lewy bodies (DLB). Cognition, dual-tasks, muscular function, goal-related behaviors and neuropsychiatric symptoms are linked to hippocampal volumes and may lead to functional decline in activities of daily living. We examined the association between baseline hippocampal subfield volumes (HSv) in mild AD and DLB, and functional decline.
Materials & methods:
12 HSv were computed from structural magnetic resonance images using Freesurfer 6.0 segmentation. Functional decline was assessed using the rapid disability rating scale score. Linear regressions were conducted.
Results:
In AD, HSv were smaller bilaterally. However, HSv were not associated with functional decline.
Conclusion:
Functional decline does not depend on HSv in mild AD and DLB.
Keywords: : activities of daily living, Alzheimer's disease, dementia with Lewy bodies, functional decline, hippocampal subfields
Practice points.
Functional decline is one of the main outcomes in older adult’s health and especially in dementia.
Targeting functional decline as an important outcome could contribute to a better and more holistic approach to dementia.
This is the first work that examined the association of hippocampal subfield volume (HSv) and functional decline in dementia with Lewy bodies (DLB).
Our results suggest differential volume patterns in Alzheimer’s disease compared with DLB, in line with previous studies, lower HSv were found in the Alzheimer’s disease group, compared with DLB.
Both structural and functional brain techniques should be considered in the evaluation of functional decline in dementia.
According to our results, baseline HSv were not associated with the decline rate in activities of daily living performance.
Early functional brain changes (e.g., earlier cholinergic deficits) could be more important than atrophy in people diagnosed with DLB.
Activities of daily living performance is influenced by many factors rather than only early hippocampal atrophy.
Hippocampal atrophy is a characteristic feature of Alzheimer’s disease (AD) [1] but it can also occur in dementia with Lewy bodies (DLB) [2]. However, structural MRI (sMRI) has shown differential atrophy patterns in AD and DLB, suggesting relative sparing of the hippocampal volume in DLB [3]. By contrast, pathological examinations of DLB cases have shown a high frequency of concomitant AD pathology [4], and a high burden of alpha-synuclein accumulations in CA2-3 and the entorhinal cortex [5]. Since several works have considered the hippocampus as a homogeneous structure, recent sMRI studies examined the hippocampal subfield volumes (HSv) implementing various automatic segmentation methods [6–8]. In neurodegenerative disorders, HSv atrophy has been reported in amnestic mild cognitive impairment [9], AD [1], Parkinson disease cognitive decline [10], and DLB [6,11], proposing the HSv as a potential diagnostic and prognostic marker in dementia.
In addition to its role in memory, the hippocampus is involved in gait control and speed, motor dual-tasks, stride time, muscular function [12] and neuropsychiatric symptoms [8]. As many of these functions facilitate the performance of activities of daily living (ADL) and can predict functional decline [13,14], the volumes of specific HSv might be associated with the functional decline in AD and other neurodegenerative dementias. However, few studies have explored this association, in particular in DLB. Therefore, the objective of the current study was to examine the possible association between the functional decline (over a 5 years follow-up), and the baseline volumes of specific HSv in mild AD and mild DLB patients. We hypothesize that lower volumes at mild AD and mild DLB diagnosis may be associated with functional decline in dementia.
Materials & methods
The participants were selected from ‘The Dementia Study of Western Norway’ (DemVest), a cohort of patients with mild dementia recruited from all dementia clinics in Hordaland and Rogaland counties in Norway. The main inclusion period took place between 2005 and 2007. Exclusion criteria were: absence of dementia, moderate or severe dementia, delirium, previous bipolar or psychotic disorder, terminal illness, or recently diagnosed major somatic disease. Details of the design, recruitment, clinical and biomarker procedures are described elsewhere [15]. All participants signed informed consent before inclusion, and the study was approved by the regional ethics committee and the Norwegian authorities. Patients were followed yearly or until death, and data from the first 5 years are used in this study. We included 119 subjects diagnosed with AD and DLB with available MRI images at baseline (AD = 84, DLB = 35). Dropouts due to death and loss to follow-up were depicted in Figure 1.
Figure 1. . Sample selection and dropout rates.
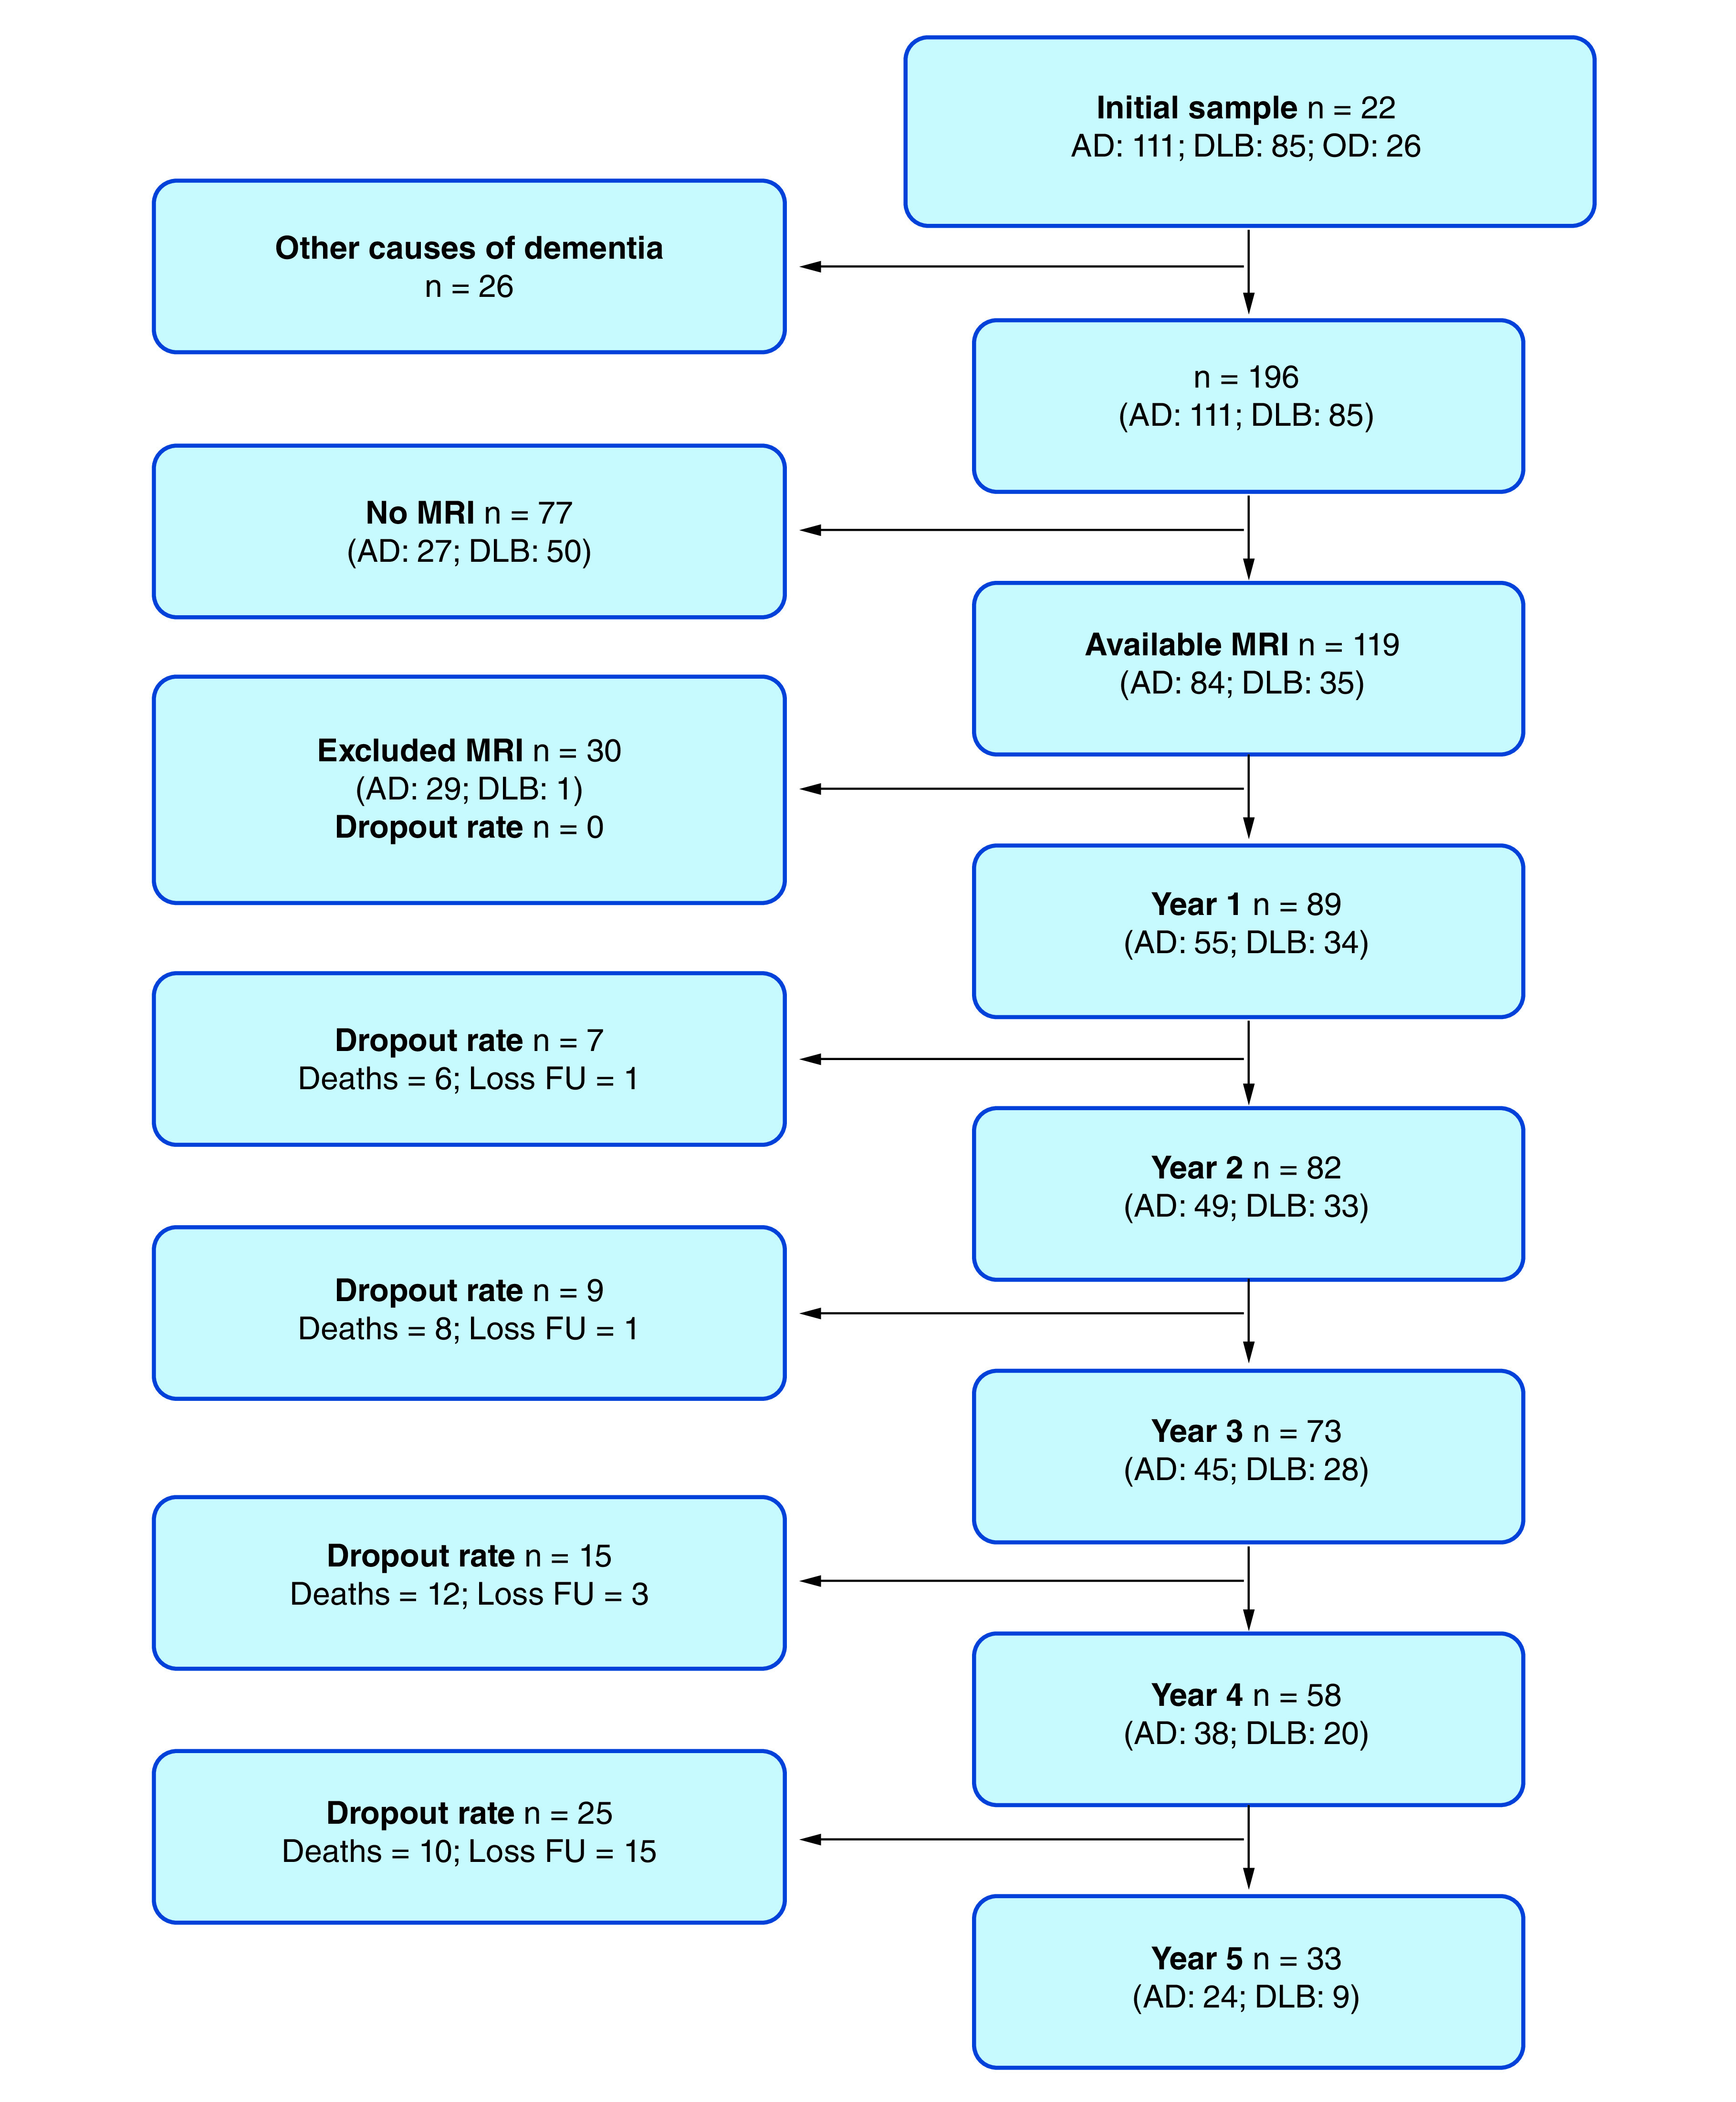
AD: Alzheimer’s disease; DLB: Dementia with Lewy bodies; Loss FU: Loss to follow-up; OD: Other causes of dementia.
Clinical assessments
Structured medical assessments, relevant information regarding past medical history and medical records were used to obtain complete and detailed medical background. Comorbidities were recorded for each subject using the cumulative illness rating scale (CIRS) [16], based on patient and informant reports. Cognition was evaluated through the mini-mental state examination (MMSE) [17] and a battery of cognitive tests [15].
Dementia diagnosis
Diagnosis of dementia was made according to DSM-IV criteria and further classified as AD (according to the National Institute of Neurological and Communicative Disorders, Stroke-Alzheimer’s Disease and Related Disorders Association) [18], or DLB (according to the International consensus criteria) [19]. Mild dementia was defined as an MMSE score of at least 20 or a clinical dementia rating scale global score = 1 [20]. Four clinical specialists independently applied diagnostic criteria verifying diagnosis regularly. In cases of incomplete criteria fulfilling, the final diagnosis was made through consensus. However, a high congruency between the clinical, imaging and the neuropathological diagnosis was achieved, since 26 DLB patients have dopamine transporter scans, and pathological diagnosis was available for 20 DLB and 36 AD patients [15,21].
Functional decline: dependent variable
Functional decline, based on ADL was evaluated yearly through the rapid disability rating scale – 2 [16,22]. For our analysis, we computed an average score including the following items: eating, making simple food, cooking dinner and adhere to a diet, mobilization – with or without aids, daily personal care, bathing/showering, dressing (and finding clothes), toilet usage, use of the phone, buying food and other necessary items, handling money and paying bills, having a financial overview plan ahead, to write tax returns and taking medications as prescribed. Each item was scored on a Likert scale (alone = 1, with some help = 2, with substantial help = 3, and cannot perform = 4). ADL score was obtained using the average score of these 13 items. To determine the decline in function, we calculated the delta of ADL scores based on the difference between the baseline and the last registered measure of the ADL score (i.e., up to year 5 or before dead).
sMRI dataset & subfields segmentation
Baseline sMRIs were acquired in three 1.5-T scanners using these acquisition protocols for T1-weighted sequences: Stavanger: Philips Intera, repetition time (TR) 10.0, echo time (TE) 4.6 ms, tip angle 30°, 2-mm slice thickness with a 1-mm gap, number of excitations (NEX) 2, matrix 256 × 256, and a nominal spatial voxel resolution of 1 × 1 × 1.28 mm. Haugesund: Philips Intera, TR 20.0, TE of 4.6 ms, flip angle of 30°, 1 mm slice thickness with no gap, NEX 1, matrix 256 × 256 and a voxel size of 1 × 1 × 1.46 mm. Bergen: 1.5 T General Electric Signa Excite, TR 8.2, TE 3.1 ms, tip angle 7°, 1-mm slice thickness with no gap, NEX 1, matrix 256 × 256 and voxel resolution of 1 × 1 × 1.33 mm. The sMRIs were acquired in coronal planes in the three centers (i.e., Stavanger, Bergen and Haugesund). sMRI data with artifacts on visual inspection were excluded (n = 30; AD = 29; DLB = 1), please see Appendix Table A1 for details about the excluded participants. We applied a standardized pre processing method for harmonizing multiple collections of sMRI, consisted of movement correction, non brain tissues erasing, automated calculation of Talairach transformation, intensity normalization, subcortical white and gray matter segmentation, cortex boundary tessellation, fully automatic topology correction, and surface deformation to determine CSF/gray matter and gray/white matter boundaries. Following previously published methods to extract HSv [23], the FreeSurfer 6.0 automated pipeline for hippocampal segmentation was implemented. HSv segmentation was carried out using a Bayesian method and an ex-vivo MRI atlas algorithm of the hippocampal formations in ultra-high-resolution (∼0.1 mm isotropic) [24]. Twelve subfields were obtained: parasubiculum, presubiculum, subiculum, cornu ammonis 1 (CA1), CA2–3, CA4, granule cells in dentate gyrus (GC-DG), hippocampal-amygdaloid transition area, fimbria, molecular layer, hippocampal fissure and hippocampal tail as shown in Figure 2. All HSv were rescaled multiplying their values by 1000. Visual inspection of all HSv was conducted by two researchers blinded to diagnosis for accuracy verification. Total intracranial volumes were also estimated using FreeSurfer 6.0.
Figure 2. . Hippocampal subfields segmentation in a coronal view.

CA: Cornu ammonis; GC-DG: Granule cells in dentate gyrus; HATA: Hippocampal–amygdaloid transition area.
Statistical analysis
Statistical analyses were performed using STATA version 15.0. The statistical significance level of 0.05 was considered. Frequencies and percentages for nominal variables and mean and standard deviations for continuous variables were estimated. Group differences in clinical characteristics were evaluated on bivariate analysis using one tail chi-square test and two tails t-test and Mann–Whitney U. To compare HSv between groups, we controlled for age, gender and total intracranial volume using ANCOVA followed by posthoc pairwise Tukey’s tests. The influence of HSv on the functional decline (ADL) was examined through linear regressions. Our linear regression models were adjusted for age, gender, place where scan had been acquired, neuropsychiatric symptoms, the time between baseline and last ADL evaluation, and MMSE and CIRS at baseline.
Results
The baseline characteristics of the AD and DLB groups are summarized in Table 1. Age, MMSE and ADL scores did not differ significantly between AD and DLB, but AD presented fewer comorbidities (CIRS) and had more women. The DLB group showed a trend to more decline in ADL (see Supplementary Figure A1). The baseline sMRI volumes are reported in Table 2. The DLB group exhibited statistically significant greater HSv compared with AD patients. Adjusted ANCOVA maintained the results besides right lower CA2-3 volumes in AD reached a significance level (p = 0.03).
Table 1. . Sample baseline characteristics in mild Alzheimer’s disease and DLB groups.
| AD (n = 55) | DLB (n = 34) | p-value | |
|---|---|---|---|
| Age (SD) | 74.91 (∓ 0.98) | 76.29 (∓ 1.20) | 0.3796 |
| Gender | <0.0001† | ||
| – Woman (%) | 41 (74.55) | 12 (35.29) | - |
| – Men (%) | 14 (25.45) | 22 (64.71) | - |
| MMSE score (SD) | 23.62 (∓ 0.33) | 23.53 (∓ 0.50) | 0.8825 |
| CIRS (SD) | 5.4 (∓ 0.27) | 6.59 (∓ 0.50) | 0.0348 |
| ADL score (SD) | 1.56 (∓ 0.08) | 1.81 (∓ 0.12) | 0.0882 |
Chi-square test (p-value).
p-values < 0.05 are printed in bold.
AD: Alzheimer’s disease; ADL: Activities of daily living; CIRS: Cumulative illness rating scale; DLB: Dementia with Lewy bodies; MMSE: Mini-mental state examination; SD: Standard deviation.
Table 2. . Baseline MRI Hippocampal volumes in mild Alzheimer’s disease and DLB groups.
| Hippocampal subfield volumes (baseline) | AD (n = 55) | DLB (n = 34) | p-value | Adjusted p-value† |
|---|---|---|---|---|
| Left hemisphere. mean (SD) | ||||
| Hippocampal tail | 0.36 (∓0.07) | 0.41 (∓ 0.10) | 0.0063 | 0.0019 |
| Subiculum | 0.30 (∓ 0.07) | 0.35 (∓ 0.08) | 0.0039 | 0.0022 |
| CA1 | 0.46 (∓ 0.11) | 0.53 (∓ 0.12) | 0.0102 | 0.0044 |
| Hippocampal fissure | 0.15 (∓ 0.04) | 0.16 (∓ 0.04) | 0.2184 | 0.2037 |
| Presubiculum | 0.23 (∓ 0.06) | 0.27 (∓ 0.06) | 0.0057 | 0.0028 |
| Parasubiculum | 0.05 (∓ 0.02) | 0.06 (∓ 0.02) | 0.0056 | 0.0023 |
| Molecular Layer | 0.39 (∓ 0.09) | 0.45 (∓ 0.10) | 0.0051 | 0.0021 |
| GC-DG | 0.20 (∓ 0.05) | 0.23 (∓ 0.05) | 0.0102 | 0.0055 |
| CA2-3 | 0.14 (∓ 0.04) | 0.16 (∓ 0.04) | 0.0355 | 0.0213 |
| CA4 | 0.17 (∓ 0.04) | 0.20 (∓ 0.05) | 0.0114 | 0.0062 |
| Fimbria | 0.04 (∓ 0.02) | 0.05 (∓ 0.02) | 0.0068 | 0.0047 |
| HATA | 0.04 (∓ 0.01) | 0.05 (∓ 0.01) | 0.0010 | 0.0003 |
| Right hemisphere. mean (SD) | ||||
| Hippocampal tail | 0.39 (∓ 0.07) | 0.45 (∓ 0.10) | 0.0033 | 0.0003 |
| Subiculum | 0.31 (∓ 0.07) | 0.35 (∓ 0.08) | 0.0134 | 0.0053 |
| CA1 | 0.51 (∓ 0.11) | 0.56 (∓ 0.12) | 0.0418 | 0.0190 |
| Hippocampal fissure | 0.17 (∓ 0.04) | 0.18 (∓ 0.005) | 0.3306 | 0.2954 |
| Presubiculum | 0.22 (∓ 0.05) | 0.26 (∓ 0.06) | 0.0046 | 0.0010 |
| Parasubiculum | 0.05 (∓ 0.02) | 0.06 (∓ 0.02) | 0.0916 | 0.0772 |
| Molecular layer | 0.42 (∓ 0.08) | 0.47 (∓ 0.10) | 0.0146 | 0.0048 |
| GC-DG | 0.22 (∓ 0.04) | 0.25 (∓ 0.06) | 0.0304 | 0.0126 |
| CA2-3 | 0.17 (∓ 0.04) | 0.18 8 (∓ 0.05) | 0.0596 | 0.0335 |
| CA4 | 0.20 (∓ 0.04) | 0.22 8 (∓ 0.05) | 0.0422 | 0.0204 |
| Fimbria | 0.04 (∓ 0.02) | 0.06 (∓ 0.03) | 0.0240 | 0.0086 |
| HATA | 0.04 (∓ 0.01) | 0.05 (∓ 0.01) | 0.0034 | 0.0010 |
ANCOVA (df = 1) controlling for age, sex, intracranial volume with post-hoc Tukey’s pairwise test.
p-values < 0.05 are printed in bold.
AD: Alzheimer’s disease; CA: Cornu ammonis; DLB: Dementia with Lewy bodies; GC-DG: Granule cells in dentate gyrus; HATA: Hippocampal–amygdaloid transition area; SD: Standard deviation.
Tables 3 & 4 show adjusted and unadjusted linear regression models for the right and left HSv in AD and DLB, respectively. In the adjusted models, we did not find significant associations between change in ADL scores over follow-up and HSv.
Table 3. . Linear regression for assessing the hippocampal subfield volumes effect on the functional decline (determined by the difference between first and last available activities of daily living score) in Alzheimer’s disease patients during follow-up.
| Unadjusted model | ||||||||
|---|---|---|---|---|---|---|---|---|
| Left hemisphere | Right hemisphere | |||||||
| Hippocampal subfield volume | Estimation | SE | p-value | r2 | Estimation | SE | p-value | r2 |
| Hippocampal tail | 17.68 | 1821.1 | 0.9923 | 0.00% | -442.54 | 2194.6 | 0.841 | 0.08% |
| Subiculum | -1535.67 | 2045.9 | 0.4564 | 1.11% | -4185.94 | 2051.4 | 0.0466 | 7.69% |
| CA1 | -464.06 | 1354.6 | 0.7333 | 0.23% | -1968.28 | 1345 | 0.1496 | 4.11% |
| Hippocampal fissure | 556.66 | 3363.4 | 0.8692 | 0.05% | -2351.8 | 3334.4 | 0.4839 | 0.99% |
| Presubiculum | -925.53 | 2638.9 | 0.7273 | 0.25% | -2126.64 | 3218.9 | 0.5119 | 0.87% |
| Parasubiculum | -1682.52 | 9374.8 | 0.8583 | 0.06% | -7213.62 | 9432.7 | 0.448 | 1.16% |
| Molecular layer | -798.28 | 1688.8 | 0.6385 | 0.44% | -2570.09 | 1699.7 | 0.1368 | 4.37% |
| GC-DG | -1315.23 | 3222.1 | 0.6849 | 0.33% | -5179.31 | 3294.6 | 0.1222 | 4.71% |
| CA2-3 | -219.06 | 4300.9 | 0.9596 | 0.01% | -5673.39 | 4058.5 | 0.1683 | 3.76% |
| CA4 | -980.18 | 3636 | 0.7886 | 0.15% | -5046.23 | 3720.2 | 0.1811 | 3.55% |
| Fimbria | -5916.32 | 8494.9 | 0.4894 | 0.96% | -5419.63 | 8109.7 | 0.507 | 0.89% |
| HATA | -8542.31 | 12,946 | 0.5124 | 0.86% | -33,189.84 | 11,703.2 | 0.0066 | 13.86% |
| Adjusted model | ||||||||
| Left hemisphere | Right hemisphere | |||||||
| Hippocampal subfield volume | Estimation | SE | p-value | r2 | Estimation | SE | p-value | r2 |
| Hippocampal tail | -521.82 | 1734 | 0.7649 | 40.40% | 138.95 | 1909.4 | 0.9423 | 40.28% |
| Subiculum | -1543.87 | 1981.8 | 0.4402 | 41.10% | -2401.91 | 2052.5 | 0.2483 | 42.12% |
| CA1 | -226.82 | 1198.5 | 0.8508 | 40.32% | -226.82 | 1198.5 | 0.8508 | 40.32% |
| Hippocampal fissure | 584.72 | 3659.7 | 0.8738 | 40.31% | 10.63 | 3702.9 | 0.9977 | 40.27% |
| Presubiculum | 522.66 | 2474.9 | 0.8337 | 40.34% | 1298.14 | 3098.3 | 0.6773 | 40.52% |
| Parasubiculum | 3244.12 | 8497.5 | 0.7045 | 40.48% | 4857.55 | 8356.6 | 0.5641 | 40.74% |
| Molecular Layer | -798.28 | 1688.8 | 0.6385 | 0.44% | -798.28 | 1688.8 | 0.6385 | 0.44% |
| GC-DG | -1538.09 | 2997.9 | 0.6105 | 40.64% | -3644.11 | 3099.1 | 0.2461 | 42.13% |
| CA2-3 | -865.92 | 4031.6 | 0.8309 | 40.34% | -5404.07 | 3895.1 | 0.1725 | 42.83% |
| CA4 | -1372.56 | 3482.6 | 0.6954 | 40.49% | -3902.21 | 3554 | 0.2783 | 41.90% |
| Fimbria | -9564.96 | 7451.7 | 0.2062 | 42.48% | -5812.19 | 7147.1 | 0.4206 | 41.18% |
| HATA | -1225.42 | 12,988.8 | 0.9253 | 40.29% | -13,662.09 | 12,416.1 | 0.2773 | 41.91% |
p < 0.05 are printed in bold.
In the adjusted model Age, Sex, MMSE, CIRS, Site, NPI, and time between first and last measurements were included.
AD: Alzheimer’s disease; ADL: Activities of daily living; CA: Cornu ammonis; CIRS: Cumulative illness rating scale; GC-DG: Granule cells in dentate Gyrus; HATA: Hippocampal–amygdaloid transition area; MMSE: Mini-mental state examination; SE: Standard error.
Table 4. . Linear regression for assessing the hippocampal subfield volumes effect on the functional decline (determined by the difference between first and last available activities of daily living score) in DLB patients during follow-up.
| Unadjusted model | ||||||||
|---|---|---|---|---|---|---|---|---|
| Left hemisphere | Right hemisphere | |||||||
| Hippocampal subfield volume | Estimation | SE | p-value | r2 | Estimation | SE | p-value | r2 |
| Hippocampal tail | -3572.11 | 6870.6 | 0.6069 | 0.89% | 41.28 | 7504.2 | 0.9956 | 0.00% |
| Subiculum | -7084.65 | 9831.7 | 0.4767 | 1.70% | 5810.64 | 10,240.7 | 0.5747 | 1.06% |
| CA1 | -2397.39 | 6332.9 | 0.7077 | 0.48% | 1704.01 | 6628.2 | 0.7989 | 0.22% |
| Hippocampal fissure | -18,577.98 | 15,804.6 | 0.249 | 4.40% | 9033.21 | 14,267.9 | 0.5315 | 1.32% |
| Presubiculum | -9359.85 | 11,419.3 | 0.4189 | 2.19% | 5659.79 | 11,945.3 | 0.6391 | 0.74% |
| Parasubiculum | -40,687.44 | 38,772.6 | 0.3024 | 3.54% | 48,287.39 | 47,045.1 | 0.3129 | 3.39% |
| Molecular layer | -3245.06 | 7909 | 0.6845 | 0.56% | 6088.18 | 7861 | 0.4447 | 1.96% |
| GC-DG | -4136.16 | 13,725 | 0.7652 | 0.30% | 10,105.57 | 13,489.2 | 0.4596 | 1.84% |
| CA2-3 | 5.61 | 17,443.4 | 0.9997 | 0.00% | 11,014.44 | 16,481.4 | 0.5091 | 1.47% |
| CA4 | -5604.78 | 15,639.4 | 0.7226 | 0.43% | 8873.47 | 14,913.3 | 0.5563 | 1.17% |
| Fimbria | 49,010.13 | 34,488.6 | 0.1656 | 6.31% | 42,181.35 | 25,385.2 | 0.107 | 8.43% |
| HATA | -15,863.77 | 49,283.7 | 0.7498 | 0.34% | 25,248.39 | 50,768.2 | 0.6226 | 0.82% |
| Adjusted model | ||||||||
| Left hemisphere | Right hemisphere | |||||||
| Hippocampal subfield volume | Estimation | SE | p-value | r2 | Estimation | SE | p-value | r2 |
| Hippocampal tail | -262.67 | 1610.1 | 0.8719 | 63.36% | -442.54 | 2194.6 | 0.841 | 63.84% |
| Subiculum | -11.38 | 2394.7 | 0.9963 | 63.32% | 1280.59 | 2381.9 | 0.5962 | 63.79% |
| CA1 | -759.27 | 1668.5 | 0.6535 | 63.66% | -453.05 | 1511.7 | 0.7672 | 63.46% |
| Hippocampal fissure | 2176.71 | 3710.5 | 0.5634 | 63.88% | 2922.04 | 3001 | 0.3408 | 64.83% |
| Presubiculum | -1579.71 | 2845.8 | 0.5844 | 63.82% | -444.53 | 2908.8 | 0.8799 | 63.35% |
| Parasubiculum | -6741.21 | 9183.9 | 0.4707 | 64.19% | 669.03 | 11061.3 | 0.9523 | 63.32% |
| Molecular layer | -798.28 | 1688.8 | 0.6385 | 0.44% | 53.85 | 1829.4 | 0.9768 | 63.32% |
| GC-DG | -43.67 | 3325.5 | 0.9896 | 63.32% | 485.72 | 3007.3 | 0.8732 | 63.36% |
| CA2-3 | 972.92 | 4038.3 | 0.8118 | 63.41% | 1656.88 | 3642.2 | 0.6536 | 63.66% |
| CA4 | 335.03 | 3732.1 | 0.9293 | 63.33% | 623.93 | 3287.1 | 0.8512 | 63.38% |
| Fimbria | 6730.62 | 10,863.4 | 0.5419 | 63.94% | 6813.99 | 6146.1 | 0.2795 | 65.26% |
| HATA | 4301.92 | 12,218.8 | 0.7281 | 63.52% | 2259.64 | 11,651 | 0.848 | 63.38% |
In the adjusted model Age, Sex, MMSE, CIRS, Site, NPI, and time between first and last measurements were included.
ADL: Activities of daily living; CIRS: Cumulative illness rating scale; DLB: Dementia with Lewy bodies; HATA: Hippocampal–amygdaloid transition area; MMSE: Mini-mental state examination; SE: Standard error.
Discussion
To the best of our knowledge, this is the first work that examined the association of HSv and functional decline in dementia. Our results suggest differential volume patterns in AD compared with DLB, in line with previous studies, lower HSv were found in the AD group, compared with DLB [1,6]. On the other hand, none of the studied HSv at diagnosis of mild AD or DLB were associated with the functional decline.
In dementia, functional decline is one of the main outcomes for patients and clinicians [25]. Even if cognitive impairments influence functional decline [14], other non cognitive factors such as depression, fecal and urinary incontinence, frequency of exercise practicing have been taken into consideration as drivers of reduced ADL performance [26]. Besides, environmental, physical and sensory impairments may affect some of the basic ADL but not all activities [27]. Thus, the functional decline might not be explained only by atrophy of HSv in mild-stage of AD or DLB, supporting that impairments in ADL may result from several factors (i.e., functional brain changes, polypharmacy, malnutrition, sarcopenia, mobility and social issues, and other geriatric syndromes) [28,29]. Different scales of ADL should be implemented to elucidate if HSv can be related to overall functional decline rather than specific dysfunction in motor and cognitive tasks.
In dementia and aging process, HSv have been linked to certain motor and cognitive deficits. In healthy older adults, volumes of the presubiculum have been related to lower gait speed [30]. Also, the presubiculum and parasubiculum have been associated with the spatiotemporal framework and context, as part of the retrosplenial integration/movement pathway [31]. Dentate gyrus has exhibited strong relations with spatial navigation and pattern separation, and memory tasks have been mainly related to CA1, CA3 and dentate gyrus [32]. Similarly, in AD patients, volume loss in CA1 and subiculum has been associated with AD pathology, cognitive deterioration, duration and severity of dementia [33]. Bilateral damages in the CA and subiculum regions were reported in AD, but not in DLB. By contrast, DLB patients have exhibited predominant atrophy in extrahippocampal structures correlated to visuospatial abilities (i.e., perirhinal cortex and parahippocampus) particularly in the right hemisphere [34]. However, based on our results, we can suggest that impairments in overall ADL might not be the result of volume loss in one structure with multiple functions (i.e., the hippocampus), but maybe some of these activities may be related with hippocampal volumes. Therefore, further characterizations of HSv and extra hippocampal regions using specific-hippocampal sMRI protocols and various segmentation methods should be conducted since volume sparing in the medial temporal lobe is a supportive criterion for DLB diagnosis [19], but only a minority of DLB cases have pure forms of alpha-synuclein aggregation while overlapping of synucleinopathy and AD pathology (tau and amyloid-β 42) is widely presented [4], and may potentially lead to a reduction of HSv [35].
In addition to structural atrophy, functional brain changes should be considered in the study of ADL decline. In line with this, early functional brain changes (e.g., earlier cholinergic deficits) could be more important than atrophy in people diagnosed with DLB [3]. Thus, impairments in sensorimotor, occipital visual, frontoparietal and default mode networks have earlier been described [36,37] in DLB patients. All of these could be explained by an early synaptic dysfunction model which could explain clinical features and trigger later specific atrophy patterns in LBD [38]. This hypothesis should be considered for future research.
There are several strengths and limitations to our work. We included a long follow-up, an innovative approach for segmentation, aiming at patient, and clinician important outcomes such as ADL. By contrast, potential selection bias is given by recruitment in dementia referral clinics. DLB group has a high dropout rate probably due to worse prognosis that could affect follow-up adherence. Also, no control group was available for contrasting our results. Further, the automatic segmentation method has some limitations [7,39]. The method has been robustly validated against the gold standard of manual segmentation but the atlas used in FreeSurfer 6.0 segmentation has not been validated yet [40]. The use of Freesurfer 6.0 on T1-weighted MRI data also has limitations: the HSv were extracted from images acquired with a non-specific protocol for the hippocampus, and the resolution of images does not provide sufficient information to visualize inner structures such as the stratum radiatum lacunosum-moleculare, which makes up a large portion of the borders between CA and the DG, and between the subiculum and DG. This makes that the subfield measures generated may not represent the cytoarchitectonic different subfields. Estimated volumes for internal subfields such as GC-DG, CA4, and Molecular layer must be interpreted with caution. Nevertheless, FreeSurfer 6.0 provides useful information in other structures such as the fimbria and hippocampal tail, reliable at 1 mm T1 data [24]. It is crucial to note that these are widely known problems in HSv segmentations using sMRI, and even when subregions are manually segmented remain showing high variability [10]. Therefore, automatic segmentation allows reproducible methods, obtaining similar volumes using the subfield algorithm when compared with manual tracing that can be biased, labor-intensive, and time-consuming [7,10]. The inclusion of different scanners in our study may lead to inconsistent results, to account for that we added the center as a covariate in our statistical models. Previous estimations from different scanners using Freesurfer 6.0 have shown reliable results [41].
Conclusion
We conclude that in mild stages of AD or DLB, the HSv were not associated with the decline rate in ADL performance. The overall ADL scores might not be related to subfield volume loss, but individual ADL analysis may elucidate the contribution of HSv in functional decline. Both structural and functional brain techniques should be considered in the evaluation of functional decline in dementia. Aside from the fact that the hippocampus has several functions, other factors (i.e., physical, environmental and affective) may influence ADL performance rather than only early hippocampal atrophy.
Acknowledgments
We want to thank all the participants, researchers and technical staff that have made the DemVest study possible. The views expressed are those of the author(s) and not necessarily those of the NHS, the NIHR or the Department of Health and Social Care.
Footnotes
Supplementary data
To view the supplementary data that accompany this paper please visit the journal website at: www.futuremedicine.com/doi/suppl/10.2217/nmt-2020-0039
Author contributions
A Jaramillo-Jimenez: conception of work, formal analysis, methodology, visualization, writing, reviewing, editing and approval. MG Borda: conception of work, methodology, visualization, writing, reviewing, editing and approval. E Garcia-Cifuentes: preparation of the initial draft, writing, reviewing and approval. AO Vik-Mo: methodology, visualization, writing, reviewing, editing and approval. V Aarsland: preparation of the initial draft, writing, reviewing, editing and approval. DA Tovar-Rios: formal analysis, writing, reviewing, editing and approval. D Ferreira: methodology, visualization, writing, reviewing, editing, supervision and approval. D Aarsland: methodology, visualization, writing, reviewing, editing, supervision and approval. K Oppedal: methodology, visualization, writing, reviewing, editing, supervision and approval.
Financial & competing interests disclosure
This paper represents independent research supported by the Norwegian government, through hospital owner Helse Vest (Western Norway Regional Health Authority). Also, funded by the National Institute for Health Research (NIHR) Biomedical Research Centre at South London and Maudsley NHS Foundation Trust and King’s College London. The authors have no other relevant affiliations or financial involvement with any organization or entity with a financial interest in or financial conflict with the subject matter or materials discussed in the manuscript apart from those disclosed.
No writing assistance was utilized in the production of this manuscript.
Ethical conduct of research
This study was approved by the regional ethics committee (approval code: 2010/633) and the Norwegian authorities for the collection of medical data. All data were handled and kept under national health and data privacy protocols. All participants signed an informed consent form before inclusion in the study. The research was conducted ethically following the World Medical Association Declaration of Helsinki.
References
Papers of special note have been highlighted as: •• of considerable interest
- 1.Mueller SG, Schuff N, Yaffe K, Madison C, Miller B, Weiner MW. Hippocampal atrophy patterns in mild cognitive impairment and Alzheimer's disease. Hum. Brain Mapp. 31(9), 1339–1347 (2010). [DOI] [PMC free article] [PubMed] [Google Scholar]
- 2.Mak E, Su L, Williams GB. et al. Differential atrophy of hippocampal subfields: a comparative study of dementia with lewy bodies and Alzheimer disease. Am. J. Geriatr. Psychiatry 24(2), 136–143 (2016). [DOI] [PubMed] [Google Scholar]
- 3.Oppedal K, Ferreira D, Cavallin L. et al. A signature pattern of cortical atrophy in dementia with Lewy bodies: a study on 333 patients from the European DLB consortium. Alzheimers Dement. 15(3), 400–409 (2019). [DOI] [PubMed] [Google Scholar]; •• Dementia with Lewy bodies (DLB) of DemVest cohort had higher scores on all the three atrophy scales than normal controls but had less medial temporal lobe atrophy than those with Alzheimer’s disease. The most common pattern of atrophy of DLB was hippocampal-sparing.
- 4.Irwin DJ, Hurtig HI. The contribution of tau, amyloid-beta and alpha-synuclein pathology to dementia in Lewy body disorders. J. Alzheimer’s Dis. Parkinsonism 8(4), 444 (2018). [DOI] [PMC free article] [PubMed] [Google Scholar]
- 5.Adamowicz DH, Roy S, Salmon DP. et al. Hippocampal α-synuclein in dementia with lewy bodies contributes to memory impairment and is consistent with spread of pathology. J. Neurosci. 37(7), 1675–1684 (2017). [DOI] [PMC free article] [PubMed] [Google Scholar]
- 6.Mak E, Gabel S, Su L. et al. Multi-modal MRI investigation of volumetric and microstructural changes in the hippocampus and its subfields in mild cognitive impairment, Alzheimer's disease, and dementia with Lewy bodies. Int. Psychogeriatrics 29(4), 545–555 (2017). [DOI] [PMC free article] [PubMed] [Google Scholar]
- 7.Schmidt MF, Storrs JM, Freeman KB. et al. A comparison of manual tracing and FreeSurfer for estimating hippocampal volume over the adult lifespan. Hum. Brain Mapp. 39(6), 2500–2513 (2018). [DOI] [PMC free article] [PubMed] [Google Scholar]
- 8.de Schipper LJ, Hafkemeijer A, van der Grond J, Marinus J, Henselmans JML, van Hilten JJ. Regional structural hippocampal differences between dementia with lewy bodies and Parkinson's disease. J. Parkinsons. Dis. 9(4), 775–783 (2019). [DOI] [PMC free article] [PubMed] [Google Scholar]
- 9.Yassa MA, Stark SM, Bakker A, Albert MS, Gallagher M, Stark CEL. High-resolution structural and functional MRI of hippocampal CA3 and dentate gyrus in patients with amnestic Mild Cognitive Impairment. Neuroimage 51(3), 1242–1252 (2010). [DOI] [PMC free article] [PubMed] [Google Scholar]
- 10.Foo H, Mak E, Chander RJ. et al. Associations of hippocampal subfields in the progression of cognitive decline related to Parkinson's disease. NeuroImage Clin. 14, 37–42 (2016). [DOI] [PMC free article] [PubMed] [Google Scholar]
- 11.Chow N, Aarsland D, Honarpisheh H. et al. Comparing hippocampal atrophy in Alzheimer's dementia and dementia with lewy bodies. Dement. Geriatr. Cogn. Disord. 34(1), 44–50 (2012). [DOI] [PMC free article] [PubMed] [Google Scholar]
- 12.López Ruiz JR, Osuna Carrasco LP, López Valenzuela CL. et al. The hippocampus participates in the control of locomotion speed. Neuroscience 311(October), 207–215 (2015). [DOI] [PubMed] [Google Scholar]; •• The hippocampus role in sensory–motor integration was studied in rats and the strides speed changed with cerebral stimulation. The loss of neurons caused changes in the locomotion speed.
- 13.Hong S, Kim S, Yoo J. et al. Slower gait speed predicts decline in instrumental activities of daily living in community-dwelling elderly: 3-year prospective finding from living profiles of older people survey in Korea. J. Clin. Gerontol. Geriatr. 7(4), 141–145 (2016). [Google Scholar]; •• In a representative sample of Korean older adults, decreased gait speed has been evaluated and associated with dependency on instrumental activities of daily living (ADL).
- 14.Lee M-T, Jang Y, Chang W-Y. How do impairments in cognitive functions affect activities of daily living functions in older adults? PLoS ONE 14(6), e0218112 (2019). [DOI] [PMC free article] [PubMed] [Google Scholar]
- 15.Aarsland D, Rongve A, Piepenstock Nore S. et al. Frequency and case identification of dementia with Lewy bodies using the revised consensus criteria. Dement. Geriatr. Cogn. Disord. 26(5), 445–452 (2008). [DOI] [PubMed] [Google Scholar]
- 16.Linn BS, Linn MW, Gurel L. Cumulative illness rating scale. J. Am. Geriatr. Soc. 16(5), 622–626 (1968). [DOI] [PubMed] [Google Scholar]
- 17.Folstein MF, Folstein SE, McHugh PR. ‘Mini-mental state’. A practical method for grading the cognitive state of patients for the clinician. J. Psychiatr. Res. 12(3), 189–198 (1975). [DOI] [PubMed] [Google Scholar]
- 18.McKhann G, Drachman D, Folstein M, Katzman R, Price D, Stadlan EM. Clinical diagnosis of alzheimer's disease: report of the NINCDS-ADRDA work group* under the auspices of department of health and human services task force on alzheimer's disease. Neurology 34(7), 939–944 (1984). [DOI] [PubMed] [Google Scholar]
- 19.McKeith IG, Dickson DW, Lowe J. et al. Diagnosis and management of dementia with Lewy bodies: third report of the DLB consortium. Neurology 65(12), 1863–1872 (2005). [DOI] [PubMed] [Google Scholar]
- 20.Hughes CP, Berg L, Danziger WL, Coben LA, Martin RL. A new clinical scale for the staging of dementia. Br. J. Psychiatry 140(6), 566–572 (1982). [DOI] [PubMed] [Google Scholar]
- 21.Skogseth R, Hortobágyi T, Soennesyn H. et al. Accuracy of clinical diagnosis of dementia with lewy bodies versus neuropathology. J. Alzheimer’s Dis. 59(4), 1139–1152 (2017). [DOI] [PubMed] [Google Scholar]
- 22.Brækhus AEKBA. ‘Ferdigheter i dagliglivet - RDRS-2’. (2000). https://nhi.no/skjema-og-kalkulatorer/skjema/geriatripleie/ferdigheter-i-dagliglivet-rdrs-2/
- 23.Fischl B, Dale AM. Measuring the thickness of the human cerebral cortex from magnetic resonance images. Proc. Natl Acad. Sci. USA 97(20), 11050–11055 (2000). [DOI] [PMC free article] [PubMed] [Google Scholar]
- 24.Iglesias JE, Augustinack JC, Nguyen K. et al. A computational atlas of the hippocampal formation using ex vivo, ultra-high resolution MRI: application to adaptive segmentation of in vivo MRI. Neuroimage 115, 117–137 (2015). [DOI] [PMC free article] [PubMed] [Google Scholar]
- 25.Saunders S, Muniz-Terrera G, Watson J. et al. Participant outcomes and preferences in Alzheimer's disease clinical trials: the electronic person-specific outcome measure (ePSOM) development program. Alzheimer’s Dement. Transl. Res. Clin. Interv. 4, 694–702 (2018). [DOI] [PMC free article] [PubMed] [Google Scholar]
- 26.Ha E, Kim K. Factors that influence activities of daily living in the elderly with probable dementia. J. Psychiatr. Ment. Health Nurs. 21(5), 447–454 (2014). [DOI] [PubMed] [Google Scholar]; •• A third of the ADL score was determined by stroke history, frequency of exercise, urinary and fecal incontinence, and cognitive decline. The authors highlight multidisciplinary interventions to improve ADL.
- 27.Giebel CM, Sutcliffe C, Stolt M. et al. Deterioration of basic activities of daily living and their impact on quality of life across different cognitive stages of dementia: a European study. Int. Psychogeriatrics 26(8), 1283–1293 (2014). [DOI] [PubMed] [Google Scholar]; •• Impairments in each of the ADL are very variable across dementia stages. Some activities such as continence can be affected in any stage, others (i.e., bathing) in severe stages while toileting or feeding remained relatively intact.
- 28.Shah BM, Hajjar ER. Polypharmacy, Adverse Drug Reactions, and Geriatric Syndromes. Clin. Geriatr. Med. 28(2), 173–186 (2012). [DOI] [PubMed] [Google Scholar]
- 29.Borda MG, Soennesyn H, Steves CJ, Osland Vik-Mo A, Pérez-Zepeda MU, Aarsland D. Frailty in older adults with mild dementia: dementia with lewy bodies and Alzheimer's disease. Dement. Geriatr. Cogn. Dis. Extra 9(1), 176–183 (2019). [Google Scholar]; •• A frailty syndrome has been described in mild Alzheimer's disease and mild DLB patients of DemVest cohort. This frailty index is a composite of comorbidities, cognitive and neuropsychiatric features. DLB patients had a higher risk of frailty.
- 30.Ezzati A, Katz MJ, Lipton ML, Lipton RB, Verghese J. The association of brain structure with gait velocity in older adults: a quantitative volumetric analysis of brain MRI. Neuroradiology 57(8), 851–861 (2015). [DOI] [PMC free article] [PubMed] [Google Scholar]
- 31.Knierim JJ. The hippocampus. Curr. Biol. 25(23), R1116–R1121 (2015). [DOI] [PubMed] [Google Scholar]
- 32.Evans TE, Adams HHH, Licher S. et al. Subregional volumes of the hippocampus in relation to cognitive function and risk of dementia. Neuroimage 178, 129–135 (2018). [DOI] [PubMed] [Google Scholar]
- 33.Carmichael O, Xie J, Fletcher E, Singh B, DeCarli C. Alzheimer's Disease Neuroimaging Initiative. Localized hippocampus measures are associated with Alzheimer pathology and cognition independent of total hippocampal volume. Neurobiol. Aging 33(6), 1124.e31–41 (2012). [DOI] [PMC free article] [PubMed] [Google Scholar]
- 34.Delli Pizzi S, Franciotti R, Bubbico G, Thomas A, Onofrj M, Bonanni L. Atrophy of hippocampal subfields and adjacent extrahippocampal structures in dementia with lewy bodies and Alzheimer's disease. Neurobiol. Aging 40, 103–109 (2016). [DOI] [PubMed] [Google Scholar]
- 35.Burton EJ, Barber R, Mukaetova-Ladinska EB. et al. Medial temporal lobe atrophy on MRI differentiates Alzheimer's disease from dementia with Lewy bodies and vascular cognitive impairment: a prospective study with pathological verification of diagnosis. Brain 132(Pt 1), 195–203 (2009). [DOI] [PubMed] [Google Scholar]
- 36.Bonanni L, Perfetti B, Bifolchetti S. et al. Quantitative electroencephalogram utility in predicting conversion of mild cognitive impairment to dementia with Lewy bodies. Neurobiol. Aging 36(1), 434–445 (2015). [DOI] [PMC free article] [PubMed] [Google Scholar]
- 37.Aoki Y, Kazui H, Pascal-Marqui RD. et al. EEG resting-state networks in dementia with lewy bodies associated with clinical symptoms. Neuropsychobiology 77(4), 206–218 (2019). [DOI] [PubMed] [Google Scholar]
- 38.Elahi FM, Miller BL. A clinicopathological approach to the diagnosis of dementia. Nat Rev Neurol. 13(8), 457–476 (2017). [DOI] [PMC free article] [PubMed] [Google Scholar]
- 39.Whelan CD, Hibar DP, Van Velzen LS. et al. Heritability and reliability of automatically segmented human hippocampal formation subregions. Neuroimage 128, 125–137 (2016). [DOI] [PMC free article] [PubMed] [Google Scholar]
- 40.Wolf D, Fischer FU, de Flores R, Chételat G, Fellgiebel A. Differential associations of age with volume and microstructure of hippocampal subfields in healthy older adults. Hum. Brain Mapp. 36(10), 3819–3831 (2015). [DOI] [PMC free article] [PubMed] [Google Scholar]
- 41.Brown EM, Pierce ME, Clark DC. et al. Test-retest reliability of FreeSurfer automated hippocampal subfield segmentation within and across scanners. Neuroimage 210, 116563 (2020). [DOI] [PubMed] [Google Scholar]