Abstract
Neutral particle detection in high-background environments is greatly aided by the ability to easily load 6Li into liquid scintillators. We describe a readily available and inexpensive liquid scintillation cocktail stably loaded with a Li mass fraction up to 1 %. Compositions that give thermodynamically stable microemulsions (reverse-micellar systems) were explored, using a Compton spectrum quenching technique to distinguish these from unstable emulsions. Scintillation light yield and transmittance were characterized. Pulse shape discrimination (PSD) was measured using a 252Cf source, showing that electron-like and proton-like recoil events are well-resolved even for Li loading up to 1 %, providing a means of background suppression in neutron/neutrino detectors. While samples in this work were prepared with natLi (7.59 % 6Li), the neutron capture peak was clearly visible in the PSD spectrum; this implies that while extremely high capture efficiency could be achieved with 6Li-enriched material, a very inexpensive neutron-sensitive detector can be prepared with natLi.
Keywords: Capture gating, pulse shape discrimination, microemulsion, micellar phase boundary, phase separation, light yield, inverse beta decay, Li-6
1. Introduction
A common problem in low count rate experiments is poor signal-to-background ratio. A widely used technique to isolate a signal of interest in such a situation is to search for a unique coincidence between multiple components of the signal. Coincidence conditions can be imposed in the time domain, the space domain, or both. Capture gating, for instance, yields powerful background reduction in scintillation-based detectors [1, 2, 3, 4]. In such a scheme, separate gates are set for an initial particle interaction and a subsequent capture interaction. The capture can be identified by energy or, in an appropriate detector, via pulse shape discrimination (PSD) [5, 6, 7, 8]. Depending on circumstances, capture gating alone can yield background suppression of orders of magnitude. Capture gating with PSD is useful where the interaction of interest is easily confused with other signals. Particular examples include fast neutron spectroscopy and neutrino detection through Inverse Beta Decay (IBD) [9, 10, 11, 12]. In fast neutron spectrometry using typical hydrogenous scintillator-based methods, the spectrum is built by adding the energy deposition from multiple proton recoils. As the primary neutron thermalizes, recoils will decrease dramatically in energy and light output will be quenched. These low-energy events are easily confused with more frequent gamma interactions, and simple subtraction of backgrounds with the signal absent is not feasible in many applications (e.g., where the signal is always present or the production mechanism yields both neutrons and gammas). Neutrino detection through IBD suffers analogous problems; although the initial recoil positron carries the energy of the neutrino (which can be several MeV depending on application), unless the annihilation products can be isolated, neutrino events cannot easily be distinguished from Compton-scattered gammas.
In both of the previous examples, efficient detection of thermal neutrons enhances detector sensitivity. If the detector medium is doped with an appropriate isotope, neutron capture yields a unique signal. Capture times on the order of 10 μs are readily obtainable, nicely separating the capture from the prompt interaction while still effectively reducing uncorrelated backgrounds. Modern examples of both neutron spectrometers and neutrino detectors are driven to similar designs. Compact and segmented detectors are optimized for energy resolution and background rejection [10, 13, 14, 15]. In detectors with this design, neutron capture on 6Li, yielding short-range alpha and triton particles, provides the ideal, topologically compact, capture events that make discreet gating possible.
Liquid scintillators1 are particularly useful in radioactivity measurements, where a particle-emitting radionuclide can be added directly to the detection medium (‘internal’ detection). The short range of alpha and beta particles means that 4π geometry is complemented by high (100 % for alpha particles) detection efficiencies, achieving very high overall counting efficiencies.
Liquid scintillators also have properties that make them highly effective ‘external’ detectors. They are uniform without requiring the growth of a large single crystal or plastic bar, self-healing, generally less expensive than solid alternatives, efficient, and can be made to accommodate different neutron capture dopants [16, 17, 18].
Because 6Li is most typically available in a salt form (carbonate or chloride), approaches to suspending aqueous material in nonpolar organic liquid scintillators are necessary. By adding an appropriate non-ionic surfactant, or combination of surfactants, a thermodynamically-stable reverse-micellar solution, alternatively called a microemulsion, can be formed. In environmental analysis, nuclear power, and nuclear medicine settings, radionuclides are most commonly encountered as metal salts in aqueous solution. To accommodate these radioactive samples, commercially available liquid scintillators are variously optimized for aqueous loading capacity, high ionic strength, and/or PSD. Previous work on 6Li-loaded cocktails described good performance [8, 19, 20, 21], but the specific scintillators studied are no longer available. This drove the desire to find an inexpensive alternative and study its properties in the context of various expected end-uses. As a way to narrow the space of possibilities, we focused on liquid scintillators designed for radioactivity measurements with which we had previous experience.
Typically, these scintillators are engineered with various combinations of ionic and nonionic surfactants and alcohols to accommodate aqueous solutions encountered in common applications. The optimization of the specific proprietary formulations in the various scintillators leads them to exhibit significant variation in loading capacity and performance characteristics. In particular, certain formulations tolerate higher concentrations of ionic species which interact strongly with polar or ionic surfactant head groups. In order to find a formulation that provided optimal loading with good scintillation efficiency, we surveyed multiple scintillators, loading them with LiCl solutions of different concentrations. These included, HiSafe2, HiSafe3, HionicFluor, Ultima Gold, and Ultima Gold AB (all PerkinElmer, Waltham, MA)2. This initial survey, using the quench indicating parameter (QIP) as a measure of stability, indicated that Ultima Gold AB (UGAB), a scintillator designed specifically for optimal PSD, exhibited the highest LiCl loading capacity. Building on this survey, we describe here studies suggesting that LiCl-loaded UGAB (Li-UGAB) holds promise as a neutron-sensitive liquid scintillation detector.
2. Sample preparation
The maximum aqueous loading capacity for a given scintillator is expected to vary with ionic strength. In order to assure that a decrease in aqueous loading capacity caused by increased ionic strength did not limit our overall LiCl loading in the cocktail, we explored loading with a range of aqueous LiCl concentrations. Thus, we confirmed that the highest concentrations of Li in the cocktails were achieved with the highest concentration LiCl solutions.
Most samples were prepared from 8mol/L aqueous LiCl solutions because we were able to purchase a commercial solution (Sigma Aldrich, St. Louis, Missouri) at this concentration. A 10 mol/L solution was also prepared from LiCl powder (Section 2.1) to look at the possibility of using higher concentrations; while LiCl is soluble in cold water up to approximately 14 mol/L (20 mol/kg) [22, 23], we adopted the conservative limit of 10 mol/L in our studies in order to avoid any solution instabilities that might arise from small impurities.
2.1. Preparation of 10 mol/L LiCl
The 10 mol/L solution was prepared from a LiCl salt3, which was assumed to have a natural Li isotopic composition with Li atomic weight of 6.941 g/mol. The 10 mol/L solution was prepared by slow addition of distilled water to a large beaker containing a pre-weighed amount of LiCl (see online supplemental material for details). The presence of insoluble material required multiple filtration steps, but ultimately yielded a clear solution with a measured density of 1.21 g/mL at room temperature. This sample was used for all of the measurements described herein.
Another 10 mol/L LiCl solution was prepared from a Li2CO3 solution with natural Li isotopic composition. This solution was prepared as an exercise to test and refine the procedures intended for use with isotopically enriched 6Li2CO3 for the PROSPECT (Precision Reactor Oscillation and SPECTrum) experiment [24, 25]. In this case, the solution was prepared by reacting the carbonate with concentrated HCl (see online supplemental material for details), resulting in a yellow solution. The solution was passed over an anion exchange resin, removing the yellow coloration (presumably caused by Fe(III) impurities). The clear column-purified 10 mol/L LiCl solution had a measured density of 1.21 g/mL at room temperature.
2.2. Preparation of Li-loaded cocktails
To achieve a range of Li and aqueous loading fractions (fLi and faq, reported as mass fractions), aqueous solutions of LiCl were prepared at several different concentrations and added to liquid scintillator.
All additions were performed volumetrically using dispensettes (PerkinElmer, Waltham, Massachusetts; quoted accuracy of 0.5%) and micropipettes (Eppendorf, Westbury, New York; research, adjustable volume series; quoted accuracy 0.6% to 3.0%). Loading fractions, fLi and faq, are calculated from the volumes using measured densities. The uncertainties on the fLi are on the order of 3 % with the uncertainty on the LiCl concentration (as quoted by the manufacturer) in the stock solutions being the main contributor, followed by the uncertainties on the volumetric additions.
All small volume samples for quenching and spectroscopy measurements were prepared and stored in 20 mL borosilicate scintillation vials (PerkinElmer, Waltham, MA, USA). Samples were prepared to have the same total volume (scintillator plus aqueous material) in order to eliminate possible volume effects in the quenching measurements [26]. Larger volume samples for capture time and quantitative light output measurements were prepared using similar volumetric techniques, but in larger volume glass bottles (Wheaton, Millville, NJ, USA).
3. Quenching measurements
In many organic/surfactant systems the microemulsion phase is bordered on the phase diagram by a premicellar phase at lower aqueous fractions and an emulsion phase at higher aqueous fractions. Whereas microemulsions feature nanoscale aqueous reverse micelles and exhibit thermodynamic stability, emulsions feature larger aqueous domains that tend to agglomerate over time, ultimately resulting in separation into organic-rich and aqueous-rich phases [27]. We expect that the microemulsion phase will be optimal for high Li-loading and since phase boundaries can be sensitive to environmental conditions, we must assure that formulations intended for use in detectors are prepared with compositions reasonably far from phase boundaries. Thus, it is important to know where those boundaries lie.
To identify phase boundaries and assure a balance between stability and LiCl loading, we used Compton spectrum quenching, relying on QIP determinations [28], and optical transmittance and fluorescence spectroscopy to find discontinuities associated with increased scattering due to micelle formation. Further, we used a custom-built apparatus to measure light yield and PSD from Compton spectra.
3.1. Quench indicating parameters
QIPs were measured on either a Packard Tri-Carb A2500TR (PerkinElmer, Waltham, MA) or a Beckman Coulter LS6500 (Beckman Coulter, Fullerton, CA, USA). These counters are equipped with internal γ-radiation sources (133Ba and 137Cs, respectively) which produce Compton electrons in the sample. The Compton spectrum is used to derive a QIP in terms of the “special index of the transformed external standard spectrum” (tSIE; decreases with increased quenching) for the Packard counter or the Horrocks number (H#; increases with increased quenching) for the Beckman. The tSIE corresponds to the energy bin that is intersected by the extrapolation of a line drawn between the points corresponding to 20% and 10% of the total counts in the Compton spectrum, while the H# is the inflection point at the Compton edge [29].
In the experiments described herein, samples were measured over multiple cycles, with the QIPs providing a measure of sample stability. We observed a few unstable cocktails undergoing phase separation on the timescale of the experiment (Fig. 1): cocktails prone to separation (emulsions) exhibited decreased quenching over time as the more dense aqueous phase sank below the organic region being probed by the Compton source.
Figure 1:
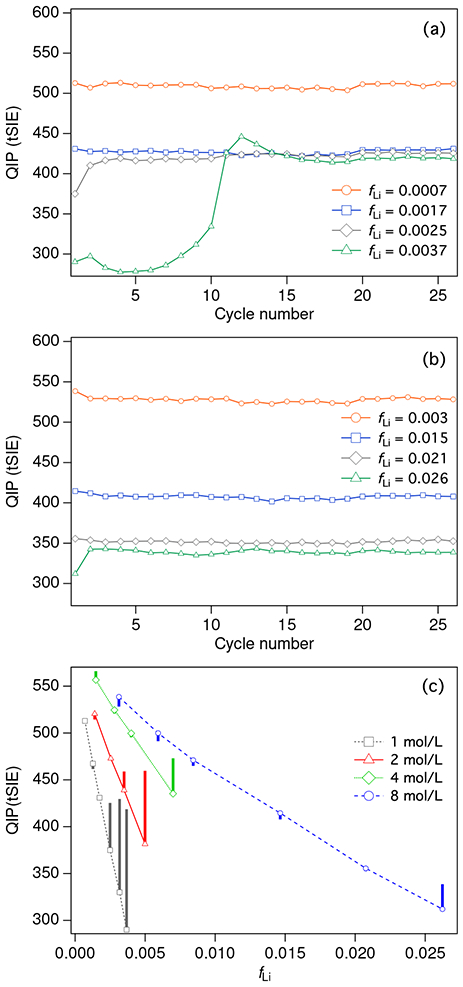
Quench indicating parameters (QIP) for different concentrations of natLiCl loaded in Ultima Gold AB. a) QIP results for cocktails prepared with 1 mol/L LiCl solution over repeated measurement cycles spanning several hours. Results are shown for different Li loading fractions, fLi. b) QIP results for 8 mol/L LiCl solution. c) QIP results vs Li loading fraction, fLi, for different concentrations of LiCl solutions. The symbols represent points from the first measurement cycle, while the vertical bars illustrate the range covered in repeat measurements. The large bars indicate unstable cocktails undergoing phase separation.
As Figure 1 illustrates, the highest concentrations of LiCl afforded the highest overall Li loading. Figure 1(a) and 1(b) show QIP results for series of Li-UGAB samples prepared with 1 mol/L and 8 mol/L LiCl solutions. In the 1 mol/L series, samples with fLi > 0.0017 (faq > 0.25) show decreased quenching over the first few measurement cycles.4 The QIP for these samples seems to converge at approximately tSIE = 425, a value similar to that for the fLi = 0.0017 sample. This may be taken as an indication of equilibration to a common saturation point where the organic phase can accommodate no more aqueous LiCl. In the 8 mol/L series, the sample with fLi = 0.026 (faq = 0.47) exhibits decreased quenching after the first measurement cycle. The samples with fLi ≤ 0.021 (faq ≤ 0.37) appear to be stable over time. The phase separated samples with fLi > 0.0017 in the 1 mol/L series or fLi = 0.026 in the 8 mol/L series exhibit the visual characteristics of a Winsor 2 type system, where a nearly pure aqueous phase is in equilibrium with a microemulsion phase [30]. In Figure 1 a, the sample with fLi = 0.0037 does not approach equilibrium monotonically, but exhibits an oscillation. This behavior was observed in several samples and appears to be a spontaneously occurring example of the curious phenomenon referred to as oscillating phase separation [31, 32, 33].
Figure 1c shows the same data for the 1 mol/L and 8 mol/L LiCl series and also includes data for 2 mol/L and 4 mol/L series. In this panel, bars indicating a wide spread in the QIP values at a given value for fLi reflect sample instability over a number of measurement cycles (as reflected in panels a and b). So, it is clear that the samples in the 2 mol/L series with fLi ≈ 0.003 and 0.005 (faq ≈ 0.25 and 0.36) are unstable, as is the sample in the 4 mol/L series with fLi ≈ 0.007 (faq ≈ 0.25). Figure 1c illustrates clearly that the highest overall Li loading is achieved with the highest concentration of LiCl.
QIP (H#) data were obtained for samples prepared with 8 mol/L and 10 mol/L LiCl solutions (Figure 2a). The data for the 8 mol/L curves are taken from two separate experiments and overlap nicely. These measurements were performed with the Beckman counter instead of the Packard, which was unavailable at the time of these experiments.
Figure 2:
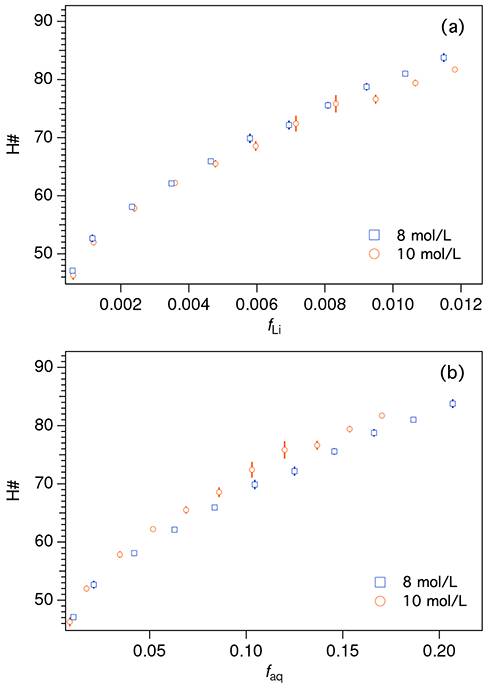
Quench indicating parameter (H#) as a function of natLiCl loading in Ultima Gold AB. Series prepared with 8 mol/L and 10 mol/L LiCl were matched for Li content, as can be clearly seen in (a). Plotting against the aqueous fraction (b) shows that the higher LiCl concentration at the same aqueous loading results in slightly higher quenching. Uncertainty bars correspond to the standard deviation on repeat QIP measurements.
The samples prepared with the 8 mol/L solution are slightly more quenched than the 10 mol/L samples with the same fLi (Figure 2a). Figure 2b plots the same data as a function of the aqueous mass fraction, faq, showing that the higher concentration of LiCl results in slightly more quenching at the same overall faq.
Finally, the data in Figure 2 are consistent with earlier measurements made with UGAB that indicated a micellar phase boundary occurring at faq ≈ 0.03 to 0.05 [34, 35, 28]. Using linear extrapolation intersection methods described previously [28], phase boundaries were identified at faq = 0.048(2) for the 8 mol/L series and at faq = 0.042(1) for the 10 mol/L series. The standard uncertainties are calculated from the combined fit uncertainties and the estimated uncertainty on sample faq. Uncertainty due to the curvature of the traces near the phase boundary (previously accounted via data assignment sensitivity (DAS)) is neglected here due to sparse sampling of the phase space near the discontinuities, so the stated uncertainties are underestimates. It is possible that higher ion concentrations promote more ordered solvent structure, pushing the phase boundary to lower faq by reducing the entropic cost of micelle formation.
3.2. Phase stability
The QIP results described in Section 3.1 indicated that some formulations are prone to phase separation. Since some emulsions can initially appear indistinguishable from microemulsions, we conducted additional experiments to probe the susceptibility of our samples to phase separation. As described in detail in a previous publication [36], we followed two matched sets of samples (prepared with 8 mol/L LiCl) over a period of 3 weeks, subjecting one set to centrifugation twice. QIPs were measured periodically to monitor for phase separation. In addition to the samples undergoing spontaneous phase separation (see Section 3.1 and Figure 1), the sample with fLi = 0.017 (faq = 0.31) separated visibly upon centrifugation. Samples with fLi ≤ 0.011 (faq ≤ 0.21) showed no phase separation and are considered stable. Stable samples stored for more than 9 months at room temperature show no visible signs of deterioration or phase separation. Additionally, samples that were sparged with inert gas and stored for more than two years showed no signs of deterioration or phase separation.
3.3. Light Yield
Light yield was determined using a small purpose-built setup with a 7.62 cm Hamamatsu R6091 Photomultiplier Tube (PMT) coupled to an acrylic vial holder with RTV-615 potting compound. The holder is a 7.62 cm right cylinder with a 2.5 cm diameter borehole along its axis to receive the vial. Vials are placed in the borehole without any additional coupling compound to ensure consistent optical properties between samples. The acrylic holder is wrapped on all surfaces with polytetrafluoroethylene (PTFE) reflectors to increase light collection efficiency. The PMT+acrylic holder is mounted upright inside a thin-walled aluminum tube with light-tight KF flanges. The system allows a convenient way to quickly swap samples contained in standard 20 mL scintillation vials in a reproducible configuration. Samples were prepared gravimetrically (15.0(1) g each) to assure consistency. Prior to measurement, each sample was stored in a reduced-oxygen environment to reduce the effects of oxygen quenching, which has been shown to be problematic in Li-loaded scintillators in the past [24]. For the measurements reported here, Li-UGAB samples were gravimetrically prepared with 8 mol/L natLiCl with fLi = 0, 0.001, 0.004, and 0.010 (faq = 0, 0.02, 0.08, and 0.21).
The PMT was powered to −1700 V, which was shown to provide an acceptable dynamic range. To ensure a stable PMT performance for each measurement, the system was allowed to warm up for approximately 5 min after initial biasing. Each sample was irradiated with a 137Cs source placed directly above the vial on the top KF flange. The same system was used for the PSD measurements (Section 5) by placing the 252Cf source to the side of the vial behind a 5 cm lead shield to reduce the gamma flux. Digitized PMT signals are integrated to determine the deposited energy in each scattering event. The spectra of the samples’ response to a 137Cs gamma source is shown in Figure 3. The relative light yield of each sample was determined by a χ2 fit of the normalized energy spectrum with a multiplicative scale factor free parameter. Light yields of the four samples were determined (see Figure 4) from the known light yield of the reference sample (11 500 ph/MeV) [24]. Total combined uncertainties in light yields are estimated to be 2 %. The data for the sample with fLi = 0 is consistent with an earlier measurement reported in [37]. These data can be combined with the QIP measurements discussed in Section 3.1 to provide a normalization and allow the interpretation of light yield as a function of loading. The light yield of the Li-UGAB sample with fLi = 0.001 is approximately 20% lower than the similarly loaded cocktail used in the PROSPECT experiment [37]. However, Li-UGAB is simpler to prepare, due to commercial availability of both LiCl and UGAB.
Figure 3:
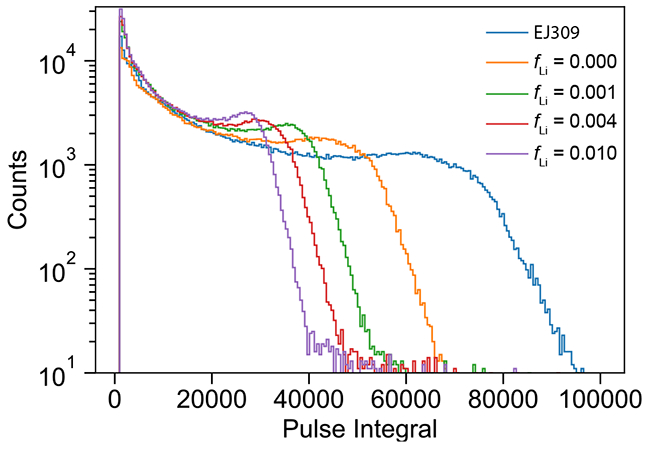
137Cs Compton spectra of UGAB samples loaded with 8 mol/L natLiCl compared to EJ-309 which has a known light yield in terms of photons per electron equivalent pulse energy (MeVee).
Figure 4:
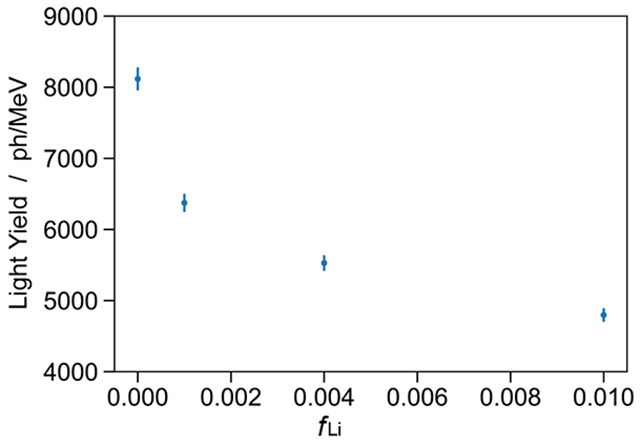
Absolute light yield in terms of photons per MeV as a function of 6Li concentration. The values and error bars are determined through a χ2 fit of spectra normalized to the EJ-309 expected spectrum.
4. Spectroscopic measurements
Transmittance (T) measurements were performed on an Hitachi U3900 UV-Vis spectrophotometer (Hitachi, Northridge, CA, USA). Samples were measured in quartz cuvettes with an air blank. The air blank is not ideal since reflection losses at the interfaces will be different for the reference and sample cells; in fact, we often saw T in excess of 100% because the difference in refractive indices between the diisopropyl naphthalene (DIN)-based cocktails and quartz is smaller than that than between air and quartz. For the purposes of comparing different cocktail compositions, however, our experimental approach was satisfactory. The sample cuvette was washed thoroughly with methyl alcohol between measurements. The sample and blank cuvettes were not exchanged so that variability from cuvette placement was minimized (i.e., only the sample cuvette was removed between each measurement). Scans were taken over the range of 350 nm to 600 nm with 1 nm resolution at a scan rate of 10 nm/s. Three repeat measurements were performed for each sample with relative standard deviations on the transmittance values < 0.2%.
Fluorescence measurements were performed with an Hitachi F7000 fluorescence spectrophotometer (Hitachi, Northridge, CA, USA). Samples were again measured in quartz cuvettes which were cleaned thoroughly with methanol between each measurement. Excitation and emission spectra were collected for each sample.
Excitation spectra were collected over a range of excitation wavelengths, λEX = 250 nm to 450 nm with an open fluorescence detection window. The excitation slit width was 1 nm and the scan rate was 4 nm/s. The excitation peak appeared to blueshift very slightly with increased Li loading, but the shift was within the instrument resolution (< 1 nm).
Emission spectra were collected with λEX = 407 nm, consistent with the peak in the excitation spectrum. The detected fluorescence wavelength was measured over a range of λEX = 350 nm to 500 nm with 1 nm slit widths for both excitation and emission and a scan rate of 4 nm/s. The maximum transmittance for Li-UGAB is reached at approximately 440 nm (Figure 5); below 400 nm, the transmittance is near zero (i.e. there is almost 100% absorbance). For our purposes, the most important region for transmittance is where the scintillator fluoresces. As Figure 5 illustrates, the peak in the fluorescence emission spectrum occurs at 425 nm; at this wavelength, all measured transmittances were > 94.5 %. Transmittance values at 500 nm, on the spectral plateau, were also always > 94.5%.
Figure 5:
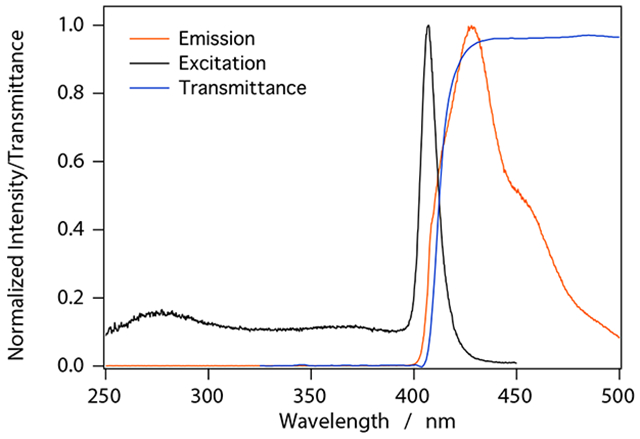
Transmittance, excitation, and emission spectra for a UGAB sample loaded with 8 mol/L natLiCl to fLi = 0.002 and faq = 0.04.
For microemulsions, the fluorescence emission spectra included significant contributions from scattering of the 407 nm excitation beam. This was confirmed by varying the excitation wavelength and observing the corresponding change in the position of the sharp feature in the fluorescence emission spectrum. To facilitate analysis, we attempted a deconvolution of the fluorescence and scattering contributions. Figure 6 shows the fluorescence emission spectrum for a UGAB sample with fLi = 0.014 (faq = 0.21). The major spectral features were fit to Gaussians using a least squares approach in order to deconvolute scattering and true fluorescence contributions. Fit residuals consistently showed that the largest mismatch occured around the scattering peak. Since the scattering peak should have a wavelength defined by the excitation slit width, a departure from Gaussian peak shape is not surprising. The amplitudes from the fits provided a much better approximation of scattering contributions than integrating under the scatter peak and so they were used in subsequent analyses (Figure 7).
Figure 6:
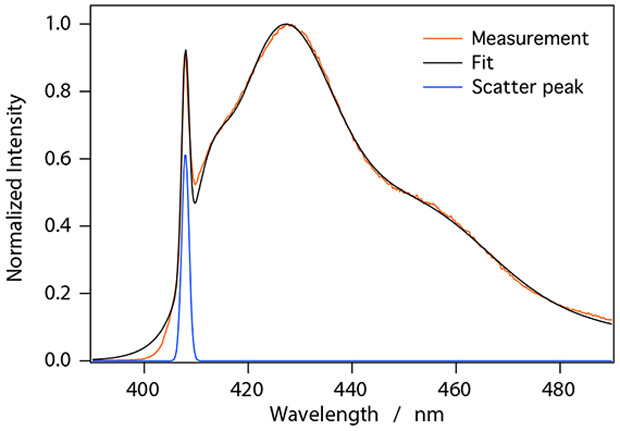
Fluorescence emission spectrum for a UGAB sample with fLi = 0.014 (faq = 0.21). The presence of reverse micelles in the samples leads to significant scattering of the excitation light (λEX = 407 nm). A least squares fit to the measurement data was used to deconvolute scattering and fluorescence contributions.
Figure 7:
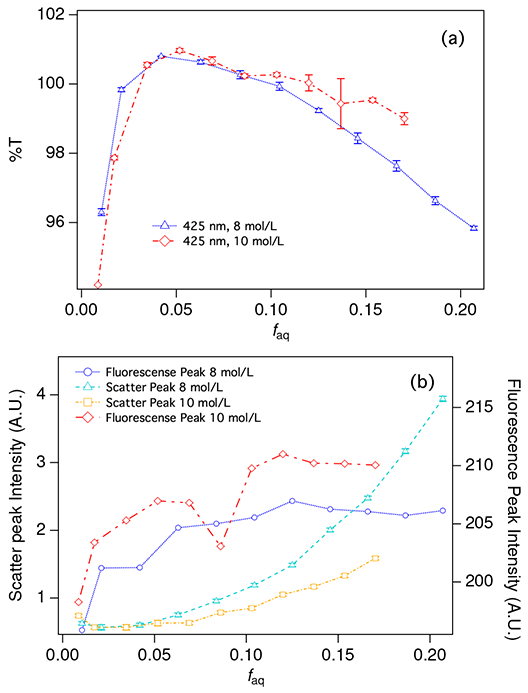
(a) Transmittance at 425 nm for a series of cocktails prepared with 8 mol/L LiCl (blue triangles) and 10 mol/L LiCl (red diamonds). Uncertainty bars show the standard deviation on three repeat measurements. (b) Total fluorescence intensity for the 8 mol/L (blue circles) and 10 mol/L (red diamonds) series and scatter intensity for the 8 mol/L (teal triangles) and 10 mol/L (yellow squares) series. Lines between points are intended only to guide the eye. Uncertainty bars represent the uncertainty of the least squares fit used to determine peak intensities (see Figure 6 and text). The left axis applies to scatter intensities while the right axis applies to fluorescence intensities. Note that samples were prepared with the same fLi in each series, so the last point in the 8 mol/L series (with higher faq) corresponds to the same fLi as the last point in the 10 mol/L series.
Figure 7 shows the dependence of transmittance, fluorescence, and scattering on faq. Figure 7a shows the measured transmittance for samples prepared with 8 mol/L and 10 mol/L LiCl solutions. The curves show two distinct regions. At low faq, transmittance increases with increasing faq. Near the phase boundary discussed above, there is a transition to a region where transmittance decreases with increasing faq.
For a sample containing a mixture of multiple absorbing substances, Beer’s law can be written in terms of transmittance (T) as
| (1) |
where ϵα,i and ϵs,i are, respectively, the absorption and scattering extinction coefficients for the ith component of the cocktail. The path length, b, comes from the 1 cm cuvette and is constant in all of our experiments. The concentration of the ith element, ci, is in practice a function of the aqueous fraction of the sample, faq. As faq increases, the concentration of the organic components of the scintillator are diluted in the cocktail. At the same time, as faq increases, the concentration of micelles and premicellar aggregates increases.
The two regions in Figure 7 a, then, can be explained simply as the dilution region, where the fluor and other organic absorbers (with relatively large ϵa,i components) are diluted, and the scattering region, where the organization of the surfactants about the added aqueous material leads to the formation of large micelles (with relatively large ϵs,i components).
Of course, this simplified picture does not suffice to quantitatively explain the data. Interactions between the components are neglected. These are important since the relative concentrations of absorbers and scatterers may at times draw from the same molecular reservoir. In addition, interactions between the components may contribute to shifts in the absorption maxima of the individual components through, e.g., exciplex formation near micellar interfaces. Finally, we have neglected terms for sample fluorescence. Still, Equation 1 reproduces the basic shape of the T v. faq curves observed in our experiments, demonstrating that dilution and scattering are the predominant (and competitive) mechanisms at play here.
The curvature of the transmittance data is due to the competition between dilution and scattering over the region between faq ≈ 0.02 to 0.06. Because of the curvature, we have not attempted the type of analysis of intersects we performed for the QIP data. The transmittance data certainly indicate a phase boundary and in a faq region consistent with the other determinations. At the highest faq, there is slight divergence of the 8 mol/L and 10 mol/L LiCl series, with the higher LiCl concentration samples exhibiting slightly higher transmittance.
Both fluorescence emission and scattering increase with faq and both show some curvature or slope discontinuity near the phase boundary at faq ≈ 0.04 (Figure 7 b). Below this threshold, there is effectively no scattering. Increased scattering above this threshold is consistent with the formation of strongly scattering reverse micelles. The absolute scatter intensities for the highest concentration samples in the 8 mol/L series are twice those with the same fLi in the 10 mol/L series. The formulations with higher LiCl concentration generally appear to scatter less 407 nm light. This is consistent with the series divergence noted in the transmittance data.
The emission intensity is a measure of the fluorescence output for excitation at 407 nm (Figure 7 b, right axis). Fluorescence emission intensity appears to increase very slightly with increased loading up to about faq = 0.1. This effect is much smaller in magnitude than the effect on scattering shown in Figure 7 b. The magnitude of change in fluorescence emission intensity is similar to the magnitude of change in transmittance (Figure 7 a). The increase in the observed fluorescence intensity may be attributed to increased transmittance of the fluorescence light. For faq > 0.1, increased scattering could be expected to produce more fluorescence light due to increased path length, but it appears that this effect is offset by reduced transmittance. Finally, the data are consistent with better transmittance of fluorescence light-presumably due to reduced scattering-for the 10 mol/L LiCl series.
The uncertainty bars in Figure 7 b represent only the uncertainty on the Gaussian fits used to estimate peak intensities. For the total fluorescence emission intensity, fit uncertainties were estimated using a Cholsky decomposition method to account for correlations in the Gaussian terms. For the fits of the scatter peaks, uncertainties of several percent appear small due to large changes over the series. Further, we expect that the total uncertainty on these intensities will be on the order of several percent and dominated by measurement systematics, especially due to sample preparation.
UGAB samples prepared with water (not aqueous LiCl) to achieve matched faq give similar results. Fluorescence quenching by LiCl is slight but observable, consistent with QIP results (see [36]). Despite this fluorescence quenching by LiCl, we find that at a given faq, the more concentrated LiCl solution produces a cocktail with better transmittance and less scattering.
5. Pulse Shape Discrimination
A 252Cf source was used to characterize the Pulse Shape Discrimination (PSD) performance of the Li-UGAB with various fLi. The source, with an approximate activity of ~ 104 Bq, was positioned approximately 20 cm from the measurement system described above (section 3.3). For each digitized waveform recorded from the PMT a Qfull was defined by integration over a window from 12 ns before to 120 ns after the half-height of the waveform’s leading edge and a Qtail as the charge integrated 40 ns to 120 ns after the leading edge half-height. A conventional tail-fraction PSD metric was then defined by Qtail/Qfull. Figure 8 shows this PSD metric plotted against electron equivalent pulse energy (MeVee). Two distinct bands are evident, the upper the result of proton-recoils from neutron scatters and the lower the result of electromagnetic interactions. Even though natural lithium was used for these studies, the peak from neutron capture on 6Li (7.5 % natural abundance) is evident. Figure 9 shows PSD in the approximate region of the neutron capture peak compared between various fLi. By fitting each peak to a Gaussian distribution and extracting the peak positions and the Full Width Half Max (FWHM) a PSD figure of merit (FOM) can be defined as peak separation divided by the sum of the peak widths. PSD performance remains good at all loading, but does fall off as expected with decreasing light yield as shown in Figure 10.
Figure 8:
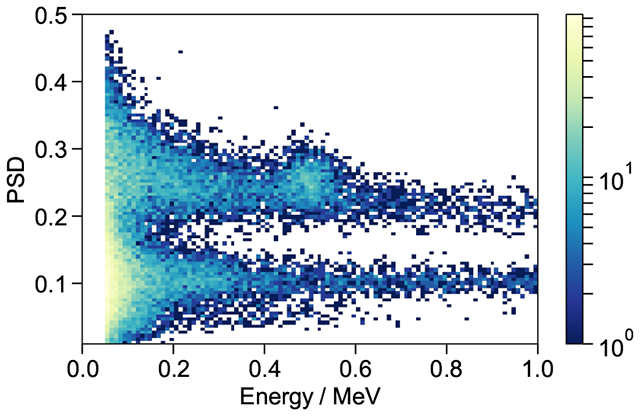
PSD (Qtail/Qtot) as function of pulse area for UGAB loaded to fLi = 0.01 natLi by mass. Excellent separation of the proton-like (upper) and electron-like (lower) recoil bands as well as a well defined capture peak at approximately 500 keVee.
Figure 9:
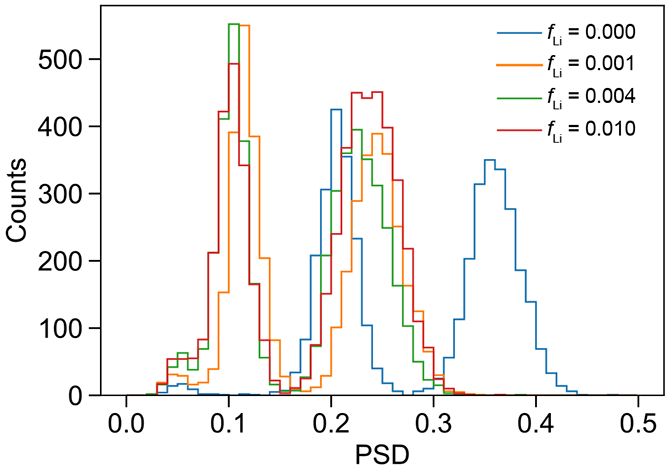
PSD (Qtail/Qtot) in the approximate region of the neutron capture peak compared between various loading levels.
Figure 10:
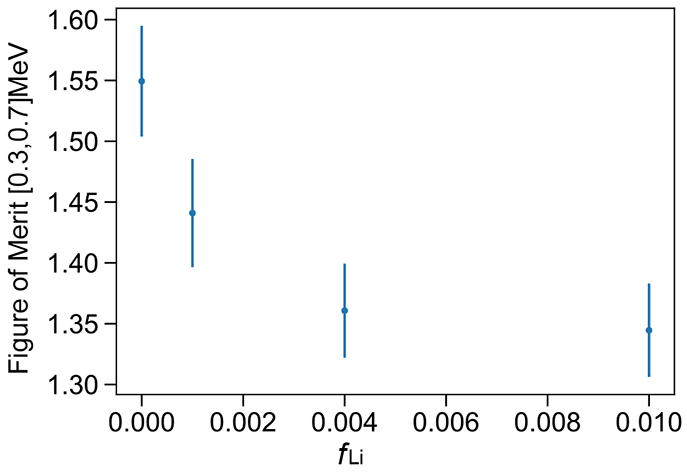
FOM (peak separation divided by the sum of the peak FWHM) in the approximate region of the neutron capture peak as a function of loading. As expected the trend closely follows the absolute light yield shown in Figure 4. The values and error bars are determined through a double-Gaussian fit of the distributions.
The effect of quenching on PSD has been discussed by Pates et al. [38] and it appears that quenching induced by the addition of aqueous material and the formation of reverse micelles is impacting the PSDs measured here. Quenching shortens both the prompt and delayed components of scintillation pulses, but the delayed component is typically quenched more. The initial decrease in PSD going from fLi = 0 to 0.001 (Figure 9) arises from the overall shortening of anode pulses with increased quenching. Figure 10 shows how increasing quenching preferentially impacts the proton-like pulses, reducing the FOM. Still, the separation between electronic-like and proton-like recoil events remains good (Figures 9 & 10). Quenching by micelles and effects of scattering on PSD are worthy of further study.
6. Conclusion
We have explored optimal loading of a liquid scintillator. We found that Ultima Gold AB (UGAB) accommodates up to 1.0 % natLi in a microemulsion phase while preserving good pulse shape discrimination characteristics. Consistent with previous work with UGAB [36], we found that the presence of LiCl has a minimal impact on the quenching expected for a given aqueous fraction. We achieved the highest Li-loading fractions with the highest concentration LiCl solutions, but did not explore concentrations higher than 10 mol/L. Optical spectrophotometry measurements hint that incremental gains in light yield due to improved transmittance might be made with higher concentrations.
The presence of LiCl does affect micellar dynamics in UGAB. The phase boundary separating the premicellar regime from the reverse micellar (microemulsion) phase appears to occur at higher faq with increasing LiCl concentration. For detector applications, compositions in the reverse micellar phase provide stable loading with high fLi. Compositions near the phase boundary are to be avoided since large changes in the optical properties (scattering, transmittance) could result from small changes in temperature or pressure, or from ionization events that would provide nucleation centers for metastable surfactant-solute clusters. For applications where lower fLi is acceptable, compositions below the micellar phase boundary may be worthy of further investigation, promising reduced scattering and thus substantially improved optical transmittance.
Pulse shape discrimination in the natLi-loaded UGAB cocktails showed clear signs of the neutron capture peak on 6Li. While natLi is only 7.59 % 6 Li [39], the extremely high Li-loading we have achieved provides enough of the neutron-sensitive isotope for good capture gating. On one hand, this implies that a very inexpensive neutron-sensitive cocktail can be prepared. On the other hand, with an investment in 6Li-enriched material, a cocktail with extremely high capture-efficiency could be prepared.
The formulation described herein is easily prepared, exhibits excellent stability, has a higher fLi than alternatives, and preserves good PSD and optical properties. Studies are needed to further establish its promise for neutron and neutrino detection.
Supplementary Material
7. Acknowledgements
We are grateful to D.A. Pushin (University of Waterloo) for assistance with preliminary measurements and contributions to the preparation of the manuscript. T.J. Langford is supported by U.S. Department of Energy (DOE) Office of Science, Office of High Energy Physics under Grants No. DE-SC0016357 and No. DE-SC0017660. Additional funding was provided by Yale University.
Footnotes
The terms “scintillator”, “scintillant”, and “cocktail” are often used ambiguously in the literature. To avoid confusion, in this paper, we use “fluor” to refer to the fluorescent molecule; we use “scintillator” to refer to the fluor with solvent, wavelength shifters, and surfactants but no added aqueous material; and “cocktail” to refer to the scintillator with added aqueous material.
Certain commercial equipment, instruments, or materials are identified in this paper to foster understanding. Such identification does not imply recommendation by the National Institute of Standards and Technology, nor does it imply that the materials or equipment identified are necessarily the best available for the purpose
Sigma product no. L9650-500G, lot no. BCBM2697V. Assay LiCl ≥ 99% (mole fraction) with the following impurities listed: , Ba ≤ 0.003%, Fe ≤ 0.001%, K ≤ 0.01%, Na ≤ 0.20%, heavy metals (as Pb) ≤ 0.002%.
In this work, fLi is reported as a mass fraction assuming a natural isotopic abundance for Li. Care should be taken when comparing compositions for scintillation cocktails prepared with solutions enriched with 6Li since using an aqueous solution of LiCl with the same concentration by mole (e.g., 10 mol/L) would give a different fLi for the same faq.
Contributor Information
D. E. Bergeron, National Institute of Standards and Technology, Gaithersburg, Maryland 20899, USA
H. P. Mumm, National Institute of Standards and Technology, Gaithersburg, Maryland 20899, USA
M. A. Tyra, National Institute of Standards and Technology, Gaithersburg, Maryland 20899, USA
J. La Rosa, National Institute of Standards and Technology, Gaithersburg, Maryland 20899, USA.
S. Nour, National Institute of Standards and Technology, Gaithersburg, Maryland 20899, USA
T. J. Langford, Wright Laboratory, Yale University, New Heaven, CT 06511, USA
REFERENCES
- [1].Czirr JB, Merrill DB, Buehler D, McKnight TK, Carroll JL, Abbott T, Wilcox E, Capture-gated neutron spectrometry, Nucl. Instrum. Methods Phys. Res, A 476 (1-2) (2002) 309–312. URL http://cds.cern.ch/record/772531 [Google Scholar]
- [2].Drake D, Feldman W, Hurlbut C, New electronically black neutron detectors, Nuclear Instruments and Methods in Physics Research Section A: Accelerators, Spectrometers, Detectors and Associated Equipment 247 (3) (1986) 576 – 582. doi: 10.1016/0168-9002(86)90419-5. URL http://www.sciencedirect.com/science/article/pii/0168900286904195 [DOI] [Google Scholar]
- [3].Czirr J, Merrill DB, Buehler D, McKnight TK, Carroll JL, Abbott T, Wilcox E, Capture-gated neutron spectrometry, Nuclear Instruments and Methods in Physics Research Section A: Accelerators, Spectrometers, Detectors and Associated Equipment 476 (1) (2002) 309 – 312, int. Workshop on Neutron Field Spectrometry in Science, Technology and Radiation Protection. doi: 10.1016/S0168-9002(01)01445-0. URL http://www.sciencedirect.com/science/article/pii/S0168900201014450 [DOI] [Google Scholar]
- [4].Aoyama T, Honda K, Mori C, Kudo K, Takeda N, Energy response of a full-energy-absorption neutron spectrometer using boron-loaded liquid scintillator bc-523, Nuclear Instruments and Methods in Physics Research Section A: Accelerators, Spectrometers, Detectors and Associated Equipment 333 (2) (1993) 492 – 501. doi: 10.1016/0168-9002(93)91197-U. URL http://www.sciencedirect.com/science/article/pii/016890029391197U [DOI] [Google Scholar]
- [5].Flynn K, Glendenin L, Steinberg E, Wright P, Pulse height-energy relations for electrons and alpha particles in a liquid scintillator, Nuclear Instruments and Methods 27 (1) (1964) 13 – 17. doi: 10.1016/0029-554X(64)90129-6. URL http://www.sciencedirect.com/science/article/pii/0029554X64901296 [DOI] [Google Scholar]
- [6].Ranucci G, Goretti A, Lombardi P, Pulse-shape discrimination of liquid scintillators, Nucl. Instrum. Meth A412 (1998) 374–386. doi: 10.1016/S0168-9002(98)00456-2. [DOI] [Google Scholar]
- [7].Sderstrm P-A, Nyberg J, Wolters R, Digital pulse-shape discrimination of fast neutrons and rays, Nuclear Instruments and Methods in Physics Research Section A: Accelerators, Spectrometers, Detectors and Associated Equipment 594 (1) (2008) 79 – 89. doi: 10.1016/j.nima.2008.06.004. URL http://www.sciencedirect.com/science/article/pii/S016890020800853X [DOI] [PMC free article] [PubMed] [Google Scholar]
- [8].Bass C, Beise E, Breuer H, Heimbach C, Langford T, Nico J, Characterization of a 6Li-loaded liquid organic scintillator for fast neutron spectrometry and thermal neutron detection, Applied Radiation and Isotopes 77 (2013) 130 – 138. doi: 10.1016/j.apradiso.2013.03.053. URL http://www.sciencedirect.com/science/article/pii/S0969804313001437 [DOI] [PubMed] [Google Scholar]
- [9].Langford T, Bass C, Beise E, Breuer H, Erwin D, Heimbach C, Nico J, Fast neutron detection with a segmented spectrometer, Nuclear Instruments and Methods in Physics Research Section A: Accelerators, Spectrometers, Detectors and Associated Equipment 771 (2015) 78 – 87. doi: 10.1016/j.nima.2014.10.060. URL http://www.sciencedirect.com/science/article/pii/S0168900214012170 [DOI] [Google Scholar]
- [10].Ashenfelter J, Balantekin AB, Band HR, Barclay G, Bass CD, Berish D, Bignell L, Bowden NS, Bowes A, Brodsky JP, Bryan CD, Cherwinka JJ, Chu R, Classen T, Commeford K, Conant AJ, Davee D, Dean D, Deichert G, Diwan MV, Dolinski MJ, Dolph J, DuVernois M, Erickson AS, Febbraro MT, Gaison JK, Galindo-Uribarri A, Gilje K, Glenn A, Goddard BW, Green M, Hackett BT, Han K, Hans S, Heeger KM, Heffron B, Insler J, Jaffe DE, Jones D, Langford TJ, Littlejohn BR, Caicedo DAM, Matta JT, McKeown RD, Mendenhall MP, Mueller PE, Mumm HP, Napolitano J, Neilson R, Nikkel JA, Norcini D, Pushin D, Qian X, Romero E, Rosero R, Seilhan BS, Sharma R, Sheets S, Surukuchi PT, Trinh C, Varner RL, Viren B, Wang W, White B, White C, Wilhelmi J, Williams C, Wise T, Yao H, Yeh M, Yen Y-R, Zangakis GZ, Zhang C, Zhang X, Collaboration TP, The prospect physics program, Journal of Physics G: Nuclear and Particle Physics 43 (11) (2016) 113001 URL http://stacks.iop.org/0954-3899/43/i=11/a=113001 [Google Scholar]
- [11].An F, An Q, Bai J, Balantekin A, Band H, Beriguete W, Bishai M, Blyth S, Brown R, Cao G, Cao J, Carr R, Chang J, Chang Y, Chasman C, Chen H, Chen S, Chen S, Chen X, Chen X, Chen X, Chen Y, Cherwinka J, Chu M, Cummings J, Deng Z, Ding Y, Diwan M, Draeger E, Du X, Dwyer D, Edwards W, Ely S, Fang S, Fu J, Fu Z, Ge L, Gill R, Gonchar M, Gong G, Gong H, Gornushkin Y, Greenler L, Gu W, Guan M, Guo X, Hackenburg R, Hahn R, Hans S, Hao H, He M, He Q, He W, Heeger K, Heng Y, Hinrichs P, Ho T, Hor Y, Hsiung Y, Hu B, Hu T, Hu T, Huang H, Huang H, Huang P, Huang X, Huang X, Huber P, Jaffe D, Jetter S, Ji X, Ji X, Jiang H, Jiang W, Jiao J, Johnson R, Kang L, Kettell S, Kramer M, Kwan K, Kwok M, Kwok T, Lai C, Lai W, Lai W, Lau K, Lebanowski L, Lee M, Leitner R, Leung J, Leung K, Lewis C, Li F, Li G, Li J, Li Q, Li S, Li W, Li X, Li X, Li X, Li Y, Li Z, Liang H, Lin C, Lin G, Lin S, Lin S, Lin Y, Ling J, Link J, Littenberg L, Littlejohn B, Liu B, Liu D, Liu J, Liu J, Liu S, Liu X, Liu Y, Lu C, Lu H, Luk A, Luk K, Luo X, Ma L, Ma Q, Ma X, Ma Y, Mayes B, McDonald K, McFarlane M, McKeown R, Meng Y, Mohapatra D, Nakajima Y, Napolitano J, Naumov D, Nemchenok H, Newsom C, Ngai H, Ngai W, Nie Y, Ning Z, Ochoa-Ricoux H, Olshevski A, Pagac A, Patton S, Pec V, Peng J, Piilonen L, Pinsky L, Pun C, Qi F, Qi M, Qian X, Rosero R, Roskovec B, Ruan X, Seilhan B, Shao B, Shih K, Steiner H, Stoler P, Sun G, Sun J, Sun Y, Tanaka H, Tang X, Torun Y, Trentalange S, Tsai O, Tsang K, Tsang R, Tull C, Viren B, Vorobel V, Wang C, Wang L, Wang L, Wang M, Wang N, Wang R, Wang W, Wang X, Wang Y, Wang Z, Wang Z, Wang Z, Webber D, Wei Y, Wen L, Wenman D, Whisnant K, White C, Whitehead L, Wilhelmi J, Wise T, Wong H, Wong J, Wu F, Wu Q, Xi J, Xia D, Xiao Q, Xing Z, Xu G, Xu J, Xu J, Xu J, Xu Y, Xue T, Yang C, Yang L, Ye M, Yeh M, Yeh Y, Young B, Yu Z, Zhan L, Zhang C, Zhang F, Zhang J, Zhang Q, Zhang S, Zhang Y, Zhang Y, Zhang Y, Zhang Z, Zhang Z, Zhang Z, Zhao H, Zhao J, Zhao Q, Zhao Y, Zheng L, Zhong W, Zhou L, Zhou Y, Zhou Z, Zhuang H, Zou J, A side-by-side comparison of daya bay antineutrino detectors, Nuclear Instruments and Methods in Physics Research Section A: Accelerators, Spectrometers, Detectors and Associated Equipment 685 (2012) 78 – 97. doi: 10.1016/j.nima.2012.05.030. URL http://www.sciencedirect.com/science/article/pii/S016890021200530X [DOI] [Google Scholar]
- [12].Allemandou N, Almázan H, del Amo Sanchez P, Bernard L, Bernard B, Blanchet A, Bonhomme A, Bosson G, Bourrion O, Bouvier J, Buck C, Caillot V, Chala M, Champion P, Charon P, Collin A, Contrepois P, Coulloux G, Desbrières B, Deleglise G, Kanawati WE, Favier J, Fuard S, Monteiro IG, Gramlich B, Haser J, Helaine V, Heusch M, Jentschel M, Kandzia F, Konrad G, Köster U, Kox S, Lahonde-Hamdoun C, Lamblin J, Letourneau A, Lhuillier D, Li C, Lindner M, Manzanillas L, Materna T, Méplan O, Minotti A, Monon C, Montanet F, Nunio F, Peltier F, Penichot Y, Pequignot M, Pessard H, Piret Y, Prono G, Quéméner G, Real J-S, Roca C, Salagnac T, Sergeyeva V, Schoppmann S, Scola L, Scordilis J-P, Soldner T, Stutz A, Tourres D, Vescovi C, Zsoldos S, The STEREO experiment, Journal of Instrumentation 13 (07) (2018) P07009 URL http://stacks.iop.org/1748-0221/13/i=07/a=P07009 [Google Scholar]
- [13].Langford T, Beise E, Breuer H, Heimbach C, Ji G, Nico J, Development and characterization of a high sensitivity segmented fast neutron spectrometer (fans-2), Journal of Instrumentation 11 (01) (2016) P01006 URL http://stacks.iop.org/1748-0221/11/i=01/a=P01006 [DOI] [PMC free article] [PubMed] [Google Scholar]
- [14].Abreu Y, Amhis Y, Arnold L, Ban G, Beaumont W, Bongrand M, Boursette D, Buhour J, Castle B, Clark K, Coupé B, Cucoanes A, Cussans D, Roeck AD, D’Hondt J, Durand D, Fallot M, Fresneau S, Ghys L, Giot L, Guillon B, Guilloux G, Ihantola S, Janssen X, Kalcheva S, Kalousis L, Koonen E, Labare M, Lehaut G, Mermans J, Michiels I, Moortgat C, Newbold D, Park J, Petridis K, Piñera I, Pommery G, Popescu L, Pronost G, Rademacker J, Reynolds A, Ryckbosch D, Ryder N, Saunders D, Shitov Y, Schune M-H, Scovell P, Simard L, Vacheret A, Dyck SV, Mulders PV, van Remortel N, Vercaemer S, Waldron A, Weber A, Yermia F, A novel segmented-scintillator antineutrino detector, Journal of Instrumentation 12 (04) (2017) P04024–P04024. doi: 10.1088/1748-0221/12/04/p04024. URL https://doi.org/10.1088%2F1748-0221%2F12%2F04%2Fp04024 [DOI] [Google Scholar]
- [15].Alekseev I, Belov V, Brudanin V, Danilov M, Egorov V, Filosofov D, Fomina M, Hons Z, Kazartsev S, Kobyakin A, Kuznetsov A, Machikhiliyan I, Medvedev D, Nesterov V, Olshevsky A, Ponomarev D, Rozova I, Rumyantseva N, Rusinov V, Salamatin A, Shevchik Y, Shirchenko M, Shitov Y, Skrobova N, Starostin A, Svirida D, Tarkovsky E, Tikhomirov I, Vlášek J, Zhitnikov I, Zinatulina D, DANSS: Detector of the reactor AntiNeutrino based on solid scintillator, Journal of Instrumentation 11 (11) (2016) P11011–P11011. doi: 10.1088/1748-0221/11/11/p11011. URL https://doi.org/10.1088%2F1748-0221%2F11%2F11%2Fp11011 [DOI] [Google Scholar]
- [16].Hayes FN, Liquid scintillators: attributes and applications, The International Journal of Applied Radiation and Isotopes 1 (1-2) (1956) 46–56. [Google Scholar]
- [17].Swank RK, Characteristics of scintillators, Annual Review of Nuclear Science 4 (1) (1954) 111–140. arXiv: 10.1146/annurev.ns.04.120154.000551, doi: 10.1146/annurev.ns.04.120154.000551. URL 10.1146/annurev.ns.04.120154.000551 [DOI] [Google Scholar]
- [18].B. J. B, Scintillation Counters, McGraw-Hill, New York; Pergamon Press, London, 1953. [Google Scholar]
- [19].Fisher B, Abdurashitov J, Coakley K, Gavrin V, Gilliam D, Nico J, Shikhin A, Thompson A, Vecchia D, Yants V, Fast neutron detection with 6Li-loaded liquid scintillator, Nuclear Instruments and Methods in Physics Research Section A: Accelerators, Spectrometers, Detectors and Associated Equipment 646 (1) (2011) 126–134. [Google Scholar]
- [20].Aleksan R, Bouchez J, Cribier M, Kajfasz E, Pichard B, Pierre F, Poinsignon J, Spiro M, Thomas J, Measurement of fast neutrons in the gran sasso laboratory using a 6Li doped liquid scintillator, Nuclear Instruments and Methods in Physics Research Section A: Accelerators, Spectrometers, Detectors and Associated Equipment 274 (1-2) (1989) 203–206. [Google Scholar]
- [21].Tanaka H, Watanabe H, 6Li-loaded directionally sensitive anti-neutrino detector for possible geo-neutrinographic imaging applications, Scientific reports 4 (2014) 4708. [DOI] [PMC free article] [PubMed] [Google Scholar]
- [22].Robinson RA, The water activities of lithium chloride solutions up to high concentrations at 25, Trans. Faraday Soc. 41 (1945) 756–758. doi: 10.1039/TF9454100756. URL 10.1039/TF9454100756 [DOI] [Google Scholar]
- [23].Seidell A, Linke W, Solubilities of Inorganic and Metal Organic Compounds, 3rd Edition, Van Nostrand, 1940. [Google Scholar]
- [24].Ashenfelter J, Balantekin A, Band H, Bass C, Bergeron D, Berish D, Bignell L, Bowden N, Brodsky J, Bryan C, Reyes CC, Campos S, Cherwinka J, Classen T, Conant A, Davee D, Dean D, Deichert G, Perez RD, Diwan M, Dolinski M, Erickson A, Febbraro M, Foust B, Gaison J, Galindo-Uribarri A, Gilbert C, Hackett B, Hans S, Hansell A, Hayes B, Heeger K, Insler J, Jaffe D, Jones D, Kyzylova O, Lane C, Langford T, LaRosa J, Littlejohn B, Lu X, Caicedo DM, Matta J, McKeown R, Mendenhall M, Mueller P, Mumm H, Napolitano J, Neilson R, Nikkel J, Norcini D, Nour S, Pushin D, Qian X, Romero-Romero E, Rosero R, Sarenac D, Surukuchi P, Tyra M, Varner R, Viren B, White C, Wilhelmi J, Wise T, Yeh M, Yen Y-R, Zhang A, Zhang C, Zhang X, Lithium-loaded liquid scintillator production for the PROSPECT experiment, Journal of Instrumentation 14 (03) (2019) P03026–P03026. doi: 10.1088/1748-0221/14/03/p03026. URL https://doi.org/10.1088%2F1748-0221%2F14%2F03%2Fp03026 [DOI] [Google Scholar]
- [25].Ashenfelter J, Balantekin A, Baldenegro C, Band H, Bass C, Bergeron D, Berish D, Bignell L, Bowden N, Boyle J, Bricco J, Brodsky J, Bryan C, Telles AB, Cherwinka J, Classen T, Commeford K, Conant A, Cox A, Davee D, Dean D, Deichert G, Diwan M, Dolinski M, Erickson A, Febbraro M, Foust B, Gaison J, Galindo-Uribarri A, Gilbert C, Gilje K, Glenn A, Goddard B, Hackett B, Han K, Hans S, Hansell A, Heeger K, Heffron B, Insler J, Jaffe D, Ji X, Jones D, Koehler K, Kyzylova O, Lane C, Langford T, LaRosa J, Littlejohn B, Lopez F, Lu X, Caicedo DM, Matta J, McKeown R, Mendenhall M, Miller H, Minock J, Mueller P, Mumm H, Napolitano J, Neilson R, Nikkel J, Norcini D, Nour S, Pushin D, Qian X, Romero-Romero E, Rosero R, Sarenac D, Seilhan B, Sharma R, Surukuchi P, Trinh C, Tyra M, Varner R, Viren B, Wagner J, Wang W, White B, White C, Wilhelmi J, Wise T, Yao H, Yeh M, Yen Y-R, Zhang A, Zhang C, Zhang X, Zhao M, The prospect reactor antineutrino experiment, Nuclear Instruments and Methods in Physics Research Section A: Accelerators, Spectrometers, Detectors and Associated Equipment 922 (2019) 287 – 309. doi: 10.1016/j.nima.2018.12.079. URL http://www.sciencedirect.com/science/article/pii/S0168900218318953 [DOI] [Google Scholar]
- [26].Collé R, Cocktail mismatch effects in 4πβ liquid scintillation spectrometry: implications based on the systematics of 3H detection efficiency and quench indicating parameter variations with total cocktail mass (volume) and H2O fraction, Applied Radiation and Isotopes 48 (6) (1997) 833–842. [Google Scholar]
- [27].Adamson AW, Gast AP, Physical Chemistry of Surfaces, 6th Edition, Wiley, 1997. [Google Scholar]
- [28].Bergeron DE, Identification of phase boundaries in surfactant solutions via compton spectrum quenching, The Journal of Physical Chemistry A 118 (37) (2014) 8563–8571. [DOI] [PubMed] [Google Scholar]
- [29].L’Annunziata MF, Handbook of radioactivity analysis, Academic Press, 2012. [Google Scholar]
- [30].Zana R, Microemulsions, Heterogeneous Chemistry Reviews 1 (2) (1994) 145–157. [Google Scholar]
- [31].Vollmer D, Strey R, Vollmer J, Oscillating phase separation in microemulsions. I. Experimental observation, Journal of Chemical Physics 107 (1997) 3619–3626. [Google Scholar]
- [32].Vollmer J, Vollmer D, Strey R, Oscillating phase separation in microemulsions. II. Description by a bending free energy, Journal of Chemical Physics 107 (1997) 3627–3633. [Google Scholar]
- [33].Vollmer J, Vollmer D, Cascade nucleation in the phase separation of amphiphilic mixtures, Faraday Discussions 112 (1998) 51–62. [Google Scholar]
- [34].Zimmerman BE, Collé R, Standardization of 63Ni by 4πβ liquid scintillation spectrometry with 3H-standard efficiency tracing, Journal of research of the National Institute of Standards and Technology 102 (4) (1997) 455. [DOI] [PMC free article] [PubMed] [Google Scholar]
- [35].Bergeron DE, Determination of micelle size in some commercial liquid scintillation cocktails, Applied Radiation and Isotopes 70 (9) (2012) 2164–2169. [DOI] [PubMed] [Google Scholar]
- [36].Bergeron DE, Mumm HP, Tyra MA, Phase stability and lithium loading capacity in a liquid scintillation cocktail, Journal of Radioanalytical and Nuclear Chemistry 314 (2) (2017) 767–771. doi: 10.1007/s10967-017-5341-8. URL 10.1007/s10967-017-5341-8 [DOI] [PMC free article] [PubMed] [Google Scholar]
- [37].Ashenfelter J, Balantekin A, Band H, Bass C, Bergeron D, Berish D, Bowden N, Brodsky J, Bryan C, Telles AB, Cherwinka J, Classen T, Commeford K, Conant A, Davee D, Deichert G, Diwan M, Dolinski M, Erickson A, Foust B, Gaison J, Galindo-Uribarri A, Gilje K, Hackett B, Han K, Hans S, Hansell A, Heeger K, Heffron B, Insler J, Jaffe D, Jones D, Kyzylova O, Lane C, Langford T, LaRosa J, Littlejohn B, Lopez F, Caicedo DM, Matta J, McKeown R, Mendenhall M, Minock J, Mueller P, Mumm H, Napolitano J, Neilson R, Nikkel J, Norcini D, Nour S, Pushin D, Qian X, Romero-Romero E, Rosero R, Surukuchi P, Trinh C, Tyra M, Wagner J, White C, Wilhelmi J, Wise T, Yeh M, Yen Y-R, Zhang A, Zhang C, Zhang X, Performance of a segmented 6Li-loaded liquid scintillator detector for the PROSPECT experiment, Journal of Instrumentation 13 (06) (2018) P06023–P06023. doi: 10.1088/1748-0221/13/06/p06023. URL https://doi.org/10.1088%2F1748-0221%2F13%2F06%2Fp06023 [DOI] [Google Scholar]
- [38].Pates J, Cook G, MacKenzie A, Passo C Jr., Quenching and its effect on alpha/beta separation liquid scintillation spectrometry, Radiocarbon (1996) 75–85. [Google Scholar]
- [39].Coplen Tyler B, Böhlke John K, De Bièvre P, Ding T, Holden NE, Hopple JA, Krouse HR, Lamberty A, Peiser HS, Revesz K, Rieder SE, Rosman KJR, Roth E, Taylor PDP, Vocke RD, Xiao YK, Isotope-abundance variations of selected elements (iupac technical report), Pure and Applied Chemistry 74 (10) (2002) 1987–2017. [Google Scholar]
Associated Data
This section collects any data citations, data availability statements, or supplementary materials included in this article.


