Abstract
Despite the vital role of mechanical forces in biology, no technique has been reported to image cellular force with sub-100 nm resolution. Here, we present tension-PAINT (tPAINT), integrating molecular tension probes with the DNA-PAINT technique to map pN mechanical events with ~25 nm resolution. To perform live-cell dynamic tension imaging, we engineered reversible probes with a cryptic docking site revealed only when the probe experiences forces exceeding a defined mechanical threshold (~7–21 pN). Additionally, we report a second type of irreversible tPAINT probe that exposes its cryptic docking permanently and thus integrates force history over time, offering improved spatial resolution in exchange for temporal dynamics. We applied both types of tPAINT probes to map integrin receptor forces in live human platelets and mouse embryonic fibroblasts. Importantly, tPAINT revealed a link between platelet forces at the leading edge of cells and the dynamic actin-rich ring nucleated by the Arp2/3 complex.
Introduction:
Mechanical forces are vital to biology, regulating diverse processes including early development, platelet activation and immune function1–3. Force magnitude, orientation, and dynamics influence cellular signaling outcomes. Interestingly, force-transducing structures, such as filopodia, focal adhesions, and the cellular cytoskeleton, are organized at the nanoscale and likely apply dynamic forces with nanoscale organization4, 5. To better understand how mechanical forces are coupled to biochemical signaling pathways, methods are needed to map the nanoscale distribution of forces in living cells. However, to our knowledge, no technique is currently capable of dynamically mapping pN-scale forces with sub-100 nanometer resolution.
We and others have developed different types of molecular tension probes to map the pN forces applied by cells6–9. The most sensitive tension probes are comprised of a DNA stem-loop hairpin flanked by a fluorophore-quencher pair10, 11. Receptor forces unfold the stem-loop, separating the fluorophore from the quencher and producing a 20100 fold increase in fluorescence10. In principle, one could directly image these probes using super-resolved imaging techniques such as STORM, PALM, STED, or SIM which routinely generate sub-diffraction images of biological structures12; however, quenching processes and photobleaching make this technically challenging (Supplementary Note 1). In contrast, DNA points accumulation for imaging in nanoscale topography (DNA-PAINT), has demonstrated the ability to resolve single molecular complexes at ~5 nm spatial resolution13–16. DNA-PAINT leverages transient binding of fluorophore-tagged “imager” strands to complementary DNA “docking” sequences to produce fluorescence blinking events amenable to single-molecule localization (Supplementary Fig. 1)15. Moreover, DNA-PAINT is robust to photobleaching and amenable to gentle-live cell imaging conditions, making it suitable for capturing dynamic mechanical events. Theoretically, DNA-PAINT is also compatible with DNA tension probes because mechanical unfolding of the stem-loop reveals single stranded DNA that could function as the docking sequence.
Results:
To adapt our previously reported DNA-based molecular tension probes10 for use with DNA-PAINT, we encoded a cryptic docking sequence within the stem region of the hairpin (Supplementary Table 1, Supplementary Fig. 2, Supplementary Note 1) and performed DNA-PAINT measurements with this construct. To our surprise, DNA-PAINT performed poorly in imaging forces using the conventional stem-loop probe (Extended Data Fig. 1).
One potential reason for this poor performance is the mechanically strained nature of the docking sequence. Force spectroscopy studies show that mechanical strain creates a barrier for hybridization17. Accordingly, we developed a model17, 18 to explore the kinetics of imager hybridization to docking sites experiencing forces from 1–50 pN. Consistent with our observation, the model predicts that mechanical forces can impede imager binding (Extended Data Fig. 1, Supplementary Note 2). Therefore, we designed and synthesized a strain-free tension-PAINT (sf-tPAINT) sensor to funnel mechanical force away from the docking site after probe opening (Fig. 1a, b, Supplementary Note 1, Supplementary Fig. 2, Extended Data Fig. 1). In this new design, the sf-tPAINT sensor functions as a force-triggered switch, exposing an unstrained cryptic docking sequence when receptor force, F, exceeds the probe F1/2, which is defined as the equilibrium F that produces a 50% probability of unfolding. To test this design, we coated coverslips with cyclic-Arg-Gly-Asp (cRGD) sf-tPAINT probes labeled with Cy3B/BHQ2 and seeded human platelets onto these substrates. We used human platelets as a model because of their small size (2– 5 μm), and the intimate link between mechanical forces and their clotting functions19–21. The Cy3B/BHQ2-sf-tPAINT probes reported platelet tension, and showed similar performance to conventional hairpin tension probes (Extended Data Fig. 1, Supplementary Fig. 3).
Figure 1: Super resolved, live-cell imaging of integrin tension.
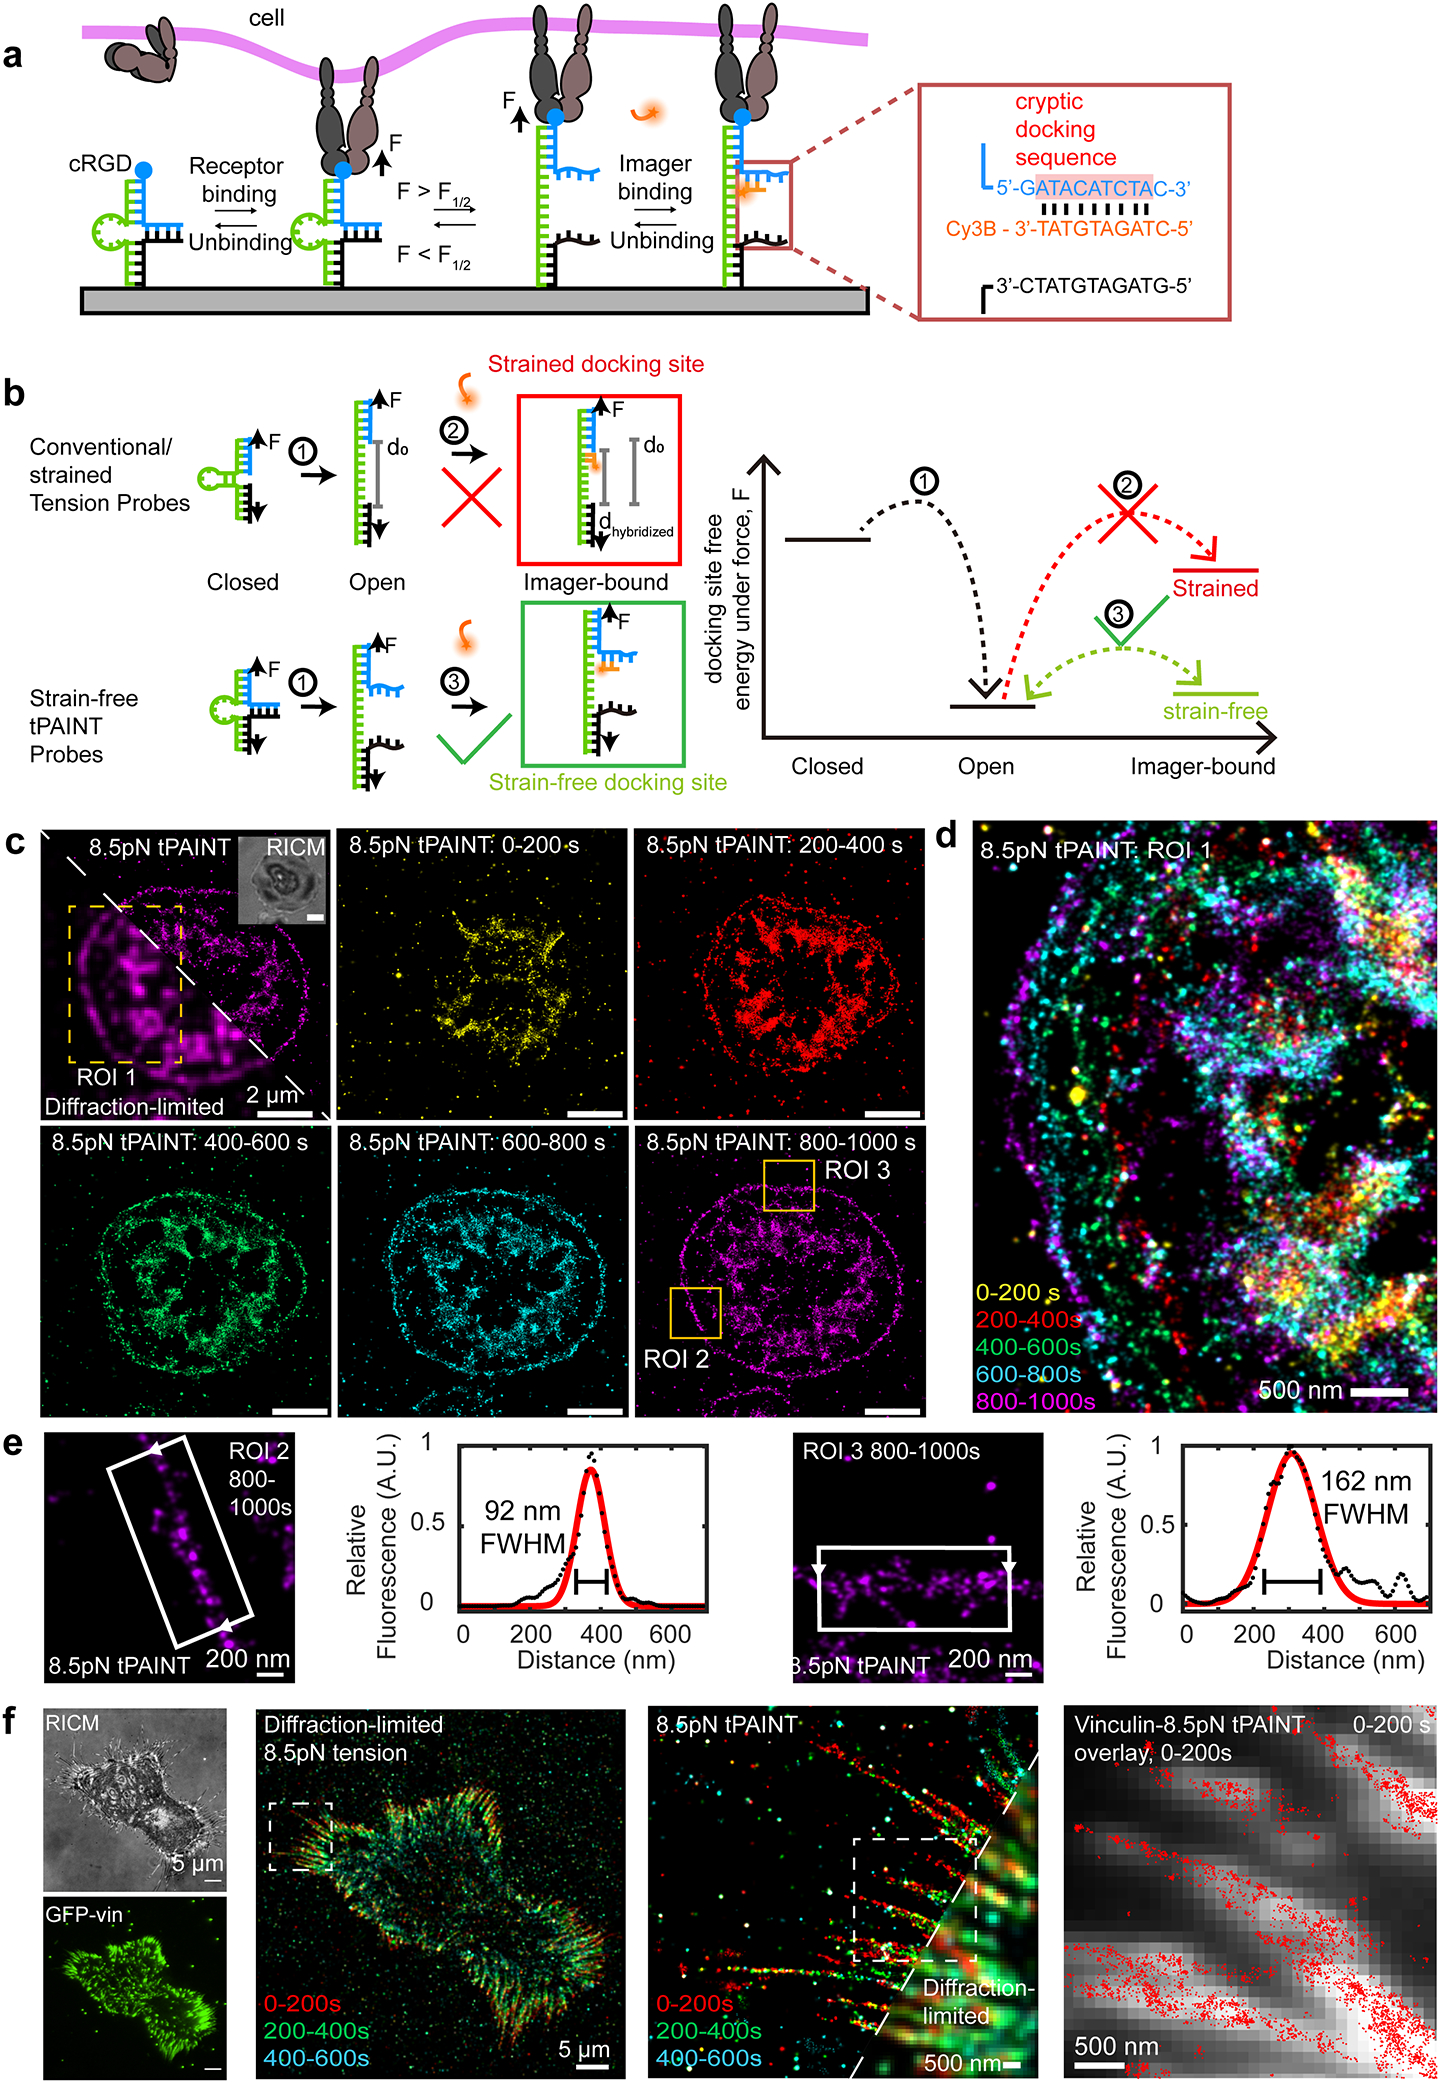
(a) Real time sf-tPAINT probes are comprised of a ligand (blue) and an anchor (black) strand held together using a load-bearing loop strand (green). When F >F1/2, the stem opens, exposing a cryptic docking site for imager binding (orange). If F < F1/2, then the probe refolds, and the docking site is concealed. (b) Schematic and energy diagram comparing imager binding to conventional (strained) tension probes and sf-tPAINT probes. (c) Timeseries showing sf-tPAINT of 8.5 pN integrin forces during the process of platelet activation. Reflection interference contrast microscopy (RICM) is shown in the inset. The first frame shows a diffraction-limited/tPAINT overlay of the 800–1000s time bin. (d) Color-coded timeseries showing dynamics of lamellipodial tension during spreading (ROI 1 indicated by dotted box). (e) Representative zoom-ins of lamellipodial edge tension along with line scans reporting FWHM of a gaussian fit to a greyscale rendering of sf-tPAINT (800–1000 sec time bin). (f) sf-tPAINT image of the 8.5 pN MEF integrin tension. Image time bins are color-coded. GFP-vinculin fluorescence colocalizes with sf-tPAINT single molecule localizations. The data shown are representative of n = 3 independent platelet experiments from 3 different donors (8 images) and n = 4 fibroblast experiments (10 images).
Having validated that the sensor is functional in widefield microscopy, we next performed tPAINT on human platelet forces with sf-tPAINT probes lacking Cy3B-BHQ2 (Fig. 1c, d). Cells spread rapidly on the substrate, and upon addition of 10 nM Cy3B imager in cell imaging media, single molecule fluorescence spots were observed under the cell-surface contact area (Supplementary Video 1). Platelets were imaged in TIRF excitation mode at 5 Hz for 12 min. Localization of single Cy3B molecules using the Picasso software suite14 revealed super-resolved maps of platelet 8.5 pN integrin forces (Fig. 1c, d, Extended Data Fig. 2). Additionally, the sf-tPAINT probe outperformed probes with strained docking sites, providing empirical support to our biophysical modeling (Supplementary Note 2, Extended Data Fig. 1).
Integrin-ligand bond lifetimes are reported to be 0.1–20 seconds under force22, 23, which will lead to undersampling of mechanically strained probes in tPAINT (Supplementary Note 3). To reduce this effect, we employed the recently-developed speed-optimized PAINT strategy24 which maximizes the on-rate of imager sampling, thus better capturing short-lived mechanical events. Therefore, the data shown in Fig. 1c was collected with Tyrode’s buffer supplemented with 37.5 mM Mg2+, producing ~4-fold more localizations, and a signal-to-background ratio of 10 (Supplementary Fig. 4, Extended Data Fig. 3, Fig. 1c, d). This allowed us to create a timelapse of platelet mechanics where each frame integrated 200 sec of single molecule localizations (Fig. 1c, d). Upon initial contact with the surface, cells spread (as observed by RICM) and then formed a “ring” pattern of tension at the lamellipodial edge (Fig. 1c, d). The mechanical ring was highly dynamic, translocating 185 +/− 75 nm over ~2–5 min (Supplementary Fig. 5). We quantified the ring width as 150 +/− 80 nm (8 cells, n = 3 experiments, Supplementary Fig. 5). Two representative linescans are provided in Fig. 1e, demonstrating that the ring can be as thin as 90nm. Additionally, we confirmed that the movement of the tPAINT signal coincides with the spread of the cell leading edge (Extended Data Fig. 4).
To demonstrate the generality of tPAINT, we imaged mouse embryonic fibroblasts stably expressing GFP-vinculin (MEF-GFP-vinculin) via tPAINT. Fibroblasts spread and formed focal adhesions (Fig. 1f). Following the addition of 10 nM Cy3B-imager in media supplemented with 75 mM Mg2+, we imaged the cell in TIRF excitation mode at 5 Hz to produce super-resolved maps of integrin tension (Fig. 1f, Extended Data Fig. 2). Tension was associated with focal adhesions and generally extended slightly beyond the distal tip of the focal adhesion footprint (Supplementary Fig. 3, Extended Data Fig. 4), a finding consistent with previous diffraction-limited molecular tension measurements25, and with TFM measurements that found that the centroid of focal adhesion traction stresses was ~1μm closer to the cell edge than the centroid of the focal adhesion itself26. Additionally, the number of tPAINT localizations was positively correlated with focal adhesion size and adhesion aspect ratio (Supplementary Fig. 6). We also confirmed that tPAINT is compatible with recent advances in computational super-resolution microscopy27 by performing simultaneous tPAINT and SRRF (Supplementary Fig. 3), demonstrating a close connection between tPAINT localizations and GFP-vinculin.
To further accelerate the imager sampling rate of mechanically-opened tPAINT probes, we screened different sf-tPAINT probe sequences based on speed-optimized24 DNA-PAINT (Extended Data Fig. 5). Sequence optimized probes enabled measurement of filopodial dynamics, revealed 100–200 nm lateral movement of a fibroblast filopodium over 1–2 minutes, and enabled measurement of the dynamics of filopodia retraction across a 180 sec imaging window (Supplementary Fig. 7).
We found that the background signal was specific to the correct imager-sequence, confirming that thermal breathing or probe impurities produce a small population of transiently open probes (Extended Data Fig. 6, Supplementary Note 3). To address this issue, an imager kinetic filter and a Voronoi tessellation-based density filter28 were used to suppress background (Extended Data Fig. 7). A detailed description of the filtering algorithm is provided in the online methods.
The “ring”-like mechanical pattern of platelet integrin forces was consistent with the dimensions of high-density actin bundles that accumulate at the cell edge as observed by electron microscopy and fluorescence microscopy29–31. However, no technique is currently capable of sub-100 nm mapping of both traction forces and protein assemblies generating those forces. To address this critical need, we exploited multiplexed super-resolution imaging (Exchange-PAINT15) which switches out the imagers to super-resolve different targets. tPAINT was used to image 14 pN platelet integrin tension, then cells were fixed and stained with DNA-tagged phalloidin to allow Exchange-PAINT visualization of the actin cytoskeleton (Fig. 2a–d). The data showed a thin (330 +/− 60nm) ring of dense F-actin at the lamellipodial edge (Fig. 2c–f, 7 platelets from 2 donors). Tension at the leading cell edge was highly coupled with this F-actin rim (Fig. 2e, white arrow); however, in some regions the tension lagged behind the F-actin edge (Fig. 2e, triangle). Since the cell edge protruded rapidly in some cases (white arrow, Fig. 2d, e), it is possible that regions where the tension lagged behind the actin rim are areas of rapid actin polymerization in which the tension has not yet advanced to the ring edge (Fig. 2e, white arrow).
Figure 2: Platelet lamellipodial ring tension is driven by a thin ring of polymerizing actin.
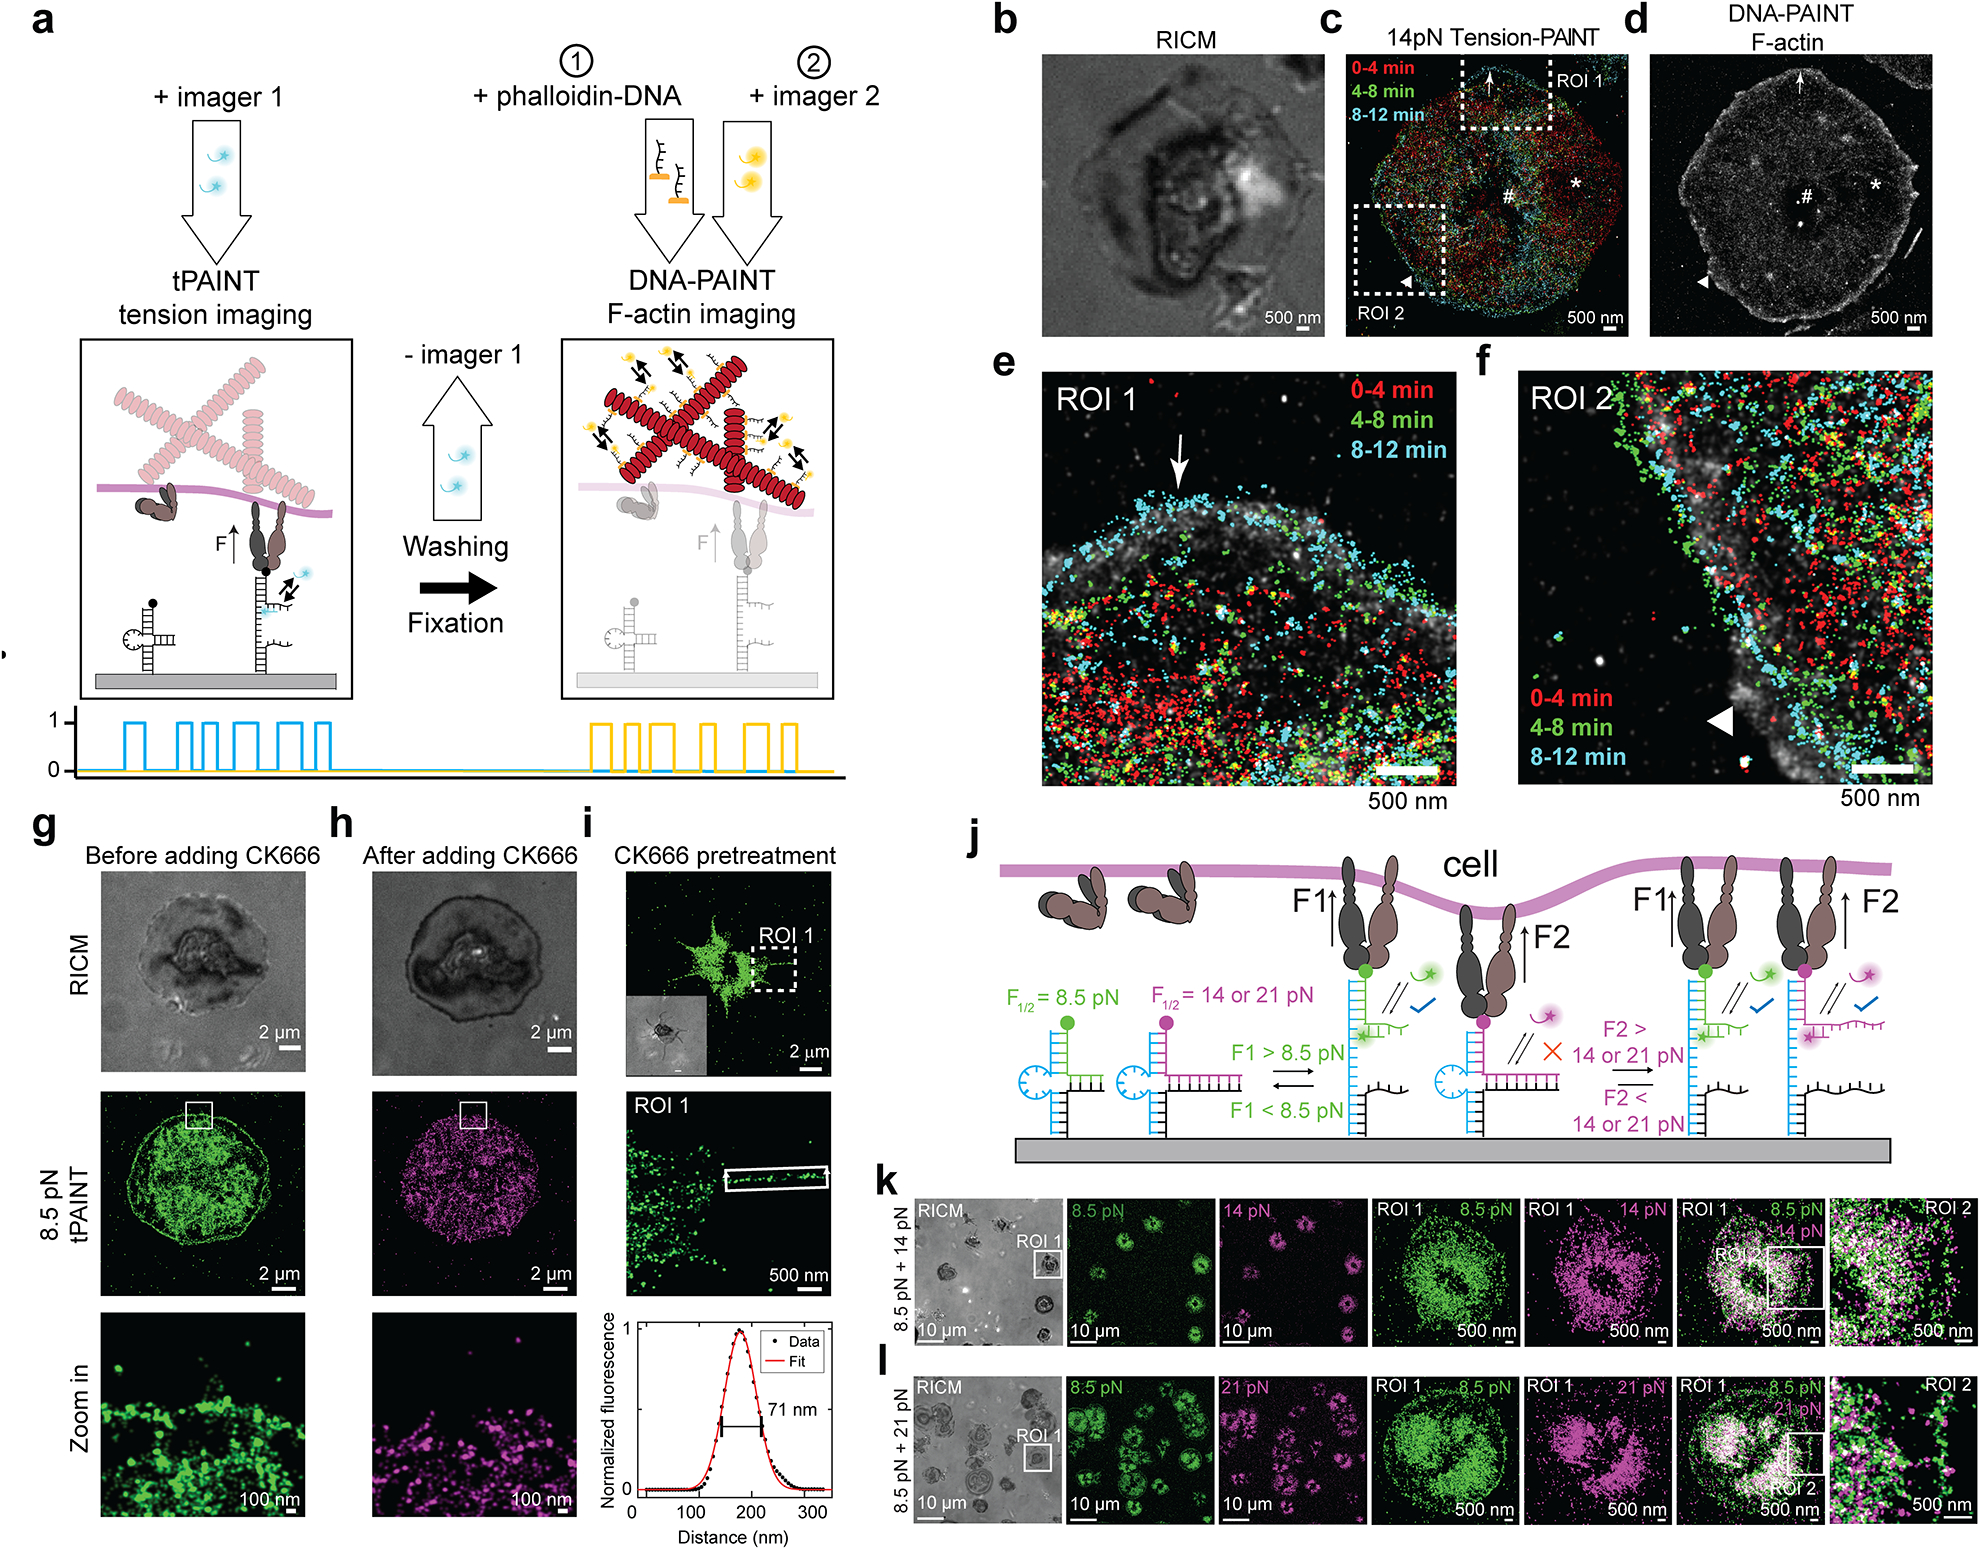
(a) Platelet 14 pN integrin tension was imaged before fixation, staining, and Exchange-PAINT to super-resolve the platelet actin cytoskeleton. (b) RICM, (c) time-resolved 14pN tension-PAINT, and (d) F-actin stained with DNA-tagged phalloidin. (e-f) Zoom in of tension at the lamellipodial edge reveals close association between tension and actin (arrow). In some regions, actin polymerization extends beyond tension (triangle). Note that an area of depleted actin (*) corresponds to an area where tension receded after 4 min. The # indicates a fiducial marker. Actin-tension data is representative of 7 platelets from n = 2 independent experiments. Note that tension-actin localizations use higher contrast for tension than F-actin because F-actin localization density is higher than tension localization density. (g-h) Treatment with the Arp2/3 inhibitor CK666 removes platelet lamellipodial edge tension (2 platelets) or prevents lamellipodial edge tension (7 platelets) (9 platelets total from n = 2 independent experiments) (i) Platelets pretreated with 50 μM CK666 spread slowly, utilize filopodia to engage with the cRGD substrate, and do not exhibit lamellipodial edge tension (18 platelets from n = 3 independent experiments). (j) Force-multiplexed tPAINT is possible by coating surfaces in two probes with F1/2 of 8.5 and 14 or 21pN, (k-l) and reveals that lamellipodial edge tension exceeds 14pN, but does not frequently exceed 21pN. Integrin tension in the center of platelets exceeds 21pN. The data shown in Inhibition studies and force-multiplexed tPAINT are representative of n = 3 independent experiments.
We posited that the cell edge tension is driven by Arp2/3-mediated branching actin polymerization, as loss of branching polymerization causes platelets to lose lamellipodia32, and Arp2/3 localizes to the lamellipodial edge of spreading platelets33. Treating platelets with 50 μM CK666 (an Arp2/3 inhibitor), abolished platelet lamellipodial rim tension in 2 platelets, while 7 other platelets failed to develop lamellipodial ring tension (9 platelets from n = 2 experiments, Fig. 2g–h, Extended Data Fig. 8). The spatially selective action of Arp2/3 inhibition can only be resolved using tPAINT as the tension-ring structure is ~150 nm wide, not detectable using state-of-art TFM (Supplementary Table 4, Supplementary Fig. 8). Pretreating platelets with 50 μM CK666 for 30 min prior to seeding slowed platelet spreading, abolished the formation of the rim tension, and often produced platelets with prominent filopodia (Fig. 2i, Extended Data Fig. 8). Treating platelets with the myosin light chain kinase (MLCK) inhibitor ML-7 led to a decrease in 8.5 pN mechanical events across the entire cell footprint, including in the cell center (Extended Data Fig. 8). Finally, we performed two-color force-multiplexed tPAINT (Fig. 2j) to characterize spatial variations in platelet forces and found that the lamellipodial edge tension is generally less than 21 pN (Fig. 2k–l), further distinguishing force generation at the edge from the platelet body.
Even when utilizing speed-optimized PAINT (elevated Mg2+ and sequence optimized probes), tPAINT will not fully record all receptor-mediated mechanical events. To eliminate undersampling of mechanically opened probes, we employed DNA tension probes that rupture irreversibly under force. These probes, inspired by the tension gauge tether (TGT) originally developed by Wang and Ha34, enable accumulated-tPAINT imaging (Fig. 3a). Accumulated-tPAINT probes were comprised of a DNA duplex with one oligonucleotide anchored to the substrate while the other is modified with cRGD. The anchored strand also contained a cryptic 9-bp docking sequence. The probe ruptures irreversibly when F exceeds the mechanical stability of the duplex (Ttol), exposing a cryptic docking sequence and allowing imager binding (Fig 3a). Because these duplexes rupture irreversibly, imagers repeatedly sample the exposed cryptic binding sites, generating accumulated-tPAINT images of the force “history” of mechanical events where F > Ttol.
Figure 3: Accumulated-tPAINT enables high-resolution tension imaging.
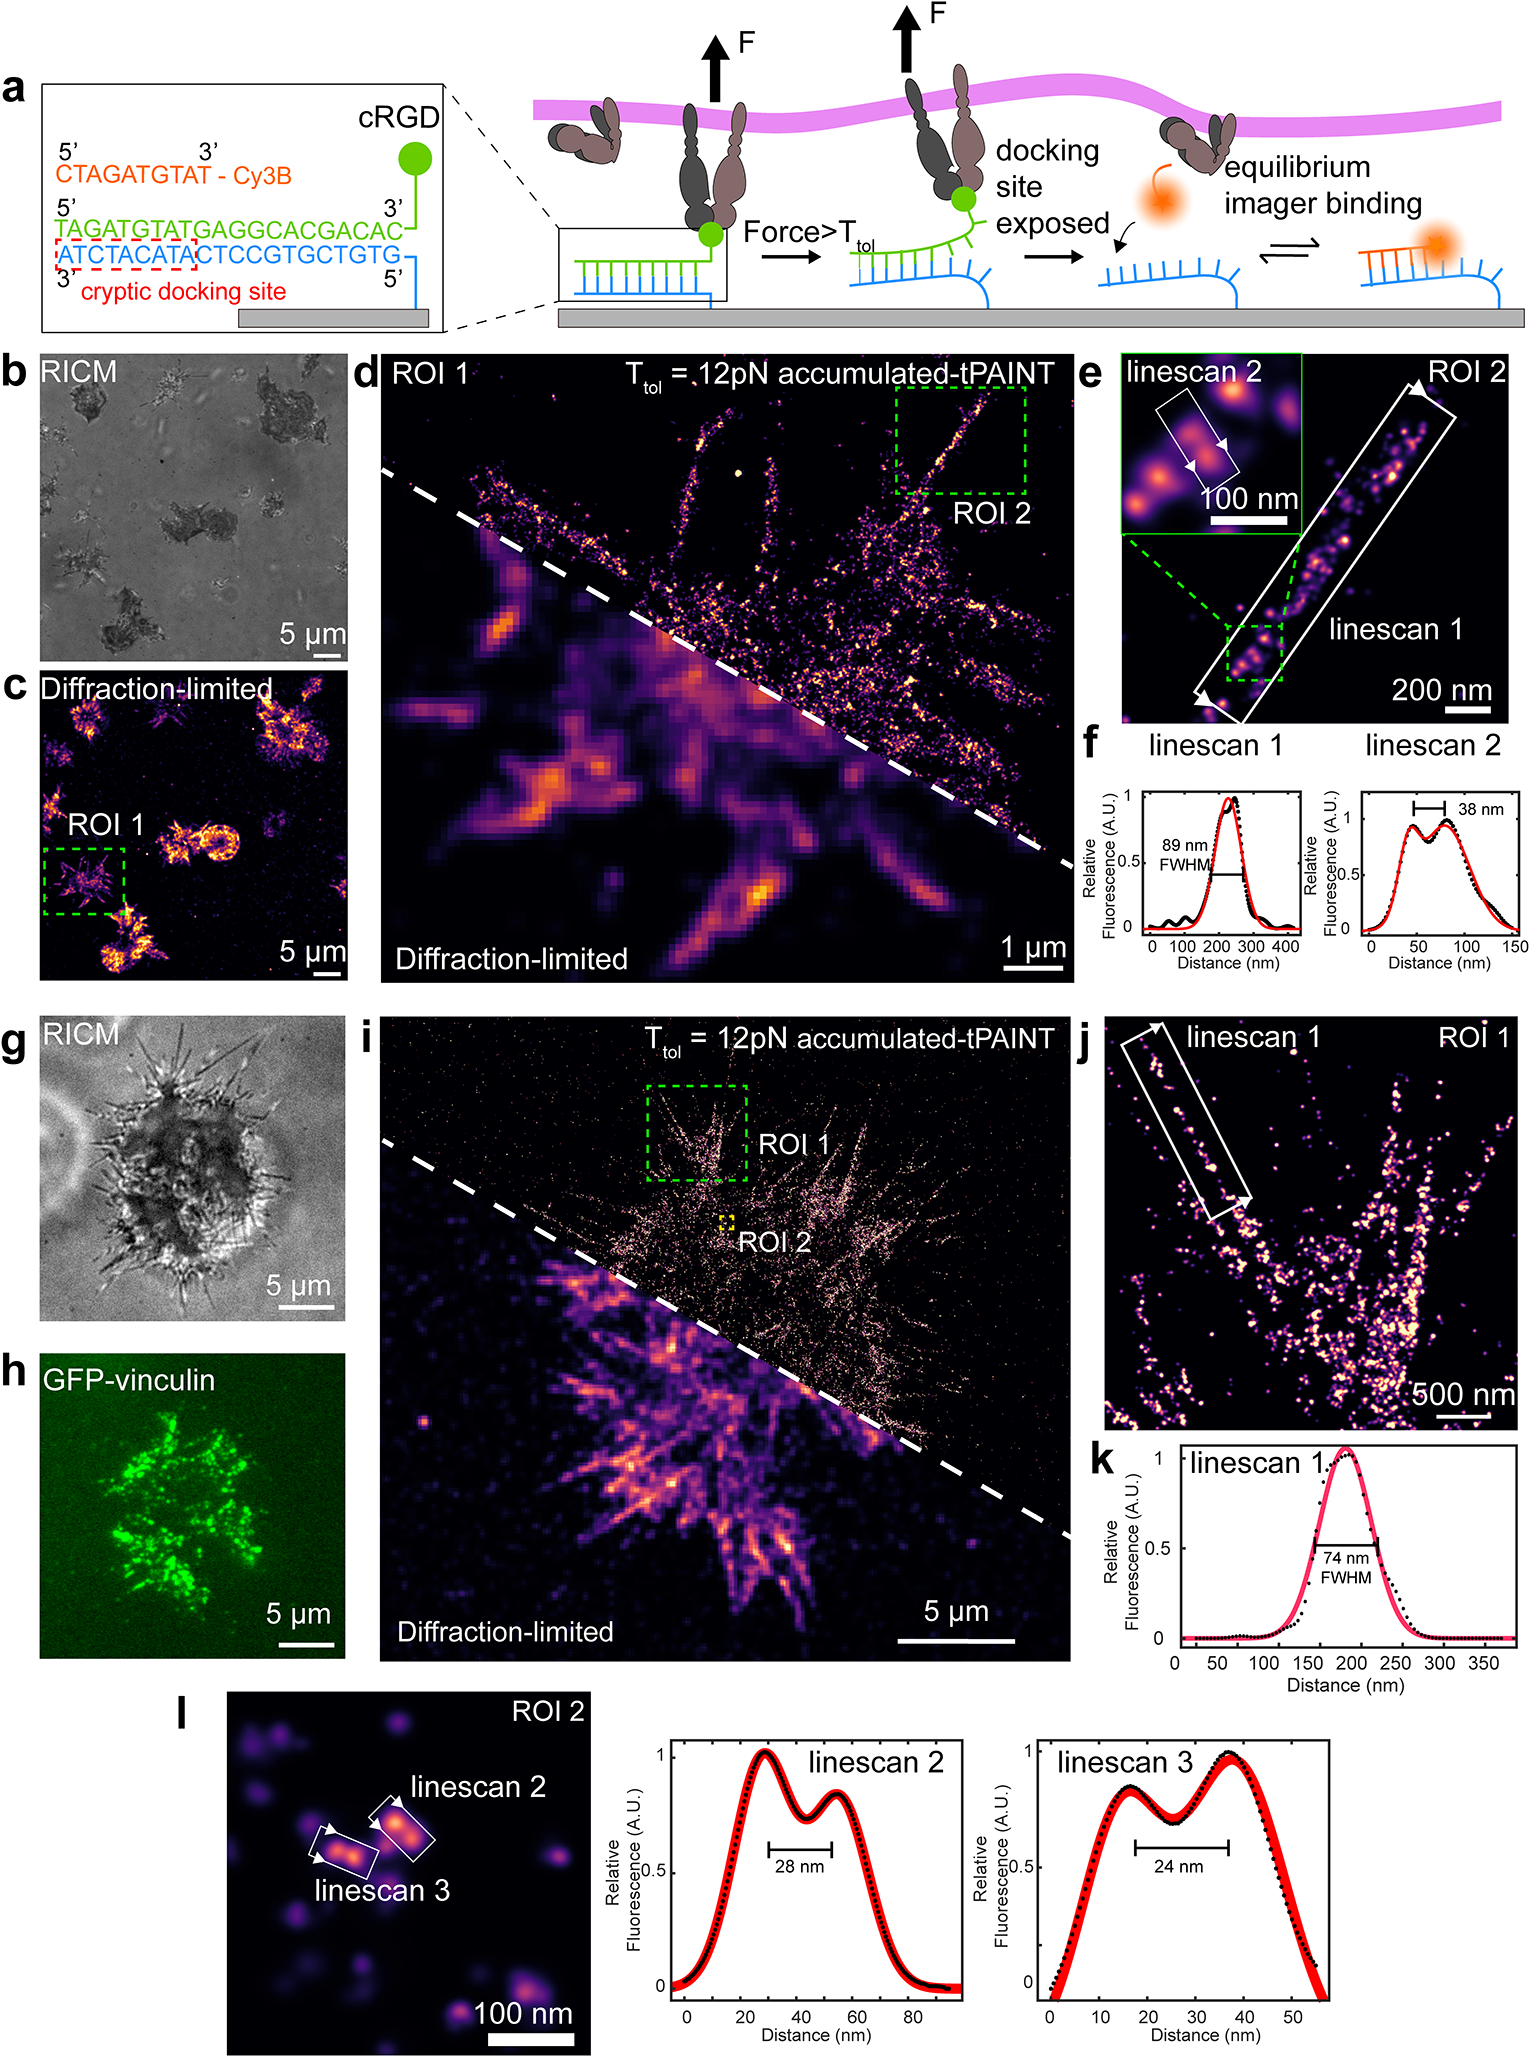
(a) Schematic showing mechanism of accumulated-tPAINT. When integrin F > Ttol, the probe ruptures, exposing a cryptic docking site. Cy3B imager strands transiently bind to this exposed site to report the cellular traction force footprint. (b) and (c) show RICM and diffraction-limited 12 pN tension map of platelets seeded on the surface for 25 min. Color indicates the localization density. (d) Overlay of accumulated tPAINT image with the diffraction-limited reconstruction. (e) Zoom-in of the green ROI noted in d. (f) Linescans of structures noted as i and ii. The direction of the linescan is depicted using white arrows. Red fit is based on a Gaussian with FWHM shown on plots. (g) RICM and (h) GFP vinculin images of MEF cells on an accumulated-tPAINT surface for ~25 min. (i) 12 pN accumulated-tPAINT and diffraction-limited overlay. (j) Zoom-in of ROI indicated by the green rectangle in i. (k) Linescan across the filopodial tension indicated by ROI in j. (l) 12 pN tension hot spots that are separated by 24 and 28 nm. The platelet data shown is representative of n = 8 replicates (22 images) while the fibroblasts data is representative of n = 9 replicates (24 images).
We seeded human platelets on the Ttol = 12 pN accumulated-tPAINT surface and, after ~10 min, performed accumulated-tPAINT (Fig. 3b). Platelets were imaged in TIRF excitation mode at 5 Hz over a duration of 25 min with 2.5 nM Cy3B imager. As expected, single molecule Cy3B imager localizations were enhanced at the platelet-surface contact area (Supplementary Video 2, Extended Data Fig. 2, 3) with an average signal-to-background enhancement ratio of ~17. Overlaying the diffraction-limited reconstruction (Fig. 3c) with the accumulated-tPAINT image validated the improved resolution (Fig. 3d). Specifically, we identified the tension footprint of a platelet filopodium measuring 89 nm in width (Fig. 3e, f). The platelet data shown in Fig. 3 was collected with ~10 nm precision (0.09 pixel) precision (determined by nearest neighbor analysis35, Supplementary Fig. 9, matching the typical precision metrics for DNA-PAINT36.
We also produced accumulated-tPAINT maps of MEF traction forces (Fig. 3g–l), showing filopodial-generated tension ~74 nm in width (Fig. 3j, k). Because accumulated-tPAINT maps static features, its resolution is likely akin to the resolution of conventional DNA-PAINT. In our hands, we were able to resolve ruptured probes separated by ~25 nm within the MEF tension footprint (Fig. 3I).
To determine the potential spatial resolution of tPAINT, we characterized the distribution of tension-probes on the surface (Extended Data Fig. 9). The density of probes on the surface was 2364+/−255 probes μm−2, suggesting that probes may be spaced as closely as 20 nm apart on the surface. DNA-PAINT imaging of a surface coated with open docking sites showed that probes are not evenly distributed, which sets the spatial resolution of tPAINT (Extended Data Fig. 9). Using other types of chemistry to immobilize probes more uniformly and densely on the coverslip may further improve the spatial resolution of tPAINT37.
Discussion:
The current standard in the field is traction force microscopy (TFM), which calculates traction stresses in deformable polymers films with ~700 nm spatial resolution26, 38, 39 (Supplementary Table 4). tPAINT offers a complementary approach, mapping molecular (pN) mechanical events with up to 25 nm resolution. In the context of molecular tension probes, a single report used 3B imaging for super-resolved mechanical measurements, but 3B is computationally intensive, susceptible to photobleaching, not suitable for long-term cellular imaging, and offers lower spatial resolution40, 41.
Imager binding to mechanically triggered probes, or mechano-selection19, is the contrast agent in tPAINT (Extended Data Fig. 3). Therefore, it is important that tPAINT probes are thermally stable enough to avoid excessive background signal due to (non-mechanical) probe breathing. The sf-tPAINT probes provide the first example of super-resolved dynamic measurements of cellular forces. This is a key feature, because the magnitude, spatial organization, timing, frequency, and history of forces influence signaling outcomes, as was recently shown in T cells42 and in fibroblast adhesions43. The likelihood of capturing mechanical events in sf-tPAINT depends on bond lifetime and force lifetime in relation to the imager sampling rate, which may be up to ~0.3 sec−1 in speed-optimized PAINT24. An additional consideration in sf-tPAINT is tuning the image time window to minimize blurring of dynamic features such as the tension generated by filopodia or the leading edge of spreading cells (Supplementary Fig. 5, Extended Data Fig. 10).
Given that accumulated-tPAINT probes rupture irreversibly, this probe offers high spatial resolution with potentially unlimited sampling of force-exposed docking sites. This improved resolution will be important in imaging fixed samples, where temporal information is not needed and where Exchange-tPAINT is integrated in the workflow.
To demonstrate the capabilities of tPAINT we have mapped platelet and fibroblast integrin tension, revealing dynamic nanoscale features like the rim of tension at the spreading edge of platelets and scanning filopodia. We also demonstrate two types of multiplexed tPAINT; mapping two-thresholds of tension simultaneously or alternatively by performing Exchange-tPAINT to correlate integrin tension with the F-actin architecture driving it. Pharmacological studies confirm that platelet lamellipodial tension is driven by the Arp2/3 complex mediating actin branching. This ability to simultaneously super-resolve mechanical events and cytoskeletal structure is powerful, thus we anticipate that tPAINT will become a workhorse tool linking structural biology to mechanobiology. One limitation in tPAINT is the lack of orientation information, but this limitation will likely be resolved upon integration of recently developed polarization imaging to reveal 3D force vectors of DNA probes19, 44. Another limitation can be summarized as a trade-off between time and resolution. Real-time imaging undersamples mechanical events but offers dynamical information in live cells; conversely, accumulated-tPAINT will sample all mechanical events at the cost of temporal resolution. Future speed optimizations in PAINT will alleviate this tradeoff enabling molecular force imaging combined with spatial mapping of the cell’s machinery in real-time.
Online Methods
Materials
Cy3B-NHS ester (PA63101) was acquired from GE Healthcare Life Sciences (Pittsburgh, PA). DNA was custom synthesized by Integrated DNA Technologies (Coralville, IA). Cyclo[Arg-Gly-Asp-d-Phe-Lys(PEG-PEG)] (PCI-3696-PI), elsewhere abbreviated as cRGD, was acquired from Peptides International (Louisville, KY). Streptavidin (S000–01) was obtained from Rockland-Inc (Pottstown, PA). μ-Slide VI0.4 6-channel slides (80606) and 25 mm × 75 mm glass coverslips (10812) were purchased from Ibidi (Verona, WI). N-hydroxyl succinimide-5 kDa PEG-biotin (NHS-PEG-biotin, HE041024–5K) was purchased from Biochempeg (Watertown, MA). N-hydroxyl succinimide-5kDa mPEG (NHS-mPEG, PG1-SC-5k-1) was purchased from Nanocs (New York, NY). Sulfo-N-hydroxyl succinimide-acetate (sulfo-NHS-acetate, 26777) was purchased from Thermo-Fisher (Waltham, MA). (3-Aminopropyl)triethoxysilane (APTES, 440140, 99% purity) was purchased from Sigma-Aldrich. Tetraspek beads were purchased from Thermo-Fisher (T7279). Phalloidin-amine was purchased from Santa-Cruz biotechnology (sc-397330). All other reagents and materials (unless otherwise stated) were purchased from Sigma-Aldrich and used without purification. All buffers were prepared with 18.2 MΩ nanopure water.
Surface Preparation
Tension-PAINT surface preparation was modified from previously published protocols3. Briefly, rectangular glass coverslips (25 × 75 mm) were cleaned using piranha solution. CAUTION: piranha can be explosive when mixed with organics. The piranha solution was prepared using a 1:3 mixture of H2O2 and H2SO4. Slides were then washed in 6 successive beakers of nanopure water and then etched in a beaker of KOH (0.5 M) for 1 hr in an ice-filled sonicator. The coverslips were washed in 6 times using nanopure water, followed by 3 successive washes using ethanol. In a separate beaker of ethanol, slides were reacted with 3% v/v APTES for 1 h. Coverslips were then washed 3 times with ethanol and dried under a stream of N2 gas. Slides were then reacted with cloud-point NHS-PEG-biotin (10% w/v) for 1 hr in 0.5 M K2SO4 and 0.1M NaHCO3 (pH 9). Next, slides were washed 3 times with nanopure water and reacted for 30 min with NHS-mPEG (5% w/v) and sulfo-NHS-acetate (1% w/v) in 0.5 M K2SO4 and 0.1M NaHCO3 (pH 9) to consume any unreacted amines on the surface. Slides were dried under N2 gas, and then stored at −80°C for up to 2 weeks before use.
Imaging chamber assembly
Before imaging, the μ-Slide VI0.4 6-channel slide was adhered on the 5kDa PEG-biotin surface. To further reduce non-specific DNA binding during the imaging, the micro-channels were passivated with 5% v/v Tween 20 in T50 buffer for 15–30 min45, 46. The channels were washed with 1XPBS and filled with 50μg/ml streptavidin for a 1-hour incubation. The channels were then washed with 1XPBS and incubated with 1 μM DNA probe solutions for 1 hr. For force-multiplexing experiments, the surfaces were incubated with two tension probes, each at 1 μM concentration. Finally, the channels were washed with cell imaging buffer before imaging (FluoroBrite DMEM Media, A1896701, Thermo-Fisher).
DNA Hybridization
DNA oligonucleotides were hybridized at 200 nM or 1 μM in a 0.2 mL Thermowell Tube. DNA was heated to 90°C and then cooled at a rate of 1.3°C per min to 35°C.
Platelet Handling
All procedures using donor-derived human platelets were approved by the Institutional Review Board of Children’s Healthcare of Atlanta/Emory University. Written, informed consent was received from participants prior to their inclusion in studies. Venous blood was obtained from healthy adult volunteers by venipuncture into 3.8% trisodium citrate. Human PRP was prepared via centrifugation (12 min, 140g) of whole blood. PRP was collected following the spin, diluted to 10mL in PIPES saline, and treated with 12 μL of PGE1 (500 μM) to prevent platelet activation. The solution was inverted gently several times to mix the PGE1 into solution and then centrifuged at 1900g for 8 min. The supernatant was discarded, and the platelets were resuspended in 400 μL of Tyrode’s buffer for 5 min before an additional 600 μL of Tyrode’s buffer was added and mixed gently to resuspend the platelet pellet. Platelets were incubated at room temperature for at least 30 min before beginning experiments.
Cell culture
Mouse embryonic fibroblasts (MEF) were cultured according to ATCC guidelines. Briefly, cells were cultured in DMEM supplemented with penicillin/streptomycin and 15% fetal bovine serum (v/v). Cells were passaged every 2–3 days as required.
Single molecule Localization Imaging for Tension-PAINT
Imaging was accomplished on a Nikon Eclipse Ti microscope, operated by Nikon Elements software, a 1.49 NA CFI Apo 100x objective, perfect focus system, and a total internal reflection fluorescence (TIRF) laser launch with 75 mW 561 nm. A Chroma quad cube (ET-405/488/561/640 nm Laser Quad Band) and reflection interference contrast microscopy (RICM) (Nikon: 97270) cube were used for imaging. Widefield epifluorescence illumination was provided by an X-Cite 120 lamp (Excelitas). An Andor iXon Ultra 897 electron multiplying charge coupled device was used for image acquisition. Lasers were operated in TIRF mode for all acquisitions.
Images were acquired using RAM capture via a Nikon Fast Timelapse acquisition. Cameras were operated at 17-MHz refresh rate with 300 EM gain and a 200 ms exposure time. A 1.5x lens introduced into the optical path allowed for imaging with a pixel size of 110 nm. For time-resolved measurements, Nikon JOBS was used to alternate between capturing 300 frames of single-molecule fluorescence signal and then one RICM image and one epifluorescence GFP image, enabling tracking of the cell position via widefield microscopy throughout the acquisition. The individual 300 frame single molecule image stacks were then stitched back together and analyzed in Picasso. 4-color tetraspeck beads were used as fiducial markers.
For force-multiplexing experiments, orthogonal DNA imagers labeled with Atto 488 and Cy3B were employed. Single molecule localizations were collected simultaneously utilizing an Andor Tucam system with dual iXon Ultra 897 EMCCDs. Fluorophores were excited simultaneously with 488nm and 561nm TIRF illumination. All other imaging settings were identical to those described above.
The exact imaging conditions used for all images in the main text are provided in Supplementary Table 3.
Exchange-tPAINT
tPAINT imaging of the platelet integrin tension was acquired before fixation with 37.5mM Mg2+ and 7.5nM Cy3B imager. The cells were then fixed with 4% formaldehyde solution on the microscope for 10 mins without disturbing the sample. The channel was washed 3 times with 1XPBS, and cells were permeabilized with 0.1% Triton X-100 in 1XPBS for 5 mins at room temperature. After permeabilization, the cells were stained with 1 μM phalloidin tagged with a DNA dock for 15 mins and the channel was gently washed with imaging buffer 3 times. Lastly, Cy3B-imager strand complementary to the phalloidin-DNA dock was added at 1nM for F-actin imaging. F-actin DNA-PAINT images were acquired at 5Hz for 60 minutes.
Image Processing
Image processing was performed in MATLAB 2019a (MathWorks) and in Picasso14, a software that is freely available via the Jungmann lab website. The bioformats toolbox enabled direct transfer of Nikon Elements image files (.nd2) into the MATLAB environment. Drift correction was performed in Picasso by several consecutive rounds of redundant cross correlation.
Due to the presence of background, non-mechanical signal from sf-tPAINT probe “breathing” during experiments, it is necessary to filter the tPAINT single molecule localization data. Accordingly, we employed filtering algorithms to distinguish between force-mediated signal and background signal (Extended Data Fig. 7). Briefly, we applied a kinetic filter to eliminate localizations associated with surface defects, dust or other contaminants on the surface. These localizations possess brief dark times (very high apparent kon) or prolonged bright times (very low koff). To remove these localizations the single molecule localizations were binned into 3x zoom oversampled pixels (3 oversampled pixels per 1 pixel on detector). Single localization events were identified as consecutive frames in which single molecule localizations occurred within each oversampled pixel, or within its 8 immediate neighbors. If more than 14 events occurred within 25 frames, all of the component events were removed from the data set. This treatment does not alter the single-molecule events that originate from DNA-DNA binding because the expected dark time between single molecule events is 100s for 10 nM imager concentration, thus multiple binding events within 5 seconds are unlikely. Additionally, the bond lifetime of the imager and the docking sites is too short to produce 14 consecutive bright frames. After the kinetic filter, we employed a Voronoi tessellation density filter to remove sparse localizations28, reasoning that cell tension will produce denser localizations than the cell-free background (Extended Data Fig. 7). We computed the Voronoi tessellation of the single molecule localization data set and then assigned a first rank density to each point. A background density was calculated as the average localization density within a user-defined cell-free region of the substrate. We then removed all single molecule localizations with a first rank density of less than 1–15x the background localization first rank density. This procedure may “erode” edge localizations, sharpening spatial features, thus it is important to use the lowest possible Voronoi density filter that produces high-quality images. The effects of different density filters are displayed in detail in Extended Data Fig. 7. A spatial density filter of 3x the background was employed for the data displayed in Fig. 1, a 2x filter for the data in Fig. 2, and a 5x density filter was employed for the data displayed in Fig. 3.
For Tucam experiments, including simultaneous tPAINT-SRRF and force multiplexing, the single-molecule localization lists were registered after single molecule localization in Matlab. Localizations corresponding to tetraspeck beads were manually identified and used as fiducial markers to apply a projective registration to the single-molecule dataset.
Synthesis
The sequences of all strands are provided in Supplementary Table 1. Briefly, 100 nmoles of c(RGDfK(PEG-PEG)) was reacted with approximately 150 nmoles of NHS-azide in DMSO overnight. Product 1 was purified via reverse phase HPLC with a Grace Alltech C18 column (1 mL/min flow rate; Solvent A: 0.1M TEAA + 0.05% TFA, Solvent B: acetonitrile + 0.05% TFA; starting condition: 90% A + 10 % B, 1%/min gradient B) (Supplementary Fig. 2). Product 1 was ligated to the tension probe ligand strand via 1,3-dipolar cycloaddition reaction. Briefly, 5 nmoles of alkyne ligand strand was reacted overnight with ~75 nanomoles of product 1 in the presence of 0.1 M sodium ascorbate and 0.1 mM Cu-THPTA. The product was purified with a P2 size exclusion column, and then using reverse phase HPLC with an Agilent Advanced oligo column (0.5 mL/min flow rate; Solvent A: 0.1M TEAA, Solvent B: acetonitrile; starting condition: 90% A + 10 % B, 0.5%/min gradient B) (Supplementary Fig. 2). Using the above procedure, any alkyne DNA could be conjugated to the cRGDfK peptide in a highly efficient manner.
Imager strands were dried and reacted overnight with a 15x excess of Cy3B-NHS dissolved in 1 μL DMSO. The total reaction volume was 10 μL, composed of 1x PBS supplemented with 0.1M NaHCO3. The reaction pot was purified by a P2 size exclusion gel to remove unreacted dye followed by HPLC purification (0.5 mL/min flow rate; Solvent A: 0.1M TEAA, Solvent B: acetonitrile; starting condition: 90% A + 10 % B, 1%/min gradient B) to purify products (Supplementary Fig. 2).
The retention times of all products and starting reagents are shown in the HPLC spectra in Supplementary Fig. 2, and in Supplementary Table 2.
To synthesize DNA docking site tagged phalloidin, excess TCO NHS ester was added to 20 nmol phalloidin amine in 20 μL DMSO containing 10% 10X PBS. The solution was vortexed briefly, then reacted at 50 °C for 1 hour. The product was purified by HPLC and identity was confirmed by ESI-MS. Tetrazine-PEG4-azide was then functionalized to alkyne functionalized DNA using copper(I)-catalyzed azide-alkyne cycloaddition. Briefly, 1 mg of tetrazine-PEG4-azide was dissolved in 20 μL 1:4 DMSO:H2O and warmed to 50 °C. The copper reaction mixture was prepared in a separate tube by combining, in the following order, 1 eq. 20 mM CuSO4, 2 eq. 50 mM THPTA, and 5 eq. 50 mM ascorbic acid. The reaction mixture was then added to 15 nmol DNA in water and warmed to 50 °C. Once warmed, the solution was added to the tetrazine-PEG4-azide with dropwise addition of DMSO to maintain solubility. The reaction proceeded at 50 °C for 2 hours and the resulting product was purified using P2 gel filtration. Finally, TCO phalloidin and tetrazine functionalized DNA were each dissolved in 10 μL 10X PBS and combined to make the final DNA docking site conjugated phalloidin. The reaction proceeded at room temperature overnight and the resulting product was purified by HPLC.
Origami design and synthesis
Single-stranded scaffold p7560 was prepared from M13 phage using a previously reported method. A 16HB rod was designed in caDNAno, based on a 4×4 square lattice cross-section. To synthesize 16HB, a 10-fold excess of staple strands were mixed with p7560 scaffold strand (10 nM) in folding buffer (5 mM Tris, 1 mM EDTA, 10 mM MgCl2 with a total volume of 50 μL. The mixture was denatured at 85°C for 10 min, followed by a slow anneal from 60°C to 25°C over 18 hrs (−1°C/30 minutes). 16HB were purified from excess staples using agarose gel electrophoresis (0.67%) in 0.5X TBE+Mg buffer (45 mM Tris, 45 mM Boric acid, 1 mM EDTA, 10 mM MgCl2). 16HB structures were characterized by agarose gel electrophoresis (1.5%) and negative stain TEM imaging (1% uranyl formate).
Determination of DNA surface density
We adapted a surface density quantification assay that was previously published47. This protocol requires the preparation of a supported lipid membrane, because the bilayer structures provide a known molecular density on a glass slide surface that can be used to quantify DNA surface density. The protocol requires three main steps outlined here:
i. Small unilamellar vesicles (SUVs) preparation to determine DNA surface density
Small unilamellar vesicles (SUV) were prepared by extrusion. 1,2-dioleoyl-sn-glycero-3-phosphocholine (DOPC) (850375C, Avanti Polar Lipids) and Texas Red 1,2Dihexadecanoyl-sn-Glycero-3-Phosphoethanolamine, Triethylammonium Salt (TR DHPE) were mixed in ~100 μL chloroform at 100 mol % DOPC or 99.5 mol% DOPC and 0.5 mol % TR DHPE. Chloroform was evaporated by rotary evaporation, and lipid cakes were dried under vacuum and under ultra-high purity nitrogen. Lipids were resuspended in water at 2 mg/mL and sonicated for 30 s prior to 3 freeze-thaw cycles. SUVs were extruded 10x in a 10 mL LIPEX Extruder (Transferra Nanosciences, Inc.) fit with a 0.08 μm polycarbonate filter (WHA110604, Whatman) and a drain disc (WHA230600, Whatman). The final concentration of TR in liposomes was measured on a Thermo Scientific Nanodrop 2000c spectrophotometer.
ii. Supported Lipid Bilayer (SLB) Preparation
SLBs were formed in untreated glass-bottom 96-well plates (265300, Nunc). Glass was etched for 1 hour in 2.6 M sodium hydroxide and washed with 5 mL nanopure water and 5 mL 1x phosphate buffered saline (PBS). TR-labeled and unlabeled SUVs were added in known ratios for ~10 min to form SLBs containing 0.01 – 0.06 mol% TR-DHPE. SLBs were washed with 5 mL nanopure water and 2.5 mL 1x PBS. SLBs were imaged in nanopure water. When used for passivation, SLBs were prepared with 100 mol % DOPC.
iii. Bulk Probe Density Calculation
The bulk probe density was determined by measuring the fluorescence intensity of single-stranded tension gauge tethers tagged with Cy3B and comparing this value to a fluorescence calibration curve generated by measuring the intensity of SLB standards containing Texas Red (TR)-labeled phospholipids. The number of TR DHPE per micron was estimated using the DOPC footprint in a membrane48. The Cy3B-DNA and TR fluorescence were equated by the F-Factor, F, which is defined by
F was determined by measuring the intensity of free dye-labeled DNA and TR-labeled (SUVs) in nanopure water at 50 – 500 nM fluorophore. To avoid surface adsorption, glass was passivated with a DOPC SLB prior to buffer exchanging with the sample. In-solution images were collected 5 μm above the surface.
Statistics
Two-tailed, two-sample t-tests were used to compare: (1) the means of the localization density on strain-free tPAINT surface versus the strained surface (Extended Data Fig. 1), (2) the means of the localization density on the accumulated tPAINT surface versus strain-free tPAINT surface (Extended Data Fig. 3). Two-way ANOVA was used to compare (1) the mean of the ratios of cell/background density (Extended Data Fig. 5), (2) the means of background localization produced by scrambled imager versus tPAINT imager (Extended Data Fig. 6).
Code Availability
Filtering algorithms are derived from published methods. The code is available from the corresponding author upon reasonable request.
Human Subjects Statement
All procedures using donor-derived human platelets were approved by the Institutional Review Board of Children’s Healthcare of Atlanta/Emory University. Written, informed consent was received from participants prior to their inclusion in studies.
Data Availability Statement
The data that support the findings of this study are available from the corresponding authors upon reasonable request. Further information regarding the experimental design may be found in the Life Sciences Reporting Summary.
Extended Data
Extended Data Figure 1: Strain-free (sf)-tPAINT probe modeling and testing shows significant advantages over conventional hairpin probes (strained-tPAINT probes).
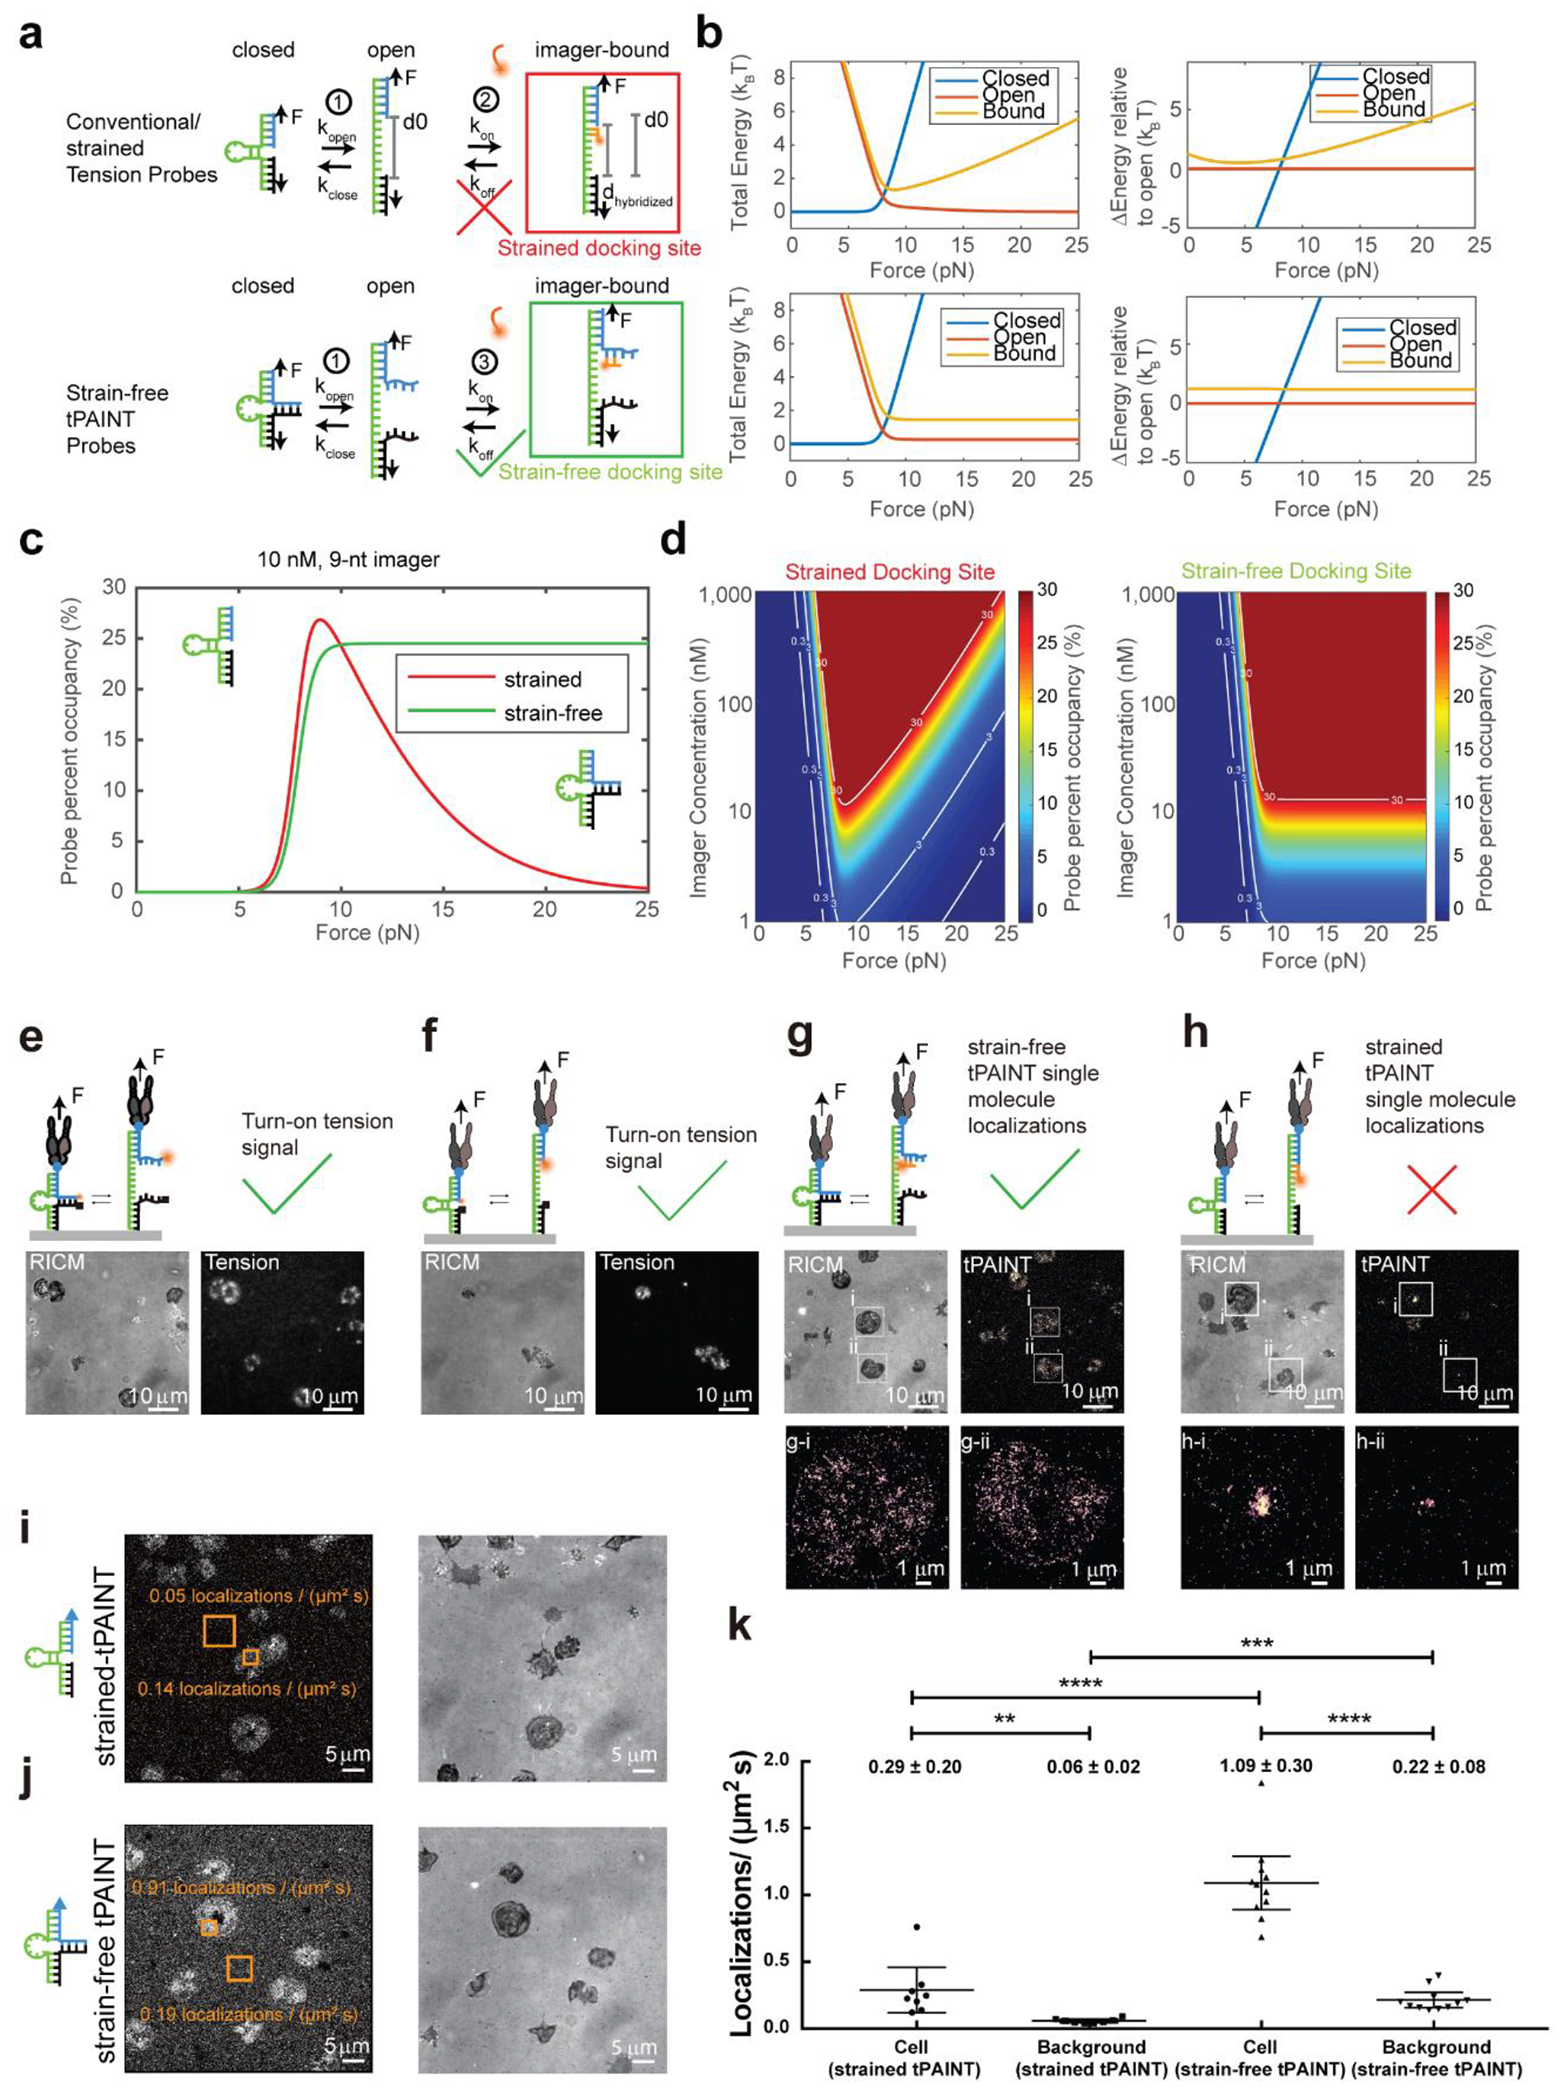
(a) Schematic of binding of imagers to strain-free (sf-tPAINT) and conventional/strained probes. (b) Total energy and change in energy as a function of applied force as predicted by the kinetic model described in Supplementary Note 2. (c) Docking site occupancy as a function of applied F for strained (red), and sf-tPAINT probes (green) at 10 nM imager and (d) for varying imager concentration. Force impedes imager binding to strained but not sf-tPAINT probes. (e-h) Experimental validation that sf-tPAINT probes outperform strained probes. (e) Strain-free and (f) conventional (strained) probes tagged with Cy3B-BHQ2 report pN tension as fluorescence. Images representative of n = 6 (e) and n = 3 (f). (g) Strain-free and (h) conventional/strained probes were incubated with 10 nM Cy3B-imager and imaged in TIRF excitation. These images were reconstructed from 5000 frames of single molecule localizations. Data shown in g and h are from paired experiments using different fluidic channels on the same glass coverslip and using the same platelet donor. The results shown are representative of n = 3 experiments. (i-k) Quantification of single molecule localizations (μm−2 s−1) for strained and sf-tPAINT probes. Results are representative of n = 4 (11 images) independent experiments for strained tPAINT surfaces and n = 6 independent sf-tPAINT surfaces (8 images). Data in k is displayed as mean with 95% CI. Cell (strained tPAINT): Mean= 0.29, 95% CI 0.12–0.46; Background (strained tPAINT): Mean= 0.06, 95% CI 0.04–0.07; Cell (sf-tPAINT): Mean= 1.09, 95% CI 0.89–1.29; Background (sf-tPAINT): Mean= 0.22, 95% CI 0.16–0.27. To determine the statistical significance, student t-test was applied to the data and the exact p-values are calculated (2 tailed, 2 sample). Cell (strained tPAINT) vs Background (strained tPAINT): 1.5×10⁻², Cell (sf-tPAINT) vs Background (sf-tPAINT): 7.2×10⁻⁷, Cell (strained tPAINT) vs Cell (sf-tPAINT): 2.3×10⁻⁶, Background (strained tPAINT) vs Background (sf-tPAINT): 8.4×10⁻⁵.
Extended Data Figure 2: Collage of examples showing accumulated-tPAINT and ~8.5 pN sf-tPAINT integrin tension maps for MEFs and human platelets.
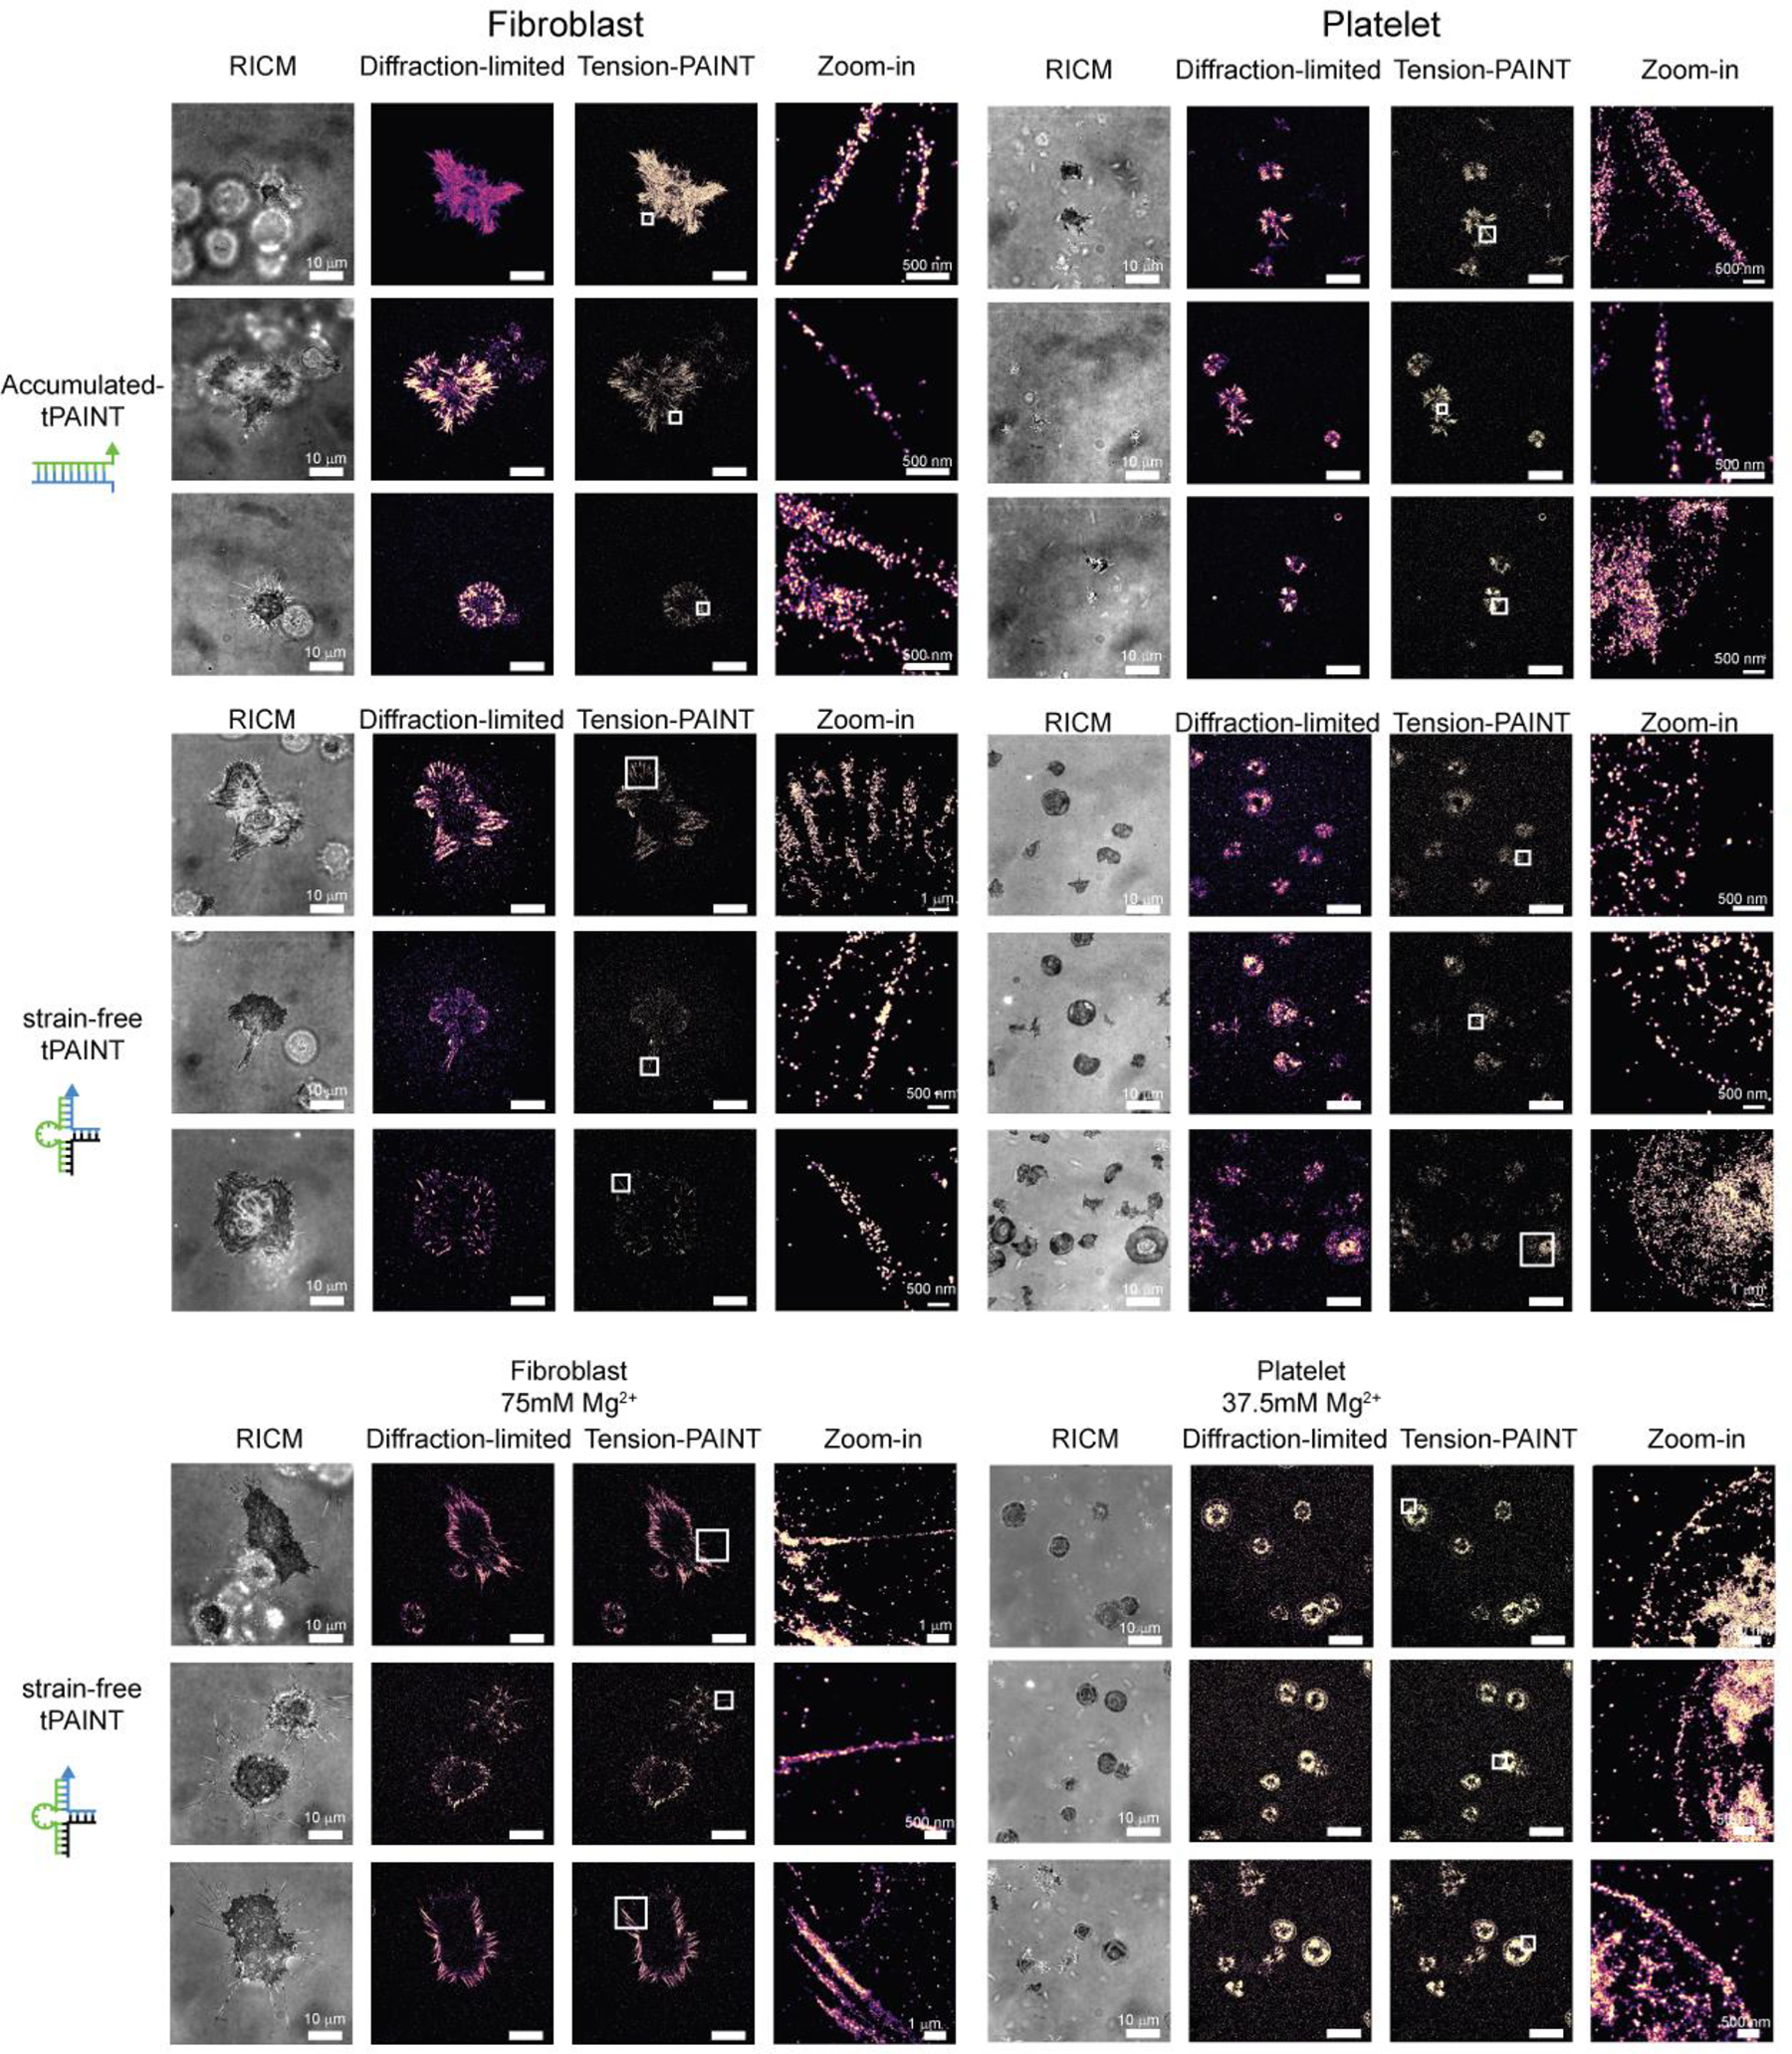
Representative examples of images for MEF GFP-vinculin cells and human platelets displayed with a 5x density filter and kinetic filter. Images are representative of: 12pN Ttol accumulated-tPAINT maps, platelets, n = 8 replicates (22 images), and fibroblasts, n = 9 replicates (24 images); 8.5pN sf-tPAINT maps, fibroblasts, n = 3 experiments (cell culture media, 0.8mM Mg2+), 8.5pN sf-tPAINT platelet maps, n = 4 experiments (Tyrode’s buffer + 2mM Mg2+); sf-tPAINT maps in media supplemented with Mg2+, n = 3 independent platelet experiments (37.5mM Mg2+) from 3 different donors (8 images) and n = 4 fibroblast experiments (75mM Mg2+ 10 images).
Extended Data Figure 3: Mechanoselection produces a signal-to-background ratio of up to 10 for sf-tPAINT probes and 17 for accumulated-tPAINT probes.
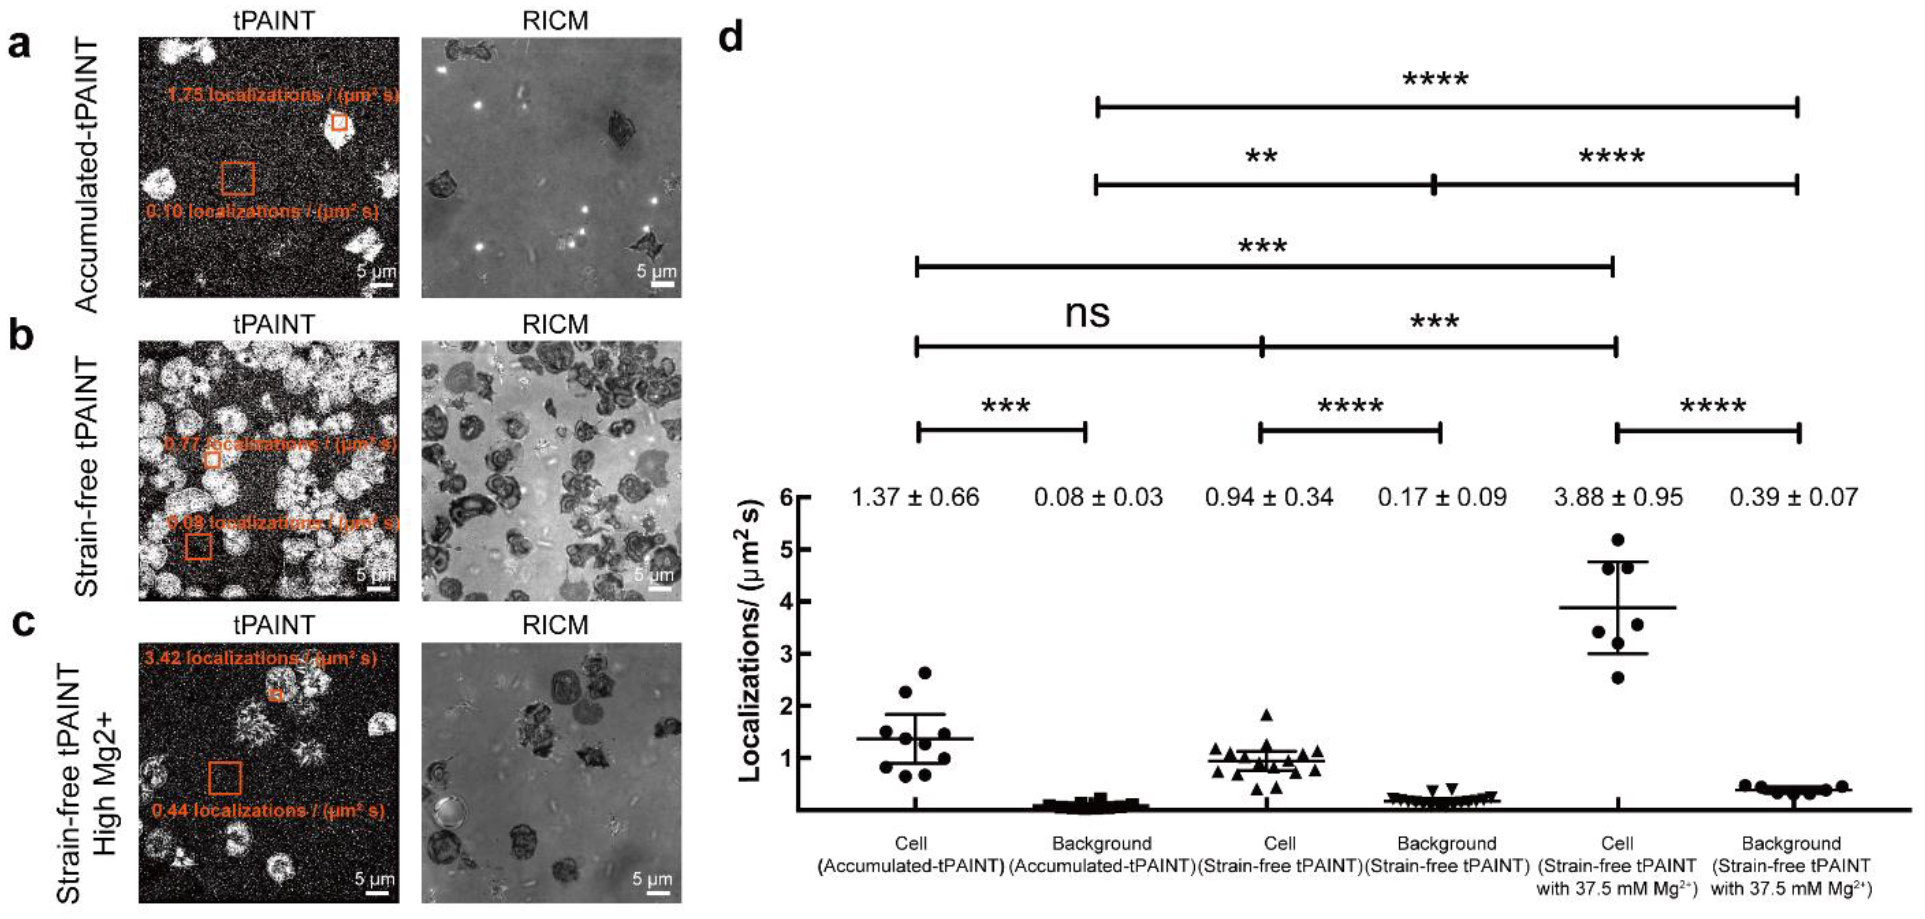
Human platelets were seeded on surfaces presenting cRGD-modified (a) 12pN Ttol accumulated-tPAINT probes at low [Mg2+], (b) sf-tPAINT at low [Mg2+], and (c) sf-tPAINT with 37.5 mM Mg2+. Note that the images displayed are raw-unfiltered single molecule localizations of tPAINT images with the contrast adjusted to emphasize the background localizations. (d) The average per image localizations/(μm2s) for both the background and for the mechanical “footprint” of platelets (3 ROIs per image) is plotted. Results were obtained from n = 4 independent accumulated-tPAINT surfaces, n = 8 sf-tPAINT surfaces and n = 3 high [Mg2+] sf-tPAINT surfaces (10 images for accumulated-tPAINT, 16 images for strain-free, 7 images for high [Mg2+] strain-free). Mean ± standard deviation is noted above each category, error bar is mean with 95% CI. Cell (accumulated-tPAINT): Mean= 1.37, 95% CI 0.89–1.84; Background (accumulated-tPAINT): Mean= 0.08, 95% CI 0.02–0.04; Cell (strain-free tPAINT): Mean= 0.94, 95% CI 0.76–1.13; Background (sf-tPAINT): Mean= 0.17, 95% CI 0.12–0.22. Cell (high [Mg2+] sf-tPAINT): Mean= 3.88, 95% CI 3.00–4.76; Background (high [Mg2+] sf-tPAINT): Mean= 0.39, 95% CI 0.32–0.45. Student’s t-test was (2-tailed, 2 sample) was applied to determine significance. Cell (accumulated-tPAINT) vs Background (accumulated-tPAINT): p = 1.6×10⁻⁴, Cell (strain-free) vs Background (strain-free): p = 1.3×10⁻⁷, Cell (High [Mg2+] strain-free) vs Background (High [Mg2+] strain-free): p = 6.5×10⁻⁵, Cell (accumulated-tPAINT) vs Cell (strain-free): p = 8.5×10⁻², Cell (accumulated-tPAINT) vs Cell (High [Mg2+] strain-free): p = 1.3×10⁻⁴, Cell (strain-free) vs Cell (High [Mg2+] strain-free): p = 1.2×10⁻⁴, Background (accumulated-tPAINT) vs Background (strain-free): p = 8.4×10⁻⁵. Background (accumulated-tPAINT) vs Background (strain-free): p = 5.2×10⁻³, Background (accumulated-tPAINT) vs Background (High [Mg2+] strain-free): p = 1.1×10⁻⁶, Background (strain-free) vs Background (High [Mg2+] strain-free): p = 1.7×10⁻⁵.
Extended Data Figure 4: Analysis of lamellipodial and focal adhesion dynamics using time resolved 8.5pN sf-tPAINT.
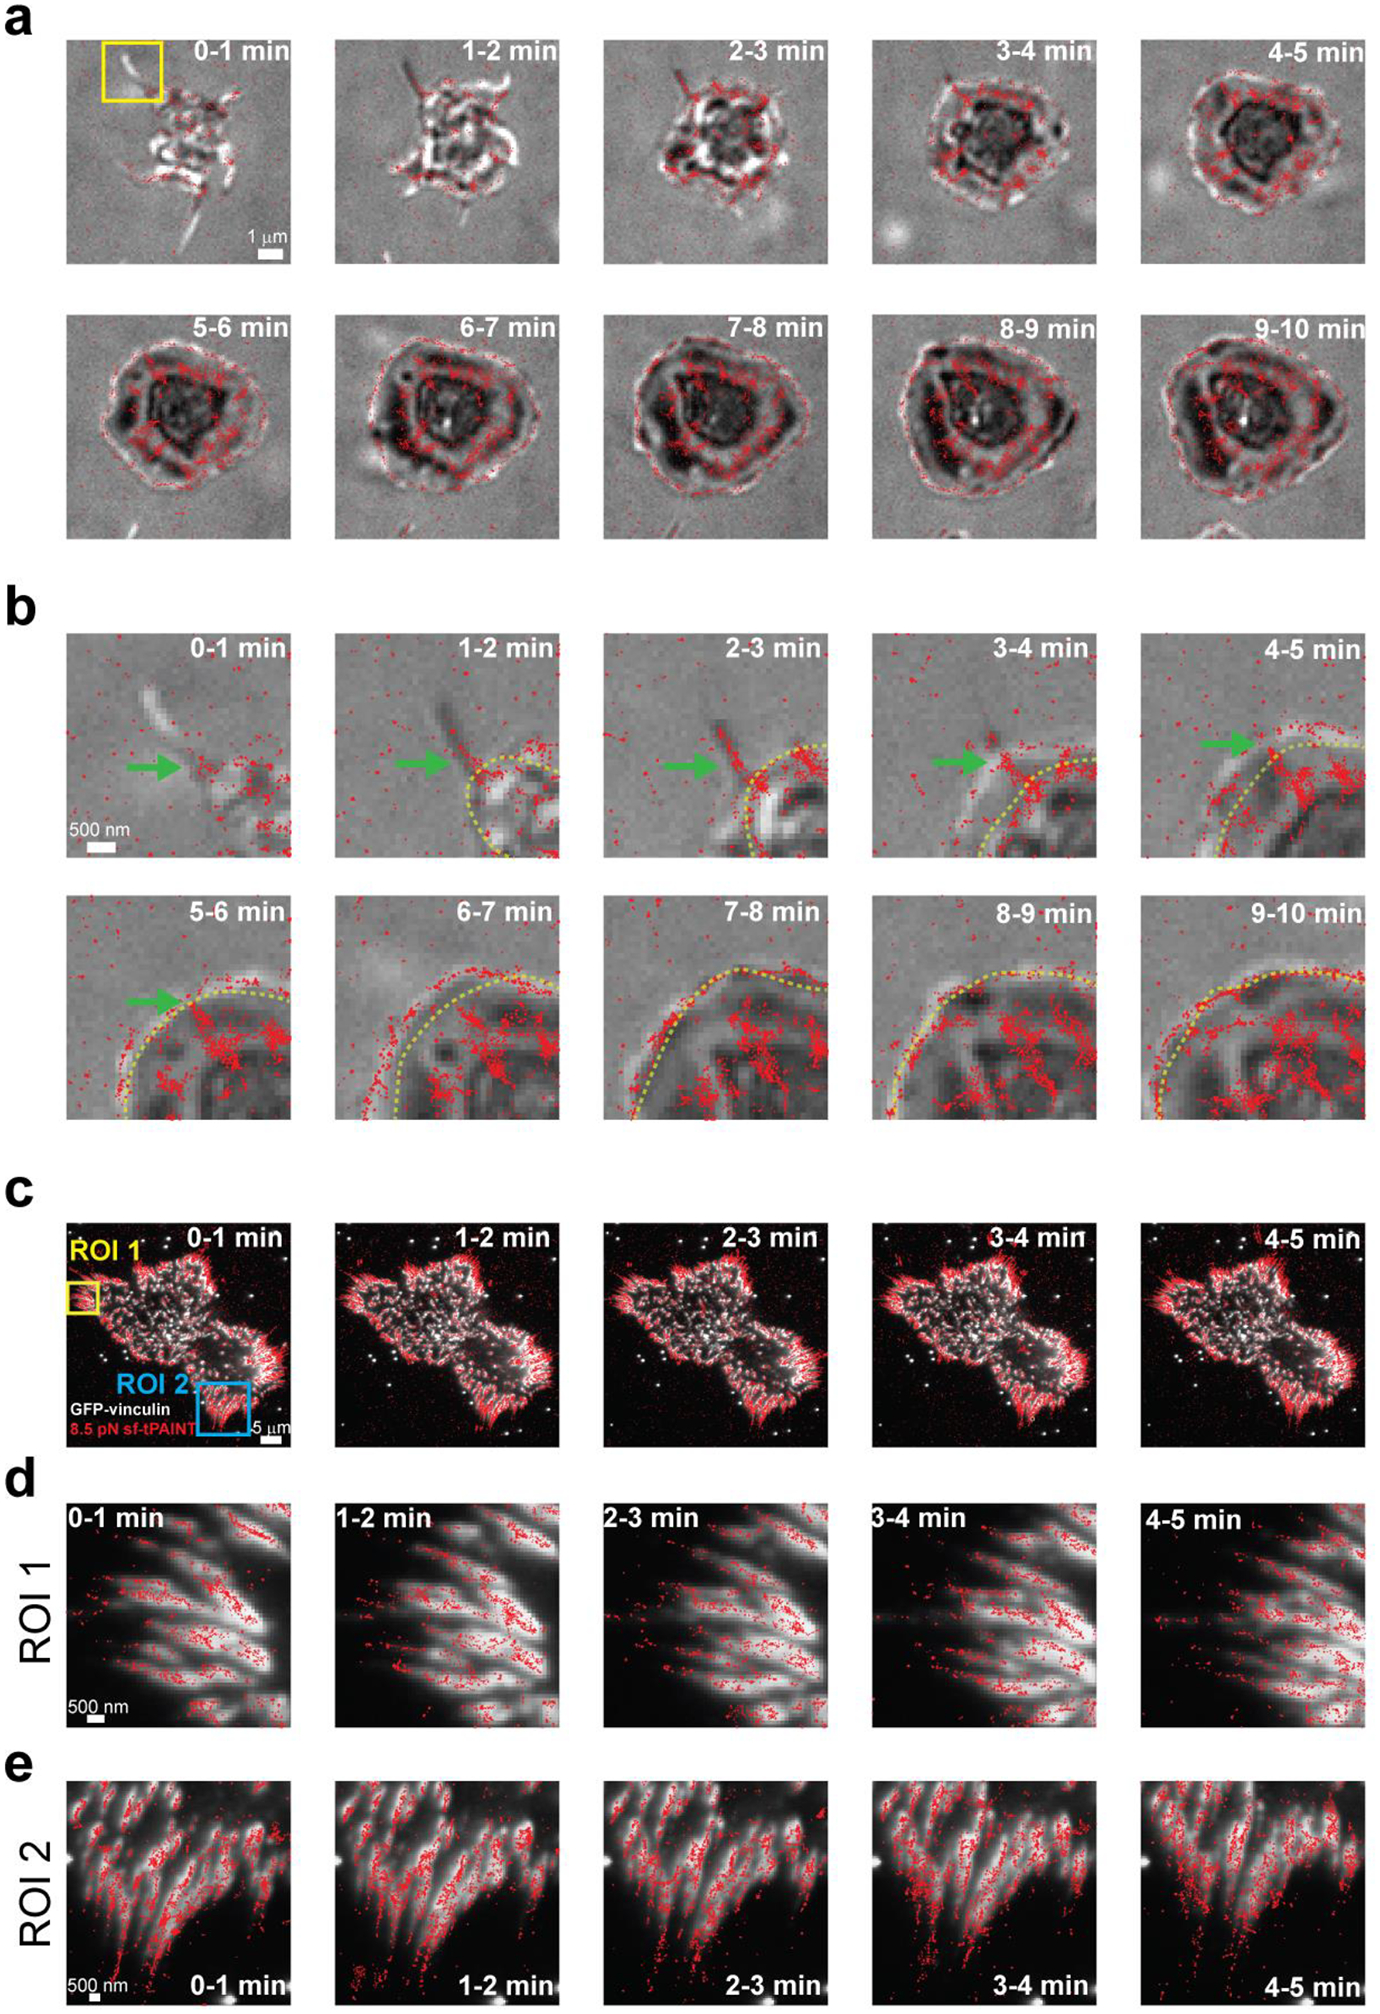
(a) 8.5 pN tPAINT integrin forces (red points) and RICM (grey) were simultaneously imaged in a spreading human platelet. Each RICM image is collected at the beginning of the time window, while the 8.5pN sf-tPAINT data represents the accumulated signal in a 60 sec interval. (b) Zoom-in images of the region highlighted with yellow box in (a). The green arrow denotes the formation of a filopodium and the force associated with extension of this structure. For frames corresponding to minutes 1–10, the cell edge in the previous frame is highlighted with a dashed yellow line. Note that the filopodial forces are still resolved even after lamellipodial spreading. (c) Full cell view of a mouse embryonic fibroblast (MEF); (d) and (e) show zoom-ins of the regions highlighted with yellow and blue boxes, respectively. Note that the focal adhesion (as indicate by the vinculin-GFP data) is offset from the mechanical localizations. The tension signal extends beyond the tip of the focal adhesions away from the cell body, and this is clear both in the full view of the cell (c), as well as the zoom in panels (d) and (e). This could be consistent with previous reports by Waterman and colleagues which found that the centroid of focal adhesion traction stresses is consistently ~1μm distal to the focal adhesion centroid21. This finding is also consistent with previous publications from our lab20, and the diffraction limited tension reported in Supplementary Fig. 3 of this work. Data shown is representative of: platelets, n = 3 independent experiments (5 images); fibroblasts, n = 3 independent experiments (5 images).
Extended Data Figure 5: Design of speed-optimized strain-free tPAINT probes.
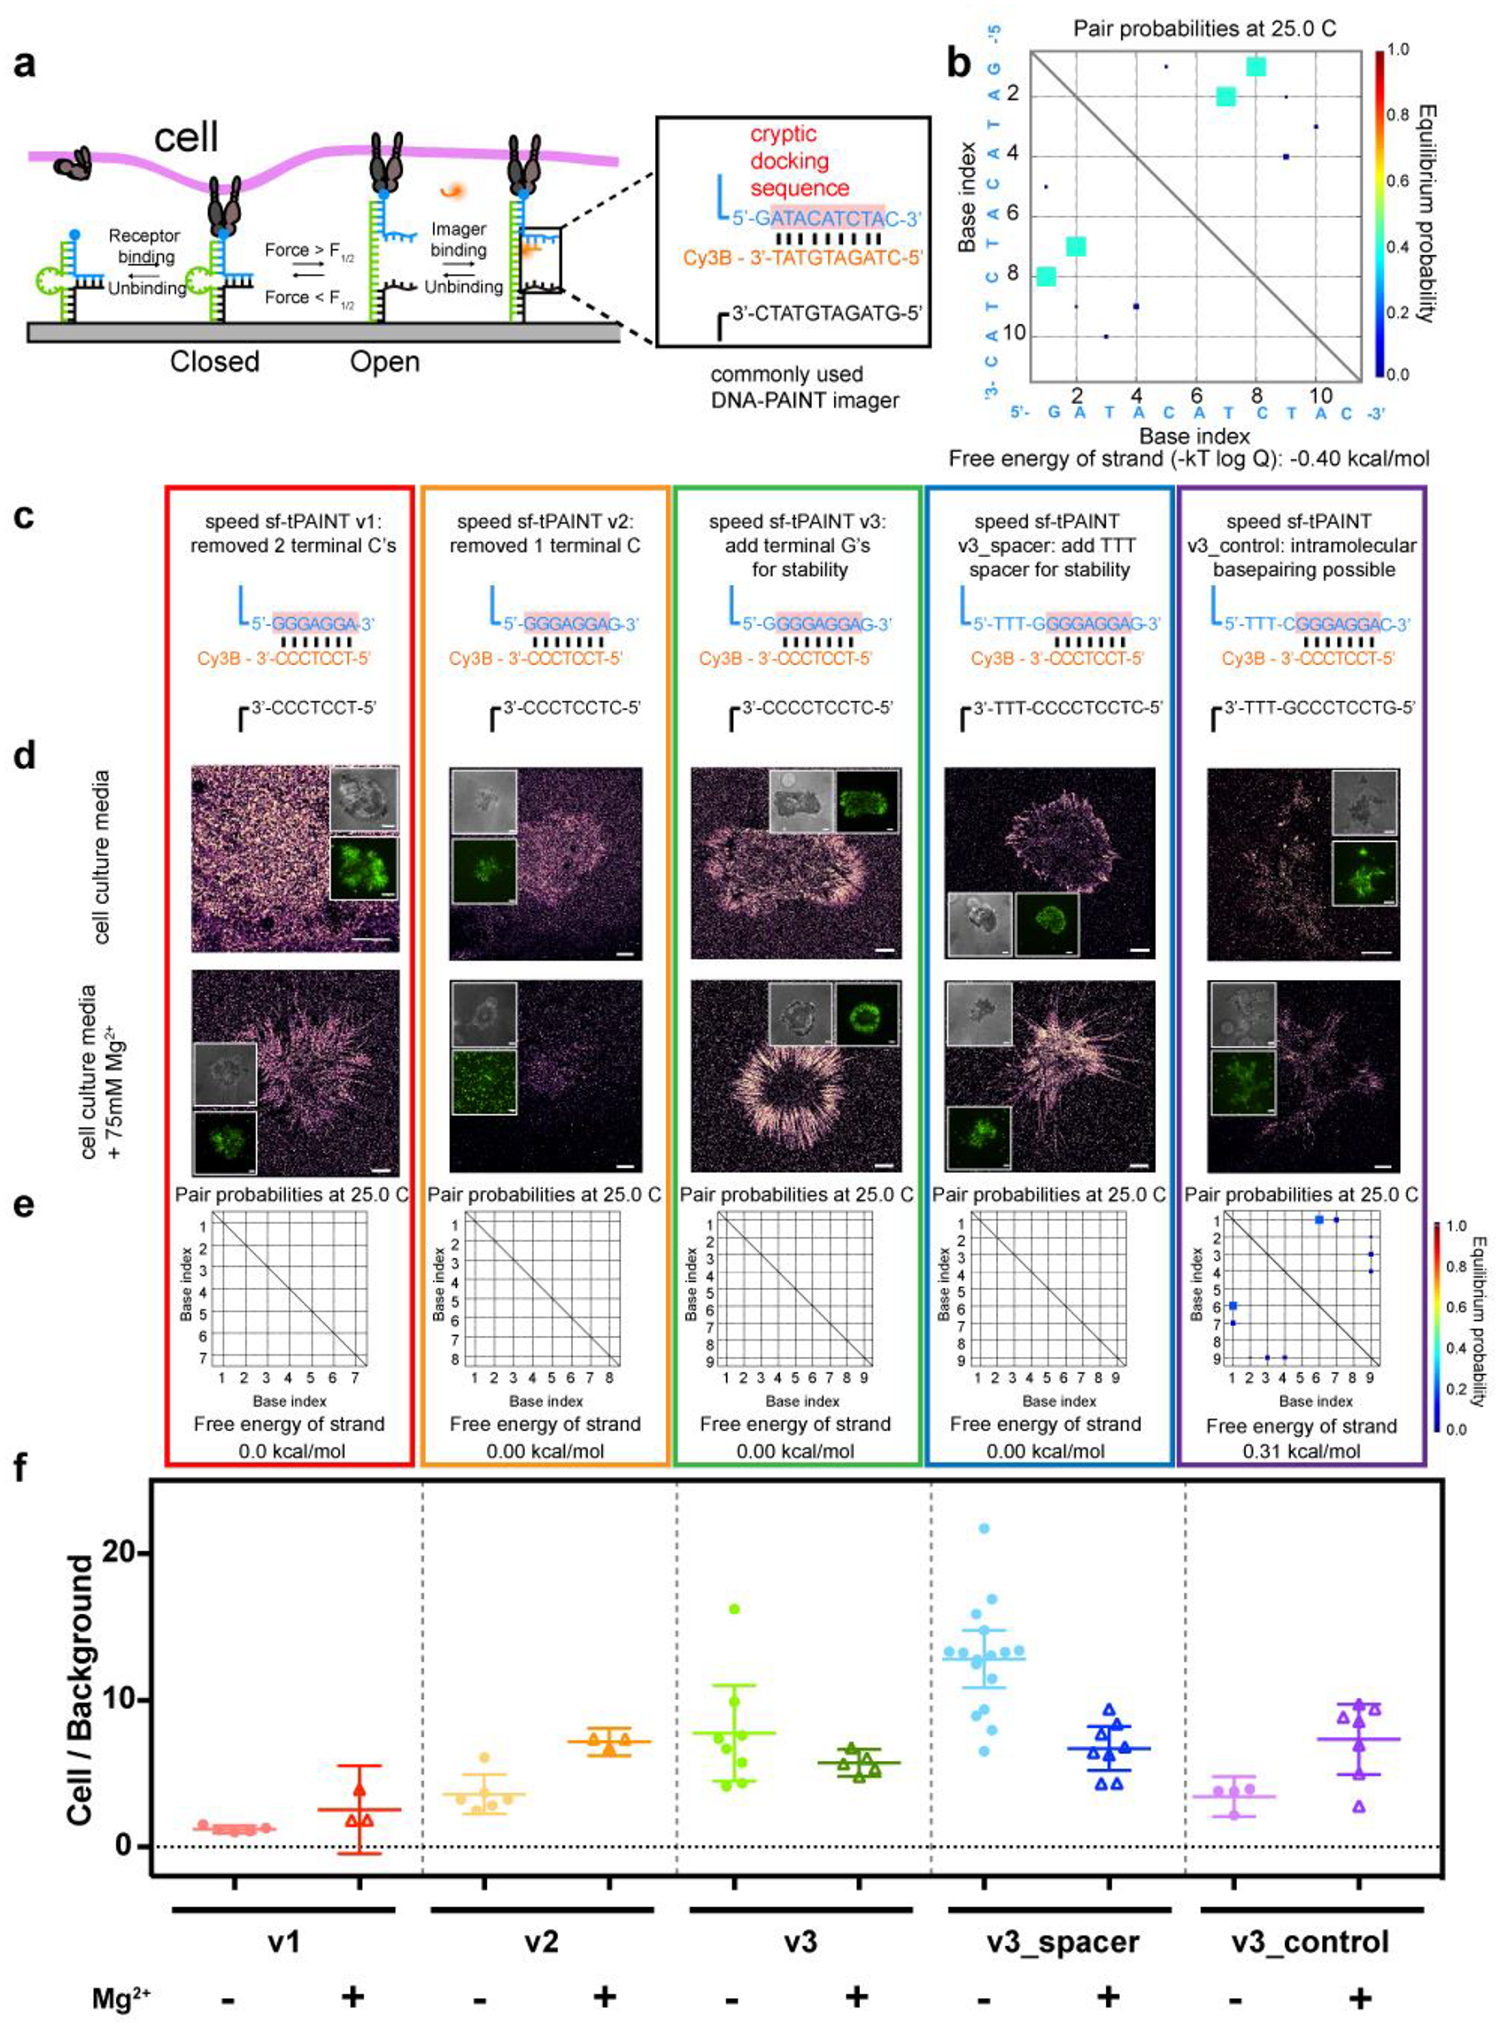
(a) Schematic of sf-tPAINT probes. (b) NUPACK modeling of self-base-pairing propensity of the imager. (c) Sequences/designs of speed-optimized sf-tPAINT docking sites (blue) that avoid self-interaction. Imager docking site highlighted in pink. (d) Representative speed sf-tPAINT images of MEF GFP-vinculin cells imaged in cell culture media (~0.8 mM Mg2+) and in 75 mM Mg2+ supplemented media. (e) NUPACK modeling of speed sf-tPAINT probes. (f) Ratio of tPAINT localizations versus background localizations. Each point in (f) is a single cell. Number of replicates: v1_no Mg2+ (5 cells, n =3 experiments), v1_ Mg2+ (3 cells, n = 3 experiments), v2_no Mg2+(6 cells, n = 3 experiments), v2_Mg2+ (3 cells, n = 3 experiments), v3_no Mg2+ (8 cells, n = 3 experiments), v3_Mg2+(5 cells, n = 3 experiments), and v3_spacer_no Mg2+(16 cells, n = 4 experiments), v3_spacer_Mg2+ (8 cells, n = 4 experiments), v3_control_no Mg2+ (4 cells, n = 4 experiments), v3_control_Mg2+ (7 cells, n = 3 experiments). All scale bars are 5 μm. Data were compared via a 2-way ANOVA. v3_spacer (in the no added Mg2+ case) is statistically different from v1 (p=5.3×10⁻¹⁰), v2 (p=6.4×10⁻⁸), v3 (p = 0.0022), and v3_control (p=2.2×10⁻⁶). The v3_spacer exhibits the greatest signal-to-noise ratio. Data in f is displayed as mean with 95% CI. v1 (no Mg2+) Mean= 1.21, CI 0.96–1.46, sd 0.20; v1 (Mg2+) Mean= 2.54, CI 0.47–5.55, sd 1.21; v2 (no Mg2+) Mean= 3.60, CI 2.24–4.95, sd 1.29; v2 (Mg2+) Mean= 7.17, CI 6.23–8.11, sd 0.38; v3 (no Mg2+) Mean= 7.76, CI 4.49–11.02, sd 3.90; v3 (Mg2+) Mean= 5.73, CI 4.81–6.66, sd 0.74; v3_spacer (no Mg2+) Mean= 12.82, CI 10.86–14.78, sd 3.67; v3_spacer (Mg2+) Mean= 6.72, CI 5.22–8.22, sd 1.80; v3_control (no Mg2+) Mean= 3.43, CI 2.09–4.78, sd 0.84; v3_control (Mg2+) Mean= 7.34, CI 4.95–9.74, sd 2.59.
Extended Data Figure 6: Background localizations are imager-sequence specific.
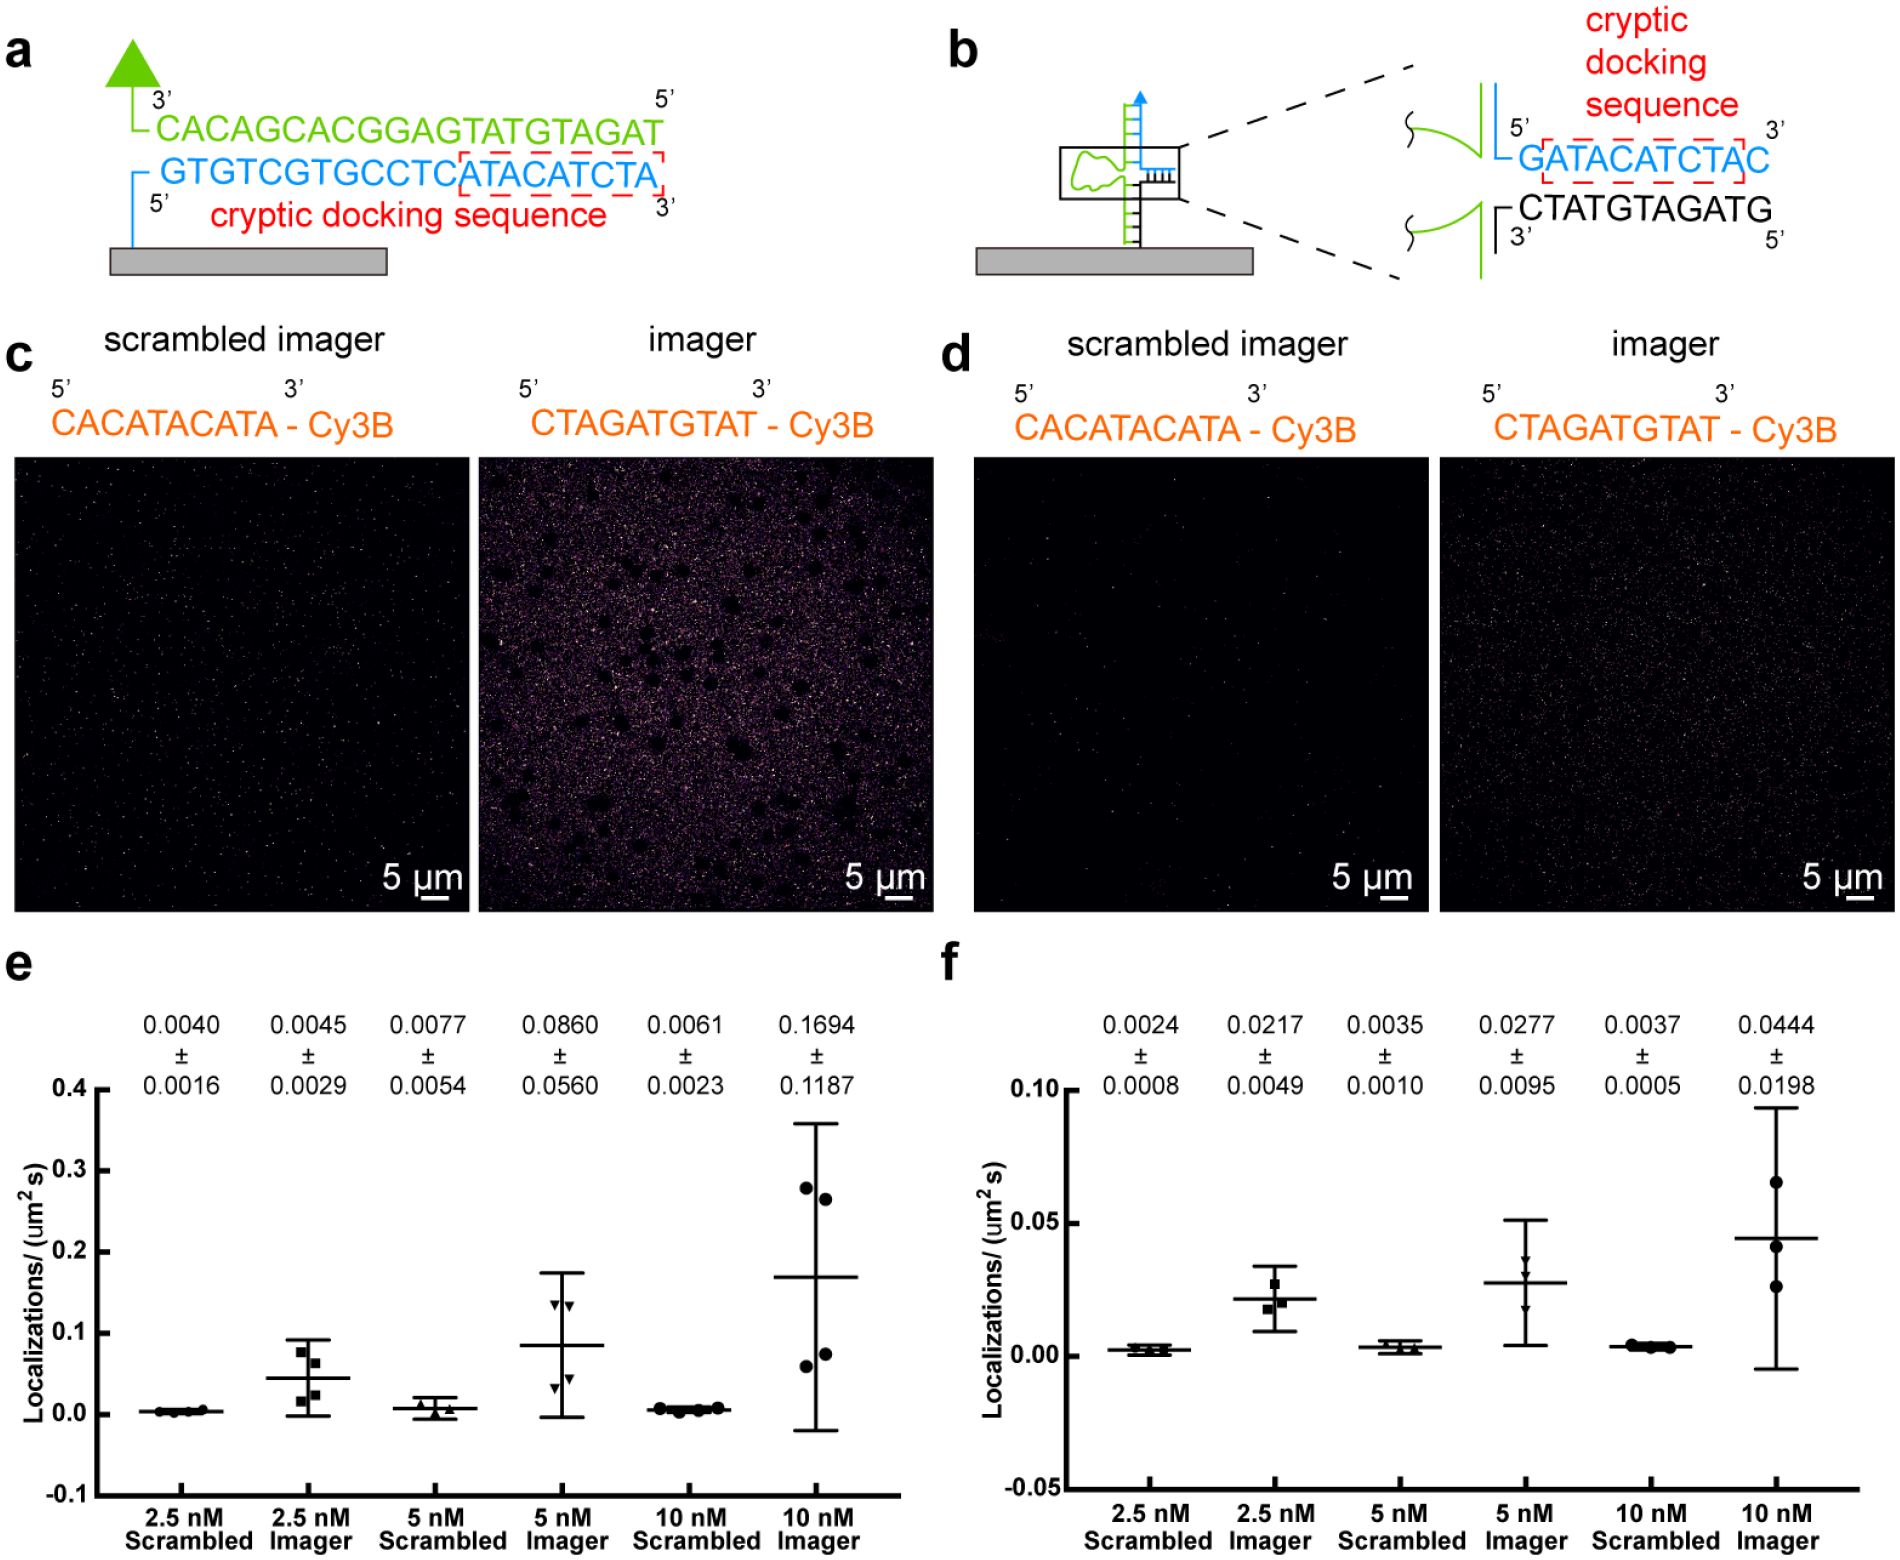
(a) Accumulated-tPAINT or (b) sf-tPAINT surfaces were incubated with scrambled-imager and specific imager. (c) Representative images compiled from 2000 frames of single molecule localization for accumulated-tPAINT surfaces and (d) sf-tPAINT probes incubated with 5 nM scrambled and specific imagers. The average localizations/(μm2s) were quantified at 2.5, 5, and 10 nM scrambled and specific imagers for (e) accumulated-tPAINT (n = 4 independent experiments) and (f) sf-tPAINT surfaces (n= 3 independent experiments). Localization density was computed for 5 regions per image to compute an average (black points). Mean ± standard deviation is noted above each category. Error bars are 95% CI. 2.5nM (accumulated-tPAINT, Scrambled): Mean= 0.0040, 95% CI 0.0015–0.0066; 2.5nM (accumulated-tPAINT, Specific): Mean= 0.045, 95% CI −0.0017–0.092; 5nM (accumulated-tPAINT, Scrambled): Mean= 0.0077, 95% CI −0.0057–0.02101; 5nM (accumulated-tPAINT, Specific): Mean= 0.086, 95% CI −0.0032–0.17; 10 nM (accumulated-tPAINT, Scrambled): Mean= 0.0061, 95% CI 0.0025–0.0097; 10 nM (accumulated-tPAINT, Specific): Mean= 0.17, 95% CI −0.020–0.36; 2.5 nM (sf-tPAINT, Scrambled): Mean= 0.0024, 95% CI 0.00057–0.0043; 2.5 nM (sf-tPAINT, Specific): Mean= 0.022, 95% CI 0.0094–0.034; 5 nM (sf-tPAINT, Scrambled): Mean= 0.0035, 95% CI 0.0011–0.0059; 5nM (sf-tPAINT, Specific): Mean= 0.028, 95% CI 0.0041–0.051; 10nM (sf-tPAINT, Scrambled): Mean= 0.0037, 95% CI 0.0024–0.0050; 10nM (sf-tPAINT, Specific): Mean= 0.044, 95% confidence interval −0.0048–0.094. Data were compared via a 2-way ANOVA. For localization on accumulated-tPAINT probe surface: 2.5 nM scramble versus 2.5 specific (p=0.9968); 5 nM scramble versus 5 nM specific (p=0.7527); 10 nM scramble is statistically different than 10 nM specific (p=0.0115). For localization on sf-tPAINT probe surface: 2.5 nM scramble versus 2.5 specific (p=0.3153); 5 nM scramble versus 5 nM specific (p=0.1051); 10 nM scramble is statistically different than 10 nM specific (p=0.0023).
Extended Data Figure 7: Schematic showing the filtering algorithm and effect of filtering on representative data.
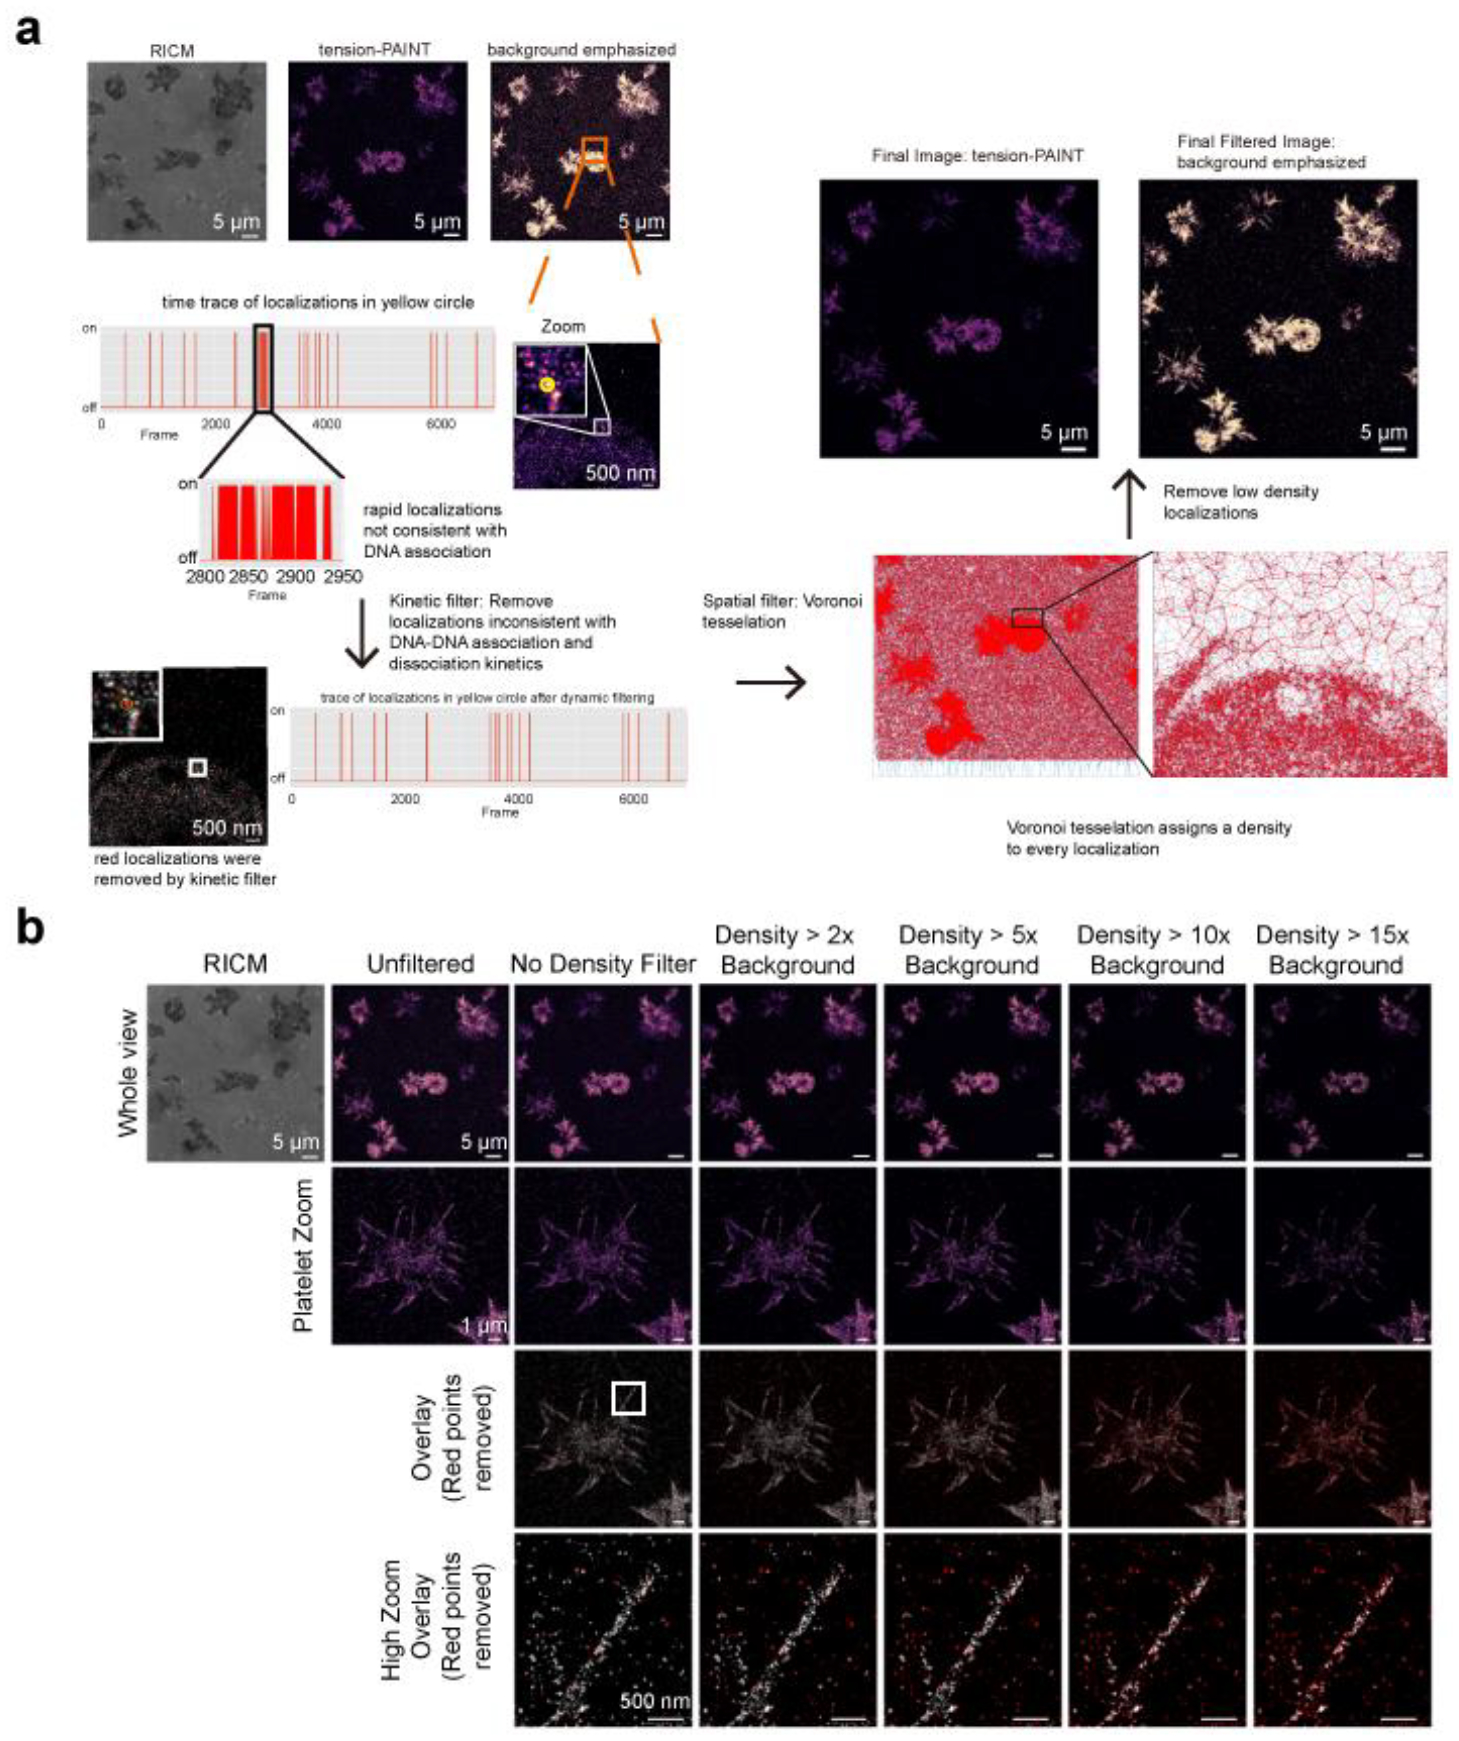
(a) First, tPAINT data was subjected to kinetic and density-based filtering prior to analysis. Kinetic filtering was accomplished via a 25-frame moving window of time traces of localizations within 35 nm oversampled pixels. If 14 events occurred within the 25-frame window (corresponding to 2.8 s of accumulated single molecule bond lifetime), all the component events were removed. Second, a Voronoi-tessellation assigned a polygon, comprised of all points closer to that localization than to any other localization, to each tPAINT localization. A local “density” was computed for each localization. Localization with density lower than 2x, 5x, or 10x the background density) were removed to produce the final tPAINT image. (b) Demonstration of how increasingly stringent density filters (2x, 5x, 10x, and 15x the background localization density) affects the tPAINT signal. In the overlay, red points indicate localization density that has been removed by the density filter while white regions indicate localizations that passed the density threshold. The high zoom overlay displays the raw localizations as points, not gaussians. At the highest density-based filter settings, localizations on the edge of the filopodial extension are removed (high zoom overlay, 10x and 15x density filter). Scale bars: whole image view, 5 μm; platelet zoom view, 1 μm; high zoom view; 500 nm. The processing described in (a) and (b) above were applied to all tPAINT data reported in this manuscript: platelets sf-tPAINT n = 3 independent experiments, 3 donors, 8 images; fibroblasts n = 4 experiments, 10 images; accumulated-tPAINT platelets, n = 8 replicates, 3 donors, 22 images; n = 9 replicates, 24 images.
Extended Data Figure 8: Cellular tension feature dimensions depend on the imaging window in sf-tPAINT.
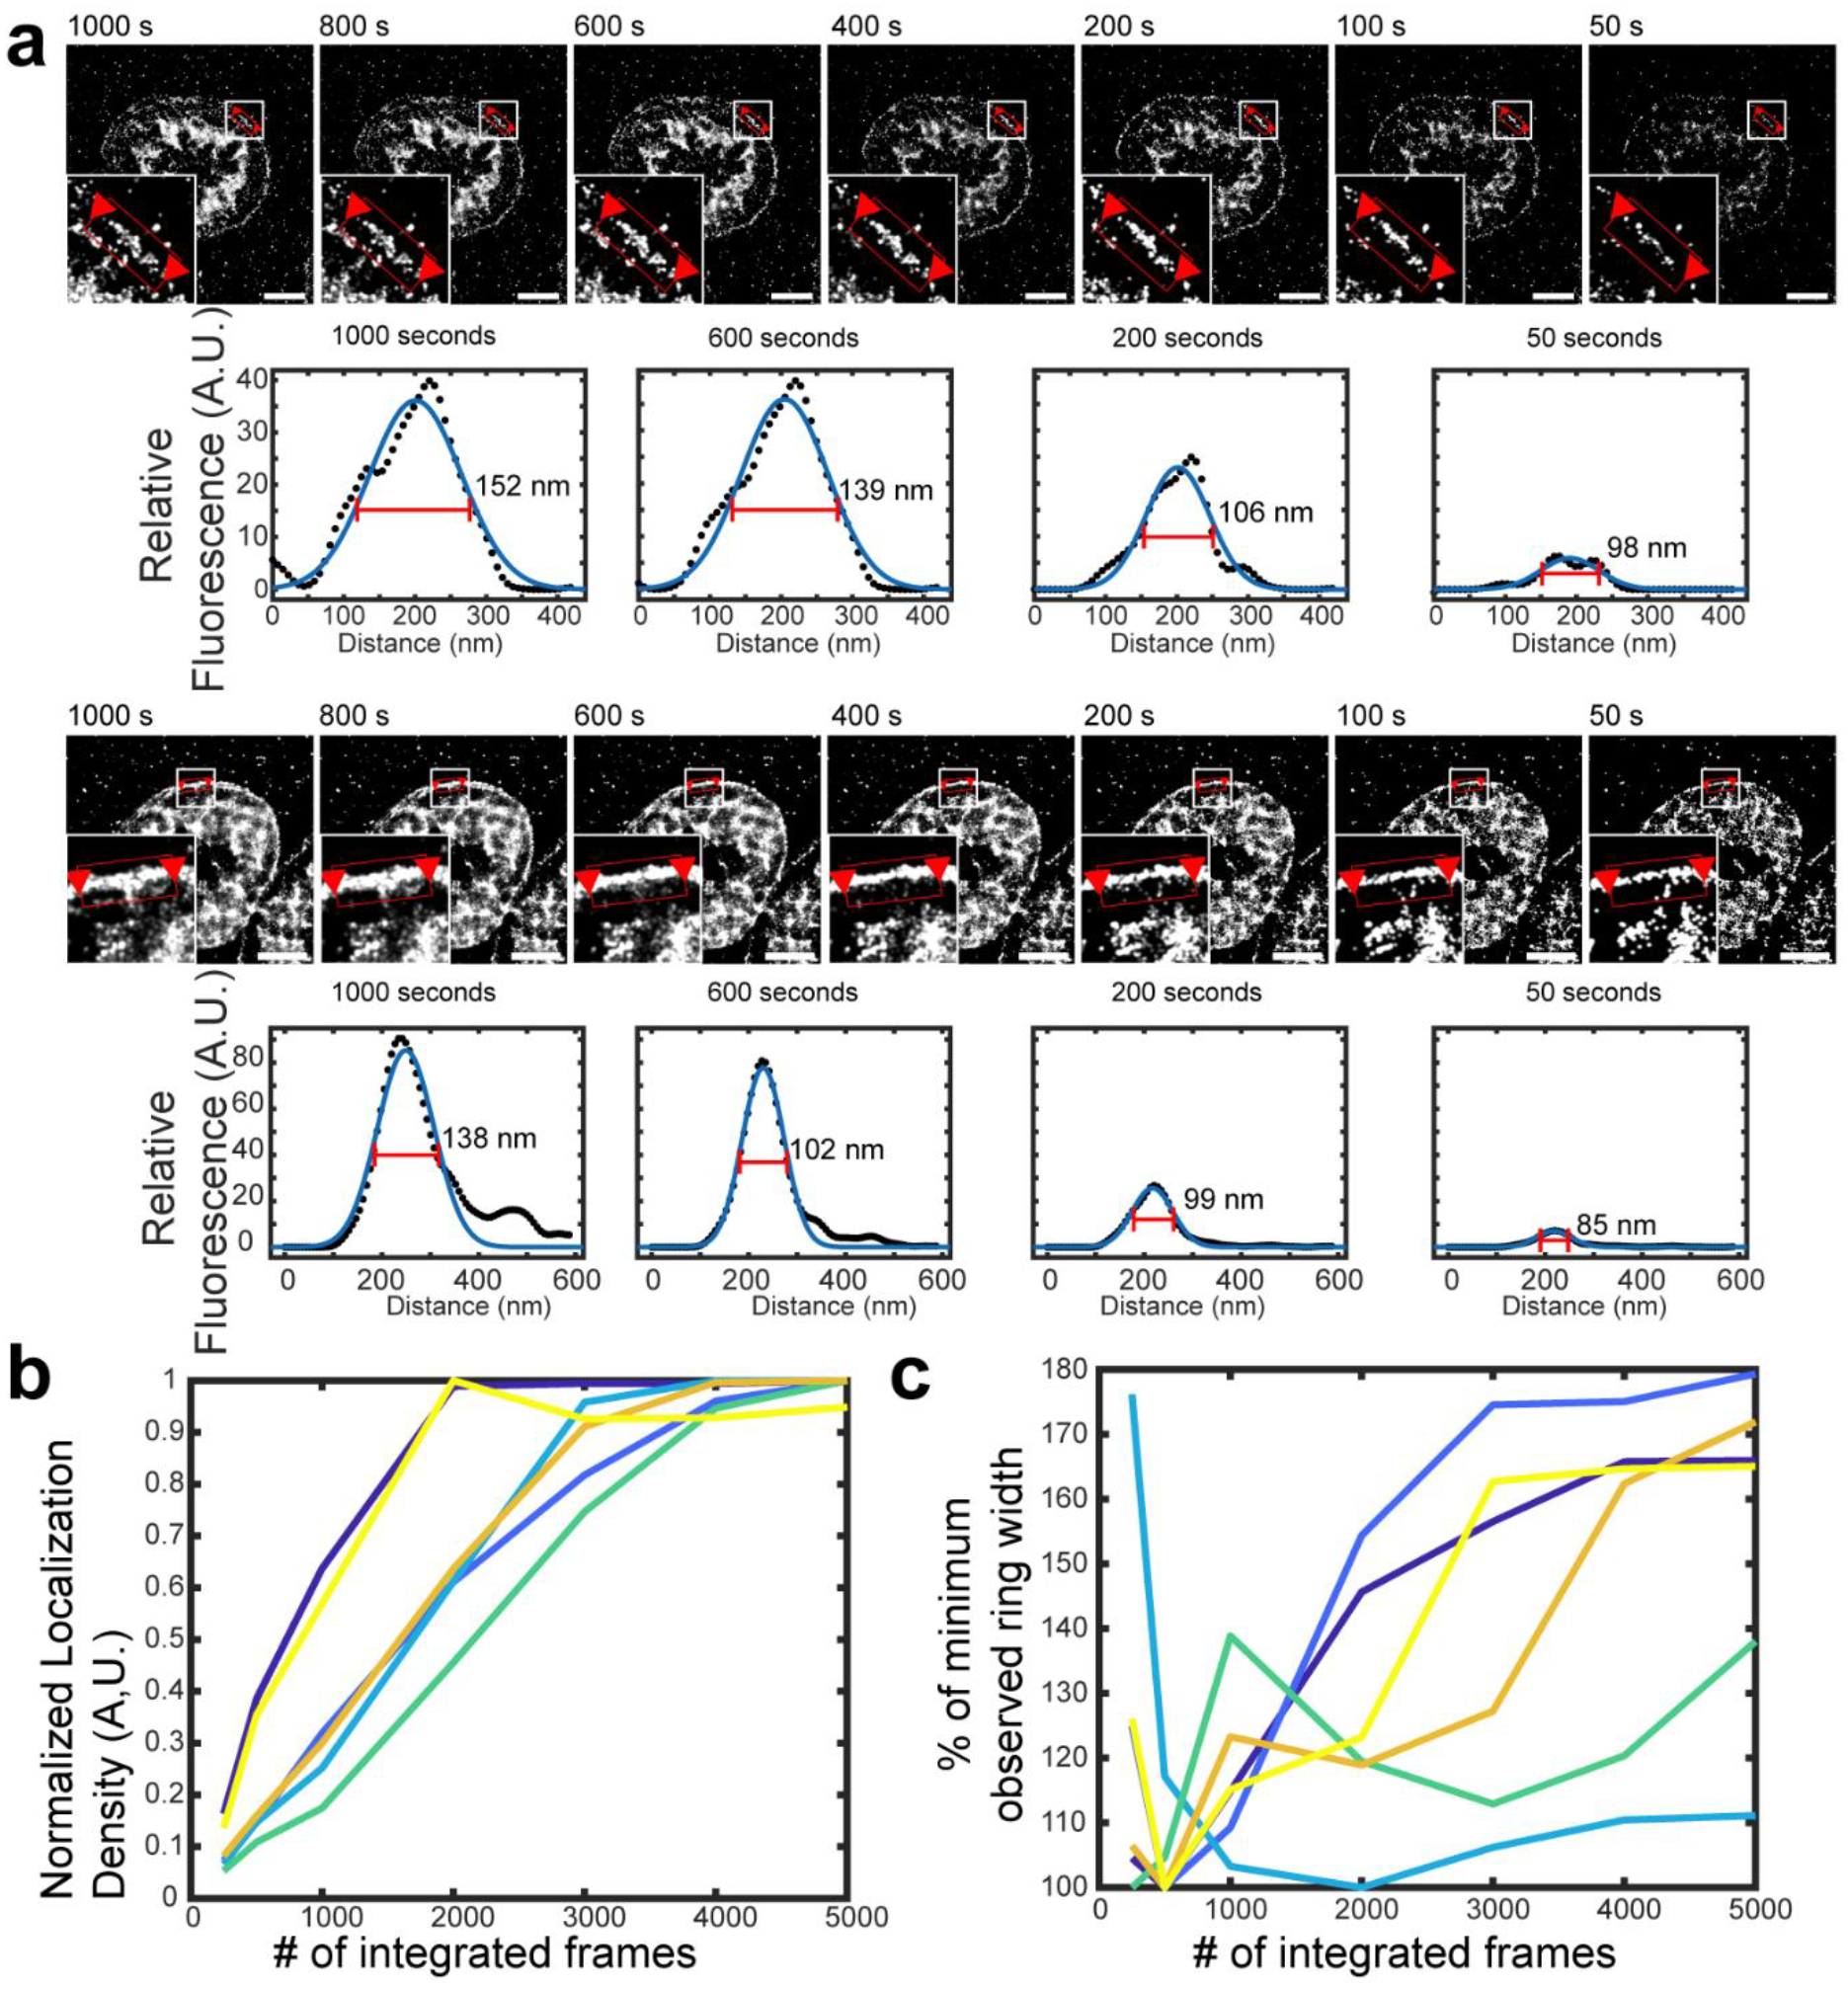
(a) Live-cell sf-tPAINT imaging of platelet tension displayed using different time windows (ranging from 50 sec to 1000 sec). The apparent length or width of cellular tension features depends on the number of frames that are integrated to produce a super-resolved image. To demonstrate this point, we rendered the lamellipodial edge of 3 human platelets (from n = 3 independent experiments, 2 platelets shown) and measured the apparent width of the lamellipodial edge tension ring as tPAINT data is integrated over various time windows. Super-resolved tPAINT images were rendered as greyscale images, and ring width was measured via linescan analysis (black dots). The data were fit to a gaussian via Matlab’s curvefitting tool (blue line). The measured FWHM of the fitted gaussians depends on the number of frames integrated to produce the super-resolved tPAINT image. (b) Plot showing that the localization density generally increased with increasing the number of integrated frames. Each color shows a unique ROI. (c) Plot showing the relation between the FWHM of the tension ring and the number of integrated frames. The data shown are from 3 human platelets from n = 3 independent experiments (2 linescans per platelet). In principle, it is desirable to use the minimum number of frames possible to render an image in order to minimize feature blurring due to cellular dynamics during the imaging window; however, image quality decreases, with localizations becoming more punctate, when fewer frames are integrated. To produce high-quality tPAINT images, these considerations must both be balanced. All scale bars are 2 μm.
Extended Data Figure 9: Collage of examples showing sf-tPAINT of human platelets treated with cytoskeletal inhibitors.
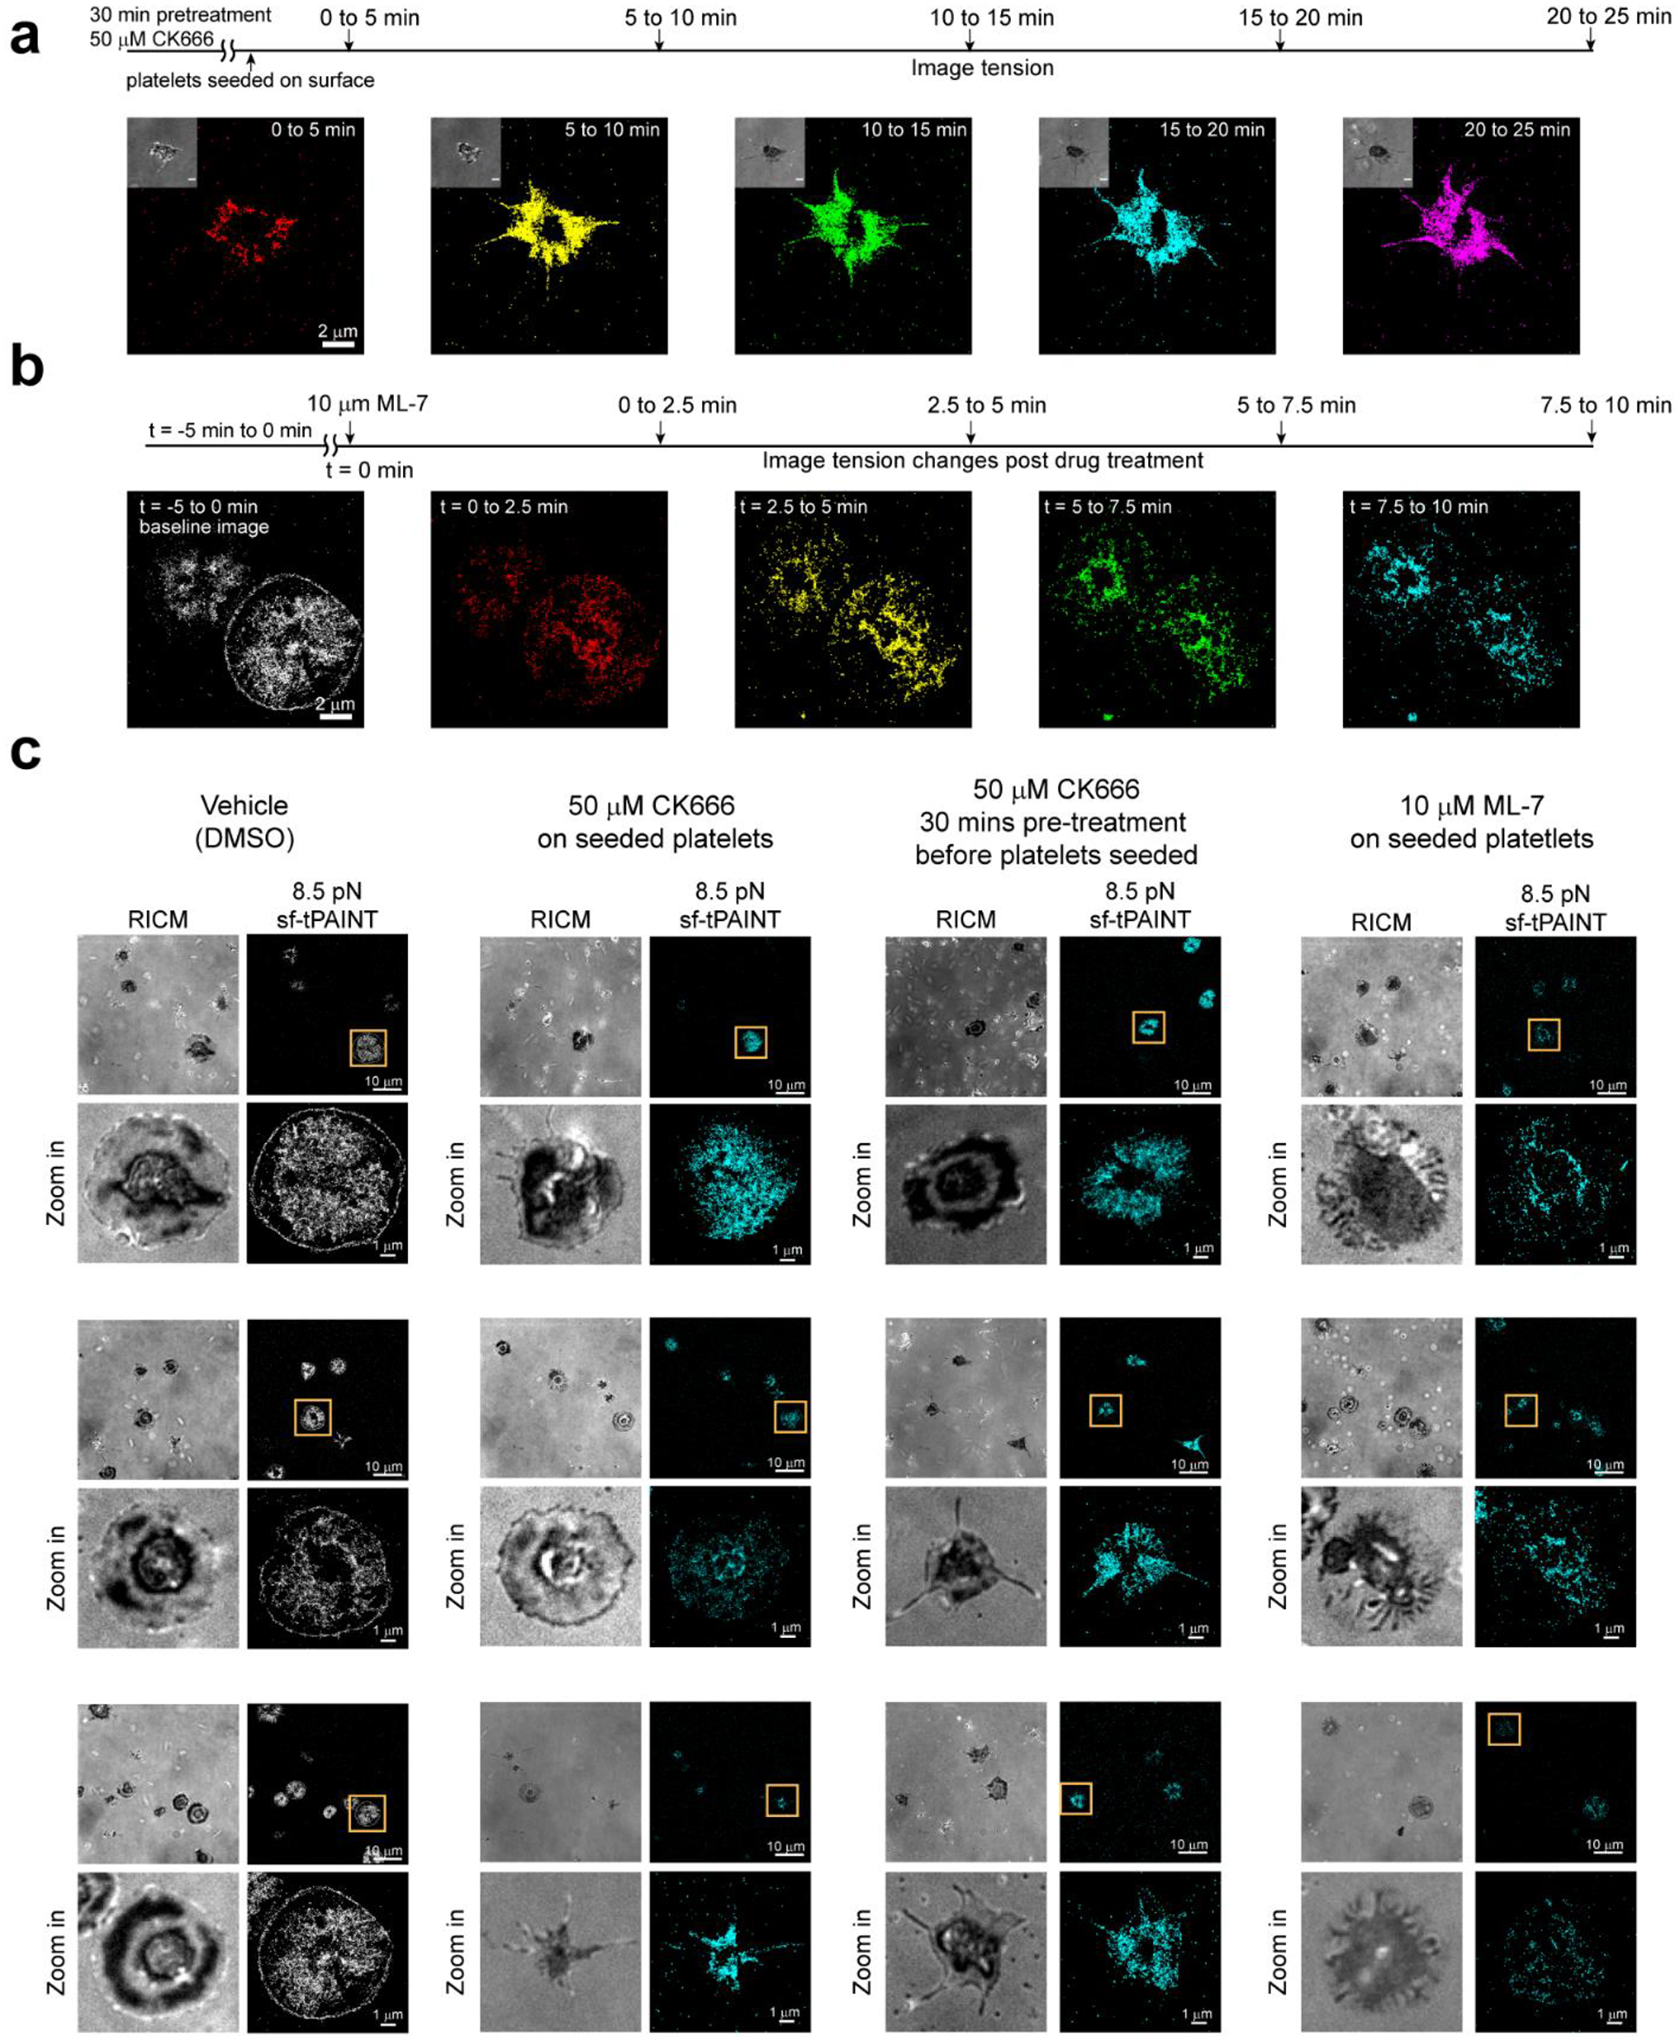
(a) Time-resolved 8.5 pN tPAINT of platelets pre-treated with 50 μM CK666 for 30 min before being seeded on sf-tPAINT probes. (b) Time-resolved 8.5 pN tPAINT image of platelet before and after treatment with 10μM ML-7 (MLCK inhibitor). (c). Representative examples of images for cells treated with inhibitors displayed with a 5x density filter and kinetic filter. Human platelets treated with vehicle (DMSO) as control (n = 3 independent experiments), human platelets treated with CK666 (50μM) after being seeded on the surface (n = 2 independent experiments), human platelets pretreated with CK666 (50 μM) for 30 min before being seeded on the surface (n = 3 independent experiments), human platelets treated with ML-7 (MLCK inhibitor, 10 μM) after being seeded on the surface (n = 3 independent experiments). Three examples are shown for each condition.
Extended Data Figure 10: Surface density of tPAINT probes on the coverslip.
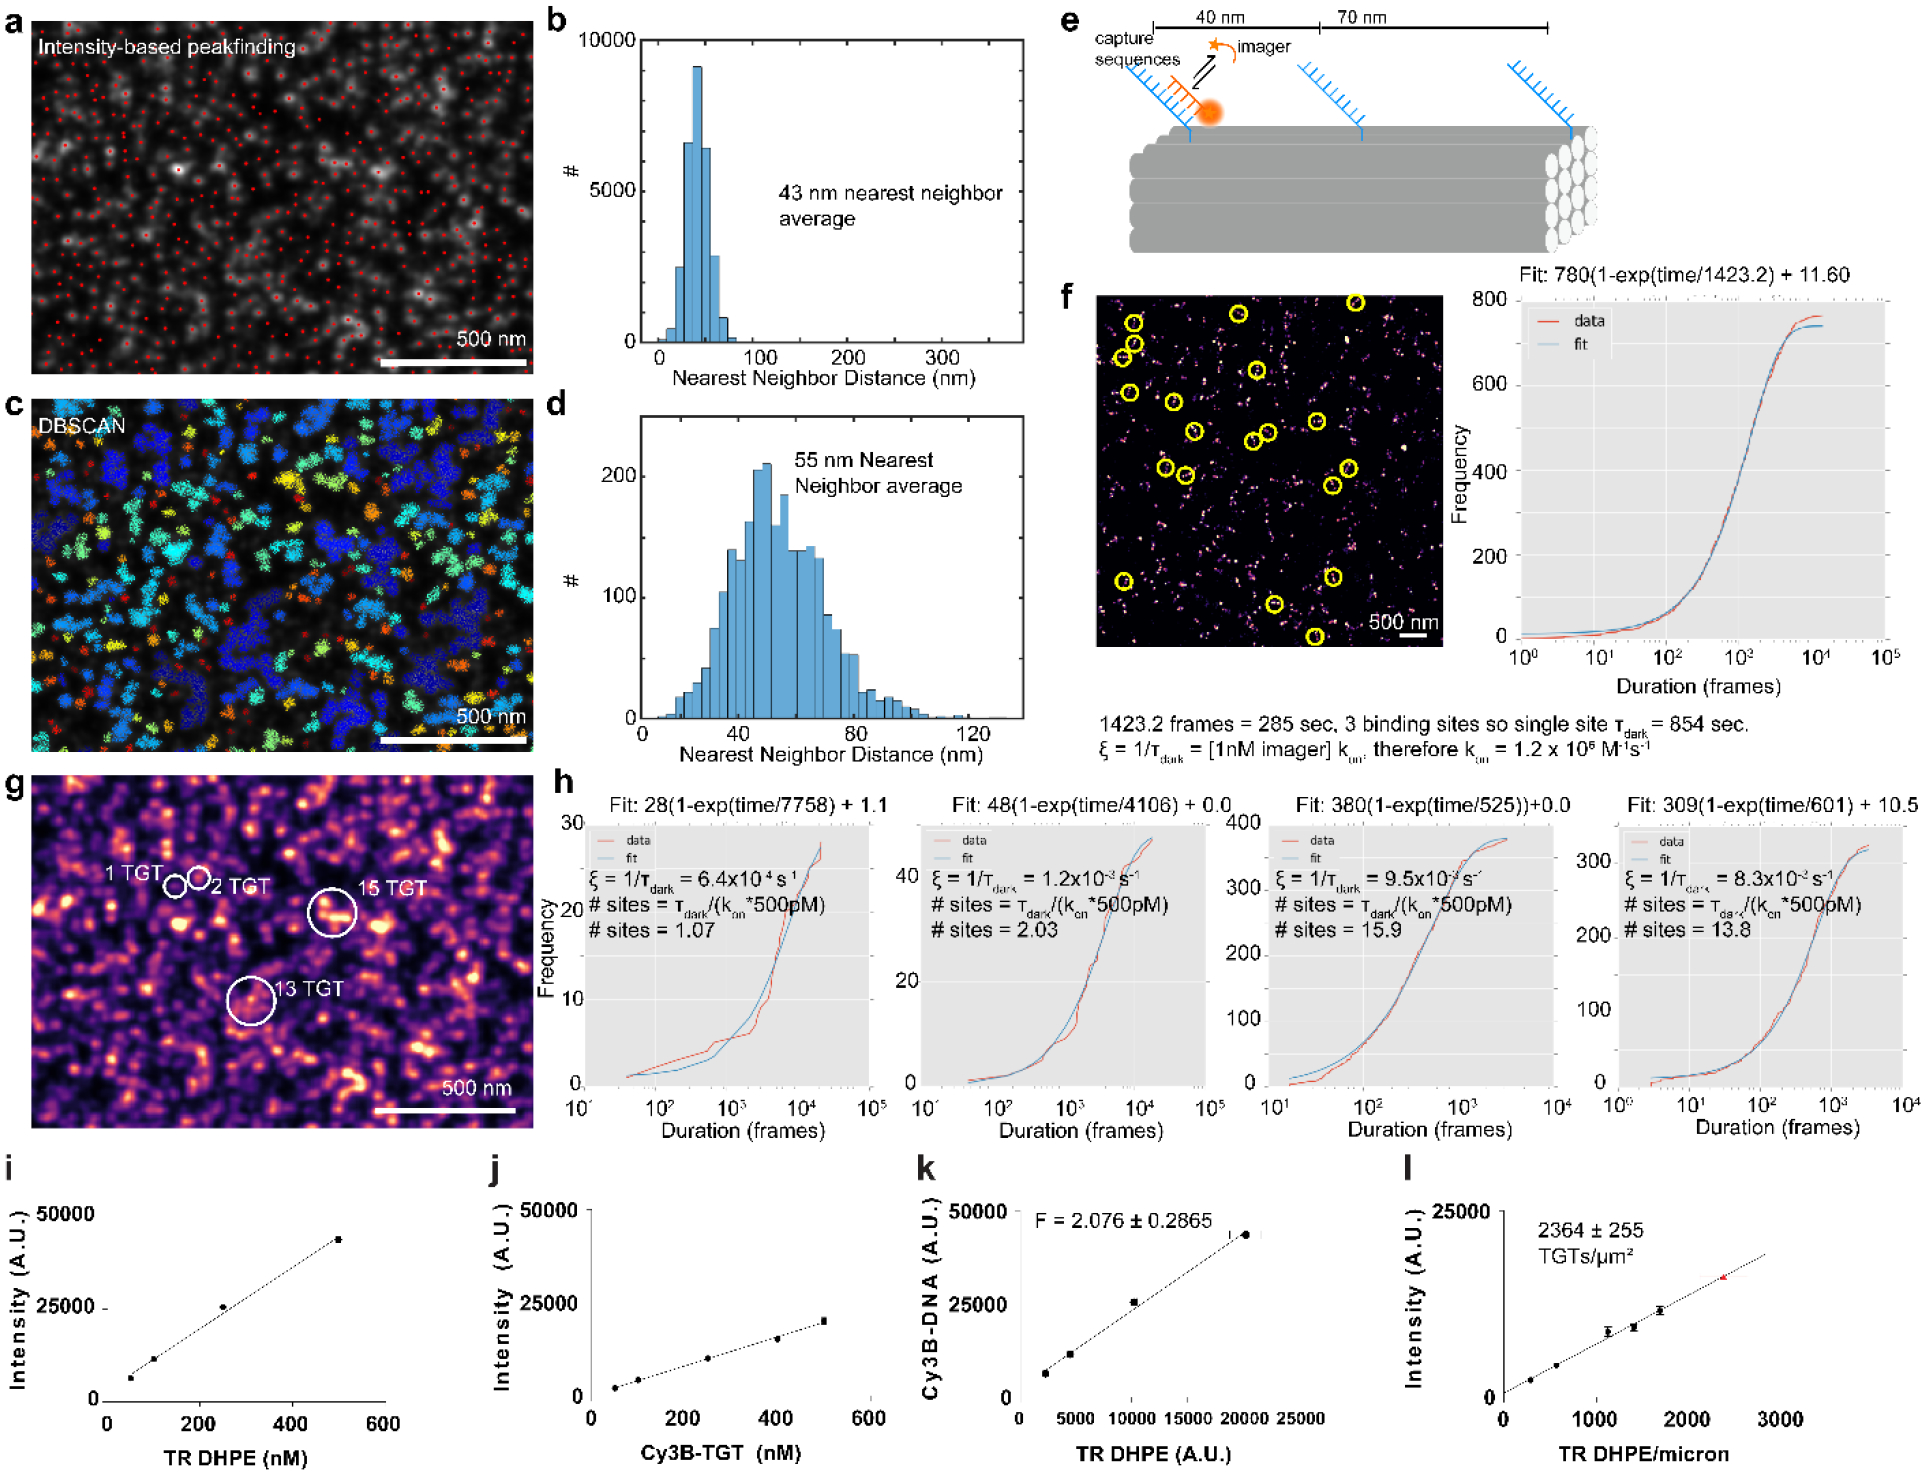
(a) DNA-PAINT imaging of docking site coated surfaces (500 pM Cy3B-imager, 150,000–200,000 frames). Intensity-based peakfinding identified localization clusters (red dots). (b) Histogram of nearest-neighbor distances reveals average cluster-cluster distance of 43 nm. (c) Alternate DBSCAN clustering algorithm (20 localization minimum, 0.05 pixel search radius) identified clusters (displayed as colored dots). (d) Nearest-neighbor histogram of the centroids of the clusters identified in c reports 55nm average nearest-neighbor distance. Images in a and c are representative of n = 3 independent experiments. (e-h) Variations in cluster localization density suggested peakfinding/DBSCAN did not identify individual docking sites. To count individual docking sites, we performed quantitative-PAINT (qPAINT). (e) Calibration DNA origami used for calculating imager influx rate and (f) DNA-PAINT image of origami. Images were acquired at 1, 2.5, and 5nM Cy3B imager (n = 3 independent experiments). Plot depicts cumulative distribution function of dark times between imager binding (red) and exponential fit (blue) for selected origamis (yellow circles). This analysis calculated kon as 1.2×10⁶M−1s−1. (g-h) qPAINT of tPAINT surface reveal dense, heterogeneous clusters of docking sites on the surface (i-l). Quantitative measurements of the surface density of probes were performed to supplement qPAINT and clustering measurements. (i,j) Fluorescence intensity versus concentration for Texas-red (TR) tagged phospholipid vesicles (5 measurements per concentration per experiment, n = 3 independent experiments), and soluble Cy3B-DNA (5 measurements per concentration per experiment, n = 2 independent experiments). Error bars are standard deviation. (k) F factor calibration (ratio of TR:Cy3B fluorescence). Error bars calculated from the propagated standard deviation of Cy3B-DNA/TR-DHPE measurements. (l) To calculate tPAINT probe density, fluorescence measurements of Cy3B-DNA tPAINT surfaces (5 measurements from each of n = 3 independent experiments) were converted into density via the F factor. tPAINT probe density is 2364+/−255 probes per square micron (mean+/−propagated SEM from Cy3B and TR measurements).
Supplementary Material
Acknowledgements
J. Brockman, A. Blanchard and R. Glazier acknowledge NSF GRFP 1444932. J. Brockman acknowledges NCI fellowship F99CA234959. A. Blanchard acknowledges NCI fellowship F99CA245789. A. Kellner acknowledges NIH F31 F31CA243502. M. Quach acknowledges NIH F31 F31HL134241. H. Ogasawara acknowledges grant from The Naito Foundation and postdoctoral fellowship from The Uehara Memorial Foundation. B. Petrich acknowledges NIH grant HL117061. R. Li acknowledges NIH grant HL082808. Y. Ke acknowledges NIH 1R21AI135753-01, NSF DMR-1654485, and SRC 2018-SB-2836-B. A. Mattheyses and K. Salaita acknowledge NIH grant R01GM131099. K. Salaita acknowledges NIH grant R01GM124472 and NSF CAREER 1350829. We thank Dr. V. P.Y. Ma for helpful discussions.
Footnotes
Competing interests
The authors declare no competing interests
References:
- 1.Discher DE, Janmey P & Wang YL Tissue cells feel and respond to the stiffness of their substrate. Science 310, 1139–1143 (2005). [DOI] [PubMed] [Google Scholar]
- 2.Qiu Y et al. Platelet mechanosensing of substrate stiffness during clot formation mediates adhesion, spreading, and activation. Proc Natl Acad Sci U S A (2014). [DOI] [PMC free article] [PubMed] [Google Scholar]
- 3.Liu Y et al. DNA-based nanoparticle tension sensors reveal that T-cell receptors transmit defined pN forces to their antigens for enhanced fidelity. Proc Natl Acad Sci U S A (2016). [DOI] [PMC free article] [PubMed] [Google Scholar]
- 4.Kanchanawong P et al. Nanoscale architecture of integrin-based cell adhesions. Nature 468, 580–584 (2010). [DOI] [PMC free article] [PubMed] [Google Scholar]
- 5.Spiess M et al. Active and inactive beta1 integrins segregate into distinct nanoclusters in focal adhesions. J Cell Biol 217, 1929–1940 (2018). [DOI] [PMC free article] [PubMed] [Google Scholar]
- 6.Stabley DR, Jurchenko C, Marshall SS & Salaita KS Visualizing mechanical tension across membrane receptors with a fluorescent sensor. Nature Methods 9, 64–U172 (2012). [DOI] [PubMed] [Google Scholar]
- 7.Liu Y, Yehl K, Narui Y & Salaita K Tension sensing nanoparticles for mechano-imaging at the living/nonliving interface. J Am Chem Soc 135, 5320–5323 (2013). [DOI] [PMC free article] [PubMed] [Google Scholar]
- 8.Galior K, Liu Y, Yehl K, Vivek S & Salaita K Titin-Based Nanoparticle Tension Sensors Map High-Magnitude Integrin Forces within Focal Adhesions. Nano Lett 16, 341–348 (2016). [DOI] [PMC free article] [PubMed] [Google Scholar]
- 9.Grashoff C et al. Measuring mechanical tension across vinculin reveals regulation of focal adhesion dynamics. Nature 466, 263–266 (2010). [DOI] [PMC free article] [PubMed] [Google Scholar]
- 10.Zhang Y, Ge C, Zhu C & Salaita K DNA-based digital tension probes reveal integrin forces during early cell adhesion. Nat Commun 5, 5167 (2014). [DOI] [PMC free article] [PubMed] [Google Scholar]
- 11.Blakely BL et al. A DNA-based molecular probe for optically reporting cellular traction forces. Nature Methods 11, 1229–+ (2014). [DOI] [PMC free article] [PubMed] [Google Scholar]
- 12.Sahl SJ, Hell SW & Jakobs S Fluorescence nanoscopy in cell biology. Nat Rev Mol Cell Biol 18, 685–701 (2017). [DOI] [PubMed] [Google Scholar]
- 13.Dai M, Jungmann R & Yin P Optical imaging of individual biomolecules in densely packed clusters. Nat Nanotechnol 11, 798–807 (2016). [DOI] [PMC free article] [PubMed] [Google Scholar]
- 14.Schnitzbauer J, Strauss MT, Schlichthaerle T, Schueder F & Jungmann R Super-resolution microscopy with DNA-PAINT. Nat Protoc 12, 1198–1228 (2017). [DOI] [PubMed] [Google Scholar]
- 15.Jungmann R et al. Multiplexed 3D cellular super-resolution imaging with DNA-PAINT and Exchange-PAINT. Nat Methods 11, 313–318 (2014). [DOI] [PMC free article] [PubMed] [Google Scholar]
- 16.Jayasinghe I et al. True Molecular Scale Visualization of Variable Clustering Properties of Ryanodine Receptors. Cell Rep 22, 557–567 (2018). [DOI] [PMC free article] [PubMed] [Google Scholar]
- 17.Whitley KD, Comstock MJ & Chemla YR Elasticity of the transition state for oligonucleotide hybridization. Nucleic Acids Res 45, 547–555 (2017). [DOI] [PMC free article] [PubMed] [Google Scholar]
- 18.Woodside MT et al. Nanomechanical measurements of the sequence-dependent folding landscapes of single nucleic acid hairpins. Proc Natl Acad Sci U S A 103, 6190–6195 (2006). [DOI] [PMC free article] [PubMed] [Google Scholar]
- 19.Brockman JM et al. Mapping the 3D orientation of piconewton integrin traction forces. Nat Methods 15, 115–118 (2018). [DOI] [PMC free article] [PubMed] [Google Scholar]
- 20.Zhang Y et al. Platelet integrins exhibit anisotropic mechanosensing and harness piconewton forces to mediate platelet aggregation. Proc Natl Acad Sci U S A 115, 325–330 (2018). [DOI] [PMC free article] [PubMed] [Google Scholar]
- 21.Ting LH et al. Contractile forces in platelet aggregates under microfluidic shear gradients reflect platelet inhibition and bleeding risk. Nat Commun 10, 1204 (2019). [DOI] [PMC free article] [PubMed] [Google Scholar]
- 22.Chen Y et al. An integrin alphaIIbbeta3 intermediate affinity state mediates biomechanical platelet aggregation. Nat Mater 18, 760–769 (2019). [DOI] [PMC free article] [PubMed] [Google Scholar]
- 23.Kong F, Garcia AJ, Mould AP, Humphries MJ & Zhu C Demonstration of catch bonds between an integrin and its ligand. J Cell Biol 185, 1275–1284 (2009). [DOI] [PMC free article] [PubMed] [Google Scholar]
- 24.Schueder F et al. An order of magnitude faster DNA-PAINT imaging by optimized sequence design and buffer conditions. Nat Methods (2019). [DOI] [PubMed] [Google Scholar]
- 25.Liu Y et al. Nanoparticle tension probes patterned at the nanoscale: impact of integrin clustering on force transmission. Nano Lett 14, 5539–5546 (2014). [DOI] [PMC free article] [PubMed] [Google Scholar]
- 26.Plotnikov SV, Pasapera AM, Sabass B & Waterman CM Force fluctuations within focal adhesions mediate ECM-rigidity sensing to guide directed cell migration. Cell 151, 1513–1527 (2012). [DOI] [PMC free article] [PubMed] [Google Scholar]
- 27.Gustafsson N et al. Fast live-cell conventional fluorophore nanoscopy with ImageJ through super-resolution radial fluctuations. Nat Commun 7, 12471 (2016). [DOI] [PMC free article] [PubMed] [Google Scholar]
- 28.Levet F et al. SR-Tesseler: a method to segment and quantify localization-based super-resolution microscopy data. Nat Methods 12, 1065–1071 (2015). [DOI] [PubMed] [Google Scholar]
- 29.Mayr S et al. Localization Microscopy of Actin Cytoskeleton in Human Platelets. Int J Mol Sci 19 (2018). [DOI] [PMC free article] [PubMed] [Google Scholar]
- 30.Bearer EL, Prakash JM & Li Z Actin dynamics in platelets. Int Rev Cytol 217, 137–182 (2002). [DOI] [PMC free article] [PubMed] [Google Scholar]
- 31.Hartwig JH Mechanisms of actin rearrangements mediating platelet activation. J Cell Biol 118, 1421–1442 (1992). [DOI] [PMC free article] [PubMed] [Google Scholar]
- 32.Gaertner F et al. Migrating Platelets Are Mechano-scavengers that Collect and Bundle Bacteria. Cell 171, 1368–1382 e1323 (2017). [DOI] [PubMed] [Google Scholar]
- 33.Li Z, Kim ES & Bearer EL Arp2/3 complex is required for actin polymerization during platelet shape change. Blood 99, 4466–4474 (2002). [DOI] [PMC free article] [PubMed] [Google Scholar]
- 34.Wang X & Ha T Defining single molecular forces required to activate integrin and notch signaling. Science 340, 991–994 (2013). [DOI] [PMC free article] [PubMed] [Google Scholar]
- 35.Endesfelder U, Malkusch S, Fricke F & Heilemann M A simple method to estimate the average localization precision of a single-molecule localization microscopy experiment. Histochem Cell Biol 141, 629–638 (2014). [DOI] [PubMed] [Google Scholar]
- 36.Strauss S et al. Modified aptamers enable quantitative sub-10-nm cellular DNA-PAINT imaging. Nat. Methods 15, 685–688 (2018). [DOI] [PMC free article] [PubMed] [Google Scholar]
- 37.Li J et al. Exploring the speed limit of toehold exchange with a cartwheeling DNA acrobat. Nat Nanotechnol 13, 723–729 (2018). [DOI] [PubMed] [Google Scholar]
- 38.Polacheck WJ & Chen CS Measuring cell-generated forces: a guide to the available tools. Nat Methods 13, 415–423 (2016). [DOI] [PMC free article] [PubMed] [Google Scholar]
- 39.Colin-York H et al. Super-Resolved Traction Force Microscopy (STFM). Nano Letters 16, 2633–2638 (2016). [DOI] [PMC free article] [PubMed] [Google Scholar]
- 40.Cox S et al. Bayesian localization microscopy reveals nanoscale podosome dynamics. Nat Methods 9, 195–200 (2011). [DOI] [PMC free article] [PubMed] [Google Scholar]
- 41.Morimatsu M, Mekhdjian AH, Chang AC, Tan SJ & Dunn AR Visualizing the interior architecture of focal adhesions with high-resolution traction maps. Nano Lett 15, 2220–2228 (2015). [DOI] [PMC free article] [PubMed] [Google Scholar]
- 42.Pryshchep S, Zarnitsyna VI, Hong J, Evavold BD & Zhu C Accumulation of serial forces on TCR and CD8 frequently applied by agonist antigenic peptides embedded in MHC molecules triggers calcium in T cells. J Immunol 193, 68–76 (2014). [DOI] [PMC free article] [PubMed] [Google Scholar]
- 43.Elosegui-Artola A et al. Mechanical regulation of a molecular clutch defines force transmission and transduction in response to matrix rigidity. Nat Cell Biol 18, 540–548 (2016). [DOI] [PubMed] [Google Scholar]
- 44.Blanchard AT, Brockman JM, Salaita K & Mattheyses AL Variable incidence angle linear dichroism (VALiD): a technique for unique 3D orientation measurement of fluorescent ensembles. Opt Express 28, 10039–10061 (2020). [DOI] [PMC free article] [PubMed] [Google Scholar]
- 45.Pan H, Xia Y, Qin M, Cao Y & Wang W A simple procedure to improve the surface passivation for single molecule fluorescence studies. Phys Biol 12, 045006 (2015). [DOI] [PubMed] [Google Scholar]
- 46.Hua B et al. An improved surface passivation method for single-molecule studies. Nat. Methods 11, 1233–1236 (2014). [DOI] [PMC free article] [PubMed] [Google Scholar]
- 47.Galush WJ, Nye JA & Groves JT Quantitative fluorescence microscopy using supported lipid bilayer standards. Biophys J 95, 2512–2519 (2008). [DOI] [PMC free article] [PubMed] [Google Scholar]
- 48.Vacklin HP, Tiberg F & Thomas RK Formation of supported phospholipid bilayers via co-adsorption with beta-D-dodecyl maltoside. Biochim Biophys Acta 1668, 17–24 (2005). [DOI] [PubMed] [Google Scholar]
Associated Data
This section collects any data citations, data availability statements, or supplementary materials included in this article.
Supplementary Materials
Data Availability Statement
The data that support the findings of this study are available from the corresponding authors upon reasonable request. Further information regarding the experimental design may be found in the Life Sciences Reporting Summary.


