

Emerging evidence supports roles for secreted extracellular matrix proteins in boosting synaptogenesis, synaptic transmission, and synaptic plasticity. SPARCL1 (also known as Hevin), a secreted non-neuronal protein, was reported to increase synaptogenesis by simultaneously binding to presynaptic neurexin-1α and to postsynaptic neuroligin-1B, thereby catalyzing formation of trans-synaptic neurexin/neuroligin complexes.
Keywords: neurexin, neuroligin, NMDAR, SPARC-like protein 1 (SPARCL1), synapse, synapse formation
Abstract
Emerging evidence supports roles for secreted extracellular matrix proteins in boosting synaptogenesis, synaptic transmission, and synaptic plasticity. SPARCL1 (also known as Hevin), a secreted non-neuronal protein, was reported to increase synaptogenesis by simultaneously binding to presynaptic neurexin-1α and to postsynaptic neuroligin-1B, thereby catalyzing formation of trans-synaptic neurexin/neuroligin complexes. However, neurexins and neuroligins do not themselves mediate synaptogenesis, raising the question of how SPARCL1 enhances synapse formation by binding to these molecules. Moreover, it remained unclear whether SPARCL1 acts on all synapses containing neurexins and neuroligins or only on a subset of synapses, and whether it enhances synaptic transmission in addition to boosting synaptogenesis or induces silent synapses. To explore these questions, we examined the synaptic effects of SPARCL1 and their dependence on neurexins and neuroligins. Using mixed neuronal and glial cultures from neonatal mouse cortex of both sexes, we show that SPARCL1 selectively increases excitatory but not inhibitory synapse numbers, enhances excitatory but not inhibitory synaptic transmission, and augments NMDAR-mediated synaptic responses more than AMPAR-mediated synaptic responses. None of these effects were mediated by SPARCL1-binding to neurexins or neuroligins. Neurons from triple neurexin-1/2/3 or from quadruple neuroligin-1/2/3/4 conditional KO mice that lacked all neurexins or all neuroligins were fully responsive to SPARCL1. Together, our results reveal that SPARCL1 selectively boosts excitatory but not inhibitory synaptogenesis and synaptic transmission by a novel mechanism that is independent of neurexins and neuroligins.
SIGNIFICANCE STATEMENT Emerging evidence supports roles for extracellular matrix proteins in boosting synapse formation and function. Previous studies demonstrated that SPARCL1, a secreted non-neuronal protein, promotes synapse formation in rodent and human neurons. However, it remained unclear whether SPARCL1 acts on all or on only a subset of synapses, induces functional or largely inactive synapses, and generates synapses by bridging presynaptic neurexins and postsynaptic neuroligins. Here, we report that SPARCL1 selectively induces excitatory synapses, increases their efficacy, and enhances their NMDAR content. Moreover, using rigorous genetic manipulations, we show that SPARCL1 does not require neurexins and neuroligins for its activity. Thus, SPARCL1 selectively boosts excitatory synaptogenesis and synaptic transmission by a novel mechanism that is independent of neurexins and neuroligins.
Introduction
During development and throughout life, synapses are formed by a multicomponent process that is controlled by synaptic organizer molecules. Synapse formation requires the initial establishment of contacts between an axon and a target cell, assembly of the presynaptic release machinery and the postsynaptic receptor apparatus, and activity-dependent specification of synapse properties (Südhof, 2018). Synapse formation is guided by two types of organizer molecules: trans-synaptic adhesion molecules and secreted factors (Ferrer-Ferrer and Dityatev, 2018; Yuzaki, 2018). Among adhesion molecules, neurexins and their ligands, including neuroligins, orchestrate synapse specification by mediating bidirectional, trans-cellular signaling (Cao and Tabuchi, 2017; Südhof, 2017; Katzman and Alberini, 2018; Wang et al., 2019). Secreted factors act by several mechanisms, for example, by enhancing the recruitment of presynaptic active zone proteins and postsynaptic scaffolding proteins (Wnts) (Sahores et al., 2010; Cerpa et al., 2011) or by connecting presynaptic and postsynaptic adhesion molecules (cerebellins) (Yuzaki, 2018). Extracellular matrix (ECM) proteins, reportedly secreted by glia (e.g., thrombospondins and glypicans), may bridge presynaptic and postsynaptic structures and cluster ionotropic glutamate receptors at postsynaptic sites (Christopherson et al., 2005; Allen et al., 2012). Although an important role in synaptogenesis is emerging for several proteins traditionally associated with the ECM, the underlying molecular mechanisms remain unknown.
The present study examines SPARCL1 (secreted protein acidic and rich in cysteine-like 1, also known as Hevin), an ECM protein that induces synapse formation in rodent and human neurons (Kucukdereli et al., 2011; Singh et al., 2016; Gan and Südhof, 2019). SPARCL1 belongs to the SPARC family of extracellular glycoproteins (Brekken and Sage, 2001). SPARCL1 contains an N-terminal acidic domain, a central cysteine-rich follistatin domain, and a C-terminal calcium-binding domain (Brekken and Sage, 2000). Little is known about how SPARCL1 is secreted and processed. Like other ECM proteins, SPARCL1 is more abundant during embryonic development than during adulthood, but its expression is upregulated in response to trauma or disease (Lively and Brown, 2008a,b).
In brain, SPARCL1 is localized to postsynaptic membranes and perisynaptic glial processes in the cerebral cortex and the cerebellum (Lively et al., 2007), raising the possibility that SPARCL1 regulates synapse formation. Indeed, Kucukdereli et al. (2011) showed that SPARCL1 induced synapses in mouse retinal ganglion cells. Surprisingly, however, these synapses were morphologically normal but did not appear to be functional. In contrast, we found that SPARCL1 promotes formation of active synapses in human excitatory neurons derived from embryonic stem cells (Gan and Südhof, 2019). Moreover, SPARCL1 reportedly enhanced synapse formation by simultaneously binding to presynaptic neurexin-1α (Nrxn1α) and postsynaptic neuroligin-1B (Nlgn1B) to form a trans-synaptic complex (Singh et al., 2016). This finding was puzzling because Nrxns form tight complexes with all neuroligins in the absence of other factors, except for Nlgn1 containing an insert in splice site B, which binds to beta- but not to alpha-Nrxns (Boucard et al., 2005; Chih et al., 2006), and because biophysical studies failed to detect binding of SPARCL1 to Nlgn1 (Elegheert et al., 2017). Moreover, deletion of all neuroligins (Varoqueaux et al., 2006; Chanda et al., 2017; Jiang et al., 2017) or all neurexins (Missler et al., 2003; Chen et al., 2017) did not decrease excitatory synapses numbers but impaired synaptic transmission. Given that neurexins and neuroligins are apparently not required for establishing initial synaptic contacts, it remained unclear how SPARCL1 could form nonfunctional excitatory synapses by binding to these adhesion molecules.
In the present study, we examined how SPARCL1 potently boosts synaptogenesis, whether it acts selectively on subsets of synapses, and what role neurexins and/or neuroligins play in its activity. Because key prior studies of SPARCL1-induced synaptogenesis were conducted in mouse neurons (Kucukdereli et al., 2011; Singh et al., 2016), we performed our experiments in mixed cultures of mouse cortical neurons and glia. We confirm that SPARCL1 induces excitatory synapse formation; however, in contrast with previous studies, we show that SPARCL1 also enhances neurotransmission by differentially elevating AMPAR- and NMDAR-mediated synaptic responses. SPARCL1 exerts a much larger effect on NMDARs, increasing the NMDAR/AMPAR ratio. Importantly, using cultures from conditional KO (cKO) mice, we determined that neurexins and neuroligins do not mediate any of these effects. Thus, SPARCL1 selectively activates excitatory synapse formation and signaling to boost synaptic connectivity by a neurexin- and neuroligin-independent mechanism.
Materials and Methods
Experimental design and statistical analyses
Male and female newborn (P0) mice were used for all experiments. Nrxn123 cKO and Nlgn1234 cKO mice were described previously (Chen et al., 2017 and Wu et al., 2019, respectively). Mice were housed in the SIM1 Animal Facility at Stanford University on a 12:12 h light-dark cycle with ad libitum access to food and water. All procedures conformed to institutional guidelines and were approved by the Administrative Panel on Laboratory Animal Care associated with the Stanford University School of Medicine.
Statistical analyses were performed using Prism 8 software (GraphPad Software) and are summarized in Table 1 (for full statistical analyses, see Extended Data). In the figures, quantitative data shown are mean ± SEM. All experiments were independently repeated at least 3 times. All statistical analyses were performed using unpaired t tests or one-way ANOVAs with Tukey's post hoc tests, comparing control and treated conditions within the same experiments. p values for all t tests and Tukey's post hoc tests for multiple comparisons are provided as Extended Data.
Table 1.
Summary of statistical analyses
| Figure | Test used | Sample size | Degree of freedom, p |
|---|---|---|---|
| 1B | Unpaired t test | 3 | T(4) = 0.2138, p = 0.8412 |
| 1C | One-way ANOVA | 3 | F(4,10) = 829.3, p < 0.0001 |
| 1D | One-way ANOVA | 3 | F(2,6) = 99.09, p < 0.0001 |
| 2C (VGlut density) | Unpaired t test | 29 | T(56) = 5.467, p < 0.0001 |
| 2C (Homer density) | Unpaired t test | 29 | T(56) = 5.778, p < 0.0001 |
| 2C (VGlut size) | Unpaired t test | 29 | T(56) = 0.4105, p = 0.683 |
| 2C (Homer size) | Unpaired t test | 29 | T(56) = 0.6777, p = 0.508 |
| 2E (VGAT density) | Unpaired t test | 29 | T(56) = 0.03323, p = 0.9736 |
| 2E (gephyrin density) | Unpaired t test | 29 | T(56) = 0.2890, p = 0.7737 |
| 2E (VGAT size) | Unpaired t test | 29 | T(56) = 0.3999, p = 0.2708 |
| 2E (gephyrin size) | Unpaired t test | 29 | T(56) = 0.0330, p = 0.1702 |
| 2G | Unpaired t test | 21 | T(40) = 0.3137, p = 0.7553 |
| 2H (primary dendrites) | Unpaired t test | 21 | T(40) = 0.1163, p = 0.908 |
| 2H (dendritic branching) | Unpaired t test | 21 | T(40) = 0.09528, p = 0.9246 |
| 2I | Unpaired t test | 21 | T(40) = 0.06135, p = 0.9514 |
| 2J (capacitance) | Unpaired t test | 21 | T(40) = 0.3649, p = 0.7171 |
| 2J (input resistance) | Unpaired t test | 21 | T(40) = 0.7329, p = 0.45 |
| 3B | Unpaired t test | 3 | T(4) = 12.46, p = 0.0002 |
| 3C (Nlgn1) | Unpaired t test | 3 | T(4) = 15.68, p < 0.0001 |
| 3C (Nlgn2) | Unpaired t test | 3 | T(4) = 44.02, p < 0.0001 |
| 3C (Nlgn3) | Unpaired t test | 3 | T(4) = 51.86, p < 0.0001 |
| 4B (density) | One-way ANOVA | 24 | F(3,92) = 5.122, p = 0.0025 |
| 4B (size) | One-way ANOVA | 24 | F(3,92) = 3.167, p = 0.0281 |
| 4B (intensity) | One-way ANOVA | 24 | F(3,92) = 2.005, p = 0.1188 |
| 4C (density) | One-way ANOVA | 24 | F(3,92) = 3.777, p = 0.0132 |
| 4C (size) | One-way ANOVA | 24 | F(3,92) = 0.1854, p = 0.9061 |
| 4C (intensity) | One-way ANOVA | 24 | F(3,92) = 0.9585, p = 0.4159 |
| 5A (frequency) | One-way ANOVA | 18 | F(3,68) = 31.66, p < 0.0001 |
| 5A (amplitude) | One-way ANOVA | 18 | F(3,68) = 3.063, p = 0.0338 |
| 5B (frequency) | One-way ANOVA | 17 | F(3,64) = 15.74, p < 0.0001 |
| 5B (amplitude) | One-way ANOVA | 17 | F(3,64) = 1.865, p = 0.1443 |
| 6B (density) | One-way ANOVA | 24 | F(3,92) = 9.735, p < 0.0001 |
| 6B (size) | One-way ANOVA | 24 | F(3,92) = 5.245, p = 0.0022 |
| 6B (intensity) | One-way ANOVA | 24 | F(3,92) = 5.799, p = 0.0011 |
| 6C (density) | One-way ANOVA | 24 | F(3,92) = 1.185, p = 0.32 |
| 6C (size) | One-way ANOVA | 24 | F(3,92) = 3.829, p = 0.0124 |
| 6C (intensity) | One-way ANOVA | 24 | F(3,92) = 3.692, p = 0.0147 |
| 7A (frequency) | One-way ANOVA | 18 | F(3,68) = 57.57, p < 0.0001 |
| 7A (amplitude) | One-way ANOVA | 18 | F(3,68) = 21.08, p < 0.0001 |
| 7B (frequency) | One-way ANOVA | 18 | F(3,68) = 17.53, p <0.0001 |
| 7B (amplitude) | One-way ANOVA | 18 | F(3,68) = 16.44, p < 0.0001 |
| 8B (AMPAR amplitude) | One-way ANOVA | 24 | F(3,92) = 38.35, p < 0.0001 |
| 8B (NMDAR amplitude) | One-way ANOVA | 24 | F(3,92) = 119, p < 0.0001 |
| 8B (NMDAR/AMPAR) | One-way ANOVA | 24 | F(3,92) = 24.68, p < 0.0001 |
| 8D | One-way ANOVA | 24 | F(3,92) = 10.82, p < 0.0001 |
Primary cultures
Cortical neurons were cultured from male and female P0 mice essentially as described previously (Maximov et al., 2007). Dissected cortices were dissociated by papain digestion for 20 min at 37°C, filtered through a 70 µm cell strainer, plated on borosilicate glass coverslips (Carolina; 0.09-0.12 mm thickness, 15 mm diameter) precoated with Matrigel (Corning), and placed in 24-well plates. Plating medium contained 10% FBS (Atlanta), Gem21 NeuroPlex supplement (Gemini), 0.4% D-glucose, and 2 mm glutamine in Minimal Essential Medium (MEM; Invitrogen). Two hours after plating, the medium was completely exchanged to growth medium comprised of 5% FBS, Gem21 NeuroPlex supplement, and 2 mm glutamine in Neurobasal A (Invitrogen). At 3-4 DIV, 50% of the growth medium was exchanged with serum-free Neurobasal A supplemented with Gem21 NeuroPlex, 2 mm glutamine, and 4 μm cytosine arabinofuranoside (Sigma Millipore) to prevent glial overgrowth. From DIV7 onwards, 30% of the medium was exchanged every 3 d until analysis at DIV14-DIV16. To prepare pure glial cultures, cortices from P0 mice were dissected and digested as described above and then harshly triturated. Dissociated cells from four cortices were plated in a T75 flask in DMEM supplemented with 10% FBS. Upon reaching confluence, glial cells were trypsinized and replated at a lower density in 24-well plates. Glia were analyzed at DIV14-DIV16.
Lentivirus preparation and infection of cortical neurons
Lentiviruses for conditional deletion of neurexins and neuroligins in cortical neurons were generated from the following expression plasmids: Syn-Cre-EGFP (active Cre recombinase) and Syn-ΔCre-EGFP (inactive Cre recombinase used as a control) (Kaeser et al., 2011). Lentiviruses were produced in HEK293T cells essentially as described previously (Zhang et al., 2013). Using calcium phosphate, HEK293T cells were cotransfected with the three helper plasmids, pRSV-REV (3.9 µg), pMDLg/pRRE (8.1 µg), and VSV-G (6.0 µg), and with either Cre or ΔCre lentiviral plasmid (12 µg). Lentiviruses in the culture medium were harvested 48 h after transfection, and virus particles were pelleted by ultracentrifugation at 19,000 rpm for 1.5 h. Pellets were resuspended in 100 µl DMEM, aliquoted, and stored at −80°C. Primary cortical neurons were infected at DIV3 by diluting the concentrated virus 1:1000 into the culture medium in each well.
Sparse transfection of cortical neurons
To assess dendritic arborization in isolated cortical neurons, cultures were sparsely transfected at DIV10 with pmU-β-actin-enhanced blue fluorescent protein (eBFP) (Gary Banker, Oregon Health and Sciences University) using a calcium phosphate method (CalPhos Mammalian Transfection Kit, Takara; manufacturer's protocol modified as described here). A DNA/calcium phosphate precipitate was prepared by mixing the following (per 24-well reaction): 1 µg DNA, 3.1 µl 2 m CaCl2, and ddH2O to a volume of 25 µl. The DNA mixture was added dropwise under low-powered vortex pulses to an equal volume of 2× HEPES-buffered saline. The precipitate formed for 20 min before addition to the cultures. Cultured neurons were transferred into fresh serum-free growth medium that was conditioned overnight by pure glia (0.5 ml per 24-well). DNA/calcium phosphate precipitate was added dropwise to each well, and the cultures were incubated at 5% CO2, 37°C. After 1.5 h, the precipitate was dissolved using growth medium that was pre-acidified in a 10% CO2 incubator to increase the viability of transfected neurons. Following complete dissolution of the precipitate, neurons were returned to their “home” plate containing their original conditioned medium and maintained at 5% CO2, 37°C until morphologic analysis at DIV14.
Recombinant expression of SPARCL1
Expression constructs encoding the full-length mouse cDNA clone of SPARCL1 (Dharmacon) or mClover as a control (pEB-Multi-Neo-SPARCL1, pEB-Multi-Neo-mClover) (Gan and Südhof, 2019) were transfected into HEK293T cells using calcium phosphate and incubated in serum-free medium. After 72 h, the culture medium was collected, passed through a 0.45 µm syringe filter to remove cell debris, and concentrated by centrifugal ultrafiltration through an Amicon regenerated cellulose membrane with a nominal molecular weight limit of 3 kDa (Millipore). Samples were centrifuged at 14,000 × g for 30 min at 4°C, and the protein concentrates were subsequently recovered from the membranes with a reverse spin at 1000 × g for 2 min at room temperature. Concentrated supernatants were diluted 1:100 in serum-free neuronal growth medium and added to cultured neurons at DIV13. Neurons were assayed within 1-3 d after treatment.
Immunocytochemistry
All immunocytochemistry experiments were performed essentially as described previously (Kwinter et al., 2009). Briefly, cortical neurons cultured at low density were fixed with 4% PFA for 15 min at 37°C, permeabilized with 0.1% Triton-X for 10 min at room temperature, and blocked with 0.5% fish skin gelatin for 1 h at 37°C. To quantify excitatory and inhibitory synapses localized to dendritic segments, neurons were stained with anti-VGLUT1 guinea pig (Millipore; 1:1000) or anti-VGAT rabbit (Millipore; 1:1000) and counterstained with anti-MAP2 mouse (1:1000; Sigma Millipore). All primary antibodies were diluted in blocking solution and incubated overnight at 4°C with gentle agitation. Neurons were subsequently incubated with compatible secondary antibodies conjugated to Alexa-488, Alexa-546, and Alexa-647 fluorophores (1:500; Invitrogen) for 1.5 h at 37°C, washed in PBS, and mounted in DAPI Fluoromount-G (Southern Biotechnology).
Image acquisition and analysis
Images of neurons with pyramidal morphology were acquired using a Nikon A1RSi confocal microscope with constant laser gain and offset settings, scanning speed, and pinhole size. These settings yielded images in which the brightest pixels were not oversaturated. Each z stack was comprised of 10 serial images acquired in 0.5 µm steps. Maximum intensity projections of the z stacks were generated for quantification purposes. Synaptic puncta were counted along well-isolated primary dendrites (5 × 100-µm dendritic segments per cell) using the “Count Nuclei” application in MetaMorph (Molecular Devices). To measure dendritic length and branching, field images of low-density neuronal cultures expressing eBFP and counterstained with anti-MAP2 mouse and anti-NeuN (Millipore; rabbit polyclonal, 1:1000) were analyzed using the “Neurite Outgrowth” application in MetaMorph. Constant threshold settings to exclude background signals were maintained for all experimental conditions.
Electrophysiology
Electrophysiological recordings were performed in the whole-cell configuration essentially as described previously (Maximov et al., 2007; Sando et al., 2019). Patch pipettes were pulled from borosilicate glass capillary tubes (Warner Instruments) using a PC-10 pipette puller (Narishige). The resistance of pipettes filled with intracellular solution varied between 3.0 and 4.0 mΩ. The bath solution in all experiments contained the following (in mm): 140 NaCl, 5 KCl, 2 CaCl2, 2 MgCl2, 10 HEPES, and 10 glucose, pH adjusted to 7.4 with NaOH (300 mOsm/L). Excitatory miniature and evoked synaptic responses were recorded in voltage-clamp mode with a pipette solution containing the following (in mm): 135 Cs-methanesulfonate, 8 CsCl, 10 HEPES, 0.25 EGTA, 0.3 Na2GTP, 2 MgATP, 7 phosphocreatine, and 10 QX-314, pH adjusted to 7.3 with CsOH (303 mOsm/L). Inhibitory miniature and evoked synaptic responses were recorded in voltage-clamp mode with a pipette solution containing the following (in mm): 146 CsCl, 10 HEPES, 0.25 EGTA, 2 MgATP, 0.3 Na2GTP, 7 phosphocreatine, and 10 QX-314, pH adjusted to 7.3 with CsOH (303 mOsm/L). Evoked synaptic responses were triggered by 0.5 ms current (100 µA) injection through a local extracellular electrode (FHC concentric bipolar electrode) placed 100-150 µm from the soma of neurons recorded. The frequency, duration, and magnitude of the extracellular stimulus were controlled with a model 2100 Isolated Pulse Stimulator (A-M Systems) synchronized with the Clampex 10.1 data acquisition software (Molecular Devices). mEPSCs and mIPSCs were monitored in the presence of TTX (1 μm). Evoked AMPAR- and NMDAR-EPSCs were pharmacologically isolated with picrotoxin (PTX, 50 μm) and recorded at −70 mV or 40 mV holding potentials, respectively. GABAR IPSCs were pharmacologically isolated with D-AP5 (50 μm) and CNQX (10 μm). Data were digitized at 10 kHz with a 2 kHz low-pass filter using a Multiclamp 700B Amplifier (Molecular Devices). Data were analyzed using Clampfit 10.5 (Molecular Devices) software.
Semiquantitative RT-PCR
Total RNA was isolated from cortical and glial cultures using the PureLink RNA Mini Kit (Thermo Fisher Scientific) according to the manufacturer's protocol. RNA concentrations were measured using a ND-1000 Nanodrop spectrophotometer (Thermo Fisher Scientific). Intron-spanning primers were designed to distinguish between gDNA and cDNA amplification. The following primer sequences for SPARCL1 and β-actin were used: SPARCL1-F, 5′-AGACGCTACAGTCCCCATTG-3′; SPARCL1-R, 5′-GCCTGCACCATGCTTAGAGT-3′; β-actin-F, 5′-CCCCTGAACCCTAAGGCCA-3′; and β-actin-R, 5′-CGGACTCATCGTACTCCTGC-3′. Reverse transcription and subsequent cDNA amplification were performed using the SuperScript IV One-Step RT-PCR System (Thermo Fisher Scientific). Reaction components were assembled as follows: 25 μl of 2× Platinum SuperFi RT-PCR Master Mix, 2.5 μl of gene-specific forward primer (10 μm), 2.5 μl of gene-specific reverse primer (10 μm), 0.5 μl of SuperScript IV reverse transcriptase mix, 500 ng of template RNA, and nuclease-free ddH2O to 50 μl. The following cycling parameters were used: reverse transcription, 50°C for 10 min; reverse transcriptase inactivation/initial denaturation, 98°C for 10 s; cDNA amplification (25 cycles), 98°C for 10 s, 60°C for 10 s, 72°C for 30 s; final extension, 72°C for 5 min. Amplicons were analyzed by electrophoresis on a 0.8% agarose gel. Quantitative analysis was performed using a Molecular Imager GelDoc XR+ system and Image Lab software (Bio-Rad).
Immunoblotting
Conditioned media from cortical and pure glial cultures were collected and precipitated with 1/5 volume of trichloroacetic acid at 4°C for 30 min. Precipitates were centrifuged at 14,000 × g for 15 min, aspirated, and washed twice with ice-cold acetone. Dried protein pellets were resuspended in sample buffer containing 200 mm Tris-Cl, pH 6.8, 8% SDS, 0.4% bromophenol blue, and 40% glycerol and boiled in the presence of 1% β-mercaptoethanol for 10 min. Cortical neurons and pure glia in 24-well plates were lysed in RIPA buffer containing 150 mm NaCl, 1% Triton X-100, 0.1% SDS, 25 mm Tris-HCl, pH 7.4, and Complete EDTA-Free Protease Inhibitor Cocktail (Sigma Millipore). Lysates were incubated on ice for 30 min and clarified by centrifugation at 14,000 × g for 30 min at 4°C. Lysates were boiled in sample buffer containing 1% β-mercaptoethanol for 10 min. Proteins were analyzed by SDS-PAGE using 4%-20% Mini-Protean TGX precast gels (Bio-Rad). Proteins were transferred onto nitrocellulose membranes for 10-12 min at 25 V using the Trans-Blot Turbo transfer system (Bio-Rad). Membranes were blocked in 5% milk diluted in TBST for 1 h at room temperature. Membranes were then incubated overnight at 4°C with the following primary antibodies diluted in blocking solution: anti-SPARCL1 goat (R&D Systems; 1:5000), anti-pan-Nrxn rabbit (G394, T.C.S. laboratory, 1:500), anti-Nlgn1 mouse (SySy, 1:1000), anti-Nlgn2 mouse (SySy, 1:1000), anti-Nlgn3 rabbit (639B, T.C.S. laboratory, 1:500), and anti-β-actin mouse (A1976, Sigma Millipore, 1:2000). Membranes were subsequently incubated for 1 h at room temperature with the following compatible secondary antibodies (LI-COR), diluted 1:10,000 in blocking solution: IRDye 680LT donkey anti-goat; IRDye 800CW donkey anti-rabbit. Quantitative analysis was performed by a dual-channel infrared imaging system, an Odyssey Infrared Imager CLX and Image Studio 5.2.5 software (LI-COR).
Results
Endogenous SPARCL1 protein is secreted at low levels by cultured mouse glia but is abundant in mouse serum
SPARCL1 is expressed by astrocytes (Saunders et al., 2018; Tabula Muris Consortium, 2018; Zeisel et al., 2018). Nevertheless, addition of SPARCL1 to human neurons cocultured with glia increases synapse formation and activity, suggesting that endogenous SPARCL1 secreted by glia does not fully stimulate neurons (Gan and Südhof, 2019). To examine how much SPARCL1 is expressed by glia, we developed a semiquantitative RT-PCR assay (Fig. 1A,B). Intron-spanning primers for the SPARCL1 and β-actin (control) genes were designed to distinguish between mRNA and genomic DNA amplification (Fig. 1A). We performed RT-PCR on total RNA isolated from glia cultured alone or from glia cocultured with cortical neurons. SPARCL1 and β-actin transcripts from both sources were amplified either individually or in multiplexed format to estimate the relative abundance of SPARCL1 by normalization to β-actin (Fig. 1B). Analysis by electrophoresis revealed specific amplification of SPARCL1 and β-actin mRNA without genomic DNA contamination (Fig. 1B). Quantification of multiplexed amplicons showed that SPARCL1 mRNA is expressed by glia at similar levels when cultured alone or when cocultured with neurons (Fig. 1C). These results confirm that most cortical SPARCL1 is produced by glia.
Figure 1.

Endogenous SPARCL1 is secreted at low levels by cultured mouse glia but is abundant in mouse serum. A, Design of intron-spanning primers for semiquantitative RT-PCR. Forward (F) and reverse (R) primers against SPARCL1 primers against SPARCL1 and β-actin (control) genes were situated in exons to distinguish between gDNA and mRNA amplification (left). Expected amplicon sizes are indicated (right). B, Most cortical SPARCL1 mRNA is expressed by glia. RT-PCR was performed on total RNA isolated from glia cultured alone or from glia cocultured with cortical neurons at DIV14. Amplification of SPARCL1 and β-actin transcripts was optimized to 25 PCR cycles to ensure that quantification was performed before saturation. SPARCL1 and β-actin transcripts from both sources were amplified either individually or in multiplexed format to estimate the relative abundance of SPARCL1 cDNA by normalization against β-actin. Analysis by electrophoresis shows specific amplification of SPARCL1 and β-actin cDNA without gDNA contamination. SPARCL1 mRNA is expressed at similar levels by pure glia and by neurons cocultured with glia, indicating that most cortical SPARCL1 is expressed by glia. SPARCL1 band intensities are normalized to β-actin band intensities within multiplexed RT-PCRs. C, Endogenous SPARCL1 protein is secreted at low levels in primary cortical cultures. Cortical glia were cultured alone (G) or with cortical neurons (N + G) for DIV14. Left, Coomassie stain showing the total protein composition of conditioned media and cell lysates taken from both types of cultures and from mouse serum. Right, Immunoblot of SPARCL1 (green) from conditioned media and cell lysates. Full-length SPARCL1 is secreted and present intracellularly (green arrow). Secreted SPARCL1 is proteolyzed into an array of fragments (light green arrows). Truncated SPARCL1 is present in serum (dark green arrow) but is undetectable in primary cortical cultures. D, Comparison of recombinant and endogenous SPARCL1 protein levels. Equal volumes of HEK293T cell supernatant containing native recombinant SPARCL1 and of conditioned medium harvested from primary cortical cultures before SPARCL1 treatment (DIV13) and 24 h after SPARCL1 treatment were analyzed by SDS-PAGE and immunoblotting. Left, Coomassie stain showing the total protein composition of the HEK cell supernatant and of the conditioned medium before (untreated) and after (treated) SPARCL1 treatment. Asterisks indicate bands corresponding in size to SPARCL1. Right, Immunoblot of recombinant SPARCL1 protein secreted by HEK cells and of SPARCL1 present in the conditioned medium before and after treatment. Dark gray arrows indicate full-length SPARCL1. Light gray arrows indicate proteolyzed SPARCL1. Bar graphs indicate mean ± SEM. Three independent cultures were analyzed. Statistical significance was evaluated by a Student's t test. ***p < 0.001; nonsignificant relations (n.s.) are indicated. For complete statistical analyses, see Extended Data Figure 1-1.
Complete statistical analyses for “Figure 1: Endogenous SPARCL1 is secreted at low levels by cultured mouse glia but is abundant in mouse serum” (1B) Most cortical SPARCL1 mRNA is expressed by glia. RT-PCR was performed on total RNA isolated from glia cultured alone or from glia cocultured with cortical neurons at DIV14. SPARCL1 band intensities are normalized to β-actin band intensities within multiplexed RT-PCRs. Primary data comprise means ± SEM; 3 independent cultures were analyzed. Statistical significance was evaluated by an unpaired t test.(1C) Endogenous SPARCL1 protein is secreted at low levels in primary cortical cultures. Cortical glia were cultured alone (G) or with cortical neurons (N + G) for DIV14. Full-length SPARCL1 protein expression was detected by immunoblot and quantified. Primary data comprise means ± SEM; 3 independent cultures were analyzed. Statistical significance was evaluated by a one-way ANOVA with Tukey's post hoc test of multiple comparisons. (1D) Comparison of recombinant and endogenous SPARCL1 protein levels. Full-length SPARCL1 protein expression was detected by immunoblot and quantified. Primary data comprise means ± SEM; 3 independent cultures were analyzed. Statistical significance was evaluated by a one-way ANOVA with Tukey's post hoc test of multiple comparisons. Test parameters highlighted in blue were used to determine statistical significance and are summarized in Table 1. p values and significance levels for individual comparisons between specific groups are highlighted in yellow. Download Figure 1-1, XLSX file (13.3KB, xlsx) .
Complete statistical analyses for “Figure 2: Recombinant SPARCL1 selectively boosts excitatory but not inhibitory synapse numbers in primary cultures of cortical neurons and glia” (2C): Quantifications showing that recombinant SPARCL1 increases the density but not the size of excitatory synapses. Primary data comprise means ± SEM; 29 cells from 3 independent cultures were analyzed. Statistical significance was evaluated by an unpaired t test. (2E): Quantifications showing that recombinant SPARCL1 does not alter the density nor size of inhibitory synapses. Primary data comprise means ± SEM; 29 cells from 3 independent cultures were analyzed. Statistical significance was evaluated by an unpaired t test. (2G-I) Quantifications showing that recombinant SPARCL1 does not alter the neuronal cell density (G), number of primary dendrites, and dendritic branches (H), or soma size of neurons (I). Primary data comprise means ± SEM; 21 cells from 3 independent cultures were analyzed. Statistical significance was evaluated by an unpaired t test. (2J) SPARCL1 has no significant effect on capacitance and input resistance. Primary data comprise means ± SEM; 21 cells from 3 independent cultures were analyzed. Statistical significance was evaluated by an unpaired t test. Test parameters highlighted in blue were used to determine statistical significance and are summarized in Table 1. p values and significance levels for individual comparisons between specific groups are highlighted in yellow. Download Figure 2-1, XLSX file (19.8KB, xlsx) .
Complete statistical analyses for “Figure 3: Cre-recombinase expression substantially reduces neurexin and neuroligin protein expression in cKO neurons” (3B) Analysis of neurexin protein expression in primary cortical neurons from Nrxn123 cKO mice. Immunoblots were performed on lysates from cortical cultures infected with lentiviral ΔCre or Cre. The neurexin signals were normalized to corresponding β-actin signals for quantification. Primary data comprise means ± SEM; 3 independent cultures were analyzed. Statistical significance was evaluated by an unpaired t test. (3C) Analysis of neuroligin protein expression in primary cortical neurons from Nlgn1234 cKO mice. Immunoblots were performed on lysates from cortical cultures infected with lentiviral ΔCre or Cre. The neuroligin signals were normalized to corresponding β-actin signals for quantification. Primary data comprise means ± SEM; 3 independent cultures were analyzed. Statistical significance was evaluated by an unpaired t test. Test parameters highlighted in blue were used to determine statistical significance and are summarized in Table 1. p values and significance levels for individual comparisons between specific groups are highlighted in yellow. Download Figure 3-1, XLSX file (11.9KB, xlsx) .
Complete statistical analyses for “Figure 4: Deletion of neurexins in dissociated cultures of mouse neurons and glia neither decreases excitatory or inhibitory synapse numbers nor impairs the increase in excitatory synapse numbers produced by recombinant SPARCL1” (4B-C) Quantifications showing that recombinant SPARCL1 increases the density of excitatory synapses (B) but not inhibitory synapses (C) in control and Nrxn123 cKO neurons. SPARCL1 did not affect the size and staining intensity of excitatory and inhibitory synapses. Primary data comprise means ± SEM; 24 cells from 3 independent cultures were analyzed. Statistical significances were evaluated by one-way ANOVAs with Tukey's post hoc tests of multiple comparisons. Test parameters highlighted in blue were used to determine statistical significance and are summarized in Table 1. p values and significance levels for individual comparisons between specific groups are highlighted in yellow. Download Figure 4-1, XLSX file (19.3KB, xlsx) .
Complete statistical analyses for “Figure 5: Recombinant SPARCL1 increases spontaneous excitatory but not inhibitory synaptic transmission independent of neurexins” (5A) SPARCL1 increases mEPSC frequency but not amplitude independent of neurexins. Nrxn123, control (ΔCre), and cKO (Cre) neurons were treated at DIV13 with control medium or recombinant SPARCL1. Spontaneous excitatory synaptic activity was assessed at DIV14 by mEPSC recordings in the presence of TTX and PTX. Primary data comprise means ± SEM; 18 cells from 3 independent cultures were analyzed. Statistical significance was evaluated by a one-way ANOVA with Tukey's post hoc test of multiple comparisons. (5B) SPARCL1 does not affect spontaneous inhibitory synaptic activity. Nrxn123 control and cKO neurons were treated at DIV13 with control medium or recombinant SPARCL1. Spontaneous inhibitory synaptic activity was assessed at DIV14 by mIPSC recordings in the presence of TTX, CNQX and D-AP5. Primary data comprise means ± SEM; 17 cells from 3 independent cultures were analyzed. Statistical significance was evaluated by a one-way ANOVA with Tukey's post hoc test of multiple comparisons. Test parameters highlighted in blue were used to determine statistical significance and are summarized in Table 1. p values and significance levels for individual comparisons between specific groups are highlighted in yellow. Download Figure 5-1, XLSX file (16.8KB, xlsx) .
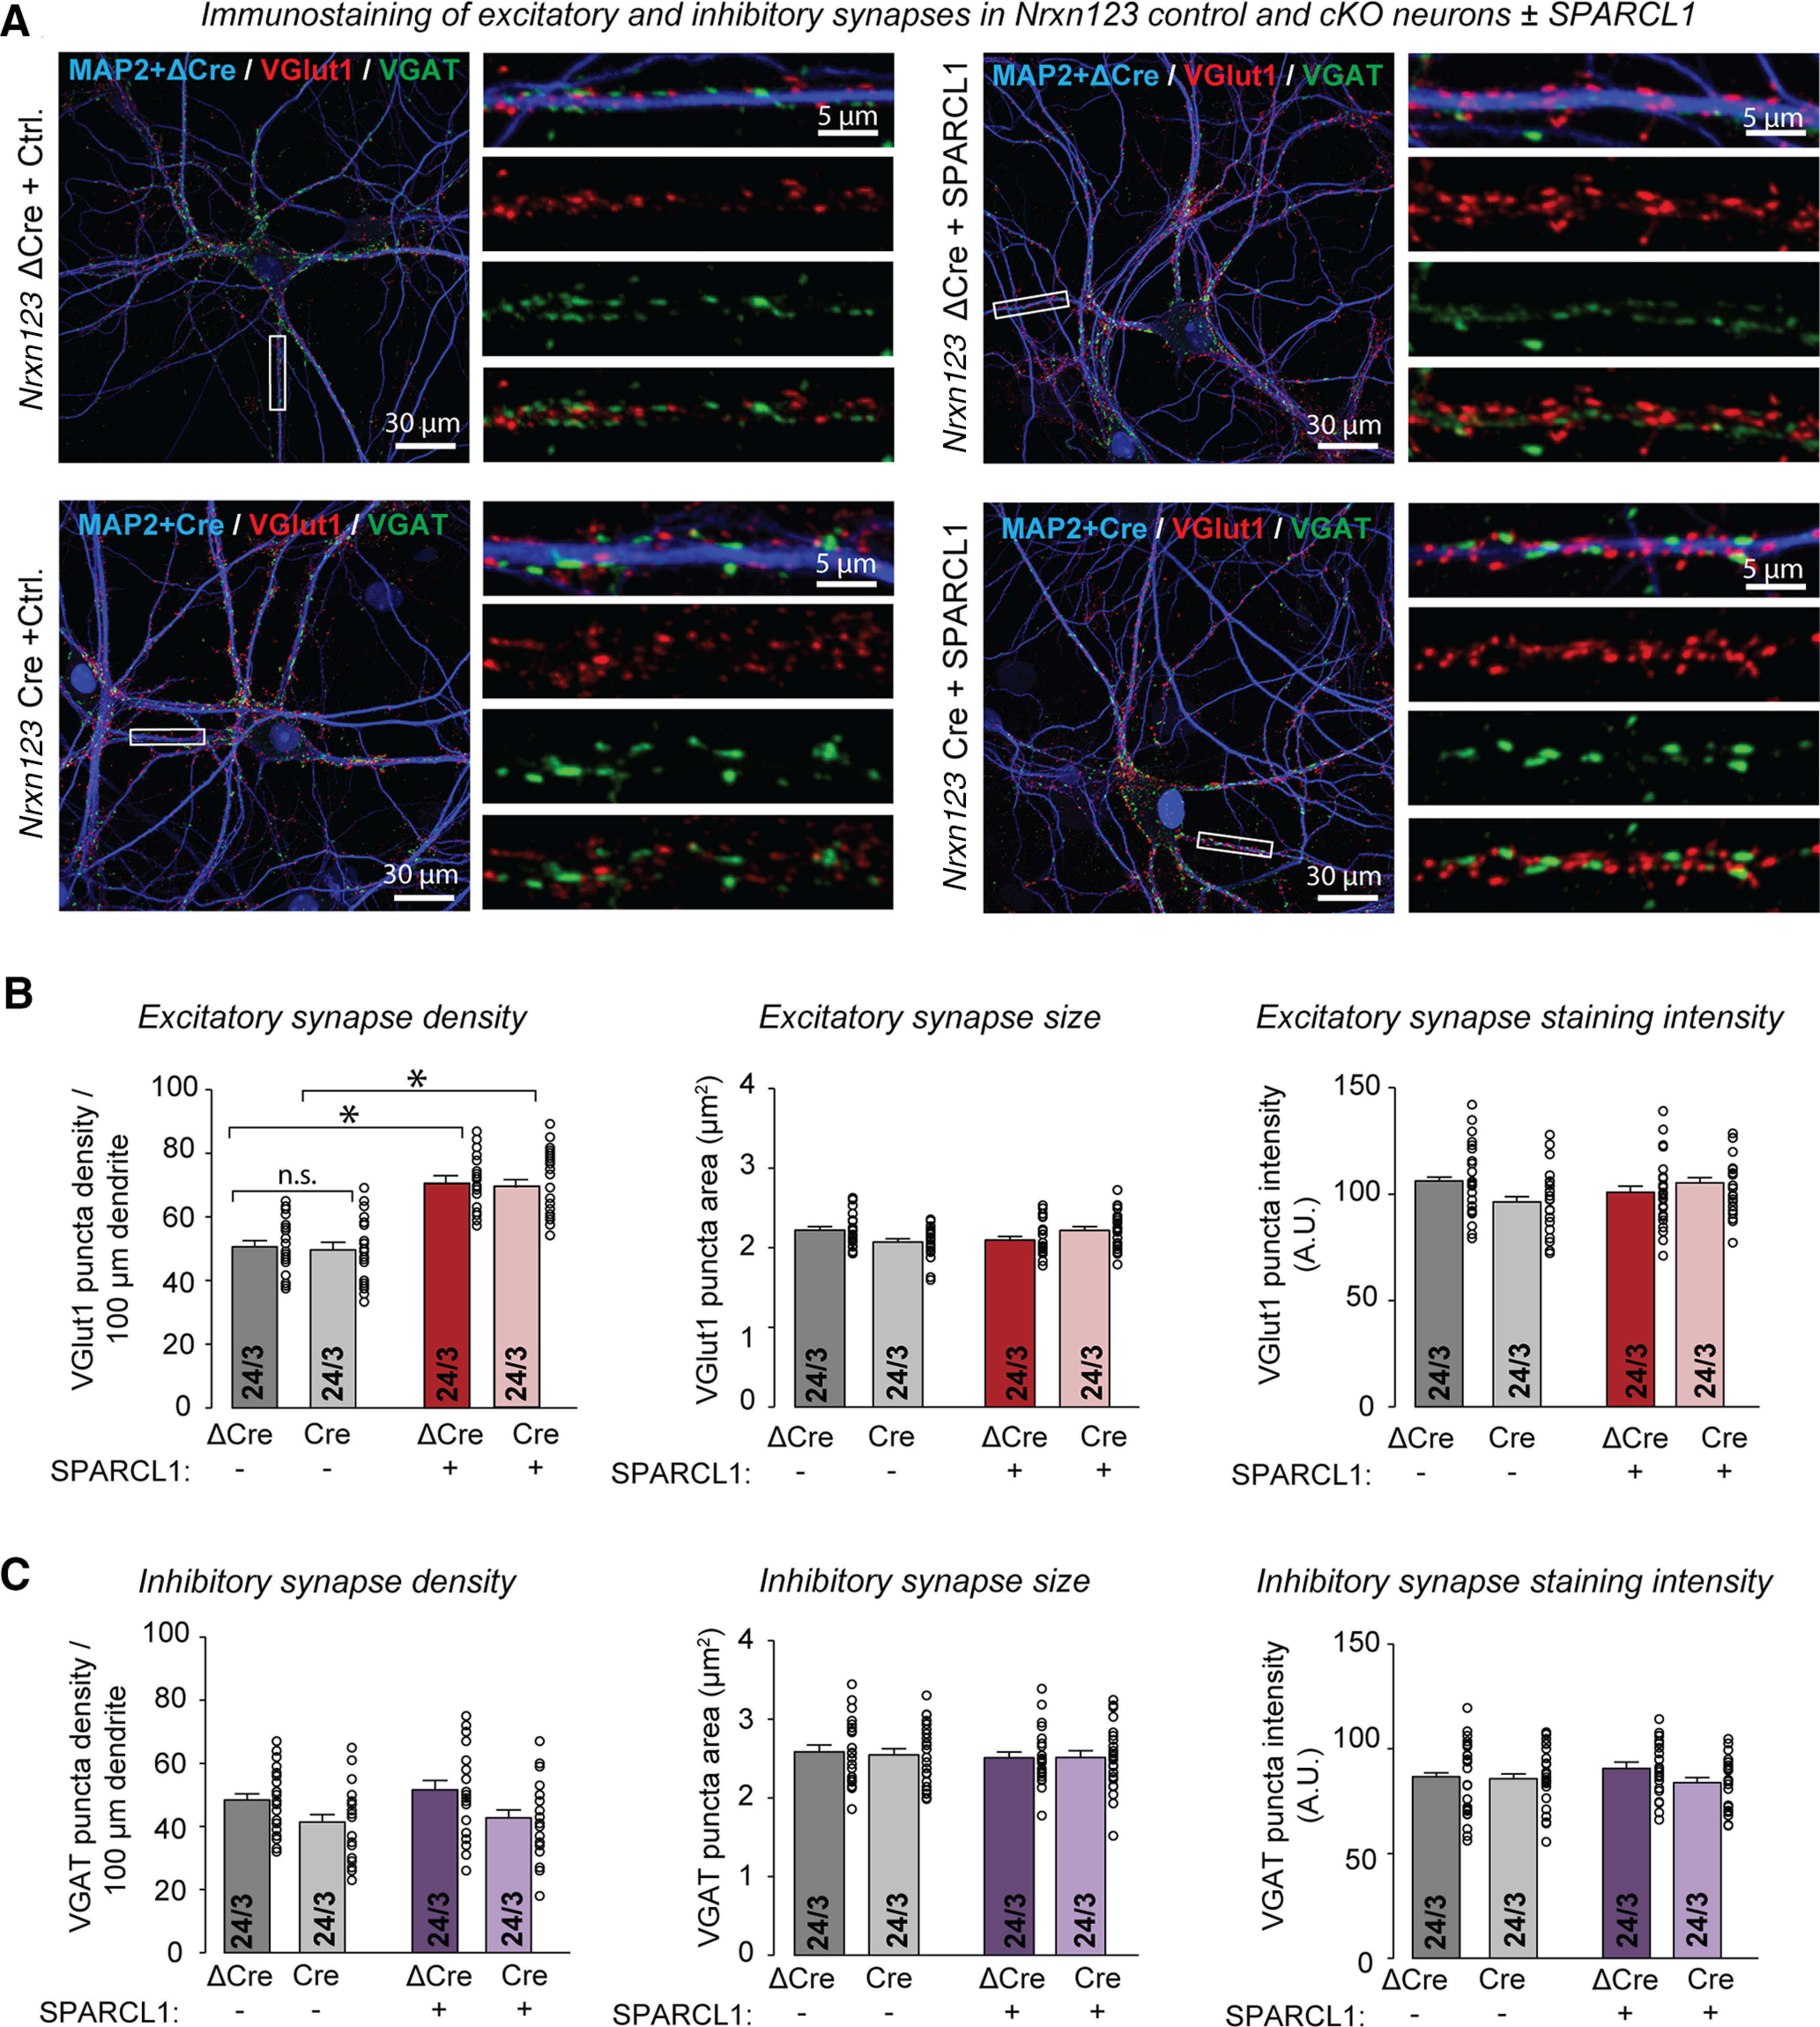
Complete statistical analyses for “Figure 6: Deletion of neuroligins does not significantly decrease synapse numbers and does not block excitatory synaptogenesis induced by recombinant SPARCL1” (6B-C) Quantifications showing that recombinant SPARCL1 increases the density of excitatory synapses but not inhibitory synapses in control and Nlgn1234 cKO neurons. SPARCL1 did not substantially affect the size and staining intensity of excitatory and inhibitory synapses. Primary data comprise means ± SEM; 24 cells from 3 independent cultures were analyzed. Statistical significances were evaluated by one-way ANOVAs with Tukey's post hoc tests of multiple comparisons. Test parameters highlighted in blue were used to determine statistical significance and are summarized in Table 1. p values and significance levels for individual comparisons between specific groups are highlighted in yellow. Download Figure 6-1, XLSX file (18.9KB, xlsx) .
Complete statistical analyses for “Figure 7: Recombinant SPARCL1 increases spontaneous excitatory but not inhibitory synaptic transmission independent of neuroligins” (7A) Deletion of all neuroligins significantly reduces mEPSC frequency and amplitude but does not prevent SPARCL1 from increasing mEPSC frequency. Nlgn1234, control (ΔCre), and cKO (Cre) neurons were treated at DIV13 with control medium or recombinant SPARCL1. Spontaneous excitatory synaptic activity was assessed at DIV14 by mEPSC recordings in the presence of TTX and PTX. Primary data comprise means ± SEM; 18 cells from 3 independent cultures were analyzed. Statistical significance was evaluated by a one-way ANOVA with Tukey's post hoc test of multiple comparisons. (7B) Deletion of all neuroligins significantly reduces mIPSC frequency and amplitude, which are unaltered by SPARCL1. Nlgn1234 control and cKO neurons were treated at DIV13 with control medium or recombinant SPARCL1. Spontaneous inhibitory synaptic activity was assessed at DIV14 by mIPSC recordings in the presence of TTX, CNQX and D-AP5. Primary data comprise means ± SEM; 18 cells from 3 independent cultures were analyzed. Statistical significance was evaluated by a one-way ANOVA with Tukey's post hoc test of multiple comparisons. Test parameters highlighted in blue were used to determine statistical significance and are summarized in Table 1. p values and significance levels for individual comparisons between specific groups are highlighted in yellow. Download Figure 7-1, XLSX file (18.2KB, xlsx) .
Complete statistical analyses for “Figure 8: SPARCL1 selectively enhances evoked neurotransmission and increases NMDAR-mediated synaptic responses independent of neuroligins” (8B) Deletion of all neuroligins reduces the amplitudes of evoked AMPAR- and NMDAR-EPSCs. Treatment with recombinant SPARCL1 increases these parameters and particularly enhances the NMDAR/AMPAR ratio independent of neuroligins. Quantifications of evoked AMPAR-EPSC amplitude, NMDAR-EPSC amplitude, and NMDAR/AMPAR ratio. NMDAR current amplitudes were measured 50 ms after stimulation. Primary data comprise means ± SEM; 24 cells from 3 independent cultures were analyzed. Statistical significance was evaluated by a one-way ANOVA with Tukey's post hoc test of multiple comparisons. (8C) Deletion of all neuroligins reduces the amplitudes of evoked GABAR-IPSCs, whereas addition of SPARCL1 does not alter these currents. Quantifications of evoked GABAR-IPSC amplitude. Primary data comprise means ± SEM; 27 cells from 3 independent cultures were analyzed. Statistical significance was evaluated by a one-way ANOVA with Tukey's post hoc test of multiple comparisons. Test parameters highlighted in blue were used to determine statistical significance and are summarized in Table 1. p values and significance levels for individual comparisons between specific groups are highlighted in yellow. Download Figure 8-1, XLSX file (16.8KB, xlsx) .
Next, we examined SPARCL1 protein expression in conditioned media and lysates from glia cultured alone or cocultured with neurons (Fig. 1C). We also compared glial SPARCL1 protein expression to SPARCL1 protein present in serum (Fig. 1C). Using immunoblotting with an antibody directed to the N-terminal acidic domain of SPARCL1 (previously validated in Gan and Südhof, 2019), we detected full-length SPARCL1 protein (∼130 kDa) in both the conditioned medium and lysates of glia cultured alone or cocultured with neurons (Fig. 1C). Similar SPARCL1 levels were observed in both of these culture systems, implying that most cortical SPARCL1 is secreted by glia. SPARCL1 migrates on SDS-PAGE gels at an apparent molecular weight of ∼130 kDa, at nearly twice its predicted size of 75 kDa. This abnormally high apparent molecular weight is because of the high content of charged residues in SPARCL1 (Girard and Springer, 1995, 1996). As previously reported (Gan and Südhof, 2019), we also observed SPARCL1 in mouse serum (Fig. 1C). Serum SPARCL1 exhibited an apparent molecular weight of ∼50 kDa, consistent with earlier findings that SPARCL1 is physiologically processed by matrix metalloproteases (Weaver et al., 2010). In order to detect SPARCL1 in conditioned media from pure or cocultured glia, we needed to concentrate the media 10-fold, whereas no such concentration was required to detect SPARCL1 in serum. Furthermore, quantitative immunoblotting revealed that the amounts of SPARCL1 protein synthesized and secreted by glia are 30% (lysates) and 3% (media; taking into account the 10-fold concentration of the media) of the amount present in serum (Fig. 1C). These observations suggest that SPARCL1 is secreted from glia at low levels.
Recombinant SPARCL1 potently increases excitatory but not inhibitory synapse numbers in mixed cortical cultures of neurons and glia
SPARCL1 increases synapse numbers when added to excitatory human neurons cocultured with mouse glia (Gan and Südhof, 2019). Does SPARCL1 also act on mouse neurons cocultured with glia, and is SPARCL1 a general synaptotrophic factor, or is it specific for subsets of synapses? To answer these questions, we expressed native SPARCL1 in HEK293T cells, collected the supernatant containing the secreted recombinant protein, and diluted it into the growth medium of neuron-glia cultures from the cortex of newborn mice (hereafter termed “mixed cortical cultures”). As a negative control, we used supernatant from HEK293T cells transfected with mClover. As we demonstrated previously (Gan and Südhof, 2019), the low expression levels of native recombinant SPARCL1 made it difficult to measure its concentration in the HEK cell supernatant (Fig. 1D). However, we compared recombinant and endogenous SPARCL1 levels by immunoblotting (Fig. 1D). Quantitation using fluorescently labeled secondary antibodies revealed that the amount of recombinant SPARCL1 used in our experiments was approximately equivalent to the amount of endogenous SPARCL1 secreted by glia in cortical cultures (Fig. 1D).
Mixed cortical cultures were treated with the SPARCL1 or control supernatants at DIV13, and the neurons were analyzed by immunocytochemistry at DIV14-DIV16 (Fig. 2A). Immunocytochemistry for the excitatory presynaptic and postsynaptic markers vGluT1 and Homer1, respectively, showed that SPARCL1 elevated the density of excitatory synapses (>50% increase) without changing their apparent size (Fig. 2B,C). However, immunocytochemistry for the inhibitory presynaptic and postsynaptic markers vGAT and gephyrin, respectively, detected no significant difference in inhibitory synapse density between control and SPARCL1-treated neurons (Fig. 2D,E). Thus, SPARCL1 appears to be specific for excitatory synapses.
Figure 2.

Recombinant SPARCL1 selectively boosts excitatory but not inhibitory synapse numbers in primary cultures of cortical neurons and glia. A, Experimental strategy. Cortical neurons and glia were cultured from P0 WT, Nrxn123, or Nlgn1234 cKO mice. At DIV3, neurons were infected with lentiviruses expressing nuclear Cre-recombinase fused to EGFP and driven by the synapsin promoter (Syn-Cre-EGFP), or nonfunctional mutant Cre (Syn-ΔCre-EGFP) as a negative control. At DIV10, neurons were transfected with β-actin-eBFP for morphologic analyses. Neurons were treated with recombinant SPARCL1 at DIV13 and analyzed by electrophysiology, immunocytochemistry, and immunoblotting at DIV14-DIV16. In the experiments described in the present figure analyzing WT neurons, cultures expressing ΔCre were examined. In all subsequent figures describing experiments on conditional neurexin and neuroligin mutants, cultures expressing ΔCre and Cre were investigated. B, Representative images showing that recombinant SPARCL1 treatment increases the excitatory synapse density in WT neurons. Images represent dendritic segments of WT neurons treated at DIV13 with the supernatants of HEK cells expressing either mClover (Control) or recombinant SPARCL1. Neurons were immunostained for vGluT1 (excitatory presynaptic marker), Homer (excitatory postsynaptic marker), and MAP2 (dendritic marker) at DIV14. C, Quantifications showing that recombinant SPARCL1 increases the density (left), but not the size of excitatory synapses (right). D, Representative images showing that recombinant SPARCL1 treatment does not alter inhibitory synapse in WT neurons. Images represent dendritic segments of WT neurons treated as described in B, and immunostained for vGAT (inhibitory presynaptic marker), gephyrin (inhibitory postsynaptic marker), and MAP2 (dendritic marker) at DIV14. E, Quantifications showing that recombinant SPARCL1 does not alter the density (left) or size (right) of inhibitory synapses. F, Representative images showing that recombinant SPARCL1 treatment does not alter the survival or dendritic morphology of WT neurons. Images represent neurons treated as described in B, but additionally sparsely transfected with eBFP to visualize dendritic arborizations of neurons. Neurons were counterstained with MAP2. G–I, Quantifications showing that recombinant SPARCL1 does not alter the neuronal cell density (G), number of primary dendrites, and dendritic branches (H), or soma size of neurons (I). J, Electrophysiological measurements of the capacitance (left) and input resistance (right) of WT neurons treated with SPARCL1 as described in B show that SPARCL1 has no significant effect on these passive electrical membrane properties. Bar graphs indicate mean ± SEM. Numbers of cells/independent cultures analyzed are shown within bars. Statistical significance was evaluated by a Student's t test. **p < 0.01; nonsignificant relations are not indicated. For complete statistical analyses, see Extended Data Figure 2-1.
A possible explanation for the large effect of SPARCL1 on excitatory synapse density is that SPARCL1 enhances the development of excitatory neurons. To investigate this possibility, we sparsely transfected mixed cortical cultures at DIV10 with eBFP to visualize dendritic arbors. We treated the cultures with recombinant SPARCL1 at DIV13 and measured the neuronal cell density, number of primary dendrites, number of dendritic branches, and size of the neuronal cell body at DIV14-DIV16. SPARCL1 did not alter any of these parameters, suggesting that it does not affect overall neuronal development (Fig. 2F–H). In addition, we used whole-cell patch clamping to measure the capacitance and input resistance of the control- and SPARCL1-treated neurons and again detected no difference (Fig. 2I,J). Thus, SPARCL1 selectively enhances excitatory synapse numbers in mixed cortical cultures without affecting the development of other neuronal features.
Cre-recombinase expression substantially reduces neurexin and neuroligin protein expression in cKO neurons
To determine whether the cellular effects of SPARCL1 are dependent on neurexins and neuroligins as suggested previously (Singh et al., 2016), we generated mixed cortical cultures from triple neurexin cKO mice (Nrxn123 cKO) (Chen et al., 2017) and quadruple Nlgn1234 cKO mice (Wu et al., 2019). At DIV3, we infected the cells with lentiviruses expressing inactive mutant Cre-recombinase (ΔCre) to retain WT neurexin or neuroligin expression, or active Cre-recombinase (Cre) to delete all neurexin isoforms, except for Nrxn1γ, a minor variant (Sterky et al., 2017) or all neuroligin isoforms (Fig. 3). Lentiviral expression of ΔCre and Cre was driven by the neuron-specific synapsin promoter, and both proteins contained nuclear localization signals and a fused eGFP moiety for visualization of expression (Kaeser et al., 2011). The lentiviruses infected all neurons (Fig. 3A). Previous studies documented that lentiviral expression of Cre causes complete recombination of neurexins and neuroligins in cultured neurons (Chanda et al., 2017; Khajal et al., 2020). To confirm this conclusion in the present study, we performed immunoblots on lysates from Nrxn123 cKO and Nlgn1234 cKO cortical cultures infected with lentiviral ΔCre or Cre (Fig. 3B,C). Cre expression caused a substantial loss of all neurexin isoforms (∼80%; Fig. 3B) and of neuroligin-1 to neuroligin-3 (∼80%-83%; Fig. 3C). Neuroligin-4 is not significantly expressed in this culture system (Varoqueaux et al., 2006; Hoon et al., 2011; Chanda et al., 2017). Our results validate the use of Nrxn123 and Nlgn1234 cKO neurons for characterizing the cellular effects of SPARCL1.
Figure 3.

Cre-recombinase expression substantially reduces neurexin and neuroligin protein expression in cKO neurons. A, Lentiviral infection of primary cortical neurons. Representative low-magnification images show DIV14 neurons expressing ΔCre-EGFP or Cre-EGFP. Neurons were counterstained for MAP2 to visualize neuronal dendrites, respectively. All neuronal nuclei were positive for ΔCre-EGFP or Cre-EGFP expression, yielding an infection efficiency of 100%. B, Analysis of neurexin protein expression in primary cortical neurons from Nrxn123 cKO mice. Immunoblots were performed on lysates from cortical cultures infected with lentiviral ΔCre or Cre. Left, Representative blots. Right, Summary graph of neurexin protein levels. The pan-neurexin antibody detects full-length (black arrow) and truncated neurexin. A nonspecific band is also observed (red arrow). The neurexin signals were normalized to corresponding β-actin signals for quantification. C, Analysis of neuroligin protein expression in primary cortical neurons from Nlgn1234 cKO mice. Immunoblots were performed on lysates from cortical cultures infected with lentiviral ΔCre or Cre. Left, Representative blots of Nlgn1, Nlgn2, and Nlgn3. Right, Summary graph of neurexin protein levels. The Nlgn3 antibody detects Nlgn3 (black arrow) and two nonspecific bands (red arrows). The neuroligin signals were normalized to corresponding β-actin signals for quantification. Bar graphs indicate mean ± SEM. Numbers of cells/independent cultures analyzed are shown within bars. Statistical significance was evaluated by a Student's t test. ***p < 0.001; nonsignificant relations are not indicated. For complete statistical analyses, see Extended Data Figure 3-1.
Deletion of neurexins fails to block excitatory synaptogenesis induced by recombinant SPARCL1
To determine whether SPARCL1 requires neurexins for synaptogenesis, we generated mixed cortical cultures from Nrxn123 cKO mice (Chen et al., 2017). We observed that the neurexin deletion had no effect on excitatory synapse numbers (Fig. 4A; presynaptic VGluT1 is used as a proxy for excitatory synapses) and caused a small, statistically insignificant decrease in inhibitory synapse numbers (Fig. 4A,C; presynaptic VGAT is used as a proxy for inhibitory synapses). Furthermore, the neurexin deletion failed to block the selective induction of excitatory synapses by SPARCL1 (Fig. 4A–C). Thus, neurexins are not required for the synaptogenic activity of SPARCL1.
Figure 4.
Deletion of neurexins in dissociated cultures of mouse neurons and glia neither decreases excitatory or inhibitory synapse numbers nor impairs the increase in excitatory synapse numbers produced by recombinant SPARCL1. A, Deletion of all neurexins does not significantly decrease synapse numbers and does not block excitatory synaptogenesis induced by recombinant SPARCL1. Representative images show Nrxn123, control (ΔCre), and cKO (Cre) neurons treated at DIV13 with the supernatants of HEK cells expressing either mClover (Control medium) or recombinant SPARCL1. Neurons were immunostained for VGLUT1 (excitatory puncta), VGAT (inhibitory puncta), and MAP2 at DIV14. Higher-magnification images (right) were taken from the boxed areas shown in the corresponding lower-magnification images (left). B, C, Quantifications showing that recombinant SPARCL1 increases the density of excitatory synapses (top summary graphs) but not inhibitory synapses (bottom summary graphs) in control and Nrxn123 cKO neurons. SPARCL1 did not affect the size and staining intensity of excitatory and inhibitory synapses. Bar graphs indicate mean ± SEM. Numbers of cells/independent cultures analyzed are shown within bars. *p < 0.05 (one-way ANOVA with Tukey's post hoc comparisons). Nonsignificant (n.s.) relations are indicated. For complete statistical analyses, see Extended Data Figure 4-1.
SPARCL1 increases spontaneous excitatory but not inhibitory synaptic transmission independent of neurexins
Does SPARCL1 induce functional synapses, and do neurexins influence the effect of SPARCL1 on synaptic transmission, even if they do not regulate synapse numbers? To address these questions, we treated mixed cortical cultures from Nrxn123 cKO mice with SPARCL1 and recorded mEPSCs in the presence of TTX and PTX. In WT (ΔCre) neurons, SPARCL1 increased the mEPSC frequency (∼300%) but did not significantly change the mEPSC amplitude (Fig. 5A). Notably, SPARCL1 increased the mEPSC frequency more robustly than the excitatory synapse density (Fig. 4A–C), suggesting that SPARCL1-induced synapses are fully functional. In Nrxn123 cKO (Cre) neurons, SPARCL1 potentiated the mEPSC frequency similar to WT neurons, showing that SPARCL1 acts independent of neurexins (Fig. 5A). Deletion of neurexins in itself significantly decreased the mEPSC frequency (∼25%), again without altering the mEPSC amplitude (Fig. 5A).
Figure 5.

Recombinant SPARCL1 increases spontaneous excitatory but not inhibitory synaptic transmission independent of neurexins. A, SPARCL1 increases mEPSC frequency but not amplitude independent of neurexins. Nrxn123, control (ΔCre), and cKO (Cre) neurons were treated at DIV13 with control medium or recombinant SPARCL1. Spontaneous excitatory synaptic activity was assessed at DIV14 by mEPSC recordings in the presence of TTX and PTX. Top, Representative traces. Bottom, Summary graphs of the mEPSC frequency and mEPSC amplitude. *p < 0.05 (one-way ANOVA with Tukey's post hoc comparisons). B, SPARCL1 does not affect spontaneous inhibitory synaptic activity. Nrxn123 control and cKO neurons were treated at DIV13 with control medium or recombinant SPARCL1. Spontaneous inhibitory synaptic activity was assessed at DIV14 by mIPSC recordings in the presence of TTX, CNQX, and D-AP5. Top, Representative traces. Bottom, Summary graphs of the mIPSC frequency and mIPSC amplitude. Bar graphs indicate mean ± SEM. Numbers of cells/independent cultures analyzed are shown beside the bars. ***p < 0.001 (one-way ANOVA with Tukey's post hoc comparisons). Nonsignificant relations are not indicated. For complete statistical analyses, see Extended Data Figure 5-1.
We next recorded mIPSCs in the presence of TTX, CNQX, and D-AP5 (Fig. 4B). SPARCL1 had no effect on mIPSC frequency and amplitude in the presence (ΔCre) or absence (Cre) of neurexins. The neurexin deletion in itself decreased the mIPSC frequency (∼50%) without significantly altering the mIPSC amplitude (Fig. 5B).
Together, these results suggest that, in addition to promoting excitatory synapse formation, SPARCL1 selectively and potently enhances excitatory synaptic transmission. Importantly, neurexins do not mediate these effects. Rather, neurexins are primarily required for normal synaptic transmission because their deletion decreases excitatory and inhibitory spontaneous activity without changing synapse numbers, but the neurexin and SPARCL1 effects are completely independent of each other.
Deletion of neuroligins also fails to block excitatory synaptogenesis induced by recombinant SPARCL1
Although SPARCL1 does not require neurexins for synaptogenesis, it is still possible that it might act by binding to neuroligins, which likely bind to other adhesion molecules in addition to neurexins (Connor et al., 2019). Thus, we asked whether SPARCL1 acts via neuroligins. We infected mixed cortical cultures from quadruple Nlgn1234 cKO mice (Wu et al., 2019) with lentiviruses encoding ΔCre to retain WT neuroligin expression or Cre to induce the pan-neuroligin deletion (Figs. 2A, 3). We then analyzed the neurons by immunocytochemistry (Fig. 6) and by electrophysiological recordings of spontaneous and evoked synaptic transmission (mEPSCs and mIPSCs, Fig. 7; EPSCs and IPSCs, Fig. 8).
Figure 6.
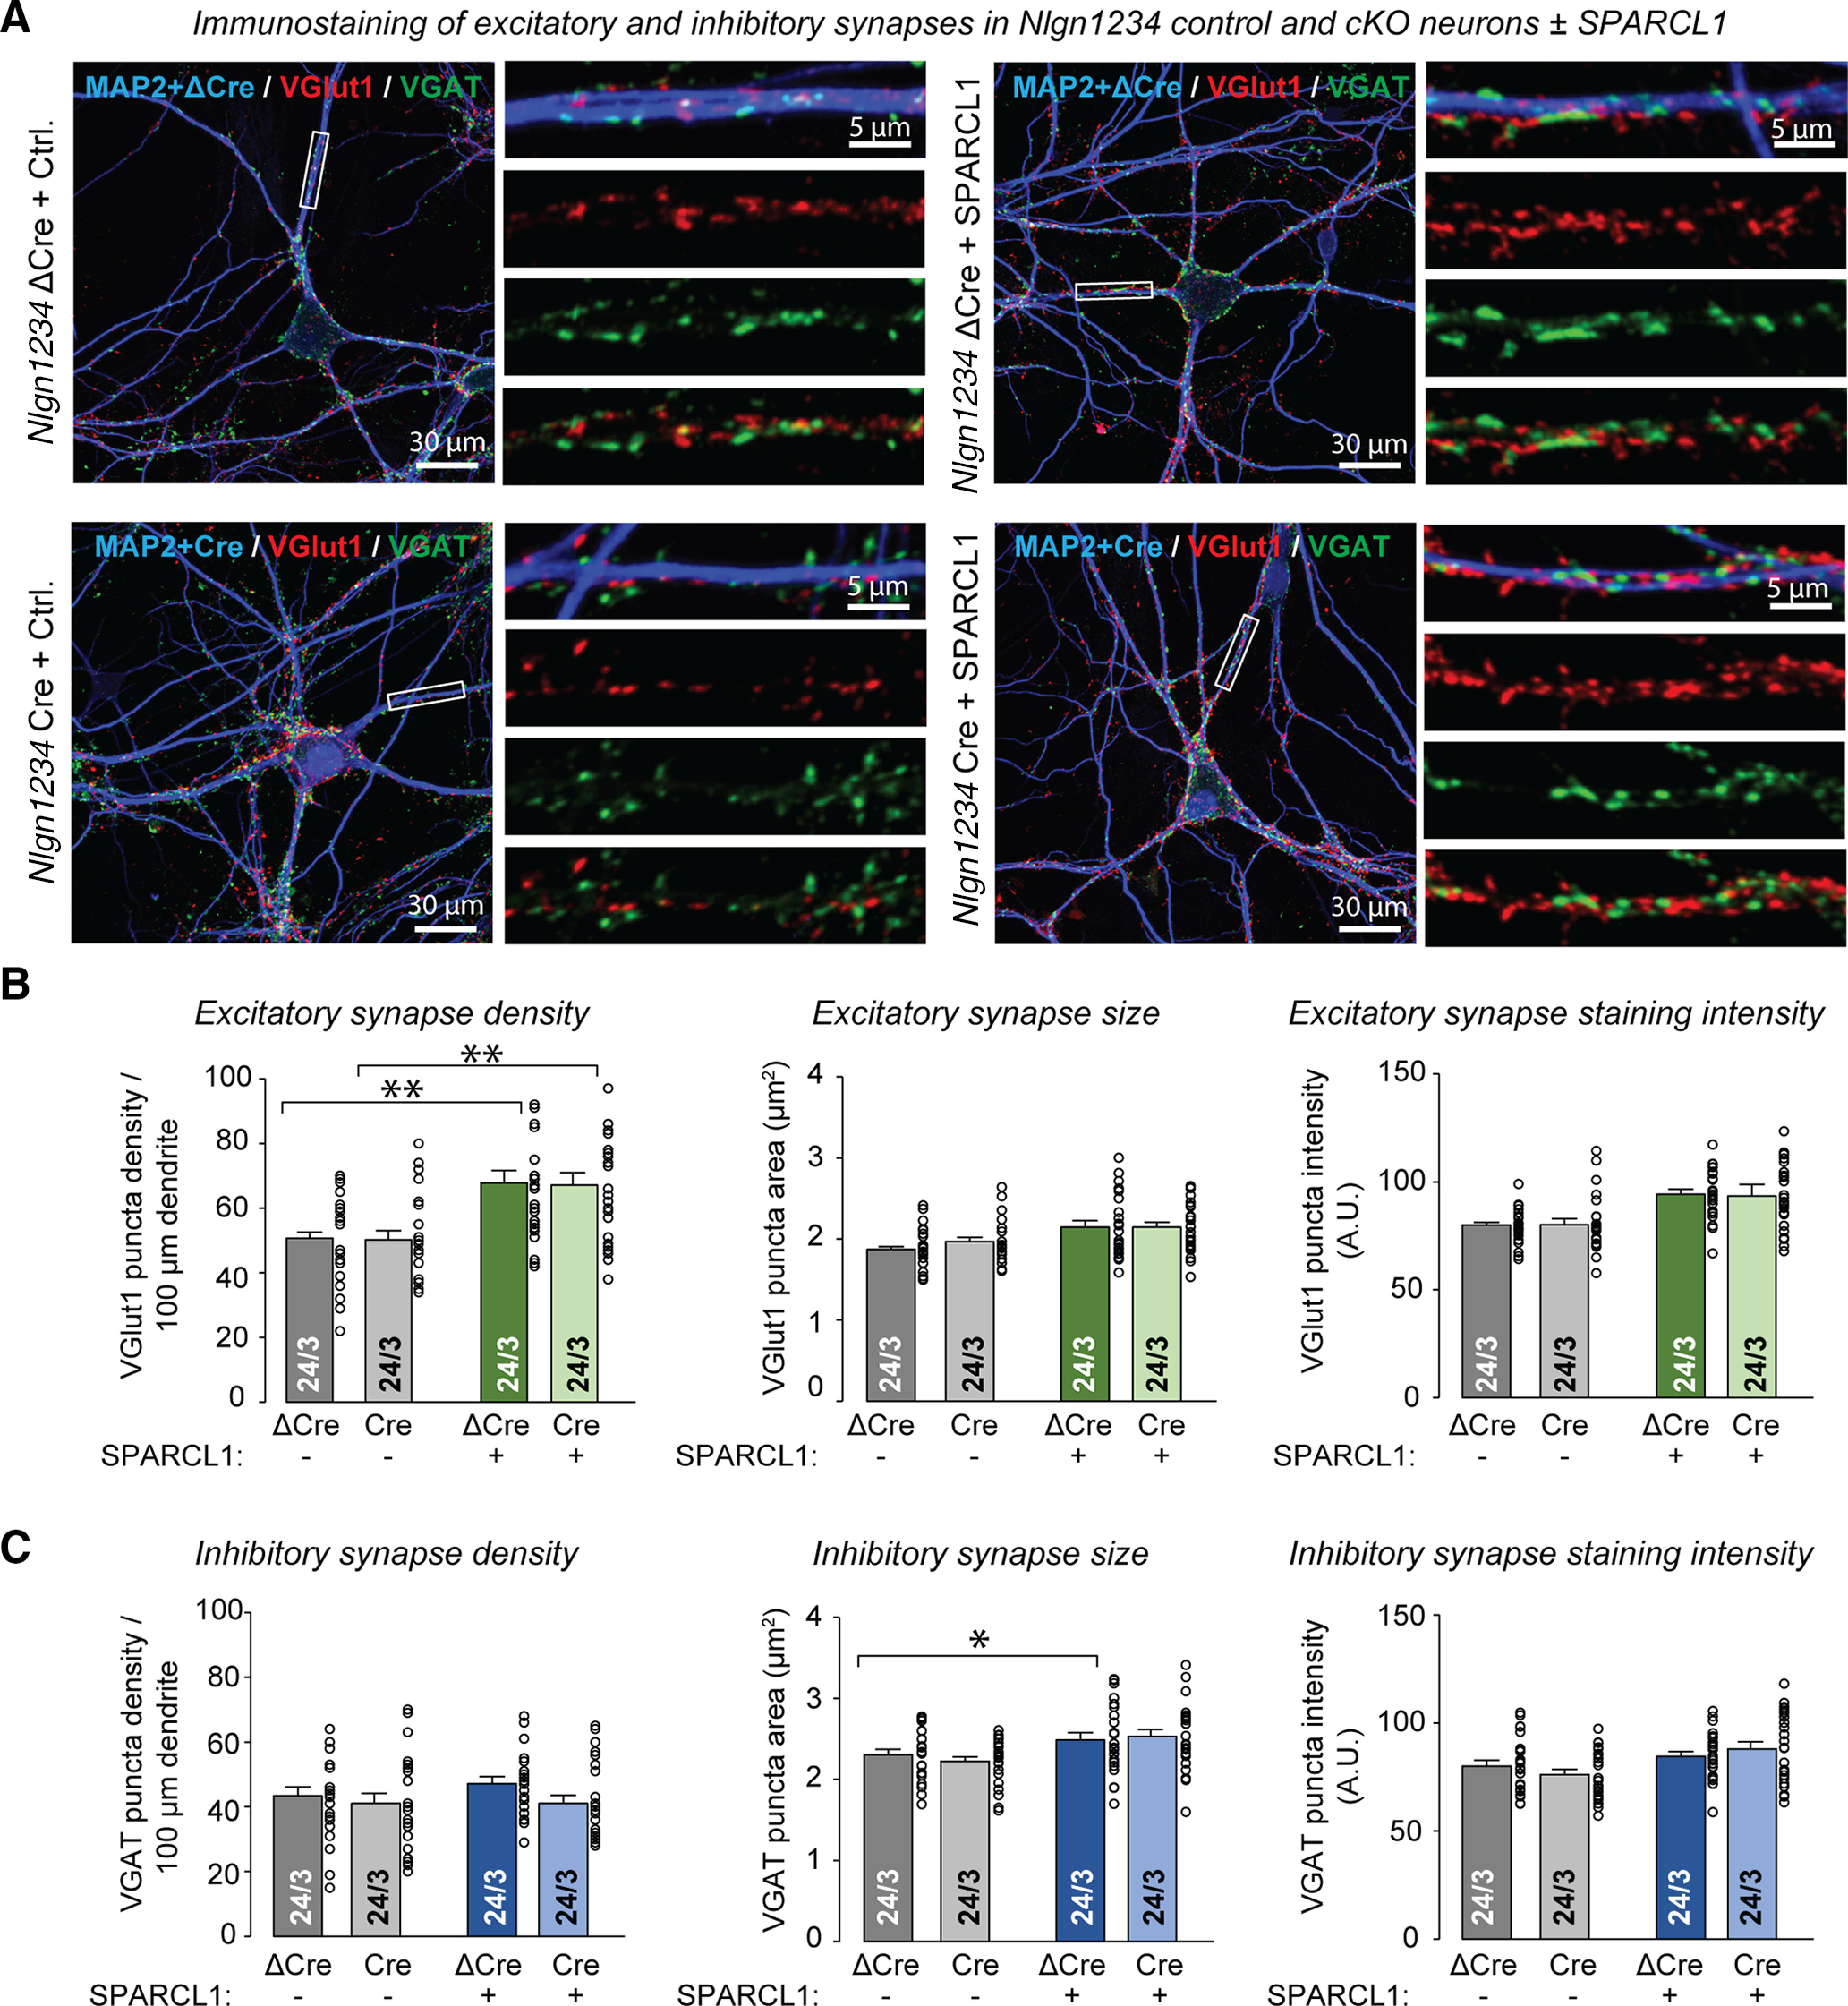
Deletion of neuroligins does not significantly decrease synapse numbers and does not block excitatory synaptogenesis induced by recombinant SPARCL1. A, Deletion of all neuroligins does not significantly decrease synapse numbers and does not block excitatory synaptogenesis induced by recombinant SPARCL1. Representative images show Nlgn1234, control (ΔCre), and cKO (Cre) neurons treated at DIV13 with the supernatants of HEK cells expressing either mClover (Control medium) or recombinant SPARCL1. Neurons were immunostained for VGLUT1 (excitatory puncta), VGAT (inhibitory puncta), and MAP2 at DIV14. Higher-magnification images (right) were taken from the boxed areas shown in the corresponding lower-magnification images (left). B, C, Quantifications showing that recombinant SPARCL1 increases the density of excitatory synapses (top summary graphs) but not inhibitory synapses (bottom summary graphs) in control and Nlgn1234 cKO neurons. SPARCL1 did not substantially affect the size and staining intensity of excitatory and inhibitory synapses. Bar graphs indicate mean ± SEM. Numbers of cells/independent cultures analyzed are shown within bars. *p < 0.05; **p < 0.01 (one-way ANOVA with Tukey's post hoc comparisons). Nonsignificant relations are not indicated. For complete statistical analyses, see Extended Data Figure 6-1.
Figure 7.

Recombinant SPARCL1 increases spontaneous excitatory but not inhibitory synaptic transmission independent of neuroligins. A, Deletion of all neuroligins significantly reduces mEPSC frequency and amplitude but does not prevent SPARCL1 from increasing mEPSC frequency. Nlgn1234, control (ΔCre), and cKO (Cre) neurons were treated at DIV13 with control medium or recombinant SPARCL1. Spontaneous excitatory synaptic activity was assessed at DIV14 by mEPSC recordings in the presence of TTX and PTX. Top, Representative traces. Bottom, Summary graphs of the mEPSC frequency and mEPSC amplitude. B, Deletion of all neuroligins significantly reduces mIPSC frequency and amplitude, which are unaltered by SPARCL1. Nlgn1234 control and cKO neurons were treated at DIV13 with control medium or recombinant SPARCL1. Spontaneous inhibitory synaptic activity was assessed at DIV14 by mIPSC recordings in the presence of TTX, CNQX, and D-AP5. Top, Representative traces. Bottom, Summary graphs of the mIPSC frequency and mIPSC amplitude. Bar graphs indicate mean ± SEM. Numbers of cells/independent cultures analyzed are shown beside the bars. *p < 0.05; **p < 0.01; ***p < 0.001 (one-way ANOVA with Tukey's post hoc comparisons). Nonsignificant relations are not indicated. For complete statistical analyses, see Extended Data Figure 7-1.
Figure 8.
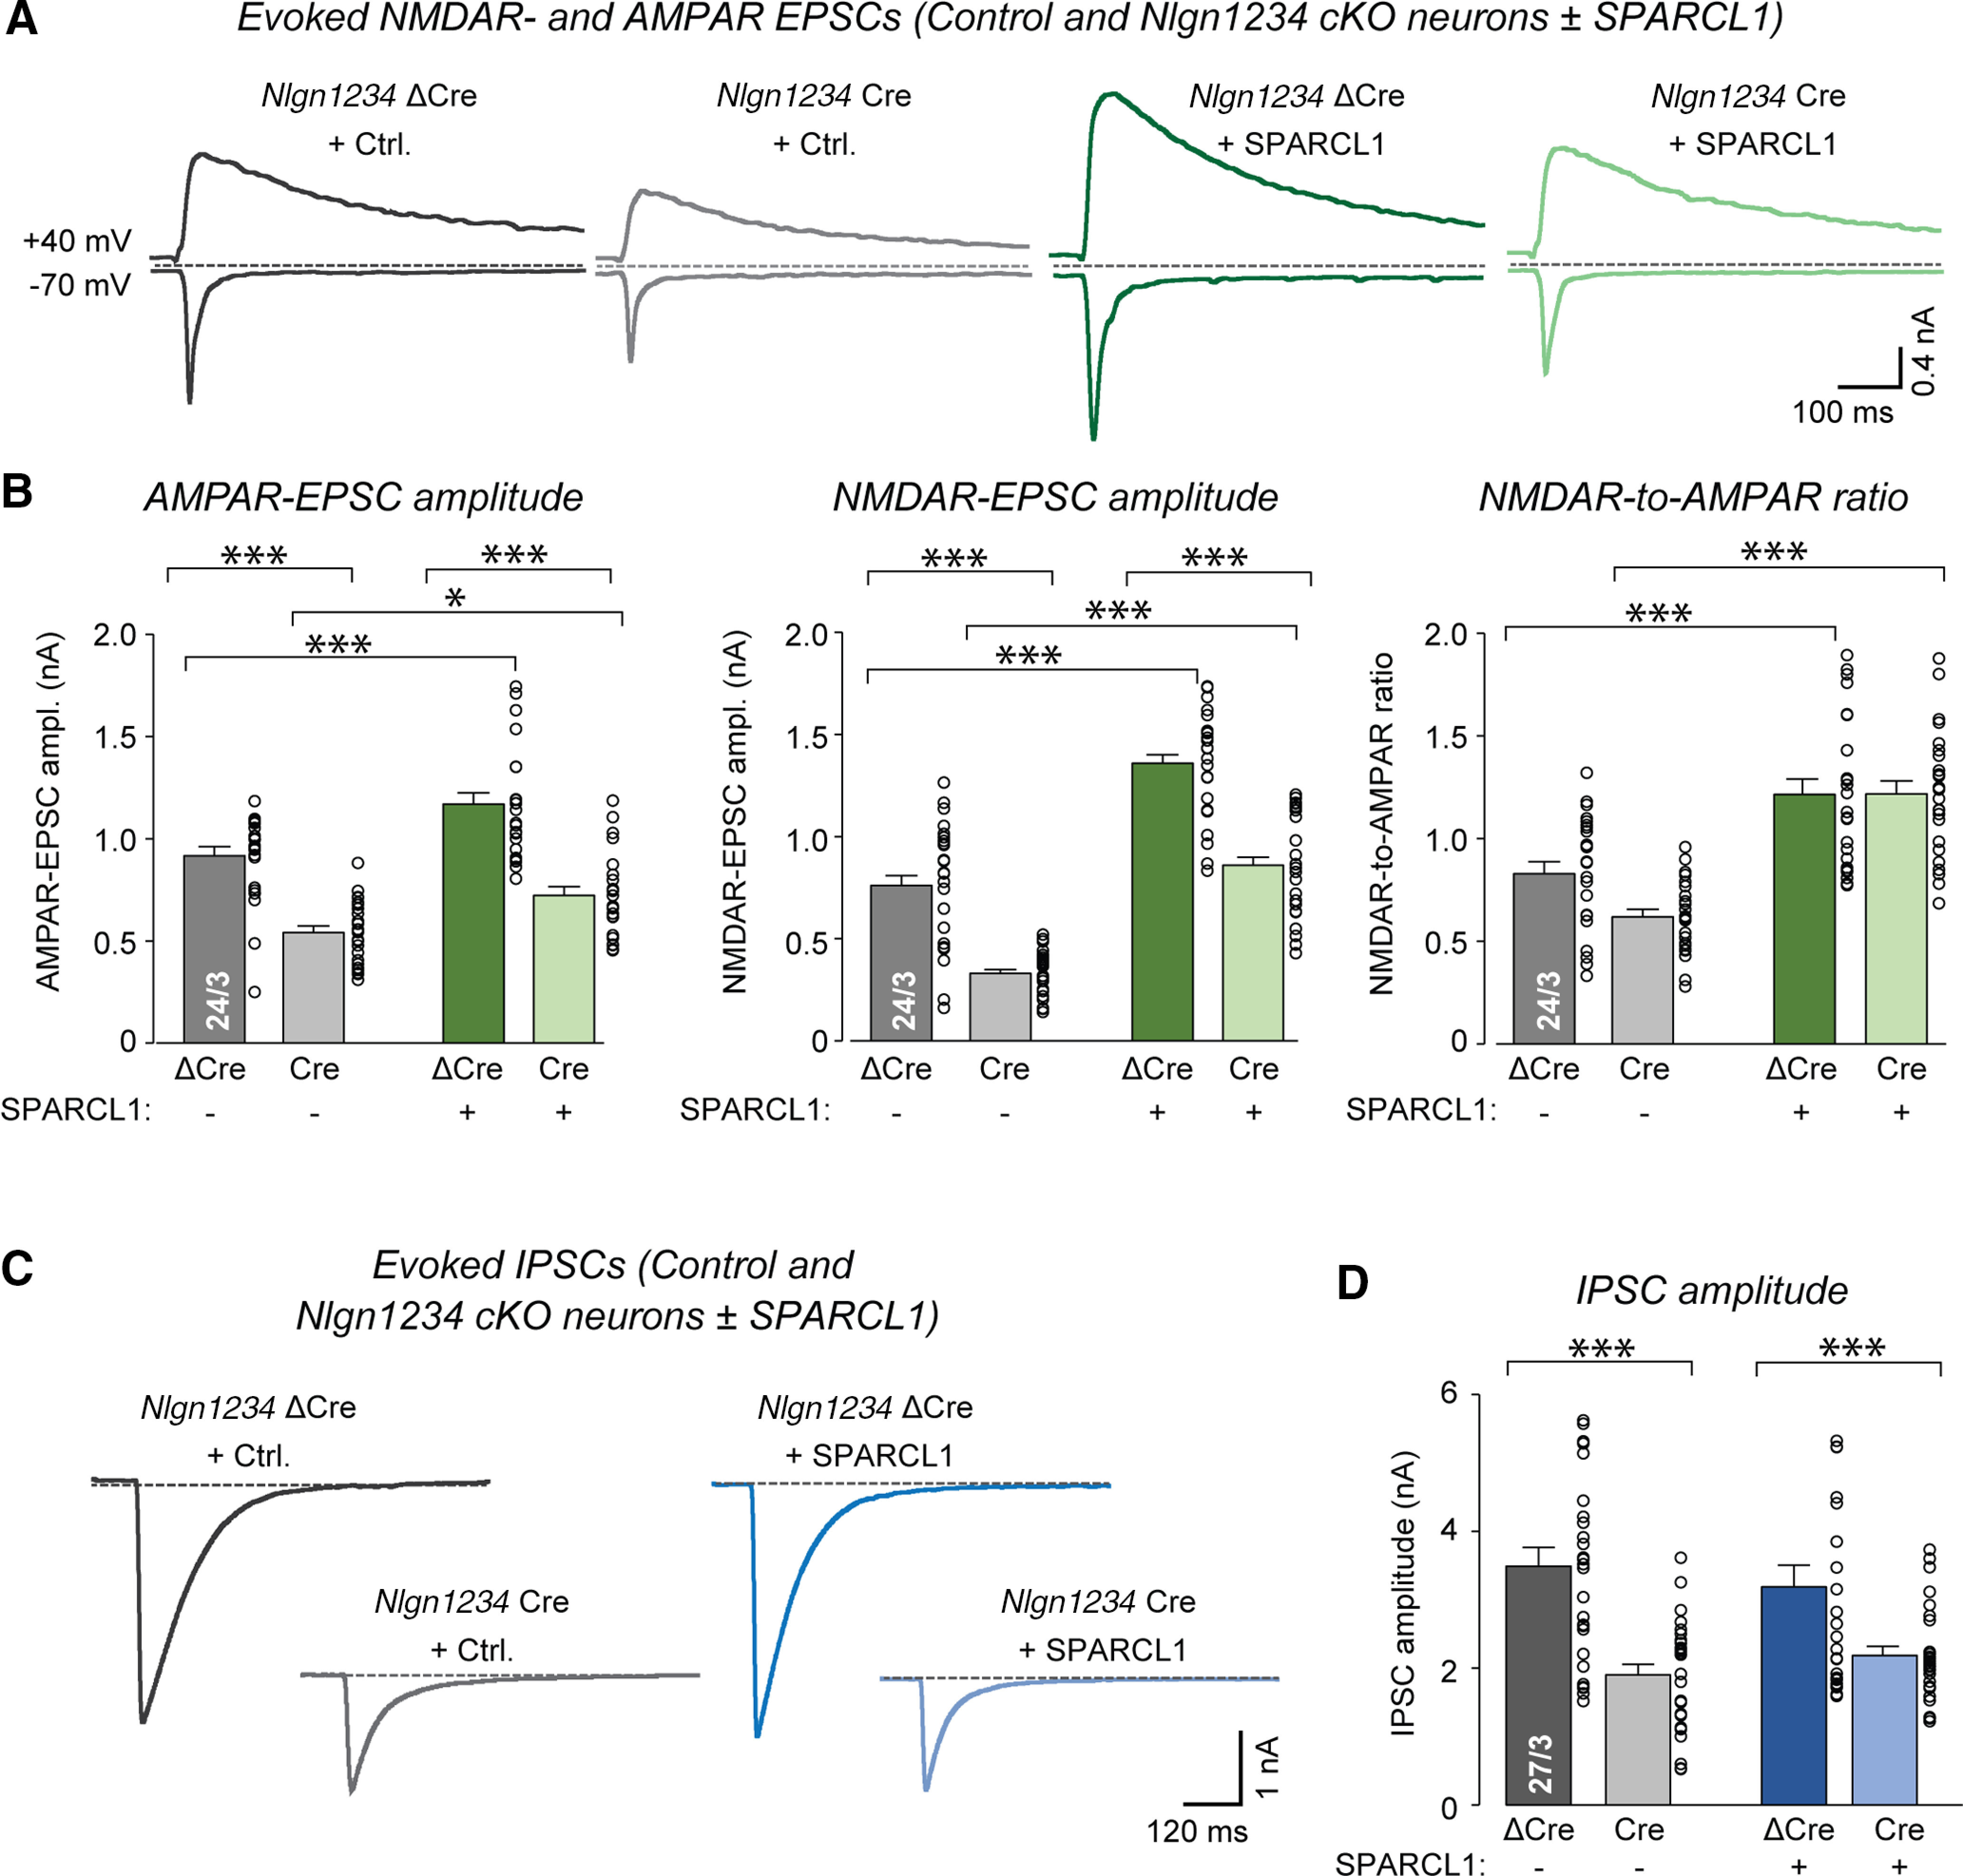
SPARCL1 selectively enhances excitatory evoked neurotransmission and increases NMDAR-mediated synaptic responses independent of neuroligins. A, Deletion of all neuroligins reduces the amplitudes of evoked AMPAR-EPSCs and NMDAR-EPSCs. Treatment with recombinant SPARCL1 increases these parameters and particularly enhances the NMDAR/AMPAR ratio independent of neuroligins. Nlgn1234 control and cKO neurons were treated at DIV13 with control medium or recombinant SPARCL1. Neurons were analyzed at DIV14-DIV16 by recording EPSCs evoked by extracellular stimulation. AMPAR-EPSCs and NMDAR-EPSCs were pharmacologically isolated with PTX and monitored at −70 mV and 40 mV holding potentials, respectively. Representative traces of evoked EPSCs are shown for all conditions. B, Summary graphs of evoked AMPAR-EPSC amplitude, NMDAR-EPSC amplitude, and NMDAR/AMPAR ratio. NMDAR current amplitudes were measured 50 ms after stimulation. C, Deletion of all neuroligins reduces the amplitudes of evoked GABAR-IPSCs, whereas addition of SPARCL1 does not alter these currents. Nlgn1234 control and cKO neurons were treated at DIV13 with control medium or recombinant SPARCL1. Neurons were analyzed at DIV14-DIV16 by recording IPSCs evoked by extracellular stimulation. GABAR-IPSCs were pharmacologically isolated with D-AP5 and CNQX and monitored at −70 mV. Representative traces of evoked IPSCs are shown for all conditions. D, Summary graph of evoked GABAR-IPSC amplitude. Bar and line graphs indicate mean ± SEM. Numbers of cells/independent cultures analyzed are shown within the bars. *p < 0.05; ***p < 0.001; one-way ANOVAs and Tukey's post hoc comparisons. Nonsignificant relations are not indicated. For complete statistical analyses, see Extended Data Figure 8-1.
As described above, quantifications of synaptic puncta confirmed that SPARCL1 significantly increased the density of VGluT1-positive excitatory synapses (∼50%) without affecting the density of VGAT-positive inhibitory synapses (Fig. 6). Again, the size and staining intensity of excitatory and inhibitory synapses were unaffected by SPARCL1 treatment. The pan-neuroligin deletion had no effect on excitatory and inhibitory synapse density, size, or staining intensity (Fig. 6). Notably, the pan-neuroligin deletion did not prevent SPARCL1 from selectively increasing excitatory synapse density (Fig. 6).
Measurements of mEPSCs and mIPSCs from WT (ΔCre) and neuroligin-deficient (Cre) neurons confirmed that SPARCL1 potently but selectively increased the mEPSC frequency (Fig. 7A). We also observed that SPARCL1 significantly enhanced the mEPSC amplitude in WT neurons. As before, SPARCL1 had no effect on the mIPSC frequency or amplitude (Fig. 7B). Strikingly, the pan-neuroligin deletion also did not block SPARCL1 from enhancing excitatory synaptic activity, although the pan-neuroligin deletion in itself produced major impairments in both excitatory and inhibitory synaptic transmission. Specifically, the pan-neuroligin deletion decreased the frequencies of both mEPSCs and mIPSCs (∼50%) and reduced the amplitudes of mEPSCs (∼30%) and mIPSCs (∼45%). Together, these results show that neuroligins are not required for SPARCL1 to enhance excitatory synapse density and synaptic transmission, but that neuroligins act as major synaptic organizers whose deletion severely impairs excitatory and inhibitory synapse function without changing synapse numbers.
SPARCL1 enhances excitatory but not inhibitory evoked neurotransmission and increases the synaptic NMDAR content independent of neuroligins
Previously, we showed in human neurons that SPARCL1 not only increases spontaneous synaptic transmission but also boosts NMDAR-mediated synaptic responses (Gan and Südhof, 2019). To determine whether SPARCL1 also exhibits this specific activity in mouse neurons, we measured synaptic responses evoked by single action potentials in mixed cortical neurons as a function of SPARCL1 treatment. In the same experiments, we also tested the possibility that neuroligins are selectively required for SPARCL1 to enhance NMDAR-mediated responses because neuroligin-1 has been linked to NMDARs in other studies (Chubykin et al., 2007; Jiang et al., 2017; Wu et al., 2019).
We treated WT (ΔCre) and neuroligin-deficient (Cre) neurons with control or SPARCL1 medium (as described above) and monitored evoked EPSCs and IPSCs. We examined AMPAR- and NMDAR-mediated EPSCs separately by recording them at holding potentials of −70 mV and 40 mV, respectively. We quantified AMPAR-EPSCs at peak amplitudes and NMDAR-EPSCs at 50 ms after the stimulus (Fig. 8A). Consistent with the elevations in synapse density and mEPSC frequency, SPARCL1 significantly increased the amplitude of AMPAR-EPSCs (∼50%) in both control and neuroligin-deficient neurons (Fig. 8B). Strikingly, SPARCL1 increased the amplitude of NMDAR-EPSCs to an even larger extent (>200%) in both WT and neuroligin-deficient neurons (Fig. 8B). In line with this observation, SPARCL1 also enhanced the NMDAR/AMPAR ratio (∼100%; Fig. 8B). These data show that SPARCL1 not only promotes synapse formation, but also changes the receptor composition of synapses by increasing their NMDAR responses independent of neuroligins. Notably, the deletion of neuroligins produced a significant decrease both in AMPAR-EPSCs (∼40%) and in NMDAR-EPSCs (∼50%); this decrease was not affected by SPARCL1.
Finally, we recorded evoked IPSCs as a function of SPARCL1 treatments and neuroligin expression (Fig. 8C,D). SPARCL1 did not alter the amplitude of IPSCs, consistent with its lack of effect on inhibitory synapse numbers and spontaneous activity as described above. However, the neuroligin deletion suppressed inhibitory synaptic transmission (∼50%), consistent with a major function of neuroligins in both excitatory and inhibitory synapses (Fig. 8C,D). Together, these results show that neuroligins are not required for SPARCL1 to selectively enhance evoked neurotransmission at excitatory synapses.
Discussion
Emerging evidence supports roles for secreted ECM proteins in synapse formation, synapse maturation, and synaptic plasticity (Ferrer-Ferrer and Dityatev, 2018; Yuzaki, 2018). SPARCL1 is a secreted, ubiquitously expressed protein that is highly synaptogenic when added to cultured neurons, inducing the formation of synapses that have been described as largely inactive (Kucukdereli et al., 2011) or active (Gan and Südhof, 2019). Moreover, SPARCL1 is abundant in the blood of young mice but declines precipitously in blood with age, suggesting a possible role as a systemic aging factor (Gan and Südhof, 2019). In the present study, we aimed to explore the mechanism by which SPARCL1 boosts synapse formation, guided by the exciting discovery that SPARCL1 may catalyze the formation of trans-synaptic neurexin/neuroligin complexes (Singh et al., 2016). Specifically, three questions arose from previous studies: (1) Does SPARCL1 act on all synapses, or is it selective for a subset of synapses? (2) Does SPARCL1 induce functional or largely inactive synapses? (3) Does SPARCL1 boost synapse formation by binding to neurexins and/or neuroligins, or is a different, presently unknown receptor responsible for its powerful synaptogenic effect?
We addressed these questions using mixed cultures of glia and neurons prepared from the cortex of newborn mice, and we used rigorous genetic manipulations to examine the role of neurexins and neuroligins in SPARCL1-induced synaptogenesis. Our observations enable the following conclusions. (1) SPARCL1 specifically boosts the formation of excitatory but not inhibitory synapses without changing neuronal size and dendritic arborization (Figs. 2, 4, 6); thus, SPARCL1 acts on a subset of synapses without affecting general neuronal maturation. (2) SPARCL1 strengthens excitatory synapses more than it elevates excitatory synapse density; thus, SPARCL1 either induces new, highly efficacious synapses or strengthens existing synapses (Figs. 5, 7, 8). (3) At excitatory synapses, a brief SPARCL1 treatment increases the magnitude of NMDAR-mediated responses to a larger extent than AMPAR-mediated responses, thereby elevating the NMDAR/AMPAR EPSC ratio by ∼50% (Fig. 8). (4) SPARCL1 is secreted from glia at only low levels, such that endogenous SPARCL1 is insufficient to stimulate synapse formation, and that exogenous, possibly blood-derived, systemic SPARCL1 (Gan and Südhof, 2019) boosts synapse formation. (5) Deletion of neurexins (except for the minor variant Nrxn1γ) or of neuroligins does not alter any of the SPARCL1-induced effects on neurons (Figs. 2, 4–7); thus, SPARCL1 does not act by binding to neurexins and neuroligins as hypothesized (Singh et al., 2016). (6) Deletion of neurexins or of neuroligins has no effect on either excitatory or inhibitory synapse numbers in cultured neurons; thus, neither neurexins nor neuroligins are essential for synapse formation or maintenance (Figs. 4, 6). (7) Deletion of neurexins decreases the frequencies of mEPSCs and mIPSCs (∼50%) without affecting their amplitudes (Fig. 5), consistent with previous reports that the neurexin deletion impairs synapse organization (Missler et al., 2003; Chen et al., 2017; Luo et al., 2020). (8) Finally, deletion of neuroligins also suppressed the frequencies of mEPSCs and mIPSCs (∼50%), but additionally decreased their amplitudes (∼30% and ∼45%, respectively; Fig. 7). Thus, the neuroligin deletion impaired synaptic transmission more severely than did the neurexin deletion, suggesting that neuroligins may bind to other trans-synaptic ligands in addition to neurexins.
Our experiments generate a new, overall picture of SPARCL1 function that answers the three questions posed above: SPARCL1 not only selectively induces functional excitatory synapses but increases their efficacy and enhances their NMDAR content more than their AMPAR content. Moreover, SPARCL1 clearly acts independent of neurexins and neuroligins. The specificity of SPARCL1 for excitatory synapse function is unexpected. SPARCL1 likely acts by binding to a high-affinity receptor, as yet unidentified, that induces an intracellular signal for synapse formation and synaptic organization, which is specific for excitatory neurons.
Our results are consistent with earlier results documenting the potent synaptogenic action of SPARCL1 (Kucukdereli et al., 2011; Gan and Südhof, 2019). However, our results are at odds with two previous conclusions about SPARCL1, namely, that SPARCL1 induces nonfunctional synapses, and that SPARCL1 enhances synapse formation by bridging presynaptic Nrxn1α and postsynaptic Nlgn1B (Kucukdereli et al., 2011; Singh et al., 2016). In assessing these apparent contradictions, it should be recalled that the previous studies were rather preliminary. Although these studies suggested exciting hypotheses, they performed few direct tests of synapse function, did not directly demonstrate binding of SPARCL1 to neurexins or neuroligins, and did not show that deletions of neurexins or neuroligins ablate SPARCL1 activity. Here, we demonstrate, using rigorous electrophysiological analyses, that SPARCL1 is even more effective than envisioned earlier in promoting synapse function; it not only boosted synapse numbers but also enhanced synaptic strength and increased NMDAR signaling. Thus, SPARCL1 promotes formation of highly functional synapses. Moreover, we find that SPARCL1 is poorly secreted from glia, whereas exogenous SPARCL1 potently enhances synapses in the presence of glia. This observation suggests that glial SPARCL1 does not contribute significantly to this effect. Finally, our conclusion that SPARCL1 acts independent of neurexins and neuroligins is based on solid genetic manipulations and is consistent with several previous studies. Specifically, biophysical assays failed to detect SPARCL1 binding to neuroligins (Elegheert et al., 2017). Furthermore, neurexins and neuroligins are thought to function in both excitatory and inhibitory synapses (Missler et al., 2003; Varoqueaux et al., 2006; Chubykin et al., 2007; Chen et al., 2017), yet we found that SPARCL1 acts only on excitatory synapses. The use of transient shRNA knockdowns in Singh et al. (2016) versus cKOs in the present study may account for these discrepancies.
Our results also contradict some previous studies on neurexins and neuroligins but again are consistent with others. Specifically, many studies using shRNAs (or microRNAs operating by the same mechanism) often detect massive decreases in synapse numbers when a neurexin or neuroligin is targeted (e.g., see Chih et al., 2006; Kwon et al., 2012; Bemben et al., 2014; Li et al., 2017; Roppongi et al., 2020). Yet, genetic deletions failed to reveal a decrease in excitatory synapse numbers on KO of neurexins or neuroligins, even when all neurexins or neuroligins were targeted (e.g., Missler et al., 2003; Varoqueaux et al., 2006; Chanda et al., 2017; Chen et al., 2017). Our current results confirm these latter reports. The unchanged synapse numbers observed on genetic deletions are not because of unspecified compensatory effects. Like RNAi-mediated deletions, conditional mutations also operate on an acute time frame but with higher specificity, suggesting that the phenotypes of RNAi-mediated neurexin or neuroligin mutations reflect off-target effects.
How might neuronal transmembrane proteins other than neurexins and neuroligins function as SPARCL1 receptors that mediate excitatory synapse formation and NMDAR recruitment? In one scenario, SPARCL1 might stabilize interactions between diffusible secreted factors and their synaptic receptors. SPARCL1 is reported to activate Wnt signaling by direct interaction with various Frizzled (Fz) receptors and lipoprotein-related proteins, thereby stabilizing Wnt-receptor complexes (Zhao et al., 2018). Wnt7a and its receptor Fz5 promote synapse formation in hippocampal neurons by stimulating recruitment of synaptic vesicles and active zone proteins (Sahores et al., 2010). Furthermore, Wnt5a binds to multiple Fz receptors to specifically upregulate synaptic NMDAR currents in hippocampal slices (Cerpa et al., 2011). Thus, SPARCL1-induced activation of Wnt signaling may underlie excitatory synapse formation and NMDAR recruitment. Another possibility is that SPARCL1 might bind and activate extracellular matrix receptors, such as integrins. The follistatin-like domain of SPARC, which is also present in SPARCL1, interacts with β-integrins at developing synapses (Jones et al., 2011). Activated β-integrins trigger rapid phosphorylation of Src family kinases, which in turn increases tyrosine phosphorylation of GluN2A and GluN2B NMDAR subunits and enhances NMDAR activity (Park and Goda, 2016). Thus, SPARCL1 could potentially enhance synaptic NMDAR responses via binding to β-integrins. Additional studies will be required to test novel synaptic receptors for SPARCL1 and elucidate downstream signaling mechanisms that regulate synapse formation and specification.
Footnotes
The authors declare no competing financial interests.
K.J.G. was supported by Canadian Institutes of Health Research postdoctoral research fellowship MFE-141209. This work was supported by National Institute of Mental Health Grants MH052804 and MH092931 to T.C.S.
References
- Allen NJ, Bennett ML, Foo LC, Wang GX, Chakraborty C, Smith SJ, Barres BA (2012) Astrocyte glypicans 4 and 6 promote formation of excitatory synapses via GluA1 AMPA receptors. Nature 486:410–414. 10.1038/nature11059 [DOI] [PMC free article] [PubMed] [Google Scholar]
- Bemben MA, Shipman SL, Hirai T, Herring BE, Li Y, Badger JD, Nicoll RA, Diamond JS, Roche KW (2014) CaMKII phosphorylation of neuroligin-1 regulates excitatory synapses. Nat Neurosci 17:56–64. 10.1038/nn.3601 [DOI] [PMC free article] [PubMed] [Google Scholar]
- Boucard AA, Chubykin AA, Comoletti D, Taylor P, Südhof TC (2005) A splice code for trans-synaptic cell adhesion mediated by binding of neuroligin 1 to alpha- and beta-neurexins. Neuron 48:229–236. 10.1016/j.neuron.2005.08.026 [DOI] [PubMed] [Google Scholar]
- Brekken RA, Sage EH (2000) SPARC, a matricellular protein: at the crossroads of cell-matrix. Matrix Biol 19:569–580. 10.1016/S0945-053X(00)00105-0 [DOI] [PubMed] [Google Scholar]
- Brekken RA, Sage EH (2001) SPARC, a matricellular protein: at the crossroads of cell-matrix communication. Matrix Biol 19:816–827. [DOI] [PubMed] [Google Scholar]
- Cao X, Tabuchi K (2017) Functions of synapse adhesion molecules neurexin/neuroligins and neurodevelopmental disorders. Neurosci Res 116:3–9. 10.1016/j.neures.2016.09.005 [DOI] [PubMed] [Google Scholar]
- Cerpa W, Gambrill A, Inestrosa NC, Barria A (2011) Regulation of NMDA-receptor synaptic transmission by Wnt signaling. J Neurosci 31:9466–9471. 10.1523/JNEUROSCI.6311-10.2011 [DOI] [PMC free article] [PubMed] [Google Scholar]
- Chanda S, Hale WD, Zhang B, Wernig M, Südhof TC (2017) Unique versus redundant functions of neuroligin genes in shaping excitatory and inhibitory synapse properties. J Neurosci 37:6816–6836. 10.1523/JNEUROSCI.0125-17.2017 [DOI] [PMC free article] [PubMed] [Google Scholar]
- Chen LY, Jiang M, Zhang B, Gokce O, Südhof TC (2017) Conditional deletion of all neurexins defines diversity of essential synaptic organizer functions for neurexins. Neuron 94:611–625. 10.1016/j.neuron.2017.04.011 [DOI] [PMC free article] [PubMed] [Google Scholar] [Retracted]
- Chih B, Gollan L, Scheiffele P (2006) Alternative splicing controls selective trans-synaptic interactions of the neuroligin-neurexin complex. Neuron 51:171–178. 10.1016/j.neuron.2006.06.005 [DOI] [PubMed] [Google Scholar]
- Christopherson KS, Ullian EM, Stokes CC, Mullowney CE, Hell JW, Agah A, Lawler J, Mosher DF, Bornstein P, Barres BA (2005) Thrombospondins are astrocyte-secreted proteins that promote CNS synaptogenesis. Cell 120:421–433. 10.1016/j.cell.2004.12.020 [DOI] [PubMed] [Google Scholar]
- Chubykin AA, Atasoy D, Etherton MR, Brose N, Kavalali ET, Gibson JR, Südhof TC (2007) Activity-dependent validation of excitatory vs. inhibitory synapses by neuroligin-1 vs. neuroligin-2. Neuron 54:919–931. 10.1016/j.neuron.2007.05.029 [DOI] [PMC free article] [PubMed] [Google Scholar]
- Connor SA, Elegheert J, Xie Y, Craig AM (2019) Pumping the brakes: suppression of synapse development by MDGA-neuroligin interactions. Curr Opin Neurobiol 57:71–80. 10.1016/j.conb.2019.01.002 [DOI] [PubMed] [Google Scholar]
- Elegheert J, Cvetkovska V, Clayton AJ, Heroven C, Vennekens KM, Smukowski SN, Regan MC, Jia W, Smith AC, Furukawa H, Savas JN, de Wit J, Begbie J, Craig AM, Aricescu AR (2017) Structural mechanism for modulation of synaptic neuroligin-neurexin signaling by MDGA proteins. Neuron 95:896–913. 10.1016/j.neuron.2017.07.040 [DOI] [PMC free article] [PubMed] [Google Scholar]
- Ferrer-Ferrer M, Dityatev A (2018) Shaping synapses by the neural extracellular matrix. Front Neuroanat 12:40. 10.3389/fnana.2018.00040 [DOI] [PMC free article] [PubMed] [Google Scholar]
- Gan KJ, Südhof TC (2019) Specific factors in blood from young but not old mice directly promote synapse formation and NMDA-receptor recruitment. Proc Natl Acad Sci USA 116:12524–12533. 10.1073/pnas.1902672116 [DOI] [PMC free article] [PubMed] [Google Scholar]
- Girard JP, Springer TA (1995) Cloning from purified high endothelial venule cells of hevin, a close relative of the antiadhesive extracellular matrix protein SPARC. Immunity 2:113–123. 10.1016/1074-7613(95)90083-7 [DOI] [PubMed] [Google Scholar]
- Girard JP, Springer TA (1996) Modulation of endothelial cell adhesion by hevin, an acidic protein associated with high endothelial venules. J Biol Chem 271:4511–4517. 10.1074/jbc.271.8.4511 [DOI] [PubMed] [Google Scholar]
- Hoon M, Soykan T, Falkenburger B, Hammer M, Patrizi A, Schmidt K, Sassoe-Pognetto M, Lowel S, Moser T, Taschenberger H, Brose N, Varoqueaux F (2011) Neuroligin-4 is localized to glycinergic postsynapses and regulates inhibition in the retina. Proc Natl Acad Sci USA 108:3053–3058. 10.1073/pnas.1006946108 [DOI] [PMC free article] [PubMed] [Google Scholar]
- Jiang M, Polepalli J, Chen LY, Zhang B, Südhof TC, Malenka RC (2017) Conditional ablation of neuroligin-1 in CA1 pyramidal neurons blocks LTP by a cell-autonomous NMDA receptor-independent mechanism. Mol Psychiatry 22:375–383. 10.1038/mp.2016.80 [DOI] [PMC free article] [PubMed] [Google Scholar]
- Jones EV, Bernardinelli Y, Tse YC, Chierzi S, Wong TP, Murai KK (2011) Astrocytes control glutamate receptor levels at developing synapses through SPARC-beta-integrin interactions. J Neurosci 31:4154–4165. 10.1523/JNEUROSCI.4757-10.2011 [DOI] [PMC free article] [PubMed] [Google Scholar]
- Kaeser PS, Deng L, Wang Y, Dulubova I, Liu X, Rizo J, Südhof TC (2011) RIM proteins tether Ca2+ channels to presynaptic active zones via a direct PDZ-domain interaction. Cell 144:282–295. 10.1016/j.cell.2010.12.029 [DOI] [PMC free article] [PubMed] [Google Scholar]
- Katzman A, Alberini CM (2018) NLGN1 and NLGN2 in the prefrontal cortex: their role in memory consolidation and strengthening. Curr Opin Neurobiol 48:122–130. 10.1016/j.conb.2017.12.003 [DOI] [PMC free article] [PubMed] [Google Scholar]
- Khajal AJ, Sterky FH, Sclip A, Schwenk J, Brunger AT, Fakler B, Sudhof TC (2020) Deorphanizing FAM19A proteins as pan-neurexin ligands with an unusual biosynthetic binding mechanism. J Cell Biol 219:e202004164. [DOI] [PMC free article] [PubMed] [Google Scholar]
- Kucukdereli H, Allen NJ, Lee AT, Feng A, Ozlu MI, Conatser LM, Chakraborty C, Workman G, Weaver M, Sage EH, Barres BA, Eroglu C (2011) Control of excitatory CNS synaptogenesis by astrocyte-secreted proteins Hevin and SPARC. Proc Natl Acad Sci USA 108:E440–E449. 10.1073/pnas.1104977108 [DOI] [PMC free article] [PubMed] [Google Scholar]
- Kwinter DM, Lo K, Mafi P, Silverman MA (2009) Dynactin regulates bidirectional transport of dense-core vesicles in the axon and dendrites of cultured hippocampal neurons. Neuroscience 162:1001–1010. 10.1016/j.neuroscience.2009.05.038 [DOI] [PubMed] [Google Scholar]
- Kwon HB, Kozorovitskiy Y, Oh WJ, Peixoto RT, Akhtar N, Saulnier JL, Gu C, Sabatini BL (2012) Neuroligin-1-dependent competition regulates cortical synaptogenesis and synapse number. Nat Neurosci 15:1667–1674. 10.1038/nn.3256 [DOI] [PMC free article] [PubMed] [Google Scholar]
- Li J, Han W, Pelkey KA, Duan J, Mao X, Wang YX, Craig MT, Dong L, Petralia RS, McBain CJ, Lu W (2017) Molecular dissection of neuroligin 2 and Slitrk3 reveals an essential framework for GABAergic synapse development. Neuron 96:808–826. 10.1016/j.neuron.2017.10.003 [DOI] [PMC free article] [PubMed] [Google Scholar]
- Lively S, Brown IR (2008a) The extracellular matrix protein SC1/hevin localizes to excitatory synapses following status epilepticus in the rat lithium-pilocarpine seizure model. J Neurosci Res 86:2895–2905. 10.1002/jnr.21735 [DOI] [PubMed] [Google Scholar]
- Lively S, Brown IR (2008b) Localization of the extracellular matrix protein SC1 coincides with synaptogenesis during rat postnatal development. Neurochem Res 33:1692–1700. 10.1007/s11064-008-9606-z [DOI] [PubMed] [Google Scholar]
- Lively S, Ringuette MJ, Brown IR (2007) Localization of the extracellular matrix protein SC1 to synapses in the adult rat brain. Neurochem Res 32:65–71. 10.1007/s11064-006-9226-4 [DOI] [PubMed] [Google Scholar]
- Luo F, Sclip A, Jiang M, Südhof TC (2020) Neurexins cluster Ca2+ channels within presynaptic active zone. EMBO J 39:e103208 10.15252/embj.2019103208 [DOI] [PMC free article] [PubMed] [Google Scholar]
- Maximov A, Pang ZP, Tervo DG, Südhof TC (2007) Monitoring synaptic transmission in primary neuronal cultures using local extracellular stimulation. J Neurosci Methods 161:75–87. 10.1016/j.jneumeth.2006.10.009 [DOI] [PubMed] [Google Scholar]
- Missler M, Zhang W, Rohlmann A, Kattenstroth G, Hammer RE, Gottmann K, Südhof TC (2003) Alpha-neurexins couple Ca2+ channels to synaptic vesicle exocytosis. Nature 423:939–948. 10.1038/nature01755 [DOI] [PubMed] [Google Scholar]
- Park YK, Goda Y (2016) Integrins in synapse regulation. Nat Rev Neurosci 17:745–756. 10.1038/nrn.2016.138 [DOI] [PubMed] [Google Scholar]
- Roppongi RT, Dhume SH, Padmanabhan N, Silwal P, Zahra N, Karimi B, Bomkamp C, Patil CS, Champagne-Jorgensen K, Twilley RE, Zhang P, Jackson MF, Siddiqui TJ (2020) LRRTMs organize synapses through differential engagement of neurexin and PTPσ. Neuron 106:701–709. 10.1016/j.neuron.2020.05.003 [DOI] [PubMed] [Google Scholar]
- Sahores M, Gibb A, Salinas PC (2010) Frizzled-5, a receptor for the synaptic organizer Wnt7a, regulates activity-mediated synaptogenesis. Development 137:2215–2225. 10.1242/dev.046722 [DOI] [PMC free article] [PubMed] [Google Scholar]
- Sando R, Jiang X, Südhof TC (2019) Latrophilin GPCRs direct synapse specificity by coincident binding of FLRTs and teneurins. Science 363:eaav7969 10.1126/science.aav7969 [DOI] [PMC free article] [PubMed] [Google Scholar]
- Saunders A, Macosko EZ, Wysoker A, Goldman M, Krienen FM, de Rivera H, Bien E, Baum M, Bortolin L, Wang S, Goeva A, Nemesh J, Kamitaki N, Brumbaugh S, Kulp D, McCarroll SA (2018) A single-cell atlas of cell types, states, and other transcriptional patterns from nine regions of the adult mouse brain. Cell 174:1015–1030. 10.1016/j.cell.2018.07.028 [DOI] [PMC free article] [PubMed] [Google Scholar]
- Singh SK, Stogsdill JA, Pulimood NS, Dingsdale H, Kim YH, Pilaz LJ, Kim IH, Manhaes AC, Rodrigues WS, Pamukcu A, Enustun E, Ertuz Z, Scheiffele P, Soderling SH, Silver DL, Ji RR, Medina AE, Eroglu C (2016) Astrocytes assemble thalamocortical synapses by bridging NRX1α and NL1 via Hevin. Cell 164:183–196. 10.1016/j.cell.2015.11.034 [DOI] [PMC free article] [PubMed] [Google Scholar]
- Sterky FH, Trotter JH, Lee SJ, Recktenwald CV, Du X, Zhou B, Zhou P, Schwenk J, Fakler B, Südhof TC (2017) Carbonic anhydrase-related protein CA10 is an evolutionarily conserved pan-neurexin ligand. Proc Natl Acad Sci USA 114:E1253–E1262. 10.1073/pnas.1621321114 [DOI] [PMC free article] [PubMed] [Google Scholar]
- Südhof TC. (2017) Synaptic neurexin complexes: a molecular code for the logic of neural circuits. Cell 171:745–769. 10.1016/j.cell.2017.10.024 [DOI] [PMC free article] [PubMed] [Google Scholar]
- Südhof TC. (2018) Towards an understanding of synapse formation. Neuron 100:276–293. 10.1016/j.neuron.2018.09.040 [DOI] [PMC free article] [PubMed] [Google Scholar]
- Tabula Muris Consortium (2018) Single-cell transcriptomics of 20 mouse organs creates a Tabula Muris. Nature 562:367–372. [DOI] [PMC free article] [PubMed] [Google Scholar]
- Varoqueaux F, Aramuni G, Rawson RL, Mohrmann R, Missler M, Gottmann K, Zhang W, Südhof TC, Brose N (2006) Neuroligins determine synapse maturation and function. Neuron 51:741–754. 10.1016/j.neuron.2006.09.003 [DOI] [PubMed] [Google Scholar]
- Wang R, Dong JX, Wang L, Dong XY, Anenberg E, Jiang PF, Zeng LH, Xie YC (2019) A negative regulator of synaptic development: MDGA and its links to neurodevelopmental disorders. World J Pediatr 15:415–421. 10.1007/s12519-019-00253-3 [DOI] [PubMed] [Google Scholar]
- Weaver MS, Workman G, Cardo-Vila M, Arap W, Pasqualini R, Sage EH (2010) Processing of the matricellular protein hevin in mouse brain is dependent on ADAMTS4. J Biol Chem 285:5868–5877. 10.1074/jbc.M109.070318 [DOI] [PMC free article] [PubMed] [Google Scholar]
- Wu X, Morishita WK, Riley AM, Hale WD, Südhof TC, Malenka RC (2019) Neuroligin-1 signaling controls LTP and NMDA receptors by distinct molecular pathways. Neuron 102:621–635. 10.1016/j.neuron.2019.02.013 [DOI] [PMC free article] [PubMed] [Google Scholar]
- Yuzaki M. (2018) Two classes of secreted synaptic organizers in the central nervous system. Annu Rev Physiol 80:243–262. 10.1146/annurev-physiol-021317-121322 [DOI] [PubMed] [Google Scholar]
- Zeisel A, Hochgerner H, Lönnerberg P, Johnsson A, Memic F, van der Zwan J, Häring M, Braun E, Borm LE, La Manno G, Codeluppi S, Furlan A, Lee K, Skene N, Harris KD, Hjerling-Leffler J, Arenas E, Ernfors P, Marklund U, Linnarsson S (2018) Molecular architecture of the mouse nervous system. Cell 174:999–1014. 10.1016/j.cell.2018.06.021 [DOI] [PMC free article] [PubMed] [Google Scholar]
- Zhang Y, Pak C, Han Y, Ahlenius H, Zhang Z, Chanda S, Marro S, Patzke C, Acuna C, Covy J, Xu W, Yang N, Danko T, Chen L, Wernig M, Südhof TC (2013) Rapid single-step induction of functional neurons from human pluripotent stem cells. Neuron 78:785–798. 10.1016/j.neuron.2013.05.029 [DOI] [PMC free article] [PubMed] [Google Scholar]
- Zhao SJ, Jiang YQ, Xu NW, Li Q, Zhang Q, Wang SY, Li J, Wang YH, Zhang YL, Jiang SH, Wang YJ, Huang YJ, Zhang XX, Tian GA, Zhang CC, Lv YY, Dai M, Liu F, Zhang R, Zhou D, et al. (2018) SPARCL1 suppresses osteosarcoma metastasis and recruits macrophages by activation of canonical WNT/β-catenin signaling through stabilization of the WNT-receptor complex. Oncogene 37:1049–1061. 10.1038/onc.2017.403 [DOI] [PMC free article] [PubMed] [Google Scholar]
Associated Data
This section collects any data citations, data availability statements, or supplementary materials included in this article.
Supplementary Materials
Complete statistical analyses for “Figure 1: Endogenous SPARCL1 is secreted at low levels by cultured mouse glia but is abundant in mouse serum” (1B) Most cortical SPARCL1 mRNA is expressed by glia. RT-PCR was performed on total RNA isolated from glia cultured alone or from glia cocultured with cortical neurons at DIV14. SPARCL1 band intensities are normalized to β-actin band intensities within multiplexed RT-PCRs. Primary data comprise means ± SEM; 3 independent cultures were analyzed. Statistical significance was evaluated by an unpaired t test.(1C) Endogenous SPARCL1 protein is secreted at low levels in primary cortical cultures. Cortical glia were cultured alone (G) or with cortical neurons (N + G) for DIV14. Full-length SPARCL1 protein expression was detected by immunoblot and quantified. Primary data comprise means ± SEM; 3 independent cultures were analyzed. Statistical significance was evaluated by a one-way ANOVA with Tukey's post hoc test of multiple comparisons. (1D) Comparison of recombinant and endogenous SPARCL1 protein levels. Full-length SPARCL1 protein expression was detected by immunoblot and quantified. Primary data comprise means ± SEM; 3 independent cultures were analyzed. Statistical significance was evaluated by a one-way ANOVA with Tukey's post hoc test of multiple comparisons. Test parameters highlighted in blue were used to determine statistical significance and are summarized in Table 1. p values and significance levels for individual comparisons between specific groups are highlighted in yellow. Download Figure 1-1, XLSX file (13.3KB, xlsx) .
Complete statistical analyses for “Figure 2: Recombinant SPARCL1 selectively boosts excitatory but not inhibitory synapse numbers in primary cultures of cortical neurons and glia” (2C): Quantifications showing that recombinant SPARCL1 increases the density but not the size of excitatory synapses. Primary data comprise means ± SEM; 29 cells from 3 independent cultures were analyzed. Statistical significance was evaluated by an unpaired t test. (2E): Quantifications showing that recombinant SPARCL1 does not alter the density nor size of inhibitory synapses. Primary data comprise means ± SEM; 29 cells from 3 independent cultures were analyzed. Statistical significance was evaluated by an unpaired t test. (2G-I) Quantifications showing that recombinant SPARCL1 does not alter the neuronal cell density (G), number of primary dendrites, and dendritic branches (H), or soma size of neurons (I). Primary data comprise means ± SEM; 21 cells from 3 independent cultures were analyzed. Statistical significance was evaluated by an unpaired t test. (2J) SPARCL1 has no significant effect on capacitance and input resistance. Primary data comprise means ± SEM; 21 cells from 3 independent cultures were analyzed. Statistical significance was evaluated by an unpaired t test. Test parameters highlighted in blue were used to determine statistical significance and are summarized in Table 1. p values and significance levels for individual comparisons between specific groups are highlighted in yellow. Download Figure 2-1, XLSX file (19.8KB, xlsx) .
Complete statistical analyses for “Figure 3: Cre-recombinase expression substantially reduces neurexin and neuroligin protein expression in cKO neurons” (3B) Analysis of neurexin protein expression in primary cortical neurons from Nrxn123 cKO mice. Immunoblots were performed on lysates from cortical cultures infected with lentiviral ΔCre or Cre. The neurexin signals were normalized to corresponding β-actin signals for quantification. Primary data comprise means ± SEM; 3 independent cultures were analyzed. Statistical significance was evaluated by an unpaired t test. (3C) Analysis of neuroligin protein expression in primary cortical neurons from Nlgn1234 cKO mice. Immunoblots were performed on lysates from cortical cultures infected with lentiviral ΔCre or Cre. The neuroligin signals were normalized to corresponding β-actin signals for quantification. Primary data comprise means ± SEM; 3 independent cultures were analyzed. Statistical significance was evaluated by an unpaired t test. Test parameters highlighted in blue were used to determine statistical significance and are summarized in Table 1. p values and significance levels for individual comparisons between specific groups are highlighted in yellow. Download Figure 3-1, XLSX file (11.9KB, xlsx) .
Complete statistical analyses for “Figure 4: Deletion of neurexins in dissociated cultures of mouse neurons and glia neither decreases excitatory or inhibitory synapse numbers nor impairs the increase in excitatory synapse numbers produced by recombinant SPARCL1” (4B-C) Quantifications showing that recombinant SPARCL1 increases the density of excitatory synapses (B) but not inhibitory synapses (C) in control and Nrxn123 cKO neurons. SPARCL1 did not affect the size and staining intensity of excitatory and inhibitory synapses. Primary data comprise means ± SEM; 24 cells from 3 independent cultures were analyzed. Statistical significances were evaluated by one-way ANOVAs with Tukey's post hoc tests of multiple comparisons. Test parameters highlighted in blue were used to determine statistical significance and are summarized in Table 1. p values and significance levels for individual comparisons between specific groups are highlighted in yellow. Download Figure 4-1, XLSX file (19.3KB, xlsx) .
Complete statistical analyses for “Figure 5: Recombinant SPARCL1 increases spontaneous excitatory but not inhibitory synaptic transmission independent of neurexins” (5A) SPARCL1 increases mEPSC frequency but not amplitude independent of neurexins. Nrxn123, control (ΔCre), and cKO (Cre) neurons were treated at DIV13 with control medium or recombinant SPARCL1. Spontaneous excitatory synaptic activity was assessed at DIV14 by mEPSC recordings in the presence of TTX and PTX. Primary data comprise means ± SEM; 18 cells from 3 independent cultures were analyzed. Statistical significance was evaluated by a one-way ANOVA with Tukey's post hoc test of multiple comparisons. (5B) SPARCL1 does not affect spontaneous inhibitory synaptic activity. Nrxn123 control and cKO neurons were treated at DIV13 with control medium or recombinant SPARCL1. Spontaneous inhibitory synaptic activity was assessed at DIV14 by mIPSC recordings in the presence of TTX, CNQX and D-AP5. Primary data comprise means ± SEM; 17 cells from 3 independent cultures were analyzed. Statistical significance was evaluated by a one-way ANOVA with Tukey's post hoc test of multiple comparisons. Test parameters highlighted in blue were used to determine statistical significance and are summarized in Table 1. p values and significance levels for individual comparisons between specific groups are highlighted in yellow. Download Figure 5-1, XLSX file (16.8KB, xlsx) .
Complete statistical analyses for “Figure 6: Deletion of neuroligins does not significantly decrease synapse numbers and does not block excitatory synaptogenesis induced by recombinant SPARCL1” (6B-C) Quantifications showing that recombinant SPARCL1 increases the density of excitatory synapses but not inhibitory synapses in control and Nlgn1234 cKO neurons. SPARCL1 did not substantially affect the size and staining intensity of excitatory and inhibitory synapses. Primary data comprise means ± SEM; 24 cells from 3 independent cultures were analyzed. Statistical significances were evaluated by one-way ANOVAs with Tukey's post hoc tests of multiple comparisons. Test parameters highlighted in blue were used to determine statistical significance and are summarized in Table 1. p values and significance levels for individual comparisons between specific groups are highlighted in yellow. Download Figure 6-1, XLSX file (18.9KB, xlsx) .
Complete statistical analyses for “Figure 7: Recombinant SPARCL1 increases spontaneous excitatory but not inhibitory synaptic transmission independent of neuroligins” (7A) Deletion of all neuroligins significantly reduces mEPSC frequency and amplitude but does not prevent SPARCL1 from increasing mEPSC frequency. Nlgn1234, control (ΔCre), and cKO (Cre) neurons were treated at DIV13 with control medium or recombinant SPARCL1. Spontaneous excitatory synaptic activity was assessed at DIV14 by mEPSC recordings in the presence of TTX and PTX. Primary data comprise means ± SEM; 18 cells from 3 independent cultures were analyzed. Statistical significance was evaluated by a one-way ANOVA with Tukey's post hoc test of multiple comparisons. (7B) Deletion of all neuroligins significantly reduces mIPSC frequency and amplitude, which are unaltered by SPARCL1. Nlgn1234 control and cKO neurons were treated at DIV13 with control medium or recombinant SPARCL1. Spontaneous inhibitory synaptic activity was assessed at DIV14 by mIPSC recordings in the presence of TTX, CNQX and D-AP5. Primary data comprise means ± SEM; 18 cells from 3 independent cultures were analyzed. Statistical significance was evaluated by a one-way ANOVA with Tukey's post hoc test of multiple comparisons. Test parameters highlighted in blue were used to determine statistical significance and are summarized in Table 1. p values and significance levels for individual comparisons between specific groups are highlighted in yellow. Download Figure 7-1, XLSX file (18.2KB, xlsx) .
Complete statistical analyses for “Figure 8: SPARCL1 selectively enhances evoked neurotransmission and increases NMDAR-mediated synaptic responses independent of neuroligins” (8B) Deletion of all neuroligins reduces the amplitudes of evoked AMPAR- and NMDAR-EPSCs. Treatment with recombinant SPARCL1 increases these parameters and particularly enhances the NMDAR/AMPAR ratio independent of neuroligins. Quantifications of evoked AMPAR-EPSC amplitude, NMDAR-EPSC amplitude, and NMDAR/AMPAR ratio. NMDAR current amplitudes were measured 50 ms after stimulation. Primary data comprise means ± SEM; 24 cells from 3 independent cultures were analyzed. Statistical significance was evaluated by a one-way ANOVA with Tukey's post hoc test of multiple comparisons. (8C) Deletion of all neuroligins reduces the amplitudes of evoked GABAR-IPSCs, whereas addition of SPARCL1 does not alter these currents. Quantifications of evoked GABAR-IPSC amplitude. Primary data comprise means ± SEM; 27 cells from 3 independent cultures were analyzed. Statistical significance was evaluated by a one-way ANOVA with Tukey's post hoc test of multiple comparisons. Test parameters highlighted in blue were used to determine statistical significance and are summarized in Table 1. p values and significance levels for individual comparisons between specific groups are highlighted in yellow. Download Figure 8-1, XLSX file (16.8KB, xlsx) .