Abstract
Avian infectious bronchitis virus is one of the most important gammacoronaviruses, which causes a highly contagious disease. In this study, we investigated changes in the proteome of kidney tissue of specific-pathogen-free (SPF) chickens that were infected with an isolate of the nephrotropic variant 2 genotype (IS/1494/06) of avian coronavirus. Twenty 1-day-old SPF White Leghorn chickens were randomly divided into two groups, each comprising 10 chickens, which were kept in separate positive-pressure isolators. Chickens in group A served as a virus-free control group up to the end of the experiment, whereas chickens in group B were inoculated with 0.1 ml of 104.5 EID50 of the IBV/chicken/Iran/UTIVO-C/2014 isolate of IBV, and kidney tissue samples were collected at 2 and 7 days post-inoculation (dpi) from both groups. Sequencing of five protein spots at 2 dpi and 22 spots at 7 dpi that showed differential expression by two-dimensional electrophoresis (2DE) along with fold change greater than 2 was done by MS-MALDI/TOF/TOF. Furthermore, the corresponding protein-protein interaction (PPI) networks at 2 and 7 dpi were identified to develop a detailed understanding of the mechanism of molecular pathogenesis. Topological graph analysis of this undirected PPI network revealed the effect of 10 genes in the 2 dpi PPI network and nine genes in the 7 dpi PPI network during virus pathogenesis. Proteins that were found by 2DE analysis and MS/TOF-TOF mass spectrometry to be down- or upregulated were subjected to PPI network analysis to identify interactions with other cellular components. The results show that cellular metabolism was altered due to viral infection. Additionally, multifunctional heat shock proteins with a significant role in host cell survival may be employed circuitously by the virus to reach its target. The data from this study suggest that the process of pathogenesis that occurs during avian coronavirus infection involves the regulation of vital cellular processes and the gradual disruption of critical cellular functions.
Electronic supplementary material
The online version of this article (10.1007/s00705-020-04845-7) contains supplementary material, which is available to authorized users.
Introduction
Avian infectious bronchitis virus (IBV) is the most important gammacoronavirus, which can cause a highly contagious disease of the upper respiratory tract, reproductive tract, and urinary system in chickens. IBV is an enveloped virus belonging to the order Nidovirales, family Coronaviridae, subfamily Coronavirinae, genus Gammacoronavirus, and species Avian coronavirus. IBV infection leads to high morbidity and variable mortality, depending on stress, age, virus strain, and host immunity [1].
Different genotypes of IBV have emerged due to the large RNA size of the genome and its unique mechanism of replication involving multiple nested sets of subgenomic mRNAs [2, 3]. The high mutation and recombination rates of IBV and the absence of cross-protection in most cases have made controlling the disease problematic. Studies of the virus's replication strategy, affect on the transcriptional and translational patterns of infected host cells, and pathogenicity can be helpful in combating the virus and enhancing the immune system's defense mechanisms.
Analysis of such interactions between the host and invading viruses requires a broad spectrum of efficient methods to overcome the challenges arising during the study of the molecular pathogenesis of IBV. Proteomics technologies are used to reveal cellular changes at the protein level. Recently, wide usage of proteomic approaches has been applied to investigate virus-host interactions [4–9]. Some studies have investigated proteome changes in cells infected with different strains of IBV [10–12]. Up to now, published research has been carried out on IBV strains such as H120 and IBV CK/CH/LDL/97I, but no studies have investigated proteome changes following infection with a variant 2 genotype [10, 13]. The nephropathogenicity of the variant 2 genotype isolate IS/1494/06 has been demonstrated [14].
IS/1494/06 is one of the most prevalent IBV strains in poultry flocks in many countries, especially in the Middle East region, [14–16]. The purpose of this study was to acquire knowledge about the proteome of the kidney tissue of specific-pathogen-free (SPF) chickens infected with a local isolate of a nephrotropic variant 2 genotype (IS/1494/06). To obtain a snapshot of the situation in infected cells at a specific time point, we use a combination of two-dimensional gel electrophoresis (2DE) and MALDI/TOF-TOF mass spectrometry. The aim was to find out how disease is initiated and to identify a protein–protein interaction network that might help to explain the complexities of IBV infection.
Materials and methods
Ethics statement
This study was carried out according to the ethical guidelines of the Iranian Ministry of Health.
Experimental design
Twenty 1-day-old SPF White Leghorn chickens were provided by Razi Vaccine and Serum Research Institute (Iran, Karaj). The chickens were divided randomly into two groups. Each group consisted of 10 SPF chickens that were kept in a separate positive-pressure SPF chicken isolator for 22 days. Group A was the control group, and the chickens in group B were inoculated with 0.1 ml of 104.5 EID50 of the isolate IBV/chicken/Iran/UTIVO-C/2014 (KR869776) via the oculonasal route at the age of 14 days [14]. Group A (control) received 0.1 ml of PBS via the same route. Kidney tissue samples were then collected on days 2 and 7 post-inoculation (dpi).
Histopathological examination
Histopathological examination of the collected kidney tissue samples of both groups, after fixation in phosphate-buffered 10% formalin, was done using hematoxylin & eosin (HE) staining.
RNA extraction
RNA was extracted from collected tissue samples using a High Pure RNA Tissue Kit (Roche, Germany, catalog no. 12033674001) according to the manufacturer’s protocol.
Real-time RT-PCR
Real-time PCR was used to amplify a conserved sequence of the IBV genome within the 5'-untranslated region (UTR). The antisense primer IBV5'GU391 (5'-GCT TTT GAG CCT AGC GTT-3') and the sense primer IBV5'GL533 (5'-GCC ATG TTG TCA CTG TCT ATT G-3') with the corresponding TaqMan dual-labeled probe FAM IBV5'G BHQ1 (5'-CAC CAC CAG AAC CTG TCA CCT C-3') were used. The real-time PCR reaction mix contained 3.25 μl of nuclease-free water, 12.5 μl of 2X RT-PCR master mix (QuantiTect Multiplex RT-PCR Kit, QIAGEN, Germany, catalog no. 204643), 0.25 μl of enzyme mix (QuantiTect Multiplex RT-PCR Kit, QIAGEN, Germany), 5 μl of template RNA, 0.75 μl of each primer at a final concentration of 10 μM, and 2.5 μl of probe at a final concentration of 0.1 μM. The PCR cycling parameters were as follows: 50 °C for 20 min and 95 °C for 15 min, followed by 40 cycles of 94 °C for 45 s and 60 °C for 45 s.
Protein extraction and 2DE analysis
Protein was extracted from kidney tissue using a Ready-Prep Protein Extraction Kit (Bio-Rad, 1632086), and for the estimation of the protein concentration, a 2-D Quant Kit (GE Healthcare, 80-6483-56) was employed. Subsequently, extracts were loaded onto 7 cm IPG strips (Isoelectric Point (pI) 3-10) at first dimension and afterward, SDS-PAGE as the second dimension was carried out. To control bias and to reduce biological variation between samples, every three samples of a group were combined, and three repeats of 2-DE were performed under identical conditions. Universal detection of proteins on 2-DE gels was performed by staining the gels with the anionic dye Coomassie blue R-350 to visualize protein spots after 2-DE separation. Images were analyzed using Progenesis Same-Spots software. Protein spots that showed more than a twofold change were selected and were sent for mass spectrometry analysis.
Protein spot identification by MS
Proteins in excised gel pieces were sequenced by MALDI-TOF/TOF mass spectrometry. MS data were analyzed by comparison against the Uniprot database, using Mascot. Before the search was started, boundaries were set out as follows: trypsin as digesting enzyme with maximum missed cleavage of 1 position, carbamidomethyl (c) as a fixed modification, deamidation (NQ) and oxidation (M) as variable modifications, peptide mass tolerance set at ± 100 ppm, fragment mass tolerance set at ± 0.5 Da. The search was done for all taxonomy by MudPIT, scoring with the significance level set at a 95% confidence interval (p < 0.05). Protein hits for “Gallus” were selected. If there were no hits for a “Gallus” species, even after the NCBI BLAST search, the highest score for the other species was selected instead.
Protein-protein interaction network and bioinformatics
The related protein-protein interaction (PPI) networks of candidate proteins listed in Table 1 were derived from the latest version of the String database (https://string-db.org, V: 10.5). Cytoscape (version 3.5.1) was used to construct PPI networks of identified proteins separately at 2 and 7 dpi, and their interactions were identified with up to 100 neighbors with high confidence (0.7) to construct these networks [17]. To identify the function and class of each protein, Gene Ontology Consortium (https://geneontology.org), Agbase (https://www.agbase.msstate.edu), and the Cytoscape application BiNGO (https://www.psb.ugent.be/cbd/papers/BiNGO/Home.html), were used with Uniprot ID to obtain annotations [18, 19].
Table 1.
Identities of protein spots with differential expression observed by 2DE analysis and sequencing by MS-MALDI/TOF/TOF
| UniProt ID | Name | Accession no | Protein score | Nominal Mass | Calculated pI | Peptide count | Coverage (%) | dpi1 | Fold change |
|---|---|---|---|---|---|---|---|---|---|
| P01994 | Hemoglobin subunit alpha-A | gi|52138655|NP_001004376.1 | 96 | 15533 | 8.54 | 142 | 10 | 2 | -5 |
| P19352 | Tropomyosin beta chain | gi|971437473|XP_015132749.1 | 439 | 32871 | 4.69 | 284 | 20 | 2 | +2.1 |
| Q9PU45 | Radixin | gi|45382077|NP_990082.1 | 63 | 68555 | 6.1 | 577 | 1 | 2 | -4.4 |
| P09102 | Protein disulfide-isomerase | gi|30923135|P09102.3 | 245 | 57773 | 4.69 | 515 | 8 | 2 | -4.4 |
| Q5ZKA5 | Bifunctional methylenetetrahydrofolate dehydrogenase/cyclohydrolase, mitochondrial | gi|71897117|NP_001026531.1 | 47 | 31392 | 5.75 | 298 | 2 | 2 | +2.1 |
| P08250 | Apolipoprotein A-I | gi|45382961|NP_990856.1 | 329 | 30661 | 5.58 | 264 | 17 | 7 | +8.4 |
| P0CB50 | Peroxiredoxin-1 | gi|429836849|NP_001258861.1 | 306 | 22529 | 8.24 | 199 | 21 | 7 | -4.1 |
| P24367 | Peptidyl-prolyl cis-trans isomerase B | gi|45382027|NP_990792.1 | 208 | 22456 | 9.4 | 207 | 14 | 7 | -3.2 |
| P01994 | Hemoglobin subunit alpha-A | gi|52138655|NP_001004376.1 | 108 | 15533 | 8.54 | 142 | 10 | 7 | -5 |
| P19121 | Serum albumin | gi|766944282|NP_990592.2 | 259 | 71868 | 5.51 | 615 | 6 | 7 | +7.6 |
| Q9I923 | Regucalcin | gi|45382019|NP_990060.1 | 667 | 33665 | 5.77 | 299 | 30 | 7 | +7.5 |
| P07630 | Carbonic anhydrase 2 | gi|46048696|NP_990648.1 | 121 | 29388 | 6.56 | 260 | 10 | 7 | -4.1 |
| Q5ZK84 | Alcohol dehydrogenase [NADP(+)] | gi|57529654|NP_001006539.1 | 131 | 37338 | 7.66 | 327 | 7 | 7 | -2.1 |
| Q5ZL72 | 60 kDa heat shock protein, mitochondrial | gi|61098372|NP_001012934.1 | 382 | 61105 | 5.72 | 573 | 8 | 7 | -2.4 |
| Q99JY0 | 3-ketoacyl-CoA thiolase, peroxisomal | NP_001184217.1 | 60 | 51639 | 9.43 | 475 | 1 | 7 | +3.4 |
| P11501 | Heat shock protein HSP 90-alpha | gi|157954047|NP_001103255.1 | 524 | 84406 | 5.01 | 728 | 11 | 7 | -4.4 |
| P08110 | Endoplasmin precursor | gi|45383562|NP_989620.1 | 381 | 91726 | 4.83 | 795 | 7 | 7 | -5.4 |
| O42388 | Ubiquitin-60S ribosomal protein L40 | gi|47604954|NP_990406.1 | 258 | 14740 | 9.87 | 128 | 26 | 7 | -4.3 |
| Q5ZLB3 | Heterogeneous nuclear ribonucleoprotein A1 | gi|971825931|NP_001305347.1 | 297 | 38167 | 9.39 | 320 | 15 | 7 | -4.4 |
| A0A1D5P198 | Tubulin alpha-1B chain | gi|971437052|XP_015155803.1 | 238 | 50152 | 4.94 | 451 | 9 | 7 | +4.4 |
| Q90835 | Elongation factor 1-alpha 1 | gi|1009287609|NP_001308445.1 | 112 | 50157 | 9.1 | 462 | 4 | 7 | -3.7 |
| P02001 | Hemoglobin subunit alpha-D | gi|52138645|NP_001004375.1 | 172 | 15742 | 7.01 | 141 | 21 | 7 | -4.3 |
| Q5ZME1 | Heterogeneous nuclear ribonucleoproteins A2/B | gi|71896753|NP_001026156.1 | 325 | 3604 | 8.67 | 341 | 18 | 7 | -4.4 |
| P31790 | Retrovirus-related Gag polyprotein | gi|399521|P31790.1 | 46 | 28877 | 8.45 | 255 | 3 | 7 | -3.7 |
| Q5ZLC5 | ATP synthase subunit beta, mitochondrial | gi|448261627|NP_001026562.2 | 104 | 56650 | 5.59 | 533 | 5 | 7 | +4.4 |
| P09653 | Tubulin beta-5 chain | gi|71896411|NP_001026183.1 | 121 | 49979 | 4.77 | 446 | 4 | 7 | +4.4 |
| Q8UVX3 | ATP synthase subunit alpha, mitochondrial | gi|45383566|NP_989617.1 | 72 | 60186 | 9.29 | 507 | 2 | 7 | -2.5 |
1PI: Days post infection
Gene expression qPCR
A two-step gene expression quantification experiment was done to measure the expression of selected genes. Total RNA extracted from the samples was used with a random hexamer primer to synthesize cDNA. The first step was to maximize primer-RNA template binding by incubation of 1 μl of random hexamer with a 10-μl sample of total RNA at 60 °C for 10 min. Then, a reaction mixture containing 3 μl of nuclease-free water, 4 μl of 10X RT-PCR buffer, 1 μl of dNTP, and 1 μl reverse transcriptase (Roche catalog no. 11062603001) was added to the first mixture and incubated at 48 °C for 60 min, and then 95 °C for 10 min. Next, a real-time PCR reaction was done in a volume of 25 μl. The reaction mixture contained 5 μl of cDNA, 12.5 μl of Real-Q Plus 2x Master Mix Green (Ampliqon, Denmark, catalog no. A315402), 1 μl of each primer (10 μM), and 5.5 μl of nuclease-free water.
A Rotor-Gene Q Cycler (QIAGEN, Hilden, Germany) was used to perform a three-step cycling program with melt curve analysis, as follows: 95 °C for 10 min, then 40 cycles of 94 °C for 15 s, 52 °C for 30 s, and 72 °C for 30 s, followed by a green color reaction. Finally, a melt curve was made as follows: ramp from 55 °C to 95 °C increments 1 °C rise and a 5-s wait at each step [20]. 28S ribosomal RNA was used as a reference gene (Forward primer: 28S F, 5'-GGCGAAGCCAGAGGAAACT-3. Reverse primer: 28S R, 5'-GACGACCGATTTGCACGTC-3'. Probe: FAM-AGGACCGCTACGGACCTCCACCATAMRA) [14].
Results
Histopathological examination
To confirm microscopic histopathological lesions and changes due to virus infection, H&E-stained kidney tissue of both groups was examined. Pathological findings at 2 dpi showed nonspecific changes such as mild hyperemia, while at 7 dpi, multifocal infiltration of heterophils predominantly along with hyperemia in the interstitial tissue, was seen (Fig. 1).
Fig. 1.
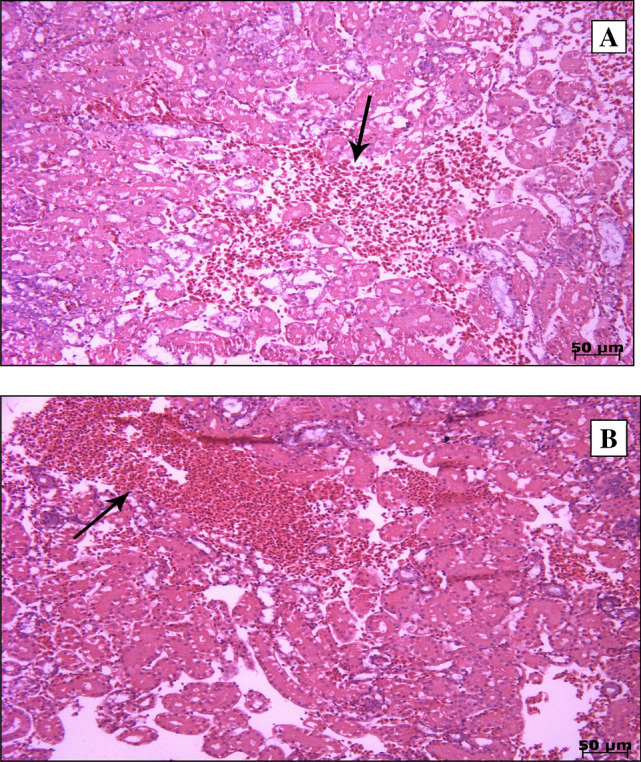
Haematoxylin and eosin (H&E) staining of 2 dpi (A) and 7 dpi (B) samples. Microscopic changes were observed in kidney tissue samples of the IS/1494/06-infected group of SPF chickens, including (A) mild hyperemia and (B) multifocal infiltration of heterophils along with hyperemia in the interstitial tissue
Confirmation of infection and viral load
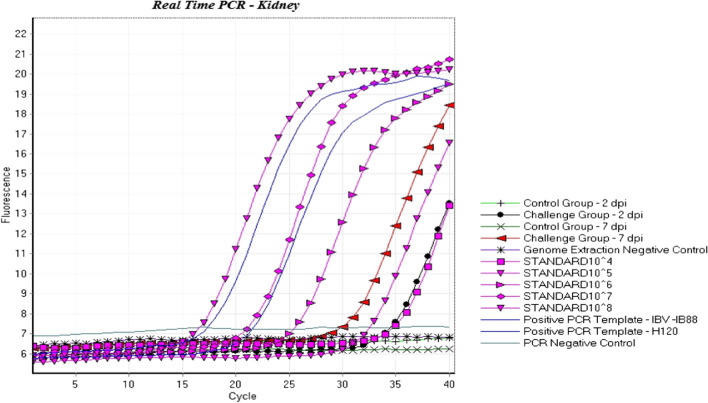
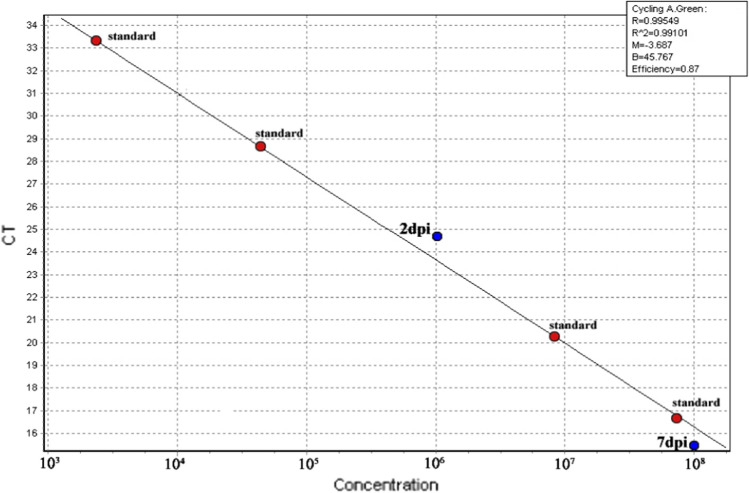
RT-qPCR was used to confirm viral infection in the challenged group and the lack of infection in the control group up to the end of the experiment. The RNA was subjected to RT-PCR using the IBV 5'-UTR primers and 28S rRNA as an internal control [14]. The results showed viral infection of the kidney of all chickens in the infected group at 2 and 7 dpi, while the control group remained negative (Figs. 2 and 3).
Fig. 2.
Detection of IS/1494/06 in kidney tissue samples and determination of the viral load by real-time RT-PCR of a conserved sequence of the IBV genome. The control group remained uninfected up to the end of the experiment, and the infection of challenge group was confirmed by real-time RT-PCR.  , 2 dpi control group;
  , 2 dpi infected group;
  , 7 dpi control group;
  , 7 dpi infected group;
  , negative RT-PCR standard;
  , standard 104;
  , standard 105;
  , standard 106;
  , standard 107;
  , standard 108;
  , positive RT-PCR standard
Fig. 3.
Standard curve of viral load determined by real-time RT-PCR. As expected, the viral load increased from 2 to 7 dpi, showing the normal progression of virus propagation
2DE
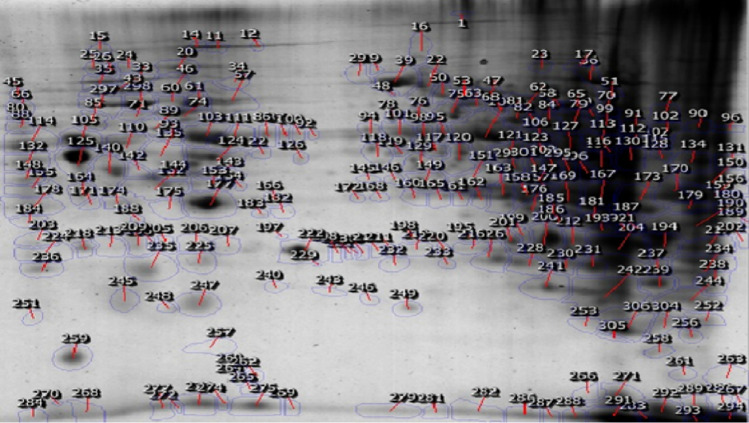
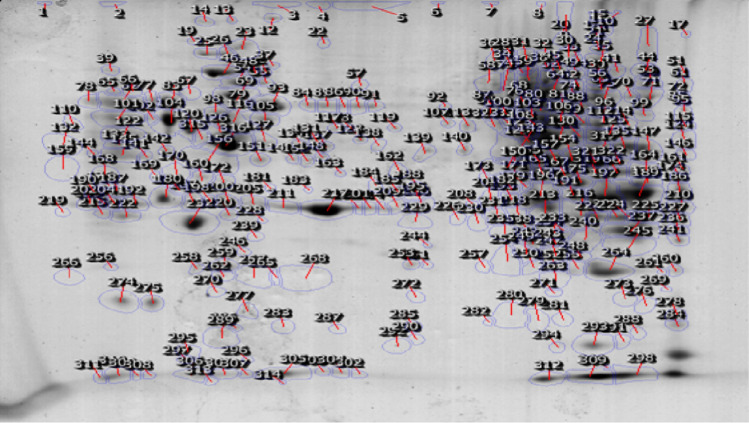
Changes in protein expression levels were detected by analysis of 2DE gel images using Progenesis Same-Spots software. Statistical analysis was carried out using all quality-control parameters. The analysis showed that 294 and 326 normalized spots were detected in the 2DE gel at 2 and 7 dpi, respectively, and protein spots with a P-value less than 0.05 and a fold change greater than 2 were considered significantly changed (Figs. 4 and 5). Five proteins in the 2 dpi samples and 22 proteins in the 7 dpi samples exhibited the most significant change in quantity in the 2DE analysis in comparison with their corresponding spots of the control groups.
Fig. 4.
Aligned 2DE images of extracted proteins from the control and infected groups at 2 dpi using Progenesis Same-Spots software to detect differentially expressed proteins. Extracted proteins loaded on 7-cm IPG strips (pI 3-10) for the first dimension, and afterwards, SDS-PAGE was carried out as the second dimension. Proteins were stained using the anionic dye Coomassie blue R-350. Protein spots that showed a fold change > 2 were selected
Fig. 5.
Aligned 2DE images of extracted proteins from the control and infected groups at 7 dpi using Progenesis Same-Spots software to detect differentially expressed proteins
Mass spectrometry and topological analysis of the PPI network
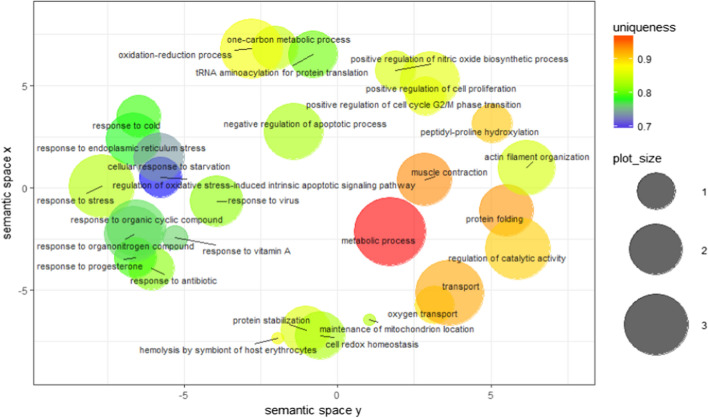
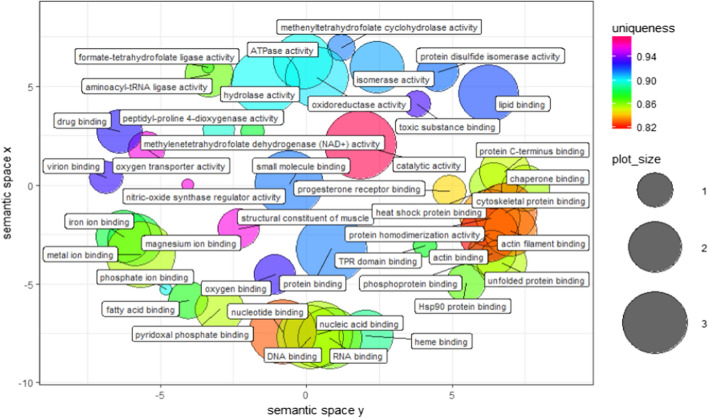
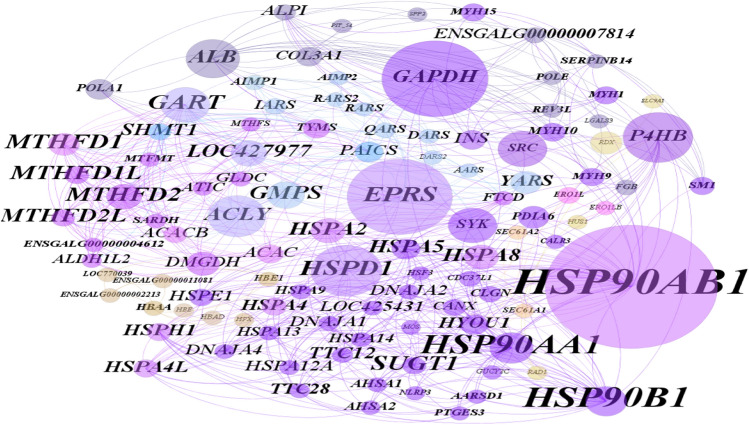
Table 1 shows the identities of the protein spots with differential expression revealed by 2DE analysis and sequencing by MS-MALDI/TOF/TOF. It is apparent from this table that the proteins showing a fold change greater than 2 at 2 dpi were mainly classified in the categories transfer/carrier protein, actin-binding motor protein, dehydrogenase hydrolase, RNA binding protein, aminoacyl-tRNA synthesis and Hsp90 family chaperone. The biological processes and molecular functions of these proteins are listed in Fig. 6 and 7. Some notable biological process findings are negative regulation of the apoptotic process, response to stress, response to endoplasmic reticulum stress, response to the virus, protein folding, cellular response to starvation, cell redox homeostasis, oxygen transport, and beta-actin filament organization (Fig. 6). In contrast, GO terms such as chaperone binding, Hsp90 protein binding, ATPase activity, hydrolase activity, RNA binding, oxidoreductase activity, methylenetetrahydrofolate dehydrogenase (NAD+) activity, lipid binding, oxygen transport, iron ion binding, and metal ion binding are prominent points of molecular function in Fig. 7. The corresponding PPI network at 2 dpi was constructed to investigate the molecular pathogenesis of the virus (Fig. 8). Topological graph analysis of this undirected PPI network reveals two connected components and six communities, consisting of 108 vertices and 628 edges. As shown in Table 2, the hub-bottleneck vertices of this network are Hsp90AB1, EPRS, HspD1, and GART, whereas the proposed non-hub-bottleneck nodes consist of GAPDH, P4HB, ACLY, ALB, SRC, and SYK. Finally, the hub–non-bottleneck nodes are Hsp90B1, Hsp90AA1, SUGT1, MTHFD1, MTHFD2, and MTHFD1L [21, 22]. The highest stress scores of Hsp90AB1, GAPDH, EPRS, and HspD1 stand out in Table 1. Surprisingly, three hub-bottleneck vertices are also ranked in the top 10 highest closeness scores (Hsp90AB1, EPRS, and HspD1; Table 2). Further analysis of the network showed the two largest cliques with ten members, as follows:
Fig. 6.
Biological processes of 2 dpi samples. Semantic similarity-based scatter-plot of differentially expressed protein spots from kidney samples at 2 dpi. The allowed similarity was adjusted to 0.7, and simRel was selected as the similarity measure. Size indicates the frequency of the GO term in the underlying GOA database (bubbles of more general terms are larger)
Fig. 7.
Molecular functions of 2 dpi samples. Semantic similarity-based scatter-plot of differentially expressed protein spots from kidney samples at 2 dpi based on their functional annotations. The allowed similarity was adjusted to 0.7, and simRel was selected as the similarity measure. Size indicates the frequency of the GO term in the underlying GOA database (bubbles of more general terms are larger)
Fig. 8.
Interaction network of differentially expressed proteins at 2 dpi (high confidence < 0.7). The size of the circle shows the importance of the node in relation to its neighbors. Table 2 shows the centralities of important nodes. This is an undirected graph. Differences in the color of circles show that the proteins belong to different components of the graph
Table 2.
Topological centrality analysis of the proposed PPI network for 2 dpi samples
| Hubs | Hub degree | Betweenness | Bt. score | Stress | Stress score | Closeness | Closeness score |
|---|---|---|---|---|---|---|---|
| HSP90AB1 | 45 | HSP90AB1 | 1250.8284158 | HSP90AB1 | 17008 | HSP90AB1 | 0.005988 |
| HSP90B1 | 35 | GAPDH | 710.3136824 | GAPDH | 13498 | HSPD1 | 0.0054054 |
| HSP90AA1 | 33 | EPRS | 701.9207744 | EPRS | 13448 | GAPDH | 0.0051546 |
| EPRS | 24 | HSPD1 | 422.3051613 | HSPD1 | 11240 | HSPA2 | 0.0051282 |
| HSPD1 | 24 | P4HB | 412.6733823 | GART | 5668 | HSPA8 | 0.0051282 |
| SUGT1 | 23 | ACLY | 313.7475918 | ACLY | 5508 | HSP90AA1 | 0.0050761 |
| GART | 23 | ALB | 282.1188723 | P4HB | 5244 | EPRS | 0.0050761 |
| MTHFD1 | 23 | SRC | 244.8398824 | SYK | 4892 | SYK | 0.0049261 |
| MTHFD2 | 22 | GART | 241.8886972 | ALB | 4834 | HSPA5 | 0.0048544 |
| MTHFD1L | 22 | SYK | 239.2131254 | GMPS | 4348 | HSP90B1 | 0.0048309 |
Clique 1: GMPS, MTHFD1, ACLY, MTHFD1L, MTHFD2, MTHFD2L, ATIC, LOC427977, ACACB, and GART.
Clique 2: MTHFD1, ACLY, MTHFD1L, MTHFD2, MTHFD2L, SHMT1, GLDC, DMGDH, GART, and ALDH1L2.
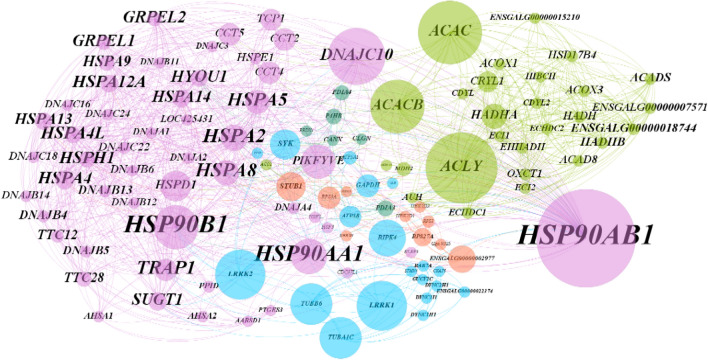
The identification spots at 7 dpi resulted in 22 proteins, which are shown in Table 1. Most of the highlighted biological processes at 7 dpi are the regulation of catalytic activity, oxidation-reduction process, transport, viral process, negative regulation of the apoptotic process, protein folding, mRNA splicing via spliceosome, response to the virus, and innate immune response (Supplementary material 1). In addition, supplementary material 2 illustrates the molecular function of these proteins. The related PPI network at 7 dpi is as presented in Figure 9. The resulting PPI network consists of one connected component and five communities, which contain 116 vertices and 1099 edges. Topological analysis revealed that the hub-bottleneck vertices of the 7 dpi undirected PPI network are Hsp90AB1 and Hsp90B1, whereas the proposed non-hub-bottleneck nodes consist of ACLY, ACAC, DNAJC10, ACACB, LRRK1, LRRK2, and TUBB6, and finally, the hub–non bottleneck nodes are Hsp90AA1, HspA2, HspA8, TRAP1, HspA5, HspH1, and HspA4l (Table 3) [21, 22]. The highest stress score was obtained for ACAC, and the highest closeness score was obtained with Hsp90AB1 and DNAJC10 (Table 3). Additionally, subnetworks analysis identified the two largest cliques, with 14 members, as follows:
Fig. 9.
Interaction network of differentially expressed proteins at 7 dpi (high confidence < 0.7). The size of the circle shows the importance of the node in relation to its neighbors. Table 3 shows the centralities of important nodes. This is an undirected graph. Differences in the color of circles show that the proteins belong to different components of the graph
Table 3.
Topological centrality analysis of the proposed PPI network for 7 dpi samples
| Hub | Hub degree | Betweenness | Bt. score | Stress | Stress score | Closeness | Closeness score |
|---|---|---|---|---|---|---|---|
| HSP90AB1 | 66 | HSP90AB1 | 1080.3207496 | ACAC | 92506 | HSP90AB1 | 0.0051546 |
| HSP90B1 | 57 | ACLY | 744.0224474 | ACACB | 85140 | DNAJC10 | 0.0047847 |
| HSP90AA1 | 51 | ACAC | 649.1397807 | ACLY | 43870 | HSP90B1 | 0.004717 |
| HSPA2 | 44 | DNAJC10 | 565.8880153 | DNAJC10 | 38896 | HSP90AA1 | 0.0046296 |
| HSPA8 | 43 | ACACB | 528.294562 | HSP90AB1 | 35712 | PIKFYVE | 0.0044843 |
| TRAP1 | 42 | LRRK1 | 480.0538792 | PIKFYVE | 35570 | TRAP1 | 0.004386 |
| HSPA5 | 42 | LRRK2 | 480.0538792 | HSPD1 | 33358 | HSPA2 | 0.004386 |
| HSPH1 | 37 | HSP90B1 | 408.5963847 | CCT2 | 28658 | HSPA8 | 0.0043668 |
| HSPA4L | 37 | TUBB6 | 378.9102564 | CCT4 | 28658 | HSPD1 | 0.0043668 |
Clique 1: EHHADH, HSD17B4, ENSGALG00000018744, ACOX1, ACACB, ACAC, HADHA, HADHB, ECI1, ACLY, ENSGALG00000007571, ACADS, ACOX3, and ECI2.
Clique 2: EHHADH, HSD17B4, ENSGALG00000018744, ACOX1, ACACB, ACAC, HADHA, HADHB, ECI1, ACLY, ACADS, HADH, ACOX3, and ECI2.
Gene expression qPCR
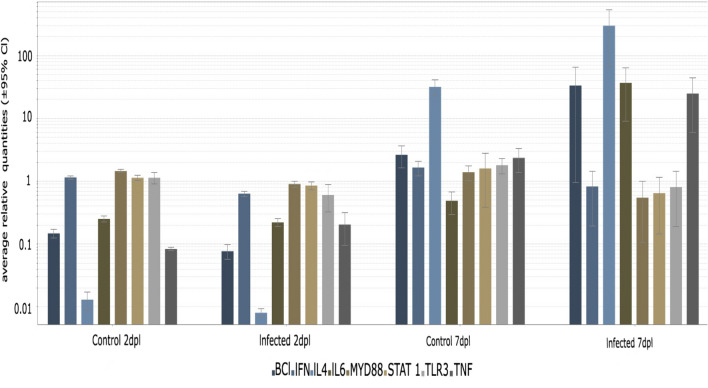
To investigate the relationship between the proposed PPI network and the mechanism of pathogenesis, eight strong candidates among the immune system genes were chosen based on their correlation to the proposed genes of this study [23–25]. The role of the selected genes in the innate immune response and apoptosis and their involvement during coronavirus infection was established in previous studies [26–36]. Bcl, IFN, IL-4, IL-6, MYD88, STAT-1, TLR3, and TNF were selected using these criteria. Statistically, a t-test indicated a significant decrease in IFN, MYD88, and Bcl at 2 dpi (p < 0.05) and a significant decrease in IFN TLR3 at 7 dpi (p < 0.05). IL-6 and TNF showed a significant increase at both time points (p < 0.05) (Fig. 10).
Fig. 10.
Real-time qPCR analysis of eight selected genes in the IBV-inoculated and control groups. Fold change values were calculated using the 2-ΔΔCT method with 28S rRNA as a reference gene. Error bars represent the standard error of three independent repeats
Discussion
Several studies of coronaviruses have been presented in many different fields of molecular biology and have delivered significant findings. However, these studies have not been linked to each other systematically. The aim of the current study was to analyze the PPI network of intracellular events during infection with avian coronavirus isolate IBV/chicken/Iran/UTIVO-C/2014, particularly pathological and immunological aspects of the disease, using proteomic analysis of changes occurring in avian kidney tissue. To our knowledge, three prior studies have used comparative proteomics in vivo to assess protein expression during infection with other strains of IBV [10, 12, 13]. Proteins that were down- or upregulated were identified by 2DE analysis and MS/TOF-TOF mass spectrometry and used for PPI network analysis. It has been shown previously that cellular metabolism can be altered due to infection. Corroborating this, based on the acquired GO annotations of the biological processes in this study, it is clear that avian coronavirus infection affects the metabolism of the host cell. A virus’s ability to reach the highest rate of replication depends on its ability to control host cell metabolism to maintain the necessary vital biological processes. Some previous studies have pointed to a crucial role of Hsp90s family proteins in the replication of many viruses [37–39]. Through the entry of uncoated positive-sense RNA into the cytosol of the host cell, which immediately functions as an mRNA, avian coronavirus begins translating genes required for its replication using the host cell machinery [40, 41]. Thus, 16 functional non-structural proteins belonging to the replicase-transcriptase complex (RTC), encoded by ORF1a and ORF1b, are synthesized. Subsequently, the plus-strand RNA is used as a template to synthesize the negative RNA strand in viral replication complexes (VRCs) [40, 42, 43]. A 50- to 100-fold increase in the amount of plus-strand RNA, a transcript from a negative-strand RNA, along with the translation of related viral proteins and other crucial proteins of the cell itself, all together produce a cluttered cytosol [40]. The accumulation of synthesized polypeptides causes ER stress, and the host cell must handle this overload. Hence, multifunctional heat shock proteins play a significant role in host cell survival. Hsp90AB1, a universal protein, has the greatest impact on the survival of both the host and the virus [44]. Also, abundant Hsp90 family proteins in the cytoplasm form functional complexes with various proteins that regulate different biological processes of the cell [44–46]. Moreover, other transcription factors such as IL-6, STAT1, NF-κB have a direct positive influence on Hsp90s expression levels [47]. Figure 10 that IL-6 is upregulated at 7 dpi, as determined by real-time qPCR (p < 0.05), in the infected group in comparison with the control group, which can upregulate the expression of Hsp90 family members [26, 31]. In such a situation, the prolyl-4-hydroxylase beta subunit (P4HB), which is a protein disulfide isomerase (PDI) may act as a molecular chaperone and facilitate proper folding of polypeptides and eliminate misfolded proteins [48, 49]. Furthermore, it has been shown that heat shock proteins (HSPs) are involved in the T-cell mediated immune response [25]. Besides that, the innate immune system is able to influence the adaptive immune system. Viral RNA is the foremost CoV-pathogen-associated molecular pattern (PAMP). Apparently, initiation of virus replication inside the host cell causes host-cell pathogen-recognition receptors (PRRs) such as Toll-like receptors (TLRs) and Retinoic acid-inducible gene I (RIG-I)–like receptors (RLRs) to induce expression of cytokines such as interferons (IFNs) [29, 50]. IFN production leads to the activation of IFN-stimulated genes (ISGs), which play an important early role in the antiviral defense apparatus of the innate immune system. This signal transduction activates STAT-1 as one of the most important tools against viral infection [50]. As shown in Figure 10, the decrease in IFN at 2 and 7 dpi was statistically significant (p < 0.05). This appears to allow the virus to conceal itself from the host immune system. This could be achieved by taking advantage of double-membrane vesicles (DMVs) and the actions of 3b and 5b accessory proteins, which play major roles as limiting agents of ISG expression [30, 51–53]. DMVs silence viral PAMPs, making them inaccessible to PRRs. In addition, the presence of a protein phosphatase 1–binding domain in the 3b accessory protein of avian CoV along with the ability of the 5b accessory protein of the virus to reduce IFN mRNA expression results in a reduction of IFN expression during the early stage of infection [30, 51, 53]. This is in agreement with the overexpression of HSPs, which have a positive effect on the antiviral defense of the host cell. Another antiviral agent in the network that has a significant function is EPRS [23]. Amino-acyl tRNA-synthetases (ARSs) are crucial to the protein-synthesizing process. They create a linkage between amino acids and their corresponding tRNA-glutamyl-prolyl tRNA synthetase (EPRS). EPRS is a member of ARS that acts in the context of mammalian cytoplasmic multi-tRNA synthetase complex (MCC). It is also expressed during stress situations such as viral infections, in which it functions together with GAPDH through the GAIT system [23, 54]. Regarding the observed decrease in IFN during IBV infection, as mentioned above, the antiviral activity of EPRS might be decreased due to impairment of the GAIT system [23, 55–57]. Keeping subsequent major problems induced by the virus replication under control, such as increased cellular biochemical reactions, demands for energy sources, starvation, proteotoxic challenges, and hypoxia, all of which are due to increased biological processes involving acetyl-coenzyme A consumption, is another critical function that needs to be managed by the cell [58, 59]. Autophagy mechanisms can help the cell to deal with the above-mentioned stressful situations. Avian coronavirus nsp6 has the ability to induce autophagy in the host cell itself [60]. Acetyl-coenzyme A, a key intermediate molecule that plays a pivotal role in intracellular biochemical reactions, must be regulated by increasing cell metabolism. ACLY increases the cytoplasmic levels of AcCoA by back-conversion of citrate to compensate for its shortages [61, 62]. The anti-apoptotic cytoplasmic protein, Bcl-2, which negatively regulates autophagy, showed a statistically significant (p < 0.05) reduction based on the qPCR result (Fig. 10). This would result in the promotion of autophagy in infected cell [63–67].
The data from this study suggest that the process of pathogenesis that occurs during avian coronavirus infection involves the regulation of vital cellular processes and the gradual disruption of critical cellular functions. Host genes such as Hsp90AB1, EPRS, GAPDH, HspD1, ACLY, and P4HB, which have not been identified in previous studies, are potentially involved in the process of pathogenesis and should be investigated further.
Electronic supplementary material
Below is the link to the electronic supplementary material.
Footnotes
Publisher's Note
Springer Nature remains neutral with regard to jurisdictional claims in published maps and institutional affiliations.
References
- 1.Schalk AF, Hawn MC. An apparently new respiratory disease of baby chicks. J Am Vet Med Assoc. 1931;78(19):413–422. [Google Scholar]
- 2.Jackwood MW. Review of infectious bronchitis virus around the world invited review—review of infectious bronchitis virus around the world. Avian Dis. 2012;56(4):634–641. doi: 10.1637/10227-043012-Review.1. [DOI] [PubMed] [Google Scholar]
- 3.de Wit JJS, Cook JKA, van der Heijden HMJF. Infectious bronchitis virus variants: a review of the history, current situation and control measures. Avian Pathol. 2011;40(3):223–235. doi: 10.1080/03079457.2011.566260. [DOI] [PMC free article] [PubMed] [Google Scholar]
- 4.Ramage HR, et al. A combined proteomics/genomics approach links hepatitis C virus infection with nonsense-mediated mRNA decay. Mol Cell. 2015;57(2):329–340. doi: 10.1016/j.molcel.2014.12.028. [DOI] [PMC free article] [PubMed] [Google Scholar]
- 5.Matheson NJ, et al. Cell surface proteomic map of HIV infection reveals antagonism of amino acid metabolism by Vpu and Nef. Cell Host Microbe. 2015;18(4):409–423. doi: 10.1016/j.chom.2015.09.003. [DOI] [PMC free article] [PubMed] [Google Scholar]
- 6.Kroeker AL, Coombs KM. Systems biology unravels interferon responses to respiratory virus infections. World J Biol Chem. 2014;5(1):12–25. doi: 10.4331/wjbc.v5.i1.12. [DOI] [PMC free article] [PubMed] [Google Scholar]
- 7.Mancone C, et al. Applying proteomic technology to clinical virology. Clin Microbiol Infect. 2013;19(1):23–28. doi: 10.1111/1469-0691.12029. [DOI] [PMC free article] [PubMed] [Google Scholar]
- 8.Munday DC, et al. Quantitative proteomic analysis of A549 cells infected with human respiratory syncytial virus. Mol Cell Proteomics. 2010;9(11):2438–2459. doi: 10.1074/mcp.M110.001859. [DOI] [PMC free article] [PubMed] [Google Scholar]
- 9.Liu N, et al. Proteomics analysis of differential expression of cellular proteins in response to avian H9N2 virus infection in human cells. Proteomics. 2008;8(9):1851–1858. doi: 10.1002/pmic.200700757. [DOI] [PubMed] [Google Scholar]
- 10.Cao Z, et al. Proteomics analysis of differentially expressed proteins in chicken trachea and kidney after infection with the highly virulent and attenuated coronavirus infectious bronchitis virus in vivo. Proteome Sci. 2012;10(1):24. doi: 10.1186/1477-5956-10-24. [DOI] [PMC free article] [PubMed] [Google Scholar]
- 11.Emmott E, Smith C, Emmett SR, Dove BK, Hiscox JA. Elucidation of the avian nucleolar proteome by quantitative proteomics using SILAC and changes in cells infected with the coronavirus infectious bronchitis virus. Proteomics. 2010;10(19):3558–3562. doi: 10.1002/pmic.201000139. [DOI] [PMC free article] [PubMed] [Google Scholar]
- 12.Emmott E, Rodgers MA, Macdonald A, McCrory S, Ajuh P, Hiscox JA. “Quantitative proteomics using stable isotope labeling with amino acids in cell culture reveals changes in the cytoplasmic, nuclear, and nucleolar proteomes in Vero cells infected with the coronavirus infectious bronchitis virus. Mol Cell Proteomics. 2010;9(9):1920–1936. doi: 10.1074/mcp.M900345-MCP200. [DOI] [PMC free article] [PubMed] [Google Scholar]
- 13.Sun J, Han Z, Shao Y, Cao Z, Kong X, Liu S. Comparative proteome analysis of tracheal tissues in response to infectious bronchitis coronavirus, Newcastle disease virus, and avian influenza virus H9 subtype virus infection. Proteomics. 2014;14(11):1403–1423. doi: 10.1002/pmic.201300404. [DOI] [PMC free article] [PubMed] [Google Scholar]
- 14.Najafi H, et al. Pathogenicity characteristics of an Iranian variant-2 (IS-1494) like infectious bronchitis virus in experimentally infected SPF chickens. Acta Virol. 2016;60(4):393. doi: 10.4149/av_2016_04_393. [DOI] [PubMed] [Google Scholar]
- 15.Hosseini H, Fard MHB, Charkhkar S, Morshed R. Epidemiology of avian infectious bronchitis virus genotypes in Iran (2010–2014) Avian Dis. 2015;59(3):431–435. doi: 10.1637/11091-041515-ResNote.1. [DOI] [PubMed] [Google Scholar]
- 16.Hamadan AM, et al. Genotyping of Avian infectious bronchitis viruses in Iran (2015–2017) reveals domination of IS-1494 like virus. Virus Res. 2017;240:101–106. doi: 10.1016/j.virusres.2017.08.002. [DOI] [PMC free article] [PubMed] [Google Scholar]
- 17.Shannon P, et al. Cytoscape: a software environment for integrated models of biomolecular interaction networks. Genome Res. 2003;13(11):2498–2504. doi: 10.1101/gr.1239303. [DOI] [PMC free article] [PubMed] [Google Scholar]
- 18.G. O. Consortium Gene ontology consortium: going forward. Nucleic Acids Res. 2015;43(D1):D1049–D1056. doi: 10.1093/nar/gku1179. [DOI] [PMC free article] [PubMed] [Google Scholar]
- 19.Maere S, Heymans K, Kuiper M. BiNGO: a Cytoscape plugin to assess overrepresentation of gene ontology categories in biological networks. Bioinformatics. 2005;21(16):3448–3449. doi: 10.1093/bioinformatics/bti551. [DOI] [PubMed] [Google Scholar]
- 20.Nolan T, Hands RE, Bustin SA. Quantification of mRNA using real-time RT-PCR. Nat Protoc. 2006;1(3):1559–1582. doi: 10.1038/nprot.2006.236. [DOI] [PubMed] [Google Scholar]
- 21.Yu H, Kim PM, Sprecher E, Trifonov V, Gerstein M. The importance of bottlenecks in protein networks: correlation with gene essentiality and expression dynamics. PLoS Comput Biol. 2007;3(4):e59. doi: 10.1371/journal.pcbi.0030059. [DOI] [PMC free article] [PubMed] [Google Scholar]
- 22.Dietz K, Jacquot J, Harris G. Hubs and bottlenecks in plant molecular signalling networks. New Phytol. 2010;188(4):919–938. doi: 10.1111/j.1469-8137.2010.03502.x. [DOI] [PubMed] [Google Scholar]
- 23.Lee E-Y, et al. Infection-specific phosphorylation of glutamyl-prolyl tRNA synthetase induces antiviral immunity. Nat Immunol. 2016;17:1252–1262. doi: 10.1038/ni.3542. [DOI] [PMC free article] [PubMed] [Google Scholar]
- 24.Pietrocola F, Galluzzi L, Pedro JMB-S, Madeo F, Kroemer G. Acetyl coenzyme A: a central metabolite and second messenger. Cell Metab. 2015;21(6):805–821. doi: 10.1016/j.cmet.2015.05.014. [DOI] [PubMed] [Google Scholar]
- 25.Srivastava PK, Menoret A, Basu S, Binder RJ, McQuade KL. Heat shock proteins come of age: primitive functions acquire new roles in an adaptive world. Immunity. 1998;8(6):657–665. doi: 10.1016/s1074-7613(00)80570-1. [DOI] [PubMed] [Google Scholar]
- 26.Wang W, et al. Up-regulation of IL-6 and TNF-α induced by SARS-coronavirus spike protein in murine macrophages via NF-κB pathway. Virus Res. 2007;128(1):1–8. doi: 10.1016/j.virusres.2007.02.007. [DOI] [PMC free article] [PubMed] [Google Scholar]
- 27.Clay CC, et al. Severe acute respiratory syndrome-coronavirus infection in aged nonhuman primates is associated with modulated pulmonary and systemic immune responses. Immun Ageing. 2014;11(1):4. doi: 10.1186/1742-4933-11-4. [DOI] [PMC free article] [PubMed] [Google Scholar]
- 28.Maier HJ, Britton P. Involvement of autophagy in coronavirus replication. Viruses. 2012;4(12):3440–3451. doi: 10.3390/v4123440. [DOI] [PMC free article] [PubMed] [Google Scholar]
- 29.Vidalain PO, Tangy F. Virus-host protein interactions in RNA viruses. Microbes Infect. 2010;12(14–15):1134–1143. doi: 10.1016/j.micinf.2010.09.001. [DOI] [PubMed] [Google Scholar]
- 30.Kint J, et al. Infectious bronchitis coronavirus limits interferon production by inducing a host shutoff that requires accessory protein 5b. J Virol. 2016;90(16):7519–7528. doi: 10.1128/JVI.00627-16. [DOI] [PMC free article] [PubMed] [Google Scholar]
- 31.Cong F, Liu X, Han Z, Shao Y, Kong X, Liu S. Transcriptome analysis of chicken kidney tissues following coronavirus avian infectious bronchitis virus infection. BMC Genomics. 2013;14(1):743. doi: 10.1186/1471-2164-14-743. [DOI] [PMC free article] [PubMed] [Google Scholar]
- 32.Li FQ, Tam JP, Liu DX. Cell cycle arrest and apoptosis induced by the coronavirus infectious bronchitis virus in the absence of p53. Virology. 2007;365(2):435–445. doi: 10.1016/j.virol.2007.04.015. [DOI] [PMC free article] [PubMed] [Google Scholar]
- 33.Fernando FS, et al. Increased expression of interleukin-6 related to nephritis in chickens challenged with an avian infectious bronchitis virus variant. Pesqui Veterinária Bras. 2015;35(3):216–222. [Google Scholar]
- 34.Kameka AM, Haddadi S, Kim DS, Cork SC, Abdul-Careem MF. Induction of innate immune response following infectious bronchitis corona virus infection in the respiratory tract of chickens. Virology. 2014;450:114–121. doi: 10.1016/j.virol.2013.12.001. [DOI] [PMC free article] [PubMed] [Google Scholar]
- 35.Chhabra R, Chantrey J, Ganapathy K. Immune responses to virulent and vaccine strains of infectious bronchitis viruses in chickens. Viral Immunol. 2015;28(9):478–488. doi: 10.1089/vim.2015.0027. [DOI] [PubMed] [Google Scholar]
- 36.Yang Y, et al. Bcl-xL inhibits T-cell apoptosis induced by expression of SARS coronavirus E protein in the absence of growth factors. Biochem J. 2005;392(1):135–143. doi: 10.1042/BJ20050698. [DOI] [PMC free article] [PubMed] [Google Scholar]
- 37.Das I, et al. Heat shock protein 90 positively regulates Chikungunya virus replication by stabilizing viral non-structural protein nsP2 during infection. PLoS ONE. 2014;9(6):e100531. doi: 10.1371/journal.pone.0100531. [DOI] [PMC free article] [PubMed] [Google Scholar]
- 38.Smith AP, Haystead TAJ. Hsp90: a key target in HIV infection. Future Med. 2017;2017:55–59. [Google Scholar]
- 39.Gao J, et al. Inhibition of HSP90 attenuates porcine reproductive and respiratory syndrome virus production in vitro. Virol J. 2014;11(1):17. doi: 10.1186/1743-422X-11-17. [DOI] [PMC free article] [PubMed] [Google Scholar]
- 40.Sawicki SG, Sawicki DL, Siddell SG. A contemporary view of coronavirus transcription. J Virol. 2007;81(1):20–29. doi: 10.1128/JVI.01358-06. [DOI] [PMC free article] [PubMed] [Google Scholar]
- 41.Masters PS. The molecular biology of coronaviruses. Adv Virus Res. 2006;65(06):193–292. doi: 10.1016/S0065-3527(06)66005-3. [DOI] [PMC free article] [PubMed] [Google Scholar]
- 42.Nagy PD, Pogany J. The dependence of viral RNA replication on co-opted host factors. Nat Rev Microbiol. 2012;10(2):137–149. doi: 10.1038/nrmicro2692. [DOI] [PMC free article] [PubMed] [Google Scholar]
- 43.Fung TS, Liu DX. Coronavirus infection, ER stress, apoptosis and innate immunity. Front Microbiol. 2014;5:296. doi: 10.3389/fmicb.2014.00296. [DOI] [PMC free article] [PubMed] [Google Scholar]
- 44.Haase M, Fitze G. HSP90AB1: helping the good and the bad. Gene. 2016;575(2):171–186. doi: 10.1016/j.gene.2015.08.063. [DOI] [PMC free article] [PubMed] [Google Scholar]
- 45.Taipale M, Jarosz DF, Lindquist S. HSP90 at the hub of protein homeostasis: emerging mechanistic insights. Nat Rev Mol cell Biol. 2010;11(7):515–528. doi: 10.1038/nrm2918. [DOI] [PubMed] [Google Scholar]
- 46.Nagy PD, Wang RY, Pogany J, Hafren A, Makinen K. Emerging picture of host chaperone and cyclophilin roles in RNA virus replication. Virology. 2011;411(2):374–382. doi: 10.1016/j.virol.2010.12.061. [DOI] [PubMed] [Google Scholar]
- 47.Prodromou C. Regulatory mechanisms of Hsp90. Biochem Mol Biol J. 2017;3:1. doi: 10.21767/2471-8084.100030. [DOI] [PMC free article] [PubMed] [Google Scholar]
- 48.Gorres KL, Raines RT. Prolyl 4-hydroxylase. Crit Rev Biochem Mol Biol. 2010;45(2):106–124. doi: 10.3109/10409231003627991. [DOI] [PMC free article] [PubMed] [Google Scholar]
- 49.Sun S, et al. Endoplasmic reticulum chaperone prolyl 4-hydroxylase, beta polypeptide (P4HB) promotes malignant phenotypes in glioma via MAPK signaling. Oncotarget. 2017;8(42):71911. doi: 10.18632/oncotarget.18026. [DOI] [PMC free article] [PubMed] [Google Scholar]
- 50.Schoggins JW, Rice CM. Interferon-stimulated genes and their antiviral effector functions. Curr Opin Virol. 2011;1(6):519–525. doi: 10.1016/j.coviro.2011.10.008. [DOI] [PMC free article] [PubMed] [Google Scholar]
- 51.Kindler E, Thiel V. To sense or not to sense viral RNA—essentials of coronavirus innate immune evasion. Curr Opin Microbiol. 2014;20:69–75. doi: 10.1016/j.mib.2014.05.005. [DOI] [PMC free article] [PubMed] [Google Scholar]
- 52.Kint J, et al. Activation of the chicken type I interferon response by infectious bronchitis coronavirus. J Virol. 2015;89(2):1156–1167. doi: 10.1128/JVI.02671-14. [DOI] [PMC free article] [PubMed] [Google Scholar]
- 53.Pendleton AR, Machamer CE. Differential localization and turnover of infectious bronchitis virus 3b protein in mammalian versus avian cells. Virology. 2006;345(2):337–345. doi: 10.1016/j.virol.2005.09.069. [DOI] [PMC free article] [PubMed] [Google Scholar]
- 54.Mukhopadhyay R, Jia J, Arif A, Ray PS, Fox PL. The GAIT system: a gatekeeper of inflammatory gene expression. Trends Biochem Sci. 2009;34(7):324–331. doi: 10.1016/j.tibs.2009.03.004. [DOI] [PMC free article] [PubMed] [Google Scholar]
- 55.Mazumder B, Li X, Barik S. Translation control: a multifaceted regulator of inflammatory response. J Immunol. 2010;184(7):3311–3319. doi: 10.4049/jimmunol.0903778. [DOI] [PMC free article] [PubMed] [Google Scholar]
- 56.Sola I, Mateos-Gomez PA, Almazan F, Zuñiga S, Enjuanes L. RNA-RNA and RNA-protein interactions in coronavirus replication and transcription. RNA Biol. 2011;8(2):237–248. doi: 10.4161/rna.8.2.14991. [DOI] [PMC free article] [PubMed] [Google Scholar]
- 57.Zhong Y, Tan YW, Liu DX. Recent progress in studies of arterivirus-and coronavirus-host interactions. Viruses. 2012;4(6):980–1010. doi: 10.3390/v4060980. [DOI] [PMC free article] [PubMed] [Google Scholar]
- 58.Santoro MG. Heat shock factors and the control of the stress response. Biochem Pharmacol. 2000;59(1):55–63. doi: 10.1016/s0006-2952(99)00299-3. [DOI] [PubMed] [Google Scholar]
- 59.Ron D, Walter P. Signal integration in the endoplasmic reticulum unfolded protein response. Nat Rev Mol cell Biol. 2007;8(7):519–529. doi: 10.1038/nrm2199. [DOI] [PubMed] [Google Scholar]
- 60.Cottam EM, et al. Coronavirus nsp6 proteins generate autophagosomes from the endoplasmic reticulum via an omegasome intermediate. Autophagy. 2011;7(11):1335–1347. doi: 10.4161/auto.7.11.16642. [DOI] [PMC free article] [PubMed] [Google Scholar]
- 61.Mariño G, et al. Regulation of autophagy by cytosolic acetyl-coenzyme A. Mol Cell. 2014;53(5):710–725. doi: 10.1016/j.molcel.2014.01.016. [DOI] [PubMed] [Google Scholar]
- 62.Maier HJ, et al. Visualizing the autophagy pathwayc in avian cells and its application to studying infectious bronchitis virus. Autophagy. 2013;9(4):496–509. doi: 10.4161/auto.23465. [DOI] [PMC free article] [PubMed] [Google Scholar]
- 63.McCullough KD, Martindale JL, Klotz L-O, Aw T-Y, Holbrook NJ. Gadd153 sensitizes cells to endoplasmic reticulum stress by down-regulating Bcl2 and perturbing the cellular redox state. Mol Cell Biol. 2001;21(4):1249–1259. doi: 10.1128/MCB.21.4.1249-1259.2001. [DOI] [PMC free article] [PubMed] [Google Scholar]
- 64.Sano R, Reed JC. ER stress-induced cell death mechanisms. Biochim Biophys Acta (BBA)-Mol Cell Res. 2013;1833(12):3460–3470. doi: 10.1016/j.bbamcr.2013.06.028. [DOI] [PMC free article] [PubMed] [Google Scholar]
- 65.Adams JM, Cory S. The Bcl-2 protein family: arbiters of cell survival. Science (80) 1998;281(5381):1322–1326. doi: 10.1126/science.281.5381.1322. [DOI] [PubMed] [Google Scholar]
- 66.Liao Y, Fung TS, Huang M, Fang SG, Zhong Y, Liu DX. Upregulation of CHOP/GADD153 during coronavirus infectious bronchitis virus infection modulates apoptosis by restricting activation of the extracellular signal-regulated kinase pathway. J Virol. 2013;87(14):8124–8134. doi: 10.1128/JVI.00626-13. [DOI] [PMC free article] [PubMed] [Google Scholar]
- 67.Kroemer G, Mariño G, Levine B. Autophagy and the integrated stress response. Mol Cell. 2010;40(2):280–293. doi: 10.1016/j.molcel.2010.09.023. [DOI] [PMC free article] [PubMed] [Google Scholar]
Associated Data
This section collects any data citations, data availability statements, or supplementary materials included in this article.


