

Abstract
Severe acute respiratory syndrome coronavirus 2 (SARS-CoV-2) is constantly evolving. Prior studies focused on high-case-density locations, such as the northern and western metropolitan areas of the United States. This study demonstrates continued SARS-CoV-2 evolution in a suburban southern region of the United States by high-density amplicon sequencing of symptomatic cases. 57% of strains carry the spike D614G variant, which is associated with higher genome copy numbers, and its prevalence expands with time. Four strains carry a deletion in a predicted stem loop of the 3′ UTR. The data are consistent with community spread within local populations and the larger continental United States. The data instill confidence in current testing sensitivity and validate “testing by sequencing” as an option to uncover cases, particularly nonstandard coronavirus disease 2019 (COVID-19) clinical presentations. This study contributes to the understanding of COVID-19 through an extensive set of genomes from a non-urban setting and informs vaccine design by defining D614G as a dominant and emergent SARS-CoV-2 isolate in the United States.
Keywords: COVID-19, SARS-CoV-2, coronavirus, mutational landscape, testing by sequencing, next-generation sequencing, single-nucleotide variations
Graphical Abstract
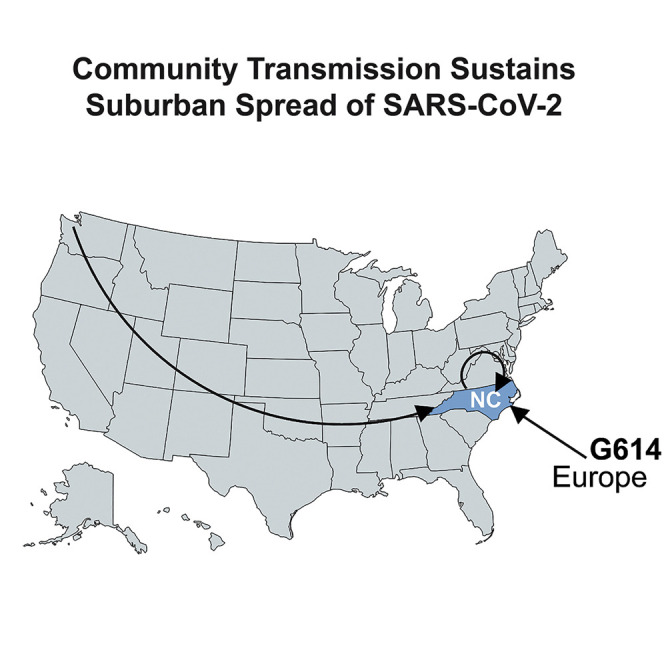
McNamara et al. use next-generation sequencing (NGS) with a high-density tiling array across SARS-CoV-2 to find a deletion and document how the D614G spike protein mutation rapidly swept through a rural/suburban population. D614G is associated with slightly higher viral loads.
Introduction
The coronavirus disease 2019 (COVID-19) pandemic is an urgent public health emergency, with over 200,000 deaths in the United States alone. COVID-19 is caused by infection with severe acute respiratory syndrome coronavirus 2 (SARS-CoV-2). Typical symptoms for COVID-19 include fever, cough, shortness of breath, fatigue, myalgias, headache, sore throat, abdominal pain, and diarrhea (Wu et al., 2020; Zhou et al., 2020a, 2020b). Patients admitted to the hospital generally have pneumonia and abnormal chest imaging (Bhatraju et al., 2020; Chen et al., 2020). COVID-19 is also associated with other complications, including acute respiratory failure and acute respiratory distress syndrome, which appear to be significant predictors of mortality. Severe COVID-19 is disproportionately observed in the elderly and individuals with underlying comorbidities. COVID-19 has not similarly impacted children (Guan et al., 2020; CDC COVID-19 Response Team, 2020; Verdoni et al., 2020; Xu et al., 2020b); however, other SARS-CoV-2 disease manifestations, such as Kawasaki disease, are emerging in this group.
The first reported SARS-CoV-2 clusters appeared in the Wuhan province in China and have since rapidly spread across the world (Li et al., 2020a; Wu et al., 2020; Zhu et al., 2020). The primary means of transmission is by oral secretions, though viral RNA has also been detected in blood, stool, and semen (Kim et al., 2020; Zou et al., 2020). Social distancing, rapid case ascertainment, physical barriers, and quarantine of infected persons have proven successful in limiting the impact of COVID-19. For these public health measures to remain effective and sustainable, it is important to understand the pathways of transmission through aggressive contact tracing and virus testing. Of high concern with regards to SARS-Cov-2 is that the virus may be shed prior to the onset of clinical symptoms, at late times after the cessation of clinical symptoms, and by asymptomatically infected persons (Arons et al., 2020; He et al., 2020; Hijnen et al., 2020; van Doremalen et al., 2020; Wölfel et al., 2020; Xu et al., 2020a). While antibody testing identifies patients with prior exposure (Long et al., 2020), only targeted nucleic acid amplification testing (NAT) or SARS-CoV-2 antigen detection can identify actively transmitting individuals.
The SARS-CoV-2 genome shares 79.6% sequence identity with SARS-CoV, the causative agent of SARS in 2002. It shares 96% sequence identity with a bat coronavirus (BatCoV), RaTG13 (GenBank: MN996532) (Ceraolo and Giorgi, 2020; Lu et al., 2020b; Zhou et al., 2020b). SARS-CoV entry is determined by the spike protein ORF S (Wan et al., 2020). ORF S has many interaction surfaces and is the target of neutralizing antibodies. The S protein uses human ACE2 (hACE2) as a receptor and is proteolytically activated by human proteases (Hoffmann et al., 2020; Shang et al., 2020). Comparative analysis shows that between SARS-CoV-2 and either SARS-CoV or bat-derived SARS-like coronavirus (bat SARS-CoV) (Andersen et al., 2020; Wu et al., 2020), the sequence identities are the least alike for spike protein gene (S). SARS-CoV-2 has a longer spike protein as compared to bat SARS-CoV, human SARS-CoV, and middle east respiratory syndrome coronavirus (MERS-CoV) (Lu et al., 2020b). Although SARS-CoV-2 and SARS-CoV only share 79% identity at the whole-genome scale, their spike protein receptor binding site sequences are more similar compared to bat SARS-CoV and MERS-CoV (Lu et al., 2020b). Residues at the receptor-binding site have evolved for better association with ACE2 compared to SARS-CoV (Wan et al., 2020; Wrapp et al., 2020) and can be attributed to these molecular features; five of the residues critical for binding to ACE2 are different in SARS-CoV-2 as compared to SARS-CoV (Wan et al., 2020; Wrapp et al., 2020), and a functional polybasic cleavage site (RRAR) is present at the S1/S2 boundary of the SARS-CoV-2 spike protein (Andersen et al., 2020; Walls et al., 2020). The polybasic cleavage site allows for effective cleavage by furin and other proteases, which is important for viral infectivity (Letko et al., 2020). The additional proline may also result in O-linked glycans to S673, T678, and S686 that can be important in shielding key epitopes or residues (Andersen et al., 2020). Ascertaining whether these key residues remain invariable as the pandemic progresses or evolve over time is crucial to ensure testing accuracy and rational vaccine design.
Phylogenetic analysis translates viral genome sequences into a hierarchical classification based on sequence similarity. Early analyses established SARS-CoV-2 as a Sarbecovirus, in the same clade as BatCoVs, substantiating its use as an outgroup here (Jaimes et al., 2020). Initial analyses of human SARS-CoV-2 genomes established three major variant types worldwide (Forster et al., 2020). Clade B was derived from clade A by a synonymous T8782C mutation in ORF1ab and a nonsynonymous C28144T mutation that changes a leucine to serine in ORF8 (Ceraolo and Giorgi, 2020; Forster et al., 2020). Clade C was derived from clade B by a nonsynonymous G26144T mutation that changes a glycine to valine in ORF3a. A and C types are mainly found in Europe and the United States. B type is mainly found in East Asia. Other analyses arrived at different clades and, unfortunately, different naming conventions (Yang et al., 2020; Zhang et al., 2020). Additional clades have since been recognized, including clade G, which is defined by a nonsynonymous single-nucleotide variant (SNV) in spike protein at amino acid position 614. Multiple studies continue to study SARS-CoV-2 sequence evolution based on an ever-increasing set of sequences collected at GISAID (GISAID, 2020; Shu and McCauley, 2017), GenBank, and Nextstrain (Hadfield et al., 2018). The phylogenetic analysis of SARS-CoV-2 is very much in flux. Analyses represent a snapshot of the time of prepublication. The clade designations used here were derived from GISAID at the time of data analysis.
To provide finer granularity about biological changes during SARS-CoV-2 transmission, we employed next-generation sequencing (NGS) as an independent screening modality. This allowed us to reconstruct the mutational landscape of cases seen at a tertiary clinical care center in the southeastern United States from the start of the North Carolina (NC) epidemic on March 3, 2020, until past the peak of the first major wave of infections. The samples cover the period when community spread in NC was established and when the state-wide stay-at-home order was issued (March 30 to May 8, 2020).
SARS-CoV-2 testing remains limited in many countries due to a shortage of personal protective equipment, testing kits, and diagnostic capacity. The Centers for Disease Control (CDC) guidelines during the time of sampling prioritized patients with specific clinical symptoms (fever, cough, and shortness of breath) and curtailed testing to only a subset of all probable cases. Individuals not fitting the clinical criteria for testing, as well as asymptomatic individuals, were excluded. To evaluate if any cases were missed because of this triage algorithm, nasopharyngeal (NP) swabs for three groups of patients were evaluated (n = 175 known SARS-CoV-2-positive NP samples, n = 41 known SARS-CoV-2-negative NP samples, and n = 12 NP samples of unknown status [i.e., the patient had symptoms justifying sample collection but was not prioritized for clinical SARS-CoV-2 testing]). “Testing by sequencing” was negative for all negative samples, less sensitive for weakly positive samples, and uncovered five new cases among previously not tested cases. The index case in NC was linked to the US outbreak in the state of Washington. Phylogenetic analyses established the dominance of the S protein D614G SNV among this population, which has been increasing over time through community spread and was introduced initially by a person returning from Europe.
Results
Whole-Genome SARS-CoV-2 Sequencing through High-Density Amplicons
The University of North Carolina at Chapel Hill Medical Center (UNCMC) used one of two NATs to test for the presence of SARS-CoV-2 RNA, one laboratory-developed test based on the protocol by Corman et al. (2020) and the commercially available Abbott real-time SARS-CoV-2 assay, both under the EUA provision of the US Food and Drug Administration. Both tests report the presence or absence of SARS-CoV-2 RNA. Remnant NP samples were subjected to targeted sequencing using the Thermo Fisher AmpliSeq SARS-CoV-2 assay and S5 Ion Torrent sequencing platform. A subset of isolates was subjected to 3′ and 5′ rapid amplification of cDNA ends (RACE) followed by Sanger sequencing to verify the sequences in the highly structured untranslated regions of the genome. Individual sequence reads were mapped to the SARS-CoV-2 reference sequence (NC_045512) and a strain-specific consensus sequence was generated and SNV recorded. The finished genomes are submitted to GenBank and GISAID and were named according to convention (Coronaviridae Study Group of the International Committee on Taxonomy of, 2020).
A total of n = 175 known positive samples and positive control (full-length genomic RNA from strain SARS-CoV-2/human/USA-WA1/2020; GenBank: MN985325) were subjected to NGS. The number of mapped reads varied substantially across samples, reflecting the differences in the amount of virus per sample. The distribution of 10× coverage for all samples is presented in Figure 1 A (see also Table S1). As expected, more mapped reads yielded higher coverage. Of the 33 negative controls, none had >102 total reads aligned. Of the positive samples, >5 × 10³ total mapped reads were needed to obtain 1× coverage of the whole genome, and a minimum of 3.1 × 10⁴ reads were needed to obtain >90% coverage at 10×. The number of reads aligned varied depending on the viral load, as determined by real-time qPCR using CDC primer N1, but not total RNA, as determined using RNase P, of the samples (Figure 1B). In this assay, any crossing point (CP) <35 for SARS-CoV-2 qPCR yielded reliable coverage, which increased linearly with viral load. At a CP ≥35, most positive samples still yielded reads that mapped to the target genome and thus allowed detection of SARS-CoV-2 sequences; however, the results were less consistent, and coverage was more variable. As expected, total RNA (measured by RNase P) was not associated with sequencing coverage and varied considerably across samples, even though each sample used the same amount of virus transport medium (VTM).
Figure 1.

Analysis of Sequencing Coverage
(A) Distribution of ≥10× coverage across all samples. The percentage of samples is shown on the vertical axis and log10 total mapped reads on the horizontal axis. Color indicates known positive (red), negative (blue), and unknown samples (gray).
(B) Relationship between mapped reads (on the vertical axis) and relative viral load (N1) or total RNA levels (on the horizontal axis).
(C) Quality of samples submitted to GenBank GISAID. Percentage of genome covered is on the vertical axis, and coverage level is on the horizontal axis.
(D) Quality of additional samples used for SNV analysis. Percentage of genome covered is on the vertical axis, and coverage level is on the horizontal axis.
(E) Relative coverage of aligned reads per position of samples with median coverage >5,000 reads is shown on the vertical axis for each position of SARS-CoV-2, as shown on the horizontal axis. Red line indicates a loess fit of the data (n = 28 samples).
The coverage level distribution is shown in Figures 1C and 1D. Figure 1C represents the subset of samples for which high-quality genomes were submitted to GenBank and GISAID. Figure 1D represents samples, with more variable complete coverage. These samples were nevertheless included in SNV calling, as the SNV algorithm relies on local coverage rather than overall coverage. As a result, the variant calls represent a conservative estimate of SNV distribution in this sample set. Figure 1E shows the per nucleotide coverage for all genomes with median coverage ≥5,000×. Median coverage of >5,000× was required to ensure >99% genome coverage without a single amplicon dropout. The nucleotide composition of SARS-CoV-2 was largely balanced and did not contain repeats larger than sequencing length. Hence, coverage was continuous across the genome, except for the 5′ and 3′ UTRs. Targeted amplification using this primer set missed the first 42 nt at the 5′ end and 29 nt, starting at 29,843, at the 3′ end of the viral genome. These regions are conserved across most SARS-CoV-2 sequences in GenBank, many of which are themselves incomplete or known to suffer amplification bias (van Dorp et al., 2020). The limiting factor was not sequencing depth per se; rather, samples of low viral load failed in the targeted amplification step for individual amplicons. Samples with low viral load were re-sequenced.
A subset of positive samples (n = 33) were independently re-sequenced and yielded 251 high-confidence SNVs. No new SNVs were uncovered upon resequencing; 180 SNVs were confirmed and 71 SNVs were lost upon pooling multiple sequencing runs for the same sample due to the frequency dropping below 90%. Of the 71 SNVs, 50 possessed a majority vote matching the reference and 21 possessed a majority vote matching the prior SNV call. Target capture efficiency was verified using multiple dilutions and compared to unbiased RNA sequencing (RNA-seq) of the reference strain SARS-CoV-2/human/USA-WA1/2020 (Figure S1). Targeted sequencing coverage was uniform over a 50-fold range of input RNA; it was higher than RNA seq, except in the terminal regions that were not covered by PCR amplicons. In some cases, as little as 5 μL VTM from a single swab had sufficient virus to obtain a full-length viral genome sequence at 1,000×. These data are consistent with the astonishingly high reported genome copy numbers of SARS-CoV-2 in some cases (Yu et al., 2020) and demonstrate the principal suitability of testing by sequencing as a diagnostic option for SARS-CoV-2 and other rapidly evolving viruses.
The average quality score per read is set to a minimal average phred score of 20 corresponding sequencing error rate of 1% and to a false-positive probability of any individual base of 0.1% and a true-positive probability of 99.9%. Using a theoretical model (Petrackova et al., 2019) based on the binomial distribution, a minimal coverage of 10× was expected sufficient to call SNVs with an allele frequency of ≥90%.
Twelve samples were collected during the same calendar period from individuals presenting with respiratory complaints but no indication for SARS-CoV-2 testing according to CDC guidelines. 5 of 12 yielded >5% genome coverage (Figures S2A–S2L). The remainder had reads aligned only to regions of the genome that have low complexity; 2 out of 12 had a sequence coverage distribution, at 57% and 34%, respectively, consistent with the presence of the target virus. Three other samples had coverage of 20%, 13%, and 10%. At the time of study, SARS-CoV-2 testing guidelines were extremely restrictive due to a lack of supplies. Patients with clear clinical symptoms of COVID-19 were not tested but treated on the basis of clinical diagnosis alone, and patients with respiratory symptoms not exactly matching CDC/COVID-19 criteria were not tested either. None of the samples in this study originated from asymptomatic patients. Though the number of unknowns tested was small, the results suggest that limiting testing to narrowly defined case criteria misses a significant number of cases and thus transmission events.
Sequence Analysis Reveals the Presence of Two Clades of SARS-CoV-2
Putting individual sequences into context is key to understanding SARS-CoV-2 transmission. Sequencing identified n = 139 samples with at least one high-confidence SNV as compared to the reference sequence. Of these, n = 79 (57%) carried the S protein D614G SNV, a mutation implicated in higher pathogenicity of the virus (Becerra-Flores and Cardozo, 2020). Samples carrying the D614G SNV had higher SARS-CoV-2 genome loads as measured by CDC N3-primer directed real-time qRT-PCR for SARS-CoV-2 (p ≤ 0.002 by Wilcoxon signed rank test). A similar, but not significant trend emerged using CDC N1-primer directed real-time RT-qPCR for SARS-CoV-2, but not for total RNA levels as measured by CDC RNase P- directed real-time RT-qPCR (Figures S2M–S2O). Figure 2 A shows the SNV distribution of the data, color-coded by the week of collection. These data include high-confidence SNVs of genomes with <99% coverage, whereas the phylogenetic reconstructions are only based on complete genomes (≥99% coverage) that were submitted to GenBank (and also present in GISAID). This SNV distribution was dominated by isolates representing clade A and some of clade B, the dominant clades in North America and Europe (Forster et al., 2020). The NC stay-at-home order was enacted on March 30, 2020, and the sample collection concluded on April 11, 2020 (i.e., covering a period of unrestrained local spread). The SNV pattern is consistent with the idea that SARS-CoV-2 was introduced into NC by travelers from the continental United States and that this population was in equilibrium with the general population of the United States
Figure 2.

Phylogenetic Analysis
(A) Distribution of high-confidence SNVs across the genome. The genome positions (NC_045512) are on the horizontal axis, and the count of samples are on the vertical axis. Clade-defining SNVs are indicated by GISAID designations.
(B) Neighbor-joining tree of whole SARS-CoV-2 genomes, including the first cases reported in NC (a person returning from Washington [WA] and a person participating in a cruise). The bat coronavirus genome strain RaTG13 was used as an outlier to root the tree. Average nucleotide difference is shown for the two major branches and the difference between SARS and SARS-CoV-2 (0.02).
(C) Neighbor-joining tree based on amino acids for S protein. Support values are listed at the major branch points. The colors indicate geographic origin: NC samples are in blue, Washington State samples, including several independent sequences for SARS-CoV-2/human/USA/WA1/2020 in green, representative other US isolates in black, representative German isolates in gold, and representative Chinese isolates, including NC_045512, in red. Additional genome sequences and protein sequences are from GISAID and GenBank.
Unlike retroviruses, such as human immunodeficiency virus (HIV) or hepatitis C virus, CoVs do not exist as co-existing sequence swarms within a person, since CoVs employ a proofreading RNA-dependent RNA polymerase (Agostini et al., 2018; Graham et al., 2012). Rather, a single variant seems to dominate the transmission events. Consistent with the biology of CoV, this study did not find widespread evidence of minor SNVs. Figure S1B shows the analysis of lower frequency variants (down to 70% frequency). The majority of high-quality (phred score ≥20) SNVs called were present at >90% frequency (n = 1,100). Including SNVs with a frequency of 80%–90% added n = 61 additional variants (5.0%). Including SNVs with a frequency of 70%–80% added an additional 40 variants (3.3%).
One limitation of all targeted sequencing efforts is the large number of PCR amplifications that are conducted to enrich for virus sequences prior to building the library. To explore the effect of amplicon-PCR-induced duplications on sequencing accuracy, we repeated our analysis using only unique reads and obtained the same high-prevalence SNV. Amplicon duplications became prominent at read counts >104.5 (Figure S1B). As the SARS-CoV-2 genome is ∼3 × 10⁴ and the median read length was 204 ± 29 (mean ± SD), this threshold corresponds to ∼200-fold median coverage. This suggests that only deduplicate reads should be used in amplicon sequencing and that requiring extraordinary levels of sequence coverage may introduce a bias of oversampling, which is well recognized in the bacterial 18S sequencing field.
Independently derived consensus genomes from the SARS-CoV-2/human/USA-WA1/2020 isolates showed evidence of divergence between the original isolate, the seed stock, and commercially distributed standard (Figure 2B). Similar culture-associated changes were recently reported for a second, culture-amplified reference isolate, Hong Kong/VM20001061/2020 (GenBank: MT547814). This is not surprising, given that any large-scale virus amplification in culture is accompanied by virus evolution, but it raises concerns about the utility of using a natural isolate, rather than a molecular clone (Graham et al., 2018; Thao et al., 2020), as the standard for sequencing.
The phylogeny based on whole-genome nucleotide sequences revealed several interesting facets. Predictably, all UNC isolates of SARS-CoV-2 were significantly different from SARS-CoV and RaTG13 (Figure 2B, purple). RaTG13 was used as an outgroup for clustering. The first NC case (NC_6999; Figure 2B, arrow labeled “WA”) was a person returning from Washington, and sequence confirmed at the CDC (NC-CDC-6999). It initiated a branch of cases related to the initial isolate SARS-CoV-2/human/CHN/Wuhan-01/2019 (NCBI Accession: NC_045512). The branch of cases (Figure 2B, arrow labeled “cruise”) contains the majority of NC cases, several cases isolated in neighboring Virginia (Figure 2B, black cases), and a cluster of cases reported in Germany (DEU, orange). It also contains several early cases, representing the individual who participated in a cruise.
SARS-CoV entry is determined by the spike protein ORF S, and S is the target of neutralizing antibodies. Figure 2C shows the phylogenetic analysis of the S protein across all samples, the index cases for NC deposited by the NC Department of Health and Human Services, and representative examples from the United States, China, and Germany. Two branches emerged, one containing isolates from China, Washington, and Germany and a second containing United States and German sequences only. Since the S protein is shorter and more conserved across SARS-CoV-2, the limited numbers of SNVs did not support as detailed a lineage mapping as the whole-genome nucleotide sequences.
One large deletion was identified in four independent samples: 14 nt were deleted beginning at position 29745 (indicated in Figure 2C by a delta symbol). This region is within the previously recognized “coronavirus 3′ stem-loop II-like motif (s2m).” This was confirmed in multiple isolates, supported by multiple, independent junction-spanning reads (Figures 3A and 3B). Junctions were mapped to single-nucleotide resolution directly from individual reads. To confirm our deep-sequencing results, we performed 3′ UTR site-specific amplification and Sanger-based sequencing (Figures 3E–3G). The variant 3′ end does not destroy overall folding but introduces a shorter stable hairpin (Figures 3C and 3D). How this mutation affects viral fitness remains to be established.
Figure 3.

Detailed Mapping of the Variant 29745delta14
(A) Reads mapped to the reference sequence NC_045512.
(B) The same reads mapped to an artificial target sequence with the 29745delta14. Blue indicates forward and red reverse reads (all reads are single reads). Red boxes and black bars indicate mismatches at below 20% of reads (red) or above 20% of reads (black). In this alignment, duplicate mapping reads were removed to guard against PCR amplification bias. Genome positions are shown on top (note that after nucleotide 29,745, genome positions are out of sync due to the deletion). Note that this region is within the CoV 3′ stem-loop II-like motif (s2m), annotated in NC_045512 as a prediction based on profile:Rfam-release-14.1:RF00164,Infernal:1.1.2.
(C) Predominant Mfold prediction of the 3′ end of NC_045512 with deletion bases indicated in yellow.
(D) Predominant Mfold prediction of the 3′ end of NC_045512 delta14.
(E) Sequence alignment of 3′ UTR deletion mutants with other representative SARS-CoV-2 isolates.
(F) Sanger sequencing confirmation of the 3′ UTR deletion mutant UNC_200313_2020/2020.
(G) Sanger sequencing confirmation wild-type sequence for isolate UNC_200399_2020/2020.
In sum, this study generated exhaustive SNV information representing the introduction and spread of SARS-CoV-2 across a suburban low-density area in the southern United States All samples were from symptomatic cases, and the majority of genomes clustered with variants that predominate the outbreak in the United States, rather than Europe or China. This supports the notion that the majority of United States cases were generated by domestic transmission.
Discussion
This study demonstrates extensive shedding of SARS-CoV-2 in symptomatic patients among a low-density population in the southeastern United States. It is among the largest sequencing studies that focuses on a suburban and rural community, rather than a crowded city, like New York City. The SNV distribution was consistent with continuous evolution or genetic drift of this new virus through an immunologically naive host population (Consortium, 2004; Fauver et al., 2020; Lu et al., 2020a).
The first reported SARS-CoV-2 case in NC was a person who previously traveled to the state of Washington (03-03-2020, NC State Health Department; GenBank: MT325591). Additional early cases included persons who became infected while onboard a cruise ship (03-12-2020, NC State Health Department). Each of these introduction events was associated with a distinct clade. More recent cases, and cases in neighboring Virginia, were associated with the cruise case. These data support the hypothesis that the majority of cases in NC originate from persons traveling within the United States rather than internationally, reflecting predominant spread by community transmission within the United States (Fauver et al., 2020).
SNV analysis documents the presence of a presumed high-pathogenicity variant D614G in 57% of the cases (Becerra-Flores and Cardozo, 2020; Ceraolo and Giorgi, 2020; Eaaswarkhanth et al., 2020). It is clear that this variant signifies spread within Europe and the continental United States. Within the limitations presented by measuring viral loads within samples collected at unknown times past infection and with presumably differing clinical sampling efficiency, patients with the D614G SNV presented with higher SARS-CoV-2 genome loads. The association of the D614G SNV with specific clinical presentations, distinct biological properties, and high peak titers seems increasingly likely (Zhang et al., 2020). While this article was under review, a large number of studies cemented the importance of the D614G SNV and its biological and clinical properties. Multiple studies demonstrated superior infectivity of D614G-containing viruses or pseudotyped particles (Li et al., 2020b).
Cao et al. reported on a clustering of genomes that harbor a D614G mutation in the S gene (Cao et al., 2020). Their analysis of 489 genomes derived from 32 countries reveals that genomes in clades A2 and A2a harboring the D614G mutation originate mainly from European and several South American countries, different from clade B, which contains genomes from mainland China. This observation is mirrored in the extensive analysis by Korber et al. (2020), which was published while this article was under review. The D614G mutation dominates over the initial human strain defined by the SARS-CoV-2/human/CHN/Wuhan-01/2019 isolate. They observed on average higher genome copy numbers for the D614G isolate, similar to this study, but could not make a conclusive association with clinical outcomes. Several other mutations reportedly accompany the D614G mutation on the S gene and include C214T, C3037T, and the C14408T mutations, and together, these form the globally dominant strain of SARS-CoV-2 (Isabel et al., 2020; Korber et al., 2020). The clade G strain of SARS-CoV-2 was reported in Italy as early as February 2020 (Bartolini et al., 2020; Stefanelli et al., 2020; Zehender et al., 2020). Studies of Russian isolates also have identified D614G, as well as additional mutations (Kozlovskaya et al., 2020). These findings are consistent with ours, as most of the genomes containing the D614G mutation also carry additional mutations defining the G clade. Of the 87 sequences that have the D614G mutation, 69 have the C214T mutation, 15 have the C3037T mutation, and 48 have the C14408T mutation. Given the increasing abundance of D614G SNVs, further research into its role in pathogenicity and clinical outcomes is warranted.
Four samples had the same 14-nt deletion in the 3′ UTR, and no samples had deletions within the coding region. This deletion is 71 nt away from the stop codon of ORF10 (N protein) and eliminates a predicted stem-loop structure. An analogous bulged stem loop at approximately the same location (right after the stop codon) is important for the replication of mouse hepatitis virus. In bovine CoVs, an analogous RNA structure attenuates viral replication (Williams et al., 1999; Züst et al., 2008). There seems to be partial overlap between the bulged stem loop and the pseudoknot, suggesting that these two structures are mutually exclusive and may serve as a switch to regulate the ratio of full-length RNA and defective RNA (Goebel et al., 2004). These two structures are also present in SARS-CoV. These isolates represent full-length genomes from symptomatic patients rather than disjointed RNA fragments recovered after clinical disease had subsided; thus, we speculate that these deletion mutants are replication competent yet have an altered ratio of full-length genomic and defective interfering RNAs. The biological phenotypes of these and other recent SNVs remain to be established in future studies.
There are limitations to our approach. These are similar to other NGS-based phylogeny reconstructions. Sampling was neither randomized nor exhaustive. At this point, we cannot exclude the presence of a founder effect and a disproportional impact of particular populations and situations on this dataset. The unknown group of samples included individuals who were not asymptomatic in a broader sense of being negative for any respiratory symptoms. In the current time of limited personal protective equipment, limited sample kits, and limited testing capacity, it would not have been ethical to divert these resources for random population-wide sequencing. As properly randomized cohort studies become available in the future, the SARS-CoV-2 phylogeny will become more representative of SARS biology and less influenced by sample bias.
Some SNVs may be the result of technical bias. For instance, the 5′ end awaits individual confirmation by RACE; the 3′ end likewise requires RACE for genome finishing. The Nextstrain database (Hadfield et al., 2018) suggests that positions 18,529, 29,849, 29,851, and 29,853 may be subject to PCR or sequencing bias. Lastly, targeted sequencing relies on amplification or hybridization capture. Unless the amplicon PCR primers or capture baits are completely removed, a portion of reads will reflect the sequence that these primers/baits were derived from rather than the sample. Most protocols rely on bioinformatic primer pruning alone. AmpliSeq, in addition to bioinformatic removal, enzymatically digests the targeting primers before library construction. Therefore, the sequences and SNVs reported here could exclusively be attributed to the particular clinical sequence.
This particular sequencing experiment was not designed to identify minority variants, as current whole-genome amplification primer sets do not include unique molecular identifiers (UMIs). UMIs, sometimes called “primer IDs,” have been pioneered for sequencing small regions of the HIV genome (Jabara et al., 2011), and could likewise be applied to SARS-CoV-2.
This study confirmed the sensitivity of current NATs concerning the specific SARS-CoV-2 strains circulating in the region (and the United States). None of the UNC isolates had mutations in the CDC primer binding sites (Lu et al., 2020c). Three European isolates (MT358642, MT358639, and MT318827) had a GGG>AAC polymorphism in the 5′ terminal end of the forward CDC N3 (5′-GGGGAACTTCTCCTGCTAGAAT), which is a CoV consensus primer. Another European isolate (MT35638) had a G>T at 12,725, which is within the nCoV_IP2 forward primer. One European and one Chinese isolate (MT358638 and MT226610) each had a SNV in nCoV_IP2 reverse primer at positions 12,818 and 12,814. As more and more viral genome sequences are generated, more and more SNVs will be recorded, including SNV in qPCR primer and probe binding sites. Currently (May 9, 2020), 2.7% and 0.68% of sequences in GISAID contain SNVs in the CDC primer pairs N1 and N2, respectively. These data should be interpreted with caution, since at this point, little standardization exists as to the quality of SNVs reported, and it is unclear how much a given SNV in one of the primer binding sites affects assay performance. Not all mutations in a primer binding site result in catastrophic failure or significant loss of sensitivity (Hilscher et al., 2005), which is defined as the sum of all steps in the assay pipeline, including, e.g., proper sample collection of the patient. Periodic retesting of positive and negative samples by whole-genome NGS represents an option to increase sensitivity and specificity and detect any variants emerging in the populations, which may escape detection by NAT.
Testing by sequencing represents an interesting alternative to NAT in the case of CoVs, which are present at very high genome copy numbers during days of active shedding (Wölfel et al., 2020; Yu et al., 2020). Testing by SARS-CoV-2 targeted sequencing had perfect specificity but lower sensitivity than qPCR (Sellers et al., 2020). Sequence coverage correlated with viral load. The lower sensitivity was expected, as real-time qPCR amplicons can be placed anywhere on the target genome and optimized for sensitivity (Corman et al., 2020); shorter amplicons (<100 bp) maximize sensitivity as compared to larger amplicons (>200 bp) (Hilscher et al., 2005; Lock et al., 2010). By contrast, NGS represents a compromise, as the entire viral genome has to be covered with primers that are part of a common pool. Primer design is governed by compatibility under a single set of conditions (annealing temperature) as much as by individual efficiency. The ARTIC network protocol uses n = 96 larger amplicons (https://artic.network/ncov-2019). By comparison, the AmpliSeq protocol deployed here uses n = 237 amplicons of size 204 ± 29 (mean ± SD) (i.e., twice as many and substantially shorter amplicons with expected higher sensitivity). In sum, testing by sequencing represents a suitable, albeit expensive, tool for COVID-19 diagnosis.
Approximately half of the specimens not clinically tested for SARS-CoV-2 had a positive result by sequencing. This was not surprising, as to this day, testing capabilities are limited and probable cases are triaged based on clinical and public health indications. These unknown cases were not asymptomatic but represent patients with a clinically indicated need for upper respiratory sampling. Finding additional SARS-CoV-2 cases in this population suggests that case counts based on NAT represent a lower estimate of SARS-CoV-2 prevalence. It may also suggest that the current triage criteria for SARS-CoV-2 testing are too limited to understand spread of this virus. In sum, this study underscores the sensitivity and accuracy of current NAT assays and demonstrates the utility of testing by sequencing. It contributes to the worldwide effort to understand and combat the COVID-19 pandemic by providing an extensive set of full-length SARS-CoV-2 genomes from a non-urban setting.
STAR★Methods
Key Resources Table
| REAGENT or RESOURCE | SOURCE | IDENTIFIER |
|---|---|---|
| Bacterial and Virus Strains | ||
| 2019-nCoV | N/A | N/A |
| Chemicals, Peptides, and Recombinant Proteins | ||
| rDNase | Macherey-Nagel | 740963 |
| DTT, No-Weigh | Fisher Scientific | A39255 |
| T4 Gene 32 Protein | New England Biolabs | M0300L |
| RNase H | Life Technologies | AM2293 |
| 1X GIBCO PBS | Life Technologies | 14190-144 |
| 5.1 SYBR Select Master Mix | Thermo Fisher | 4472920 |
| Ion AmpliSeq Chef Reagents DL8 | Thermo Fisher | A29025 |
| Ion AmpliSeq Chef Solutions DL8 | Thermo Fisher | A29026 |
| Ion AmpliSeq Chef Supplies DL8 | Thermo Fisher | A29027 |
| Ion S5 Chef Supplies | Thermo Fisher | A27755 |
| Ion S5 Chef Solutions | Thermo Fisher | A27754 |
| Ion 510 and Ion 520 and Ion 530 Chef Reagents | Thermo Fisher | A34018 |
| Ion S5 Sequencing Solutions | Thermo Fisher | A27767 |
| Ion S5 Sequencing Reagents | Thermo Fisher | A27768 |
| Critical Commercial Assays | ||
| MagNA Pure Compact Nucleic Acid Isolation Kit – Large Volume | Roche | 4729757001 |
| NucleoSpin Virus | Macherey-Nagel | 740983.5 |
| High-Capacity cDNA Reverse Transcription Kit | Life Technologies | 4374967 |
| Deposited Data | ||
| R code for analysis | This paper | http://bitbucket.org/account/signin/?next=/dittmerlab/vironomicscovidunc.git |
| SARS-CoV-2 sequence reads | This paper | PRJNA639551 |
| SARS-CoV-2 sequence reads | This paper | PRJNA633048 |
| Oligonucleotides | ||
| Primer 2019-nCoV_N1-F GAC CCC AAA ATC AGC GAA AT | Life Technologies | Custom |
| Primer 2019-nCoV_N1-R TCTGGTTACTGCCAGTTGAATCTG | Life Technologies | Custom |
| 2019-nCoV_N1_Oligo GACCCCAAAATCAGCGAAATACCCCG CATTACGTTTGGTGGACCCAGATTCA ACTGGCAGTAACCAGA |
Life Technologies | Custom |
| RNase Primer P-F AGATTTGGACCTGCGAGCG | Life Technologies | Custom |
| RNase Primer P-R GAGCGGCTGTCTCCACAAGT | Life Technologies | Custom |
| Software and Algorithms | ||
| R Version 3.6 | The R Project for Statistical Computing | https://www.r-project.org |
| CLC Genomics Workbench Version 11 | QIAGEN | https://digitalinsights.qiagen.com |
| Geneious Prime 2019 Version 2.3 | Geneious | https://www.geneious.com |
| BBduk Version 37.36 | Joint Genome Institute | https://jgi.doe.gov |
| MEGA X | Molecular Evolutionary Genetics Analysis | https://www.megasoftware.net/home |
| Freedom Evoware | Tecan | EVOWARE20 |
| Other | ||
| IonCode 0101-0132 in 96 Well PCR Plates | Thermo Fisher | A29028 |
| 0.2 ml tubes 8-tube strip with caps | USA Scientific | 1402-4700 |
| 0.2 ml tubes 12-tube strip with caps | USA Scientific | 1402-2400 |
| 0.2 ml 96 well PCR plate | USA Scientific | 1402-9300 |
| Thermal Cycler | ThermoFisher | 4375786 |
| 5.4. LightCycler® 480 Sealing Foil | Roche | 4729757001 |
| Lightcycler 480 SW 1.5 | Roche | 5015278001 |
| Lightcylcer 480 384-well qPCR plates | Roche | 4729749001 |
| MagNA Pure Compact Instrument | Roche | 3731146001 |
Resource Availability
Lead Contact
Further information and requests for resources and reagents should be directed to and will be fulfilled by Melissa Miller (Melissa.miller@unchealth.unc.edu), and Dirk Dittmer (dirkdittmer@me.com).
Materials Availability
Complete SARS-CoV-2 genomes meeting the confidence criteria elaborated on below were uploaded to GenBank and contributed to GISAID (GISAID, 2020). Other sequences, including index cases in the state of North Carolina, as deposited by the State Health Department were provided by GISAID. Other materials are listed in the Key Resources Table of this manuscript.
Data and Code Availability
All sequence mapping algorithms and codes are publicly accessible, listed in detail below, or available using the CLC Genomics Workbench V 2.0 (QIAGEN Inc.). R code that was used for data analysis is located on an accessible bit bucket folder https://bitbucket.org/dittmerlab/unc_covid_ampliseq/. SARS-CoV-2 RNAseq positive control sequence reads (Supplemental Figures S1A-S1D) were uploaded under Bioproject PRJNA639551, PRJNA633048. All custom coding is available upon request through the Lead Contact information above.
Experimental Model and Subject Details
This study used remnant samples of universal transport media (UTM) from provider-collected deep nasopharyngeal (NP) swabs (https://www.cdc.gov/coronavirus/2019-ncov/lab/guidelines-clinical-specimens.html) after their clinical purpose had been completed. The SARS-CoV-2 status of each sample was determined by a clinical NAT approved under EUA at The University of North Carolina at Chapel Hill Medical Center (UNCMC) McLendon Clinical laboratories. None of the samples carried any identifiers other than the date of testing. Hence, this research was considered part of the QA/QC effort to support clinical testing and classified as non-human subject research by local IRB.
Method Details
RNA isolation
250 μL of virus transport medium (VTM) from flocked NP swabs were adjusted to 1.0 mL with 0.1% Triton X-100 (proteomics grade, VWR: 97063-864) diluted in 1X phosphate-buffered saline (PBS, Life Technologies, Catalog # 14190-144). Samples were incubated at room temperature for 30 minutes in a 2.0 mL screw cap tube (Genesee # 21-265), vortexing every 5 minutes for 15 s pulses. 200 μL of the permeabilized sample was then processed using the Machery-Nagel NucleoSpin Virus kit (Macherey-Nagel, Catalog # 740983.50 and 740983.250). Carrier RNA (poly-A salt) was added to the mixture to a final concentration of 9 ng/μL. DNase digestion was performed post-column binding (Macherey-Nagel, Catalog #740963) at room temperature for 5 minutes at a final concentration of 40 ng/μL. RNA was eluted from the column using 60 μL of RNase-free water pre-heated to 70 °C. For each processing batch, a negative reagent control and a negative cell pellet control was used. The reagent control consisted of 250 μL of 1X PBS instead of 250 μL of the sample in UTM. The cell pellet controls used were stored at −80 °C before the emergence of SARS-CoV-2. The total number of cells used per negative control was 106 and were treated identically and concurrently to the UTM and reagent control processed samples. The 60 μL of eluted RNA was processed for sequencing and viral load as described below.
Real-time qPCR
Relative viral genome copy number was ascertained by real-time qPCR using primers and procedures established by the CDC (Lu et al., 2020c). 30 μL input RNA was subjected to hexamer-primed reverse transcription. 9 μl cDNA was used for qPCR containing 125 nM for each primer and SYBR green as the method of detection on a Roche LC480II Lightcycler and crossing point (CP) values determined by an automated threshold method.
Next-Generation Sequencing
As a positive control, we used Genomic RNA from SARS-Related Coronavirus 2, Isolate USA-WA1/2020, as provided by BEI/ATCC. This reagent was deposited by the Centers for Disease Control and Prevention and obtained through BEI Resources, NIAID, NIH: NR-52285. All samples were sequenced using random hexamer/dT priming as provided by the Thermo SARS-CoV-2 AmpliSeq kit according to manufacturer’s recommendations on an IonTorrent Chef and IonTorrent S5 sequencer. The amplicons are tightly tiled and overlapping. Amplicon sizes ranged between 68 and 232 nucleotides after trimming of low-quality sequences and all primer sequences (125-275 before trimming).
Cloning and Sanger sequencing of 5′UTR stem-loop deletion PCR amplification
Multiple primer pairs were designed on Benchling (https://www.benchling.com) that flanked the deletion in the 3′UTR at position 29321-29845 of the SARS-CoV-2 reference genome (NC_045512): Primer 1 forward: AGGGAGGACTTGAAAGAGCC, reverse: GGGCTCTTCCATATAGGCAG; Primer 2 forward: CTCGTAACTACATAGCACAAGTAGTG, reverse: ATCACATGGGGATAGCACTACTA; Primer 3 forward: CGTTTTCGCTTTTCCGTT, reverse: TCACATGGGGATAGCACTACT; Primer 4 forward: GCAATCTTTAATCAGTGTAACATTAG, reverse: GCTCTTCCATATAGGCAGCTC; Primer 5 forward: ATTGGCATGGAAGTCACACC, reverse: GCTCTTCCATATAGGCAGCTC. Next 10μL of the extracted cDNA was amplified in a 50μL PCR reaction. Reaction mixtures contained 25μL of 2X GoTaq Promega Master mix (#M712C), 2.5μL primers (0.5μM), and brought to volume with nuclease-free water. The PCR was performed with an initial denaturation step a 95°C for 2 minutes, the PCR cycled at 95°C for 30 s, 56°C for 1 minute, and 73°C for 1 minute for 40 cycles, followed by a final extension at 73°C for 10 minutes and a 4°C hold. The annealing temperature was derived from the primer pair melting temperatures. Primer PCR products were visualized on a 1.5% agarose gels and PCR bands were gel purified using the QIAGEN Gel Purification Kit (QIAGEN Inc.). Purified DNA was eluted in 30μL nuclease-free water and PCR products were cloned using TOPO-TA for sequencing, transformed in the supplied One Shot Top 10 E. coli competent cells (Invitrogen, #K457540). Multiple clones from multiple PCR reactions for each case were confirmed by Sanger Sequencing (Genewiz Inc.). Sequences were aligned to the deleted and wild-type consensus sequence on CLC Genomics Workbench v.20 (QIAGEN Inc.).
Bioinformatic analysis
Following primer trimming according to the manufacturer’s recommendations, additional, custom steps were added. Specifically, all sequences were quality trimmed using the bbduk script (arguments: qtrim = rl trimq = 20 maq = 20 minlen = 40 tpe tbo) from bbmap version 37.36. Each trimmed sequence was analyzed using CLC Genomics Workbench version 11.0. The trimmed reads were mapped to the SARS-COV-2 reference sequence isolate SARS-CoV-2/human/CHN/Wuhan-01/2019 (NCBI Accession: NC_045512). From each mapping, the following was collected: a consensus sequence, sequence variants, and mapping coverage. The consensus sequence was extracted from the mapping by quality voting. Regions at or below a coverage threshold of 3 were considered low coverage and N’s were inserted for ambiguity.
SNV were called using the CLC bio algorithm (QIAGEN Inc.) for human genome SNV calling. The threshold for reporting was set at > 90% frequency and a minimum coverage of 10-fold with balanced forward and reverse reads for all SNV.
Targeted regions were determined via Thermo SARS-CoV-2 designed BED file and sequences with 1x coverage across more than 99% of the 237 SARS-COV-2 amplicons were considered complete sequences. Any sequences with 1x coverage between 5% and 99% were considered partial genomes. Partial genomes are included in the variant calling analysis but were not submitted to GenBank or GISAID.
All consensus sequences derived from this study were manually curated to revert poly-nucleotide-tract mutations to the reference sequence.
Phylogenetic reconstruction
Full-length, viral genome consensus sequences were aligned using MAFFT (Katoh and Standley, 2013) with a PAM200 / k = 2 scoring matrix, gap open penalty of 1.53 and offset value of 0.123 as implemented in Genious (Genious Ltd) using n = 92 sequences. A neighbor-joining tree was constructed using Genious Tree Builder (Genious Ltd) with bat coronavirus strain RaTG13 (GenBank: MN996532) as an outgroup. The number of bootstrap replicates was 1,000 with a support threshold of > 50%. S protein sequences were analyzed using MEGA X version 10.1.7 (Kumar et al., 2018). Specifically, evolutionary history was inferred using the Neighbor-Joining method (Saitou and Nei, 1987). The optimal tree with the sum of branch length = 0.6557 is shown. The percentage of replicate trees in which the associated taxa clustered together in the bootstrap test (800 replicates) are shown next to the branches. The evolutionary distances were computed using the Maximum Composite Likelihood method (Tamura et al., 2004) and are in the units of the number of base substitutions per site. The rate variation among sites was modeled with a gamma distribution (shape parameter = 1). This analysis involved 96 nucleotide sequences. Codon positions included were 1st+2nd+3rd+Noncoding. All positions with less than 95% site coverage were eliminated, i.e., fewer than 5% alignment gaps, missing data, and ambiguous bases were allowed at any position (partial deletion option). There were 3,822 positions in the final dataset. Further sequences, including the NC index cases, as deposited by the State Health Department were provided by GISAID (GISAID, 2020).
Quantification and Statistical Analysis
Further statistical analysis and visualization was conducted using R v 4.0.0. The code is available on bitbucket.
Acknowledgments
This work was funded by NIH public health service grants CA016086, CA019014, and CA239583 to D.P.D. Funding was also provided by the University Cancer Research Fund and the UNC School of Medicine. This project was supported by the North Carolina Policy Collaboratory at UNC with funding from the North Carolina Coronavirus Relief Fund established and appropriated by the North Carolina General Assembly. The authors would like to thank all the members of the Damania and Dittmer labs, Corbin Jones, and Nicole Fischer for critical reading, comments, and suggestions. We also thank the participants and the nurses and physicians at the UNC Pulmonary Intensive Care Unit and Department of Infectious Diseases who, in addition to their heroic patient care, ensure that de-identified excess samples are available for discovery research and rapidly validating novel diagnostic approaches.
Author Contributions
Conceptualization, M.B.M., D.P.D., and B.D.; Methodology, R.P.M., C.C.-V., J.T.L., R.M., L.J.P., A.B.E., C.T., F.C.S.V., J.S., M.B.M., and D.P.D.; Software, J.T.L., R.M., A.B., and L.J.P.; Validation, R.P.M., C.C.-V., J.T.L., R.M., L.J.P., F.C.S.V., M.B.M., and D.P.D.; Formal Analysis, R.P.M., C.C.-V., J.T.L., R.M., M.B.M., and D.P.D.; Investigation, R.P.M., C.C.-V., J.T.L., R.M., A.B.E., C.T., F.C.S.V., P.T.L., J.P.W., Y.Z., A.J., J.O.M., T.C., G.B., R.R.-S., D.L.C., B.D., M.B.M., and D.P.D.; Resources, B.D., M.B.M., and D.P.D.; Data Curation, J.T.L., R.M., A.B., W.V., M.B.M., and D.P.D.; Writing – Original Draft, R.P.M., C.C.-V., J.T.L., R.M., R.S.B., B.D., M.B.M., and D.P.D.; Writing – Review & Editing, R.P.M., C.C.V., J.T.L., R.M., R.S.B., B.D., M.B.M., and D.P.D.; Visualization, R.P.M., C.C.-V., J.T.L., R.M., and D.P.D.; Supervision, B.D., M.B.M., and D.P.D.; Project Administration, M.B.M. and D.P.D.; Funding Acquisition, B.D., M.B.M., and D.P.D.
Declaration of Interests
M.B.M. serves on the advisory boards for Curetis, Luminex Molecular Diagnostics, Cepheid, BioFire Diagnostics, and QIAGEN and as a consultant to Shield Diagnostics.
Published: October 20, 2020
Footnotes
Supplemental Information can be found online at https://doi.org/10.1016/j.celrep.2020.108352.
Supplemental Information
References
- Agostini M.L., Andres E.L., Sims A.C., Graham R.L., Sheahan T.P., Lu X., Smith E.C., Case J.B., Feng J.Y., Jordan R., et al. Coronavirus susceptibility to the antiviral remdesivir (GS-5734) is mediated by the viral polymerase and the proofreading exoribonuclease. MBio. 2018;9:e00221-18. doi: 10.1128/mBio.00221-18. [DOI] [PMC free article] [PubMed] [Google Scholar]
- Andersen K.G., Rambaut A., Lipkin W.I., Holmes E.C., Garry R.F. The proximal origin of SARS-CoV-2. Nat. Med. 2020;26:450–452. doi: 10.1038/s41591-020-0820-9. [DOI] [PMC free article] [PubMed] [Google Scholar]
- Arons M.M., Hatfield K.M., Reddy S.C., Kimball A., James A., Jacobs J.R., Taylor J., Spicer K., Bardossy A.C., Oakley L.P., et al. Public Health–Seattle and King County and CDC COVID-19 Investigation Team Presymptomatic SARS-CoV-2 infections and transmission in a skilled nursing Facility. N. Engl. J. Med. 2020;382:2081–2090. doi: 10.1056/NEJMoa2008457. [DOI] [PMC free article] [PubMed] [Google Scholar]
- Bartolini B., Rueca M., Gruber C.E.M., Messina F., Carletti F., Giombini E., Lalle E., Bordi L., Matusali G., Colavita F., et al. SARS-CoV-2 phylogenetic analysis, Lazio Region, Italy, February-March 2020. Emerg. Infect. Dis. 2020;26:1842–1845. doi: 10.3201/eid2608.201525. [DOI] [PMC free article] [PubMed] [Google Scholar]
- Becerra-Flores M., Cardozo T. SARS-CoV-2 viral spike G614 mutation exhibits higher case fatality rate. Int. J. Clin. Pract. 2020:e13525. doi: 10.1111/ijcp.13525. [DOI] [PMC free article] [PubMed] [Google Scholar]
- Bhatraju P.K., Ghassemieh B.J., Nichols M., Kim R., Jerome K.R., Nalla A.K., Greninger A.L., Pipavath S., Wurfel M.M., Evans L., et al. Covid-19 in critically ill patients in the Seattle region: case series. N. Engl. J. Med. 2020;382:2012–2022. doi: 10.1056/NEJMoa2004500. [DOI] [PMC free article] [PubMed] [Google Scholar]
- Cao C., Huang L., Liu K., Ma K., Tian Y., Qin Y., Sun H., Ding W., Gui L., Wu P. Amino acid variation analysis of surface spike glycoprotein at 614 in SARS-CoV-2 strains. Genes Dis. 2020 doi: 10.1016/j.gendis.2020.05.006. Published online June 2, 2020. [DOI] [PMC free article] [PubMed] [Google Scholar]
- CDC COVID-19 Response Team Coronavirus disease 2019 in children—United States, February 12–April 2, 2020. MMWR Morb. Mortal. Wkly. Rep. 2020;69:422–426. doi: 10.15585/mmwr.mm6914e4. [DOI] [PMC free article] [PubMed] [Google Scholar]
- Ceraolo C., Giorgi F.M. Genomic variance of the 2019-nCoV coronavirus. J. Med. Virol. 2020;92:522–528. doi: 10.1002/jmv.25700. [DOI] [PMC free article] [PubMed] [Google Scholar]
- Chen N., Zhou M., Dong X., Qu J., Gong F., Han Y., Qiu Y., Wang J., Liu Y., Wei Y., et al. Epidemiological and clinical characteristics of 99 cases of 2019 novel coronavirus pneumonia in Wuhan, China: a descriptive study. Lancet. 2020;395:507–513. doi: 10.1016/S0140-6736(20)30211-7. [DOI] [PMC free article] [PubMed] [Google Scholar]
- Consortium C.S.M.E., Chinese SARS Molecular Epidemiology Consortium Molecular evolution of the SARS coronavirus during the course of the SARS epidemic in China. Science. 2004;303:1666–1669. doi: 10.1126/science.1092002. [DOI] [PubMed] [Google Scholar]
- Corman V.M., Landt O., Kaiser M., Molenkamp R., Meijer A., Chu D.K., Bleicker T., Brünink S., Schneider J., Schmidt M.L., et al. Detection of 2019 novel coronavirus (2019-nCoV) by real-time RT-PCR. Euro Surveill. 2020;25 doi: 10.2807/1560-7917.ES.2020.25.3.2000045. [DOI] [PMC free article] [PubMed] [Google Scholar]
- Coronaviridae Study Group of the International Committee on Taxonomy of Viruses The species Severe acute respiratory syndrome-related coronavirus: classifying 2019-nCoV and naming it SARS-CoV-2. Nat. Microbiol. 2020;5:536–544. doi: 10.1038/s41564-020-0695-z. [DOI] [PMC free article] [PubMed] [Google Scholar]
- Eaaswarkhanth M., Al Madhoun A., Al-Mulla F. Could the D614G substitution in the SARS-CoV-2 spike (S) protein be associated with higher COVID-19 mortality? Int. J. Infect. Dis. 2020;96:459–460. doi: 10.1016/j.ijid.2020.05.071. [DOI] [PMC free article] [PubMed] [Google Scholar]
- Fauver J.R., Petrone M.E., Hodcroft E.B., Shioda K., Ehrlich H.Y., Watts A.G., Vogels C.B.F., Brito A.F., Alpert T., Muyombwe A., et al. Coast-to-coast spread of SARS-CoV-2 during the early epidemic in the United States. Cell. 2020;181:990–996.e5. doi: 10.1016/j.cell.2020.04.021. [DOI] [PMC free article] [PubMed] [Google Scholar]
- Forster P., Forster L., Renfrew C., Forster M. Phylogenetic network analysis of SARS-CoV-2 genomes. Proc. Natl. Acad. Sci. USA. 2020;117:9241–9243. doi: 10.1073/pnas.2004999117. [DOI] [PMC free article] [PubMed] [Google Scholar]
- GISAID . 2020. Genomic epidemiology of hCoV-19.https://www.gisaid.org/epiflu-applications/phylodynamics/ [Google Scholar]
- Goebel S.J., Hsue B., Dombrowski T.F., Masters P.S. Characterization of the RNA components of a putative molecular switch in the 3′ untranslated region of the murine coronavirus genome. J. Virol. 2004;78:669–682. doi: 10.1128/JVI.78.2.669-682.2004. [DOI] [PMC free article] [PubMed] [Google Scholar]
- Graham R.L., Becker M.M., Eckerle L.D., Bolles M., Denison M.R., Baric R.S. A live, impaired-fidelity coronavirus vaccine protects in an aged, immunocompromised mouse model of lethal disease. Nat. Med. 2012;18:1820–1826. doi: 10.1038/nm.2972. [DOI] [PMC free article] [PubMed] [Google Scholar]
- Graham R.L., Deming D.J., Deming M.E., Yount B.L., Baric R.S. Evaluation of a recombination-resistant coronavirus as a broadly applicable, rapidly implementable vaccine platform. Commun. Biol. 2018;1:179. doi: 10.1038/s42003-018-0175-7. [DOI] [PMC free article] [PubMed] [Google Scholar]
- Guan W.J., Ni Z.Y., Hu Y., Liang W.H., Ou C.Q., He J.X., Liu L., Shan H., Lei C.L., Hui D.S.C., et al. China Medical Treatment Expert Group for Covid-19 Clinical characteristics of coronavirus disease 2019 in China. N. Engl. J. Med. 2020;382:1708–1720. doi: 10.1056/NEJMoa2002032. [DOI] [PMC free article] [PubMed] [Google Scholar]
- Hadfield J., Megill C., Bell S.M., Huddleston J., Potter B., Callender C., Sagulenko P., Bedford T., Neher R.A. Nextstrain: real-time tracking of pathogen evolution. Bioinformatics. 2018;34:4121–4123. doi: 10.1093/bioinformatics/bty407. [DOI] [PMC free article] [PubMed] [Google Scholar]
- He X., Lau E.H.Y., Wu P., Deng X., Wang J., Hao X., Lau Y.C., Wong J.Y., Guan Y., Tan X., et al. Temporal dynamics in viral shedding and transmissibility of COVID-19. Nat. Med. 2020;26:672–675. doi: 10.1038/s41591-020-0869-5. [DOI] [PubMed] [Google Scholar]
- Hijnen D., Marzano A.V., Eyerich K., GeurtsvanKessel C., Giménez-Arnau A.M., Joly P., Vestergaard C., Sticherling M., Schmidt E. SARS-CoV-2 transmission from presymptomatic meeting attendee, Germany. Emerg. Infect. Dis. 2020;26:1935–1937. doi: 10.3201/eid2608.201235. [DOI] [PMC free article] [PubMed] [Google Scholar]
- Hilscher C., Vahrson W., Dittmer D.P. Faster quantitative real-time PCR protocols may lose sensitivity and show increased variability. Nucleic Acids Res. 2005;33:e182. doi: 10.1093/nar/gni181. [DOI] [PMC free article] [PubMed] [Google Scholar]
- Hoffmann M., Kleine-Weber H., Schroeder S., Kruger N., Herrler T., Erichsen S., Schiergens T.S., Herrler G., Wu N.H., Nitsche A., et al. SARS-CoV-2 cell entry depends on ACE2 and TMPRSS2 and is blocked by a clinically proven protease inhibitor. Cell. 2020;181:271–280.e278. doi: 10.1016/j.cell.2020.02.052. [DOI] [PMC free article] [PubMed] [Google Scholar]
- Isabel S., Graña-Miraglia L., Gutierrez J.M., Bundalovic-Torma C., Groves H.E., Isabel M.R., Eshaghi A., Patel S.N., Gubbay J.B., Poutanen T., et al. Evolutionary and structural analyses of SARS-CoV-2 D614G spike protein mutation now documented worldwide. Sci. Rep. 2020;10:14031. doi: 10.1038/s41598-020-70827-z. [DOI] [PMC free article] [PubMed] [Google Scholar]
- Jabara C.B., Jones C.D., Roach J., Anderson J.A., Swanstrom R. Accurate sampling and deep sequencing of the HIV-1 protease gene using a Primer ID. Proc. Natl. Acad. Sci. USA. 2011;108:20166–20171. doi: 10.1073/pnas.1110064108. [DOI] [PMC free article] [PubMed] [Google Scholar]
- Jaimes J.A., André N.M., Chappie J.S., Millet J.K., Whittaker G.R. Phylogenetic analysis and structural modeling of SARS-CoV-2 spike protein reveals an evolutionary distinct and proteolytically sensitive activation loop. J. Mol. Biol. 2020;432:3309–3325. doi: 10.1016/j.jmb.2020.04.009. [DOI] [PMC free article] [PubMed] [Google Scholar]
- Katoh K., Standley D.M. MAFFT multiple sequence alignment software version 7: improvements in performance and usability. Mol. Biol. Evol. 2013;30:772–780. doi: 10.1093/molbev/mst010. [DOI] [PMC free article] [PubMed] [Google Scholar]
- Kim Y.I., Kim S.G., Kim S.M., Kim E.H., Park S.J., Yu K.M., Chang J.H., Kim E.J., Lee S., Casel M.A.B., et al. Infection and rapid transmission of SARS-CoV-2 in ferrets. Cell Host Microbe. 2020;27:704–709.e702. doi: 10.1016/j.chom.2020.03.023. [DOI] [PMC free article] [PubMed] [Google Scholar]
- Korber B., Fischer W.M., Gnanakaran S., Yoon H., Theiler J., Abfalterer W., Hengartner N., Giorgi E.E., Bhattacharya T., Foley B., et al. Tracking changes in SARS-CoV-2 spike: evidence that D614G increases infectivity of the COVID-19 virus. Cell. 2020;182:812–827.e819. doi: 10.1016/j.cell.2020.06.043. [DOI] [PMC free article] [PubMed] [Google Scholar]
- Kozlovskaya L., Piniaeva A., Ignatyev G., Selivanov A., Shishova A., Kovpak A., Gordeychuk I., Ivin Y., Berestovskaya A., Prokhortchouk E., et al. Isolation and phylogenetic analysis of SARS-CoV-2 variants collected in Russia during the COVID-19 outbreak. Int. J. Infect. Dis. 2020;99:40–46. doi: 10.1016/j.ijid.2020.07.024. [DOI] [PMC free article] [PubMed] [Google Scholar]
- Kumar S., Stecher G., Li M., Knyaz C., Tamura K. MEGA X: molecular evolutionary genetics analysis across computing platforms. Mol. Biol. Evol. 2018;35:1547–1549. doi: 10.1093/molbev/msy096. [DOI] [PMC free article] [PubMed] [Google Scholar]
- Letko M., Marzi A., Munster V. Functional assessment of cell entry and receptor usage for SARS-CoV-2 and other lineage B betacoronaviruses. Nat. Microbiol. 2020;5:562–569. doi: 10.1038/s41564-020-0688-y. [DOI] [PMC free article] [PubMed] [Google Scholar]
- Li Q., Guan X., Wu P., Wang X., Zhou L., Tong Y., Ren R., Leung K.S.M., Lau E.H.Y., Wong J.Y., et al. Early transmission dynamics in Wuhan, China, of novel coronavirus-infected pneumonia. N. Engl. J. Med. 2020;382:1199–1207. doi: 10.1056/NEJMoa2001316. [DOI] [PMC free article] [PubMed] [Google Scholar]
- Li Q., Wu J., Nie J., Zhang L., Hao H., Liu S., Zhao C., Zhang Q., Liu H., Nie L., et al. The impact of mutations in SARS-CoV-2 spike on viral infectivity and antigenicity. Cell. 2020;182:1284–1294.e9. doi: 10.1016/j.cell.2020.07.012. [DOI] [PMC free article] [PubMed] [Google Scholar]
- Lock E.F., Ziemiecke R., Marron J., Dittmer D.P. Efficiency clustering for low-density microarrays and its application to QPCR. BMC Bioinformatics. 2010;11:386. doi: 10.1186/1471-2105-11-386. [DOI] [PMC free article] [PubMed] [Google Scholar]
- Long Q.X., Liu B.Z., Deng H.J., Wu G.C., Deng K., Chen Y.K., Liao P., Qiu J.F., Lin Y., Cai X.F., et al. Antibody responses to SARS-CoV-2 in patients with COVID-19. Nat. Med. 2020;26:845–848. doi: 10.1038/s41591-020-0897-1. [DOI] [PubMed] [Google Scholar]
- Lu J., du Plessis L., Liu Z., Hill V., Kang M., Lin H., Sun J., Francois S., Kraemer M.U.G., Faria N.R., et al. Genomic epidemiology of SARS-CoV-2 in Guangdong Province, China. Cell. 2020;181:997–1003.e1009. doi: 10.1016/j.cell.2020.04.023. [DOI] [PMC free article] [PubMed] [Google Scholar]
- Lu R., Zhao X., Li J., Niu P., Yang B., Wu H., Wang W., Song H., Huang B., Zhu N., et al. Genomic characterisation and epidemiology of 2019 novel coronavirus: implications for virus origins and receptor binding. Lancet. 2020;395:565–574. doi: 10.1016/S0140-6736(20)30251-8. [DOI] [PMC free article] [PubMed] [Google Scholar]
- Lu X., Wang L., Sakthivel S.K., Whitaker B., Murray J., Kamili S., Lynch B., Malapati L., Burke S.A., Harcourt J., et al. US CDC real-time reverse transcription PCR panel for detection of severe acute respiratory syndrome coronavirus 2. Emerg. Infect. Dis. 2020;26 doi: 10.3201/eid2608.201246. [DOI] [PMC free article] [PubMed] [Google Scholar]
- Petrackova A., Vasinek M., Sedlarikova L., Dyskova T., Schneiderova P., Novosad T., Papajik T., Kriegova E. Standardization of sequencing coverage depth in NGS: recommendation for detection of clonal and subclonal mutations in cancer diagnostics. Front. Oncol. 2019;9:851. doi: 10.3389/fonc.2019.00851. [DOI] [PMC free article] [PubMed] [Google Scholar]
- Saitou N., Nei M. The neighbor-joining method: a new method for reconstructing phylogenetic trees. Mol. Biol. Evol. 1987;4:406–425. doi: 10.1093/oxfordjournals.molbev.a040454. [DOI] [PubMed] [Google Scholar]
- Sellers S.A., Dover K.L., Bailey A.G., Cheves A., Eason A.B., Popowitch E.B., Miller M.B., Wohl D.A., Dittmer D.P., Fischer W.A. Burden of respiratory viral infection in persons with human immunodeficiency virus. Influenza Other Respir. Viruses. 2020;14:465–469. doi: 10.1111/irv.12734. [DOI] [PMC free article] [PubMed] [Google Scholar]
- Shang J., Ye G., Shi K., Wan Y., Luo C., Aihara H., Geng Q., Auerbach A., Li F. Structural basis of receptor recognition by SARS-CoV-2. Nature. 2020;581:221–224. doi: 10.1038/s41586-020-2179-y. [DOI] [PMC free article] [PubMed] [Google Scholar]
- Shu Y., McCauley J. GISAID: global initiative on sharing all influenza data: from vision to reality. Euro Surveill. 2017;22:30494. doi: 10.2807/1560-7917.ES.2017.22.13.30494. [DOI] [PMC free article] [PubMed] [Google Scholar]
- Stefanelli P., Faggioni G., Lo Presti A., Fiore S., Marchi A., Benedetti E., Fabiani C., Anselmo A., Ciammaruconi A., Fortunato A., et al. On Behalf Of Iss Covid-Study Group Whole genome and phylogenetic analysis of two SARS-CoV-2 strains isolated in Italy in January and February 2020: additional clues on multiple introductions and further circulation in Europe. Euro Surveill. 2020;25 doi: 10.2807/1560-7917.ES.2020.25.13.2000305. [DOI] [PMC free article] [PubMed] [Google Scholar]
- Tamura K., Nei M., Kumar S. Prospects for inferring very large phylogenies by using the neighbor-joining method. Proc. Natl. Acad. Sci. USA. 2004;101:11030–11035. doi: 10.1073/pnas.0404206101. [DOI] [PMC free article] [PubMed] [Google Scholar]
- Thao T.T.N., Labroussaa F., Ebert N., V’kovski P., Stalder H., Portmann J., Kelly J., Steiner S., Holwerda M., Kratzel A., et al. Rapid reconstruction of SARS-CoV-2 using a synthetic genomics platform. Nature. 2020;582:561–565. doi: 10.1038/s41586-020-2294-9. [DOI] [PubMed] [Google Scholar]
- van Doremalen N., Bushmaker T., Morris D.H., Holbrook M.G., Gamble A., Williamson B.N., Tamin A., Harcourt J.L., Thornburg N.J., Gerber S.I., et al. Aerosol and surface stability of SARS-CoV-2 as compared with SARS-CoV-1. N. Engl. J. Med. 2020;382:1564–1567. doi: 10.1056/NEJMc2004973. [DOI] [PMC free article] [PubMed] [Google Scholar]
- van Dorp L., Acman M., Richard D., Shaw L.P., Ford C.E., Ormond L., Owen C.J., Pang J., Tan C.C.S., Boshier F.A.T., et al. Emergence of genomic diversity and recurrent mutations in SARS-CoV-2. Infect. Genet. Evol. 2020;83:104351. doi: 10.1016/j.meegid.2020.104351. [DOI] [PMC free article] [PubMed] [Google Scholar]
- Verdoni L., Mazza A., Gervasoni A., Martelli L., Ruggeri M., Ciuffreda M., Bonanomi E., D’Antiga L. An outbreak of severe Kawasaki-like disease at the Italian epicentre of the SARS-CoV-2 epidemic: an observational cohort study. Lancet. 2020;395:1771–1778. doi: 10.1016/S0140-6736(20)31103-X. [DOI] [PMC free article] [PubMed] [Google Scholar]
- Walls A.C., Park Y.J., Tortorici M.A., Wall A., McGuire A.T., Veesler D. Structure, function, and antigenicity of the SARS-CoV-2 Spike glycoprotein. Cell. 2020;181:281–292.e6. doi: 10.1016/j.cell.2020.02.058. [DOI] [PMC free article] [PubMed] [Google Scholar]
- Wan Y., Shang J., Graham R., Baric R.S., Li F. Receptor recognition by the novel coronavirus from Wuhan: an analysis based on decade-long structural studies of SARS coronavirus. J. Virol. 2020;94 doi: 10.1128/JVI.00127-20. e00127–e00120. [DOI] [PMC free article] [PubMed] [Google Scholar]
- Williams G.D., Chang R.Y., Brian D.A. A phylogenetically conserved hairpin-type 3′ untranslated region pseudoknot functions in coronavirus RNA replication. J. Virol. 1999;73:8349–8355. doi: 10.1128/jvi.73.10.8349-8355.1999. [DOI] [PMC free article] [PubMed] [Google Scholar]
- Wölfel R., Corman V.M., Guggemos W., Seilmaier M., Zange S., Müller M.A., Niemeyer D., Jones T.C., Vollmar P., Rothe C., et al. Virological assessment of hospitalized patients with COVID-2019. Nature. 2020;581:465–469. doi: 10.1038/s41586-020-2196-x. [DOI] [PubMed] [Google Scholar]
- Wrapp D., Wang N., Corbett K.S., Goldsmith J.A., Hsieh C.L., Abiona O., Graham B.S., McLellan J.S. Cryo-EM structure of the 2019-nCoV spike in the prefusion conformation. Science. 2020;367:1260–1263. doi: 10.1126/science.abb2507. [DOI] [PMC free article] [PubMed] [Google Scholar]
- Wu F., Zhao S., Yu B., Chen Y.M., Wang W., Song Z.G., Hu Y., Tao Z.W., Tian J.H., Pei Y.Y., et al. A new coronavirus associated with human respiratory disease in China. Nature. 2020;579:265–269. doi: 10.1038/s41586-020-2008-3. [DOI] [PMC free article] [PubMed] [Google Scholar]
- Xu K., Chen Y., Yuan J., Yi P., Ding C., Wu W., Li Y., Ni Q., Zou R., Li X., et al. Factors associated with prolonged viral RNA shedding in patients with COVID-19. Clin. Infect. Dis. 2020;71:799–806. doi: 10.1093/cid/ciaa351. [DOI] [PMC free article] [PubMed] [Google Scholar]
- Xu Y., Li X., Zhu B., Liang H., Fang C., Gong Y., Guo Q., Sun X., Zhao D., Shen J., et al. Characteristics of pediatric SARS-CoV-2 infection and potential evidence for persistent fecal viral shedding. Nat. Med. 2020;26:502–505. doi: 10.1038/s41591-020-0817-4. [DOI] [PMC free article] [PubMed] [Google Scholar]
- Yang X., Dong N., Chan E.W.-C., Chen S. Genetic cluster analysis of SARS-CoV-2 and the identification of those responsible for the major outbreaks in various countries. Emerg. Microbes Infect. 2020;9:1287–1299. doi: 10.1080/22221751.2020.1773745. [DOI] [PMC free article] [PubMed] [Google Scholar]
- Yu F., Yan L., Wang N., Yang S., Wang L., Tang Y., Gao G., Wang S., Ma C., Xie R., et al. Quantitative detection and viral load analysis of SARS-CoV-2 in infected patients. Clin. Infect. Dis. 2020;71:793–798. doi: 10.1093/cid/ciaa345. [DOI] [PMC free article] [PubMed] [Google Scholar]
- Zehender G., Lai A., Bergna A., Meroni L., Riva A., Balotta C., Tarkowski M., Gabrieli A., Bernacchia D., Rusconi S., et al. Genomic characterization and phylogenetic analysis of SARS-COV-2 in Italy. J. Med. Virol. 2020 doi: 10.1002/jmv.25794. Published online March 29, 2020. [DOI] [PMC free article] [PubMed] [Google Scholar]
- Zhang X., Tan Y., Ling Y., Lu G., Liu F., Yi Z., Jia X., Wu M., Shi B., Xu S., et al. Viral and host factors related to the clinical outcome of COVID-19. Nature. 2020;583:437–440. doi: 10.1038/s41586-020-2355-0. [DOI] [PubMed] [Google Scholar]
- Zhou F., Yu T., Du R., Fan G., Liu Y., Liu Z., Xiang J., Wang Y., Song B., Gu X., et al. Clinical course and risk factors for mortality of adult inpatients with COVID-19 in Wuhan, China: a retrospective cohort study. Lancet. 2020;395:1054–1062. doi: 10.1016/S0140-6736(20)30566-3. [DOI] [PMC free article] [PubMed] [Google Scholar]
- Zhou P., Yang X.-L., Wang X.-G., Hu B., Zhang L., Zhang W., Si H.-R., Zhu Y., Li B., Huang C.-L., et al. A pneumonia outbreak associated with a new coronavirus of probable bat origin. Nature. 2020;579:270–273. doi: 10.1038/s41586-020-2012-7. [DOI] [PMC free article] [PubMed] [Google Scholar]
- Zhu N., Zhang D., Wang W., Li X., Yang B., Song J., Zhao X., Huang B., Shi W., Lu R., et al. China Novel Coronavirus Investigating and Research Team A novel coronavirus from patients with pneumonia in China, 2019. N. Engl. J. Med. 2020;382:727–733. doi: 10.1056/NEJMoa2001017. [DOI] [PMC free article] [PubMed] [Google Scholar]
- Zou L., Ruan F., Huang M., Liang L., Huang H., Hong Z., Yu J., Kang M., Song Y., Xia J., et al. SARS-CoV-2 viral load in upper respiratory specimens of infected patients. N. Engl. J. Med. 2020;382:1177–1179. doi: 10.1056/NEJMc2001737. [DOI] [PMC free article] [PubMed] [Google Scholar]
- Züst R., Miller T.B., Goebel S.J., Thiel V., Masters P.S. Genetic interactions between an essential 3′ cis-acting RNA pseudoknot, replicase gene products, and the extreme 3′ end of the mouse coronavirus genome. J. Virol. 2008;82:1214–1228. doi: 10.1128/JVI.01690-07. [DOI] [PMC free article] [PubMed] [Google Scholar]
Associated Data
This section collects any data citations, data availability statements, or supplementary materials included in this article.
Supplementary Materials
Data Availability Statement
All sequence mapping algorithms and codes are publicly accessible, listed in detail below, or available using the CLC Genomics Workbench V 2.0 (QIAGEN Inc.). R code that was used for data analysis is located on an accessible bit bucket folder https://bitbucket.org/dittmerlab/unc_covid_ampliseq/. SARS-CoV-2 RNAseq positive control sequence reads (Supplemental Figures S1A-S1D) were uploaded under Bioproject PRJNA639551, PRJNA633048. All custom coding is available upon request through the Lead Contact information above.