ABSTRACT
Background:
Diabetes mellitus and its complications, such as nephropathy, represent a global burden. Recent research focuses on developing drugs that specifically target the pathogenesis of diabetic nephropathy rather than merely treating hyperglycemia. Rodent models of animal disease are integral in drug discovery and represent an obligatory regulatory requirement.
Aim:
The aim of this study was to develop and standardize rat models of type 1 and type 2 diabetic nephropathy, resembling characteristics of human clinical condition.
Materials and Methods:
Rats were administered streptozotocin (STZ) 50 mg/kg intraperitoneally (i.p.), and STZ 50 mg/kg i.p. + nicotinamide (NA) 110 mg/kg i.p., for induction of type 1 diabetes mellitus (T1DM) and type 2 diabetes mellitus (T2DM), respectively. Metabolic parameters (body weight, feed and water intake, blood glucose, serum insulin, oral glucose tolerance test, intraperitoneal insulin tolerance test, and indices of insulin sensitivity) were evaluated to characterize the symptoms of T1DM and T2DM. Renal damage was confirmed by the estimation of renal function biomarkers, kidney antioxidant status, kidney hypertrophy index, and histopathology.
Results:
STZ and STZ + NA administration increased blood glucose levels significantly. Metabolic parameters indicated that administration of STZ resulted in clinical features of human T1DM, whereas STZ + NA rats resembled human T2DM. STZ- and STZ + NA-treated rats developed diabetic nephropathy in 4 weeks, indicated by altered levels of renal function markers, increased kidney hypertrophy index, increased renal oxidative stress, and altered tissue architecture. The study proposes reproducible and cost-effective rat models for both T1DM- and T2DM-induced diabetic nephropathy characterized by stable metabolic features and typical renal lesions.
KEYWORDS: Diabetic nephropathy, nicotinamide, rat model, streptozotocin, type 1 diabetes mellitus, type 2 diabetes mellitus
INTRODUCTION
Diabetes mellitus (DM), a chronic metabolic disorder characterized by defects in insulin secretion, insulin resistance, and resultant hyperglycemia, remains a major burden globally. The global adult prevalence of diabetes is approximately 425 million adults (8.5% of world population).[1] Type 1 diabetes mellitus (T1DM), representing approximately 5% of patients with diabetes, is an auto-immune disorder characterized by loss of β cell function, resulting in the deficiency of insulin secretion. On the contrary, 95% of patients with diabetes represent type 2 diabetes mellitus (T2DM), characterized by hyperinsulinemia and insulin resistance.[2] The main concern with diabetes is the development of chronic microvascular complications, namely nephropathy, retinopathy, and neuropathy, which result in high morbidity and mortality.[1] The current therapy for diabetes focuses on lowering of blood glucose levels by insulin, oral hypoglycemics, insulin sensitizers, and so on.[3] However, recent research focuses on the development of novel targets for preventing and combating the complications.[4] Preclinical studies are prerequisite of drug development process and represent an obligatory regulatory requirement.[5]
Genetic rodent models of T1DM and T2DM are ideal for evaluation as they represent the natural progression of human disorder; however, they have a major drawback of being expensive.[6] Therefore, the development and standardization of simple, cost-effective rodent models of T1DM and T2DM is extremely essential to facilitate the preclinical screening of various potential drugs. Single dose of streptozotocin (STZ) has been widely used to induce clinical features of human T1DM in rodents, whereas it has been reported that administration of STZ along with nicotinamide (NA) in rodents induces clinical features of human T2DM.[7,8] However, comparative evaluation of metabolic features of the two rodent models has not been fully explored. Selection and utilization of appropriate model of DM, either T1DM or T2DM, is imperative to facilitate preclinical evaluation of drugs. Thus, this study aimed at standardization, characterization, and differentiation between rat models, mimicking conditions of T1DM and T2DM, by evaluation of various metabolic parameters. Further, it was essential to ensure that the rat models developed diabetic nephropathy within the experimental period.
MATERIALS AND METHODS
Animals
Adult male Wistar rats (200–250g, 8–10 weeks) were procured from Bombay Veterinary College, Parel, India. They were housed at institutional animal house (CPCSEA/87/1999). The animals were acclimatized for 7 days before the initiation of the experiment and were maintained on a 12-h light–dark cycle with temperature 25°C ± 2°C and relative humidity of 50%–70%. Commercialized animal feed from Nutrivet, Mumbai, India, and drinking water ad libitum was provided to them. The experimental protocol (ICT/IAEC/2016/P05) was approved by the Institutional Animal Ethics Committee. All the facilities were provided, and experiments were carried in accordance with “Guide for the care and use of laboratory animals” (publication no. [NIH] 85-23) and “CPCSEA guidelines for laboratory animal facility.”
Experimental design
Rats were randomly assigned to following groups:
Group I: Control, n = 6 rats
Group II: Streptozotocin (STZ) group (T1DM), n = 9 rats
Group III: STZ + NA group (T2DM), n = 9 rats
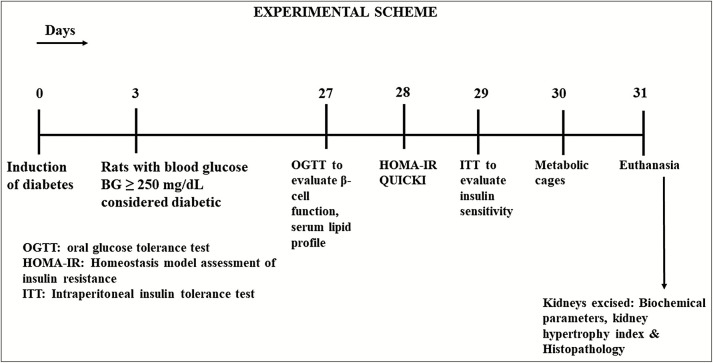
Experimental diabetes was induced in 12-h fasted rats. Group II animals received single i.p. injection of STZ (50 mg/kg) dissolved in 100mM cold citrate buffer, pH 4.5. Animals in Group III received i.p. injection of STZ (50 mg/kg) dissolved in 100mM cold citrate buffer, pH 4.5, 15 min after i.p. administration of nicotinamide (110 mg/kg, dissolved in normal saline). As STZ can induce fatal hypoglycemia because of massive pancreatic insulin release, drinking water was replaced with 10% glucose solution after 6 h of STZ or STZ + NA administration for the next 24 h to prevent hypoglycemia. Blood glucose levels were determined after 72 h of STZ or STZ + NA administration. Animals with fasting blood glucose levels of greater than 250 mg/dL (14mM) were considered diabetic and included in the study. The total duration of experiment was 31 days [Figure 1].
Figure 1.
Experimental scheme
Metabolic parameters
Blood glucose, body weight, feed intake, and water intake
The fasting blood glucose levels, body weight, feed, and water intake were measured weekly.
Oral glucose tolerance test
On 27th day, oral glucose tolerance test (OGTT)[9] was performed to evaluate β cell function. Glucose (2.5g/kg) was administered orally to 12-h overnight fasted rats. Blood glucose level was measured at 0, 15, 30, 60, 120, and 240 min by tail vein sampling method using glucometer (AccuCheck Sensor Comfort, Roche Diagnostics, Mumbai, India).
Indices of insulin sensitivity (HOMA-IR and QUICKI)
On 28th day, rats were fasted for 6 h, and blood samples were withdrawn from retro-orbital plexus, subsequently serum was separated for the estimation of fasting serum glucose and fasting serum insulin. Serum glucose was determined by using standard commercial glucose estimation kit (Accurex Biomedical, Mumbai, India). Serum insulin was determined by radioimmunoassay method, specifically designed for the estimation of insulin in rat serum (BRIT, Mumbai, India). The indices for insulin sensitivity were calculated as follows[10]:


Intraperitoneal insulin tolerance test
On 29th day, intraperitoneal insulin tolerance test (ITT)[11] was performed to determine insulin sensitivity. Rats were fasted for 4 h, followed by administration of human insulin (Actrapid, Novo-Nordisk) 2 IU/kg i.p. Blood glucose was measured at 0, 5, 15, 20, and 30 min by tail vein sampling method using glucometer (AccuCheck Sensor Comfort). The first-order rate constant for rate of disappearance of glucose from plasma (Ke) was estimated from the slope of regression line of logarithmic plot of blood glucose against time. KITT (%/min) was calculated using the following formula:
![]()
Plasma half-life for glucose clearance (t1/2) was calculated using the following formula:

Serum lipid profile
On 27th day, blood was withdrawn from retro-orbital plexus of 12-h fasted rats. Serum lipid profile was estimated by enzymatic methods using standard commercial kits from Accurex Biomedical.
Parameters of renal damage
Biomarkers of renal damage
On 30th day, rats were then placed in metabolic cages and 24-h urine was collected for estimation of urine creatinine and urine albumin. Blood was withdrawn from retro-orbital plexus for the estimation of serum creatinine, serum albumin, and blood urea nitrogen (BUN) using standard commercial kits from Accurex Biomedical. Urine albumin excretion was calculated using the following equation[12]:

Creatinine clearance was calculated using following equation[13]:

Kidney hypertrophy index
Kidney hypertrophy index[12] was determined as percentage of the ratio of kidney weight (KW) to body weight (BW).
Kidney antioxidant parameters
Kidneys were homogenized in ice-cold potassium phosphate buffer (pH 7.4) to obtain 10% wt/vol homogenates. The homogenate thus obtained was further centrifuged at -4°C for 15 min. The supernatant was used for the assessment of endogenous antioxidant parameters according to previously reported methods.[12]
Histopathological studies
The kidneys were fixed in 4% paraformaldehyde in potassium phosphate buffer (0.1 M, pH 7.4). The samples were then dehydrated through graded alcohol series and embedded in paraffin. The paraffin blocks were cut into 4-µm sections and stained with hematoxylin and eosin (HE) and Periodic acid–Schiff base (PAS) separately. The slides were examined under light microscopy at ×100 and ×400 magnification.
Statistical analysis
All data are expressed as mean ± standard error of mean (SEM). Data were evaluated by using GraphPad Prism, version 5.0.
RESULTS
Effect on metabolic parameters
Effect on blood glucose, body weight, feed, and water intake
The fasting blood glucose level was significantly (***P < 0.001) increased in both STZ- and STZ + NA-treated rats as compared to that in control group. Hyperglycemia was persistent throughout the study period of 4 weeks [Table 1].
Table 1.
Effect on weekly blood glucose levels
| Groups | Blood glucose level (mg/dL) | |||
|---|---|---|---|---|
| Week 1 | Week 2 | Week 3 | Week 4 | |
| Control | 131.2 ± 8.07 | 112.4 ± 10.49 | 100 ± 6.06 | 100.4 ± 1.245 |
| STZ | 539.12 ± 21.74*** | 593.12 ± 14.81*** | 557.2 ± 29.06*** | 569.6 ± 18.88*** |
| STZ + NA | 488.56 ± 26.07*** | 525.11 ± 31.91*** | 506.38 ± 30.74*** | 455.83 ± 10.92*** |
***Significant difference (P < 0.001) from control group using two-way ANOVA followed by Bonferroni post hoc test
Data expressed as mean ± SEM, n = 6 in control group, n = 9 in STZ and STZ + NA group
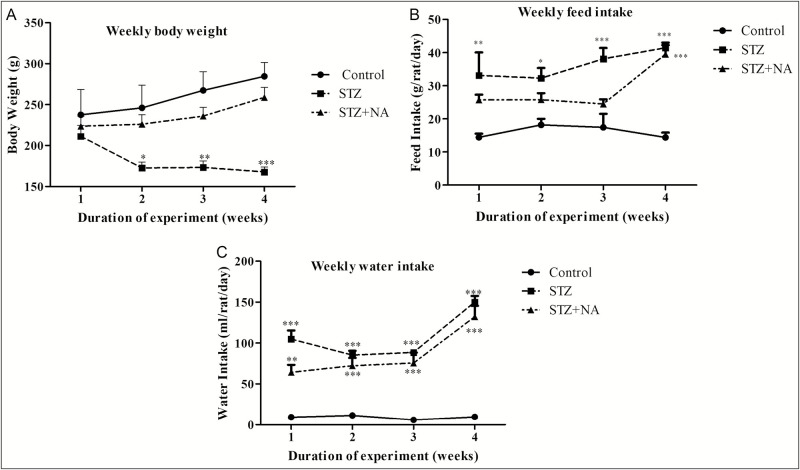
Rats treated with only STZ showed a significant (*P < 0.05, **P < 0.01, ***P < 0.001) decrease in body weight, with body weight decreasing progressively during the experimental period as compared to control rats. Group III rats, treated with STZ + NA showed slight decrease of body weigh t; however, it was not statistically significant as compared to the normal rats [Figure 2A].
Figure 2.
Effect on (A) body weight, (B) feed intake, and (C) water intake. ***Significant difference (P < 0.001), **significant difference (P < 0.01), *significant difference (P < 0.05) from normal control group, using two-way ANOVA followed by Bonferroni test. Data expressed as mean ± SEM, n = 6 in control group, n = 9 in STZ and STZ + NA group
Feed intake was significantly (*P < 0.05, **P < 0.01, ***P < 0.001) increased in STZ-treated rats from first week of the experiment and increased progressively up to the fourth week as compared to control rats. In case of STZ + NA-treated rats, feed intake was increased significantly (***P < 0.001) only in the fourth week of the experiment [Figure 2B].
Water intake of rats in both STZ- and STZ + NA-treated groups, was significantly (**P < 0.01, ***P < 0.001) increased from first week of experiment and was highest in the fourth week as compared to that in the control rats [Figure 2C].
Oral glucose tolerance test
Glucose tolerance was significantly (***P < 0.001) impaired in both STZ- and STZ + NA-treated rats as compared to control rats. The blood glucose level of control rats increased steadily reaching a maximum value (131 ± 6.07 mg/dL) at 30 min, following which the levels decreased steadily and reached normal value (73.4 ± 2.84 mg/dL) at 240 min. In contrast, the blood glucose levels in STZ- and STZ + NA-treated rats increased steadily and rats remained hyperglycemic (STZ: 560.33 ± 18.51 mg/dL, STZ + NA: 551.17 ± 16.84 mg/dL) even at 240 min, indicating impaired glucose tolerance [Figure 3].
Figure 3.
Glucose curves of oral glucose tolerance test in the experimental groups. ***Significant difference (P < 0.001) from normal control group using one-way ANOVA followed by Tukey multiple comparison test. Data expressed as mean ± SEM, n = 6 in control group, n = 9 in STZ and STZ + NA group
Effect on fasting blood glucose and fasting insulin level
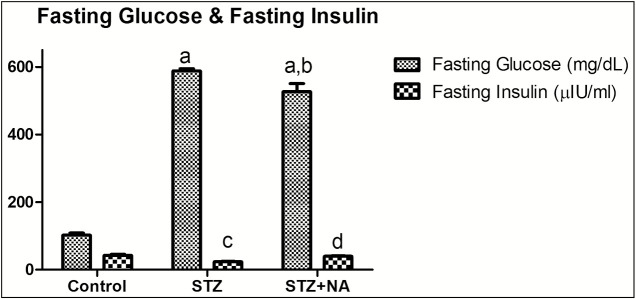
Control rats showed normal fasting serum glucose levels (102.83 ± 5.54 mg/dL) along with normal fasting serum insulin levels (42.39 ± 3.45 µIU/mL). STZ-treated rats showed significantly (P < 0.001) high fasting serum glucose levels (588.00 ± 6.64 mg/dL) along with significantly (P < 0.001) low fasting insulin levels (23.55 ± 1.29 µIU/mL) as compared to control rats. Interestingly, STZ + NA-treated rats showed significantly (P < 0.001) high fasting serum glucose levels as compared to normal rats (526.64 ± 39.56 mg/dL) along with normal serum insulin levels (39.56 ± 1.33 µIU/mL) [Figure 4].
Figure 4.
Effect on fasting glucose and fasting insulin level. a represents statistical difference (P < 0.001) of blood glucose from control group, b represents statistical difference (P < 0.05) of blood glucose from STZ group, c represents statistical difference (P < 0.001) of fasting insulin from control group, and d represents statistical difference (P < 0.001) of fasting insulin from STZ group. Data are expressed as mean ± SEM, n = 6 in control group, n = 9 in STZ and STZ + NA group. Comparison between control, STZ, and STZ + NA group was made by one-way ANOVA followed by Bonferroni’s multiple comparison test
Effect on indices of insulin sensitivity
HOMA-IR an indicator of insulin resistance was increased significantly (P < 0.001) in both STZ- and STZ + NA-treated rats as compared to control rats; however, the magnitude of this index was approximately threefold in STZ + NA-treated rats as compared to that in STZ-treated rats, indicating severe insulin resistance. QUICKI was decreased significantly (P < 0.001) in both STZ- and STZ + NA-treated rats as compared to that in normal rats [Table 2].
Table 2.
Effecton indices of insulin sensitivity
| Groups | HOMA-IR | QUICKI |
|---|---|---|
| Control | 1.83 ± 0.23 | 0.27 ± 0.005 |
| STZ | 3.62 ± 0.25a | 0.25 ± 0.002a |
| STZ + NA | 9.16 ± 0.42a,b | 0.23 ± 0.001a |
aStatistical difference (P < 0.001) from control group
bStatistical difference (P < 0.001) from STZ group
Data are expressed as mean ± SEM, n = 6 in control group, n = 9 in STZ and STZ + NA group. Comparison between control, STZ and STZ + NA group was made by one-way ANOVA followed by Bonferroni’s multiple comparison test
Intraperitoneal insulin tolerance test
There was no significant difference between KITT values of control group and STZ group, indicating that STZ-treated rats were responsive to insulin bolus (insulin sensitive). In contrast, KITT value of STZ + NA group was significantly different from control group (P < 0.05) as well as STZ group (P < 0.01) showing insulin resistance [Table 3].
Table 3.
Effect on intraperitoneal insulin tolerance test
| Groups | Equation of line | KE (min-1-) | KITT (%/min) | t1/2 (min) | r2 |
|---|---|---|---|---|---|
| Control | y = -0.0161x + 1.97 | 0.037 ± 0.003 | 3.70 | 18.74 | 0.95 |
| STZ | y = 0.015x + 2.67 | 0.045 ± 0.01 | 4.48 | 15.47 | 0.94 |
| STZ+NA | y = -0.0041x + 2.74 | 0.009 ± 0.001 | 0.93a,b | 74.24 | 0.95 |
aP < 0.05 compared to normal control group
bP < 0.01 compared to streptozotocin group
KITT values (mean ± SEM, n = 6 in control group, n = 9 in STZ and STZ + NA group) were analyzed using one-way ANOVA followed by Tukey post hoc test
Effect on serum lipid profile
Serum levels of total cholesterol and triglycerides were significantly (**P < 0.01, ***P < 0.001) elevated, whereas serum high-density lipoprotein cholesterol (HDL-C) level was decreased significantly (**P < 0.01) in both STZ- and STZ + NA-treated rats as compared to control rats [Table 4].
Table 4.
Effect on serum lipid profile
| Groups | Total cholesterol (mg/dL) | Triglycerides (mg/dL) | HDL-C (mg/dL) |
|---|---|---|---|
| Control | 33.07 ± 2.56 | 84.33 ± 8.611 | 16.55 ± 1.01 |
| STZ | 91.18 ± 0.54*** | 161.68 ± 8.05** | 0.39 ± 0.92** |
| STZ + NA | 66.91 ± 1.49*** | 157.26 ± 16.55** | 7.61 ± 0.60** |
***Significant difference (P < 0.001), **significant difference (P < 0.01) from control group, using one-way ANOVA followed by Dunnett’s multiple comparison test
Data expressed as mean ± SEM, n = 6 in control group, n = 9 in STZ and STZ + NA group
Effect on parameters of renal damage
Effect on kidney hypertrophy index
Kidney hypertrophy index was significantly (***P < 0.001) increased in both STZ- and STZ + NA-treated rats as compared to that in control rats [Table 5].
Table 5.
Effect on kidney hypertrophy index
| Groups | Kidney hypertrophy index |
|---|---|
| Control | 0.40 ± 0.01 |
| STZ | 0.57 ± 0.01*** |
| STZ + NA | 0.58 ± 0.01*** |
***Significant difference (P < 0.001) from control group using one-way ANOVA followed by Dunnett’s multiple comparison test
Data expressed as mean ± SEM, n = 6 in control group, n = 9 in STZ and STZ + NA group
Effect on urine volume
Urine volume excreted in 24 h [Figure 5] was significantly (P < 0.001) increased in both STZ-treated rats (urine volume: 114.42 ± 3.68 mL) and STZ + NA-treated rats (urine volume: 117.33 ± 2.90 mL) as compared to that in control rats (urine volume: 9.0 ± 0.45 mL).
Figure 5.
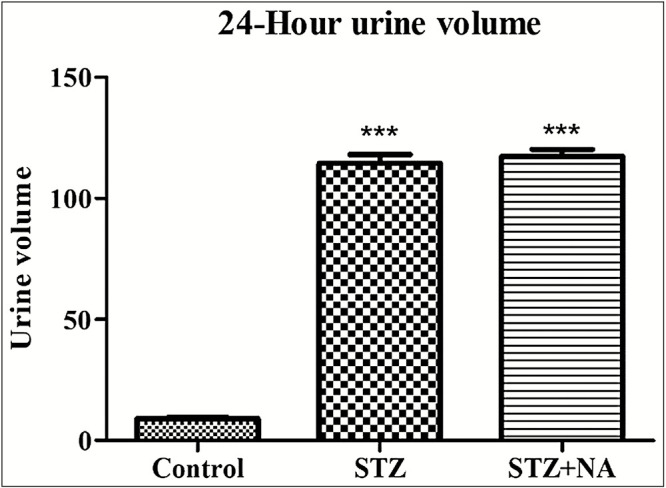
Urine volume excreted in 24 h. ***Significant difference (P < 0.001) from control group using one-way ANOVA followed by Dunnett’s post hoc test. Data are expressed as mean ± SEM, n = 6 in control group, n = 9 in STZ and STZ + NA group
Effect on biomarkers of renal injury
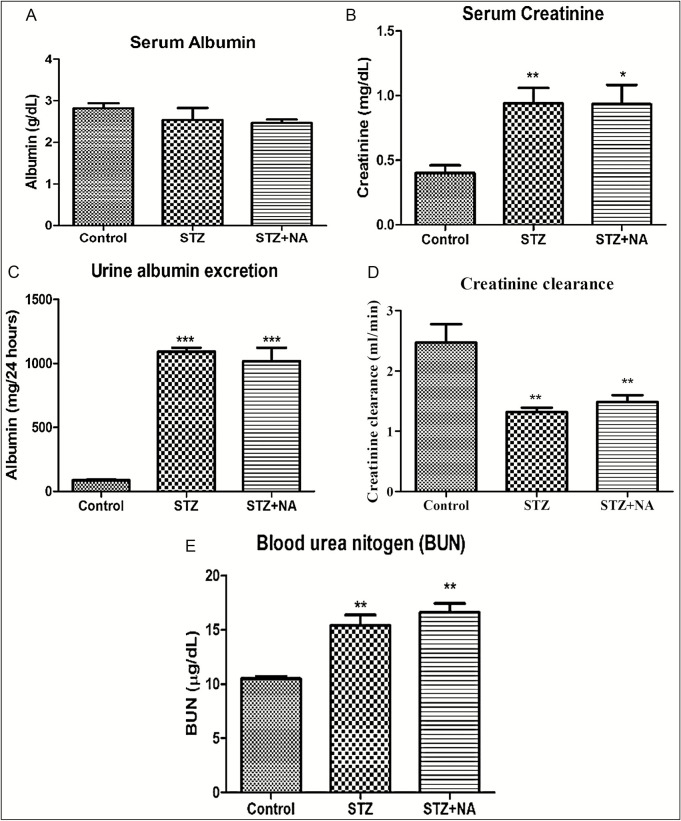
Figure 6 shows the effect on biomarkers of renal injury. Serum albumin levels of STZ-treated (serum albumin: 2.54 ± 0.29g/dL) and STZ + NA-treated (serum albumin: 2.47 ± 0.08g/dL) rats did not differ significantly from control rats (serum albumin: 2.82 ± 0.12g/dL). Serum level of creatinine and blood urea nitrogen was significantly (**P < 0.01, *P < 0.05) increased in both STZ-treated rats (serum creatinine: 0.94 ± 0.12g/dL, BUN: 15.39 ± 0.98 µg/mL) and STZ + NA-treated rats (serum creatinine: 0.93 ± 0.15g/dL; BUN: 16.60 ± 0.84 µg/mL) when compared to that in control rats (serum creatinine: 0.4 ± 0.06g/dL, BUN: 10.51±0.22 µg/ml). Creatinine clearance was significantly (**P < 0.01) decreased, whereas urine albumin excretion was significantly (***P < 0.001) increased in both STZ-treated rats (creatinine clearance: 1.32 ± 0.07 mL/min, urine albumin excretion: 1.09 ± 0.03g/24 h) and STZ + NA-treated rats (creatinine clearance: 1.49 ± 0.11 mL/min, urine albumin excretion: 1.02 ± 0.11g/24 h) as compared to control rats (creatinine clearance: 2.47 ± 0.30 mL/min, urine albumin excretion: 0.086 ± 0.007g/24 h).
Figure 6.
Effect on biomarkers of renal injury. (A) Serum albumin. (B) Serum creatinine. (C) Blood urea nitrogen. (D) Creatinine clearance. (E) Urine albumin excretion. ***Significant difference (P < 0.001), **significant difference (P < 0.01), *significant difference (P < 0.05) from control group using one-way ANOVA followed by Dunnett’s post hoc test. Data are expressed as mean ± SEM, n = 6 in control group, n = 9 in STZ and STZ + NA group
Effect on kidney antioxidant parameters
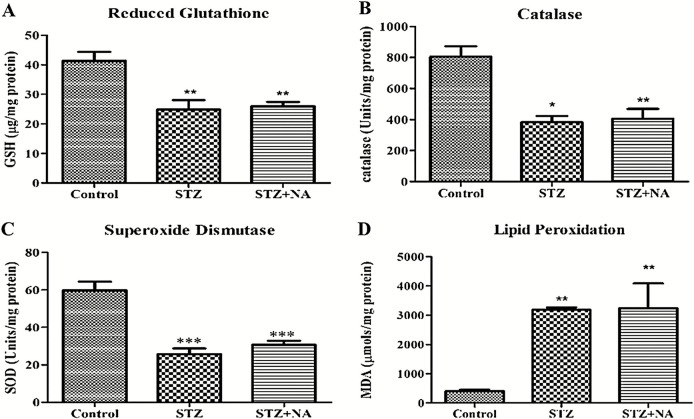
Renal oxidative stress was increased in both STZ- and STZ + NA-treated rats as compared to that in normal rats, indicated by decrease in the levels of reduced glutathione (GSH), endogenous antioxidant enzymes, namely catalase (CAT) and superoxide dismutase (SOD) and increased level of lipid peroxidation in kidney homogenates [Figure 7]. Malondialdehyde level was significantly increased in both STZ (3181.27 ± 84.93 µmol/mg protein) and STZ + NA group (3234.20 ± 847.06 µmol/mg protein) as compared to that in control group (406.15 ± 44.69 µmol/mg protein). In contrast level of GSH, an intracellular antioxidant was significantly decreased in STZ-treated rats (24.8 ± 3.28 µg/mg protein) and STZ + NA-treated rats (25.93 ± 1.48 µg/mg protein) as compared to that in control rats (41.3 ± 3.08 µg/mg protein). Similarly, levels of antioxidant enzymes, CAT and SOD, were decreased in STZ-treated rats (CAT: 382.68 ± 40.24 U/mg protein, SOD: 25.67 ± 3.12 U/mg protein) and STZ + NA-treated rats (CAT: 405.55 ± 63.40 U/mg protein, SOD: 30.69 ± 2.16 U/mg protein) as compared to that in control rats (CAT: 804.63 ± 67.08 U/mg protein, SOD: 59.78 ± 4.65 U/mg protein).
Figure 7.
Effect on kidney antioxidant parameters. (A) Reduced glutathione. (B) Catalase. (C) Superoxide dismutase. (D) Lipid peroxidation. ***Significant difference (P < 0.001), **significant difference (P < 0.01), *significant difference (P < 0.05) from control group using one-way ANOVA followed by Dunnett’s post hoc test. Data are expressed as mean ± SEM, n = 6 in control group, n = 9 in STZ and STZ + NA group
Histopathology
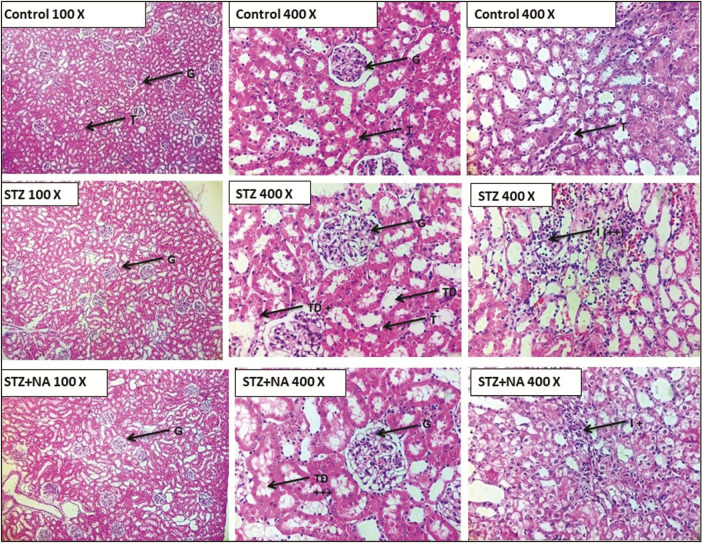
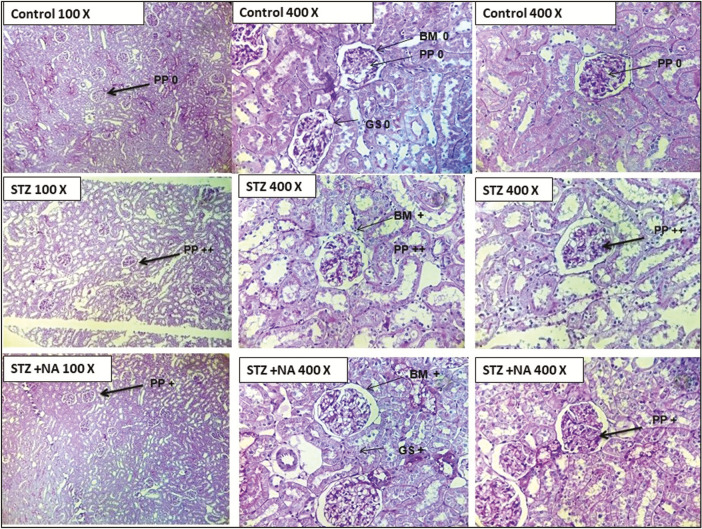
HE staining showed that kidneys of both STZ- and STZ + NA-treated rats presented morphological aberrations such as vacuolar degeneration, tubular collapse, mononuclear cells infiltration, and edema, which was not visible in kidneys of control rats [Figure 8]. PAS staining showed that the thickness of glomerular basement membrane was moderately increased in kidneys of both STZ- and STZ + NA-treated rats as compared with that of control rats [Figure 9].
Figure 8.
Photomicrographs of histopathological analysis of kidneys by hematoxylin and eosin staining. G = glomerulus, T = tubules, TD = tubular degeneration, I = mononuclear cells infiltration, + = mild change, ++ = moderate change, +++ = severe change
Figure 9.
Photomicrographs of histopathological analysis of kidneys by Periodic acid–Schiff base staining. PP = PAS positivity, BM = basement membrane thickness, GS = glomerular sclerosis, + = mild change, ++ = moderate change, +++ = severe change
DISCUSSION
The objective of this research was to optimize a T2DM rat model, which develops diabetic nephropathy, and to differentiate the model from T1DM model by assessment of various parameters.
T1DM results from the autoimmune destruction of pancreatic β cells and is characterized by the inability of pancreatic β cells to secrete insulin. T1DM was induced by single dose of STZ (50 mg/kg, i.p.). The diabetogenic effect of STZ is due to selective injury to insulin-producing pancreatic β cells, attributed to the presence of glucose moiety, which enables STZ to be transported into the cells via GLUT-2 transporter expressed on these cells. Intracellularly, the nitrosoamide moiety of STZ is converted into a highly reactive methyl carbonium ion (CH3+), which methylates the DNA resulting in DNA fragmentation. The result is β cell necrosis, which produces a state of insulin-dependent DM by the deprivation of insulin.[14] T2DM is relatively more common and is characterized by insulin resistance, often accompanied with overweight and obesity. T2DM was induced by single intraperitoneal injection of STZ (50 mg/kg), 15 min after the i.p. administration of NA (110 mg/kg). This rodent model of diabetes was first developed by Masiello et al.[8] for the induction of non-insulin-dependent diabetes. NA partially protects pancreatic β cells from STZ-induced damage by two main mechanisms, namely inhibition of poly-ADP-ribose-polymerase-I (PARP-I) and provision of intracellular NAD.[14] The extent of protection depends on the relative doses of STZ and NA, the age of animals, and relative time of administration of the two compounds. In the literature, the most frequently used procedure to induce type 1 diabetes in rats was to administer a single dose of STZ (40–70 mg/kg) to rats aged 8–10 weeks.[15] Moreover, younger rodents are less sensitive to STZ and are better protected by NA. Therefore, male Wistar rats (aged 8–10 weeks) were used for the induction of both T1DM and T2DM. Rodents show a substantial gender difference in STZ sensitivity, with females being less susceptible to diabetogenic effect of STZ, which is attributable to the ability of estradiol to protect the β cells from apoptosis induced by oxidative stress.[16] Hence, this study was standardized in male rats. If female rats are used in a study, it is essential that all the rats are in same phase of their estrous cycle to eliminate the β cell protective effect of estradiol.
Diabetic dysfunction in both STZ- and STZ + NA-treated rats was monitored by measuring blood glucose level, body weights along with feed and water intake at weekly intervals. Blood glucose levels were estimated following a 6-h fasting from 9 am to 3 pm. In humans, overnight-fasted blood glucose level is routinely used to diagnose and monitor glucose control in DM; however, this cannot be extrapolated to rodents. Rodents are nocturnal and overnight fasting provokes a catabolic state and depletes liver glycogen stores. Thus, an overnight fasting in rats usually translates into a fast of approximately 24 h in humans, triggering physiologic responses that obscure the reliability of measured glucose readings. Therefore, fasting should be initiated at the morning of blood sampling.[17,18] Fasting blood glucose level was increased throughout the study period in both STZ rats as well as STZ + NA rats.
Body weight, feed, and water intake were monitored weekly to characterize the features of T1DM and T2DM. T1DM is generally accompanied with severe weight loss and polyphagia. This is attributed to inefficient tissue utilization of glucose due to low insulin level or insulin resistance.[19] Therefore, a state of intracellular starvation occurs, which activates catabolic pathways to derive energy from metabolism of adipose tissue (lipolysis) and muscles (through gluconeogenesis), causing a reduction in overall body weight. Intracellular starvation stimulates release of hormones such as leptin and orexin, which activate the feeding center in hypothalamus, leading to polyphagia. The polyphagia observed in diabetics can also be explained by “Glucostat theory of feeding regulation,” which states that feeding response is regulated by the arteriovenous difference of glucose in the hypothalamic satiety and feeding center. A high difference indicates efficient glucose utilization and activates the satiety center, whereas a low difference activates the feeding center. In diabetes, glucose utilization is inefficient; as a result, the arteriovenous difference remains low and feeding center is chronically active, producing polyphagia.[20] The onset of these symptoms is more rapid in T1DM due to absolute insulin insufficiency, whereas the onset is much slow in T2DM due to the presence of few functional pancreatic β cells releasing insulin. Rats treated with STZ alone showed significant loss of body weight and polyphagia during the experimental period. However, no significant weight loss was observed in rats treated with STZ + NA; polyphagia was evident only during fourth week of the experiment. Thus, rats treated with only STZ showed symptoms of T1DM, whereas STZ + NA treatment produced symptoms resembling T2DM.
Diabetes also produces polydipsia and polyuria. Hyperglycemia results in incomplete reabsorption of glucose at proximal convoluted tubule, resulting in high concentration of glucose excretion in urine (glucosuria). Therefore, osmotic pressure of urine increases, inhibiting water reabsorption by kidney causing upsurge in urine production (polyuria). Polyuria leads to loss of water and electrolytes causing dehydration, which triggers excessive thirst (polydipsia).[19] Rats treated with both STZ and STZ + NA showed significant polydipsia. Polyuria was measured in the fourth week of experiment; rats from both STZ- and STZ + NA-treated groups showed polyuria.
Diabetes is often accompanied by dyslipidemia as the metabolic pathways for the utilization of carbohydrates and lipids are interlinked. Insulin stimulates the synthesis of glycogen (glycogenesis) and fatty acids (lipogenesis) in the liver, inhibits lipolysis in adipose tissues by inhibition of intracellular hormone-sensitive lipoprotein lipase, inhibits hepatic very low density lipoprotein (VLDL) production, and promotes clearance of low density lipoprotein (LDL) by increasing LDL-receptor expression and activity. Thus, insulin deficiency and/or resistance causes elevation of plasma-free fatty acids, triglycerides, LDL, and VLDL.[21,22,23,24] Rats treated with both STZ and STZ + NA depicted the presence of diabetic dyslipidemia.
OGTT is used to diagnose glucose intolerance.[25] Glucose tolerance was impaired in both STZ- and STZ + NA-treated rats as evidenced by high serum glucose concentration of greater than 200 mg/dL after 4 h of glucose administration. ITT is used to assess insulin sensitivity of a subject. The faster the decline in blood glucose following i.p administration of insulin, more is the insulin sensitivity of the subject. KITT is the first-order rate constant for disappearance of glucose. Normal KITT value is greater than 2.0%/min and values <1.5%/min represent insulin resistance.[26,27]KITT for control rats and STZ-treated rats was found to be 3.70%/min and 4.48%/min, respectively, indicating normal insulin sensitivity. STZ + NA-treated rats had significantly lower KITT value of 0.93%/min, indicating insulin resistance.
HOMA-IR is a mathematical model first described by Matthews et al., in 1985, for assessing β cell function and insulin resistance from fasting glucose and fasting insulin concentration. Higher values of this index indicate insulin resistance.[28] QUICKI, a surrogate marker for insulin sensitivity, uses a log transform of insulin–glucose product. Higher value of this index indicates insulin sensitivity.[29,30] STZ-treated rats had low fasting insulin level along with high fasting blood glucose level. This condition mimics T1DM, characterized by functional loss of insulin-secreting pancreatic β cells, resulting in hypoinsulinemia and resultant hyperglycemia. Interestingly, STZ + NA-treated rats depicted fasting hyperglycemia with serum insulin levels comparable with the normal rats. This indicates the presence of population functional β cells secreting insulin. However, the insulin secreted is ineffective in decreasing the blood glucose, indicating insulin resistance, mimicking T2DM.
Thus, the aforementioned results showed that STZ administration produced a condition in rats, which mimicked T1DM, whereas STZ + NA administration resulted in a condition mimicking T2DM.
Further, we aimed to determine the development of diabetic nephropathy. Diabetic nephropathy is characterized by an increase in serum creatinine, BUN along with decreased urinary creatinine excretion, and increased urinary protein excretion.[31] Biomarkers of renal function aforementioned were altered by treatment with both STZ and STZ + NA indicating renal injury.
Oxidative stress has been identified as a key pathogenic factor in the development of diabetic complications such as diabetic nephropathy.[32] Renal oxidative stress was increased in both STZ- and STZ + NA-treated rats as compared to that in the normal rats.
Hyperglycemia triggers inflammatory pathways resulting in the secretion of growth, causing expansion of glomerular mesangium by cell proliferation, cell hypertrophy, and correlates with the degree of urine protein excretion.[33] The characteristics of diabetic nephropathy lesions include glomerular basement thickening (class I), mesangial expansion (class II), nodular sclerosis (class III), and advanced diabetic glomerulosclerosis (class IV).[34] Kidney hypertrophy index was increased in both STZ- and STZ + NA-treated rats, indicating renal inflammation and injury. These findings were confirmed by histopathological evaluation of kidney by HE and PAS staining.
CONCLUSION
To summarize, STZ administration resulted in a metabolic state mimicking human T1DM, mainly characterized by insulin deficiency and resultant hyperglycemia. Hyperglycemia and insulin resistance are the hallmarks of T2DM; this was observed with STZ + NA administration. Moreover, both STZ- and STZ + NA-treated rats showed signs and symptoms of diabetic renal injury as investigated by various biochemical parameters and histopathology. Thus, we standardized rat models for type 1 diabetes–induced diabetic nephropathy (DN) and type 2 diabetes–induced DN, characterized by differences in metabolic parameters between the two models.
Financial support and sponsorship
This study was supported by UGC-BSR, Government of India.
Conflicts of interest
There are no conflicts of interest.
REFERENCES
- 1.Cho NH, Shaw JE, Karuranga S, Huang Y, da Rocha Fernandes JD, Ohlrogge AW, et al. IDF diabetes atlas: global estimates of diabetes prevalence for 2017 and projections for 2045. Diabetes Res Clin Pract. 2018; 138:271–81. doi: 10.1016/j.diabres.2018.02.023. [DOI] [PubMed] [Google Scholar]
- 2.American Diabetes Association. Diagnosis and classification of diabetes mellitus. Diabetes Care. 2010;33:S62–69. doi: 10.2337/dc10-S062. [DOI] [PMC free article] [PubMed] [Google Scholar]
- 3.Chaudhury A, Duvoor C, Reddy Dendi VS, Kraleti S, Chada A, Ravilla R, et al. Clinical review of antidiabetic drugs: implications for type 2 diabetes mellitus management. Front Endocrinol (Lausanne) 2017;8:6. doi: 10.3389/fendo.2017.00006. [DOI] [PMC free article] [PubMed] [Google Scholar]
- 4.Pickering RJ, Rosado CJ, Sharma A, Buksh S, Tate M, de Haan JB. Recent novel approaches to limit oxidative stress and inflammation in diabetic complications. Clin Transl Immunol. 2018;7:e1016. doi: 10.1002/cti2.1016. [DOI] [PMC free article] [PubMed] [Google Scholar]
- 5.Hefti FF. Requirements for a lead compound to become a clinical candidate. BMC Neurosci. 2008;9:S7. doi: 10.1186/1471-2202-9-S3-S7. [DOI] [PMC free article] [PubMed] [Google Scholar]
- 6.Al-Awar A, Kupai K, Veszelka M, Szűcs G, Attieh Z, Murlasits Z, et al. Experimental diabetes mellitus in different animal models. J Diabetes Res. 2016;2016:9051426. doi: 10.1155/2016/9051426. [DOI] [PMC free article] [PubMed] [Google Scholar]
- 7.Wu J, Yan LJ. Streptozotocin-induced type 1 diabetes in rodents as a model for studying mitochondrial mechanisms of diabetic β cell glucotoxicity. Diabetes Metab Syndr Obes. 2015;8:181–8. doi: 10.2147/DMSO.S82272. [DOI] [PMC free article] [PubMed] [Google Scholar]
- 8.Masiello P, Broca C, Gross R, Roye M, Manteghetti M, Hillaire-Buys D, et al. Experimental NIDDM: development of a new model in adult rats administered streptozotocin and nicotinamide. Diabetes. 1998;47:224–9. doi: 10.2337/diab.47.2.224. [DOI] [PubMed] [Google Scholar]
- 9.Chaubey PS, Somani G, Kanchan D, Sathaye S, Varakumar S, Singhal RS. Evaluation of debittered and germinated fenugreek (Trigonella foenum graecum L.) seed flour on the chemical characteristics, biological activities, and sensory profile of fortified bread. J Food Process Preserv. 2018;42:e13395. [Google Scholar]
- 10.Cacho J, Sevillano J, de Castro J, Herrera E, Ramos MP. Validation of simple indexes to assess insulin sensitivity during pregnancy in Wistar and Sprague-Dawley rats. Am J Physiol Endocrinol Metab. 2008;295:E1269–76. doi: 10.1152/ajpendo.90207.2008. [DOI] [PubMed] [Google Scholar]
- 11.Nayak Y, Hillemane V, Daroji VK, Jayashree BS, Unnikrishnan MK. Antidiabetic activity of benzopyrone analogues in nicotinamide-streptozotocin induced type 2 diabetes in rats. Scientificworldjournal. 2014;2014:854267. doi: 10.1155/2014/854267. [DOI] [PMC free article] [PubMed] [Google Scholar]
- 12.Kanchan DM, Somani GS, Peshattiwar VV, Kaikini AA, Sathaye S. Renoprotective effect of diosgenin in streptozotocin induced diabetic rats. Pharmacol Rep. 2016;68:370–7. doi: 10.1016/j.pharep.2015.10.011. [DOI] [PubMed] [Google Scholar]
- 13.Kishore L, Kaur N, Singh R. Nephroprotective effect of Paeonia emodi via inhibition of advanced glycation end products and oxidative stress in streptozotocin-nicotinamide induced diabetic nephropathy. J Food Drug Anal. 2017;25:576–88. doi: 10.1016/j.jfda.2016.08.009. [DOI] [PMC free article] [PubMed] [Google Scholar]
- 14.Szkudelski T. Streptozotocin-nicotinamide-induced diabetes in the rat. Characteristics of the experimental model. Exp Biol Med (Maywood) 2012;237:481–90. doi: 10.1258/ebm.2012.011372. [DOI] [PubMed] [Google Scholar]
- 15.Wu KK, Huan Y. Streptozotocin-induced diabetic models in mice and rats. Curr Protoc Pharmacol. 2008 doi: 10.1002/0471141755.ph0547s40. Chapter 5:Unit 5.47. [DOI] [PubMed] [Google Scholar]
- 16.Ghasemi A, Khalifi S, Jedi S. Streptozotocin-nicotinamide-induced rat model of type 2 diabetes (review) Acta Physiol Hung. 2014;101:408–20. doi: 10.1556/APhysiol.101.2014.4.2. [DOI] [PubMed] [Google Scholar]
- 17.Ayala JE, Samuel VT, Morton GJ, Obici S, Croniger CM, Shulman GI, et al. NIH Mouse Metabolic Phenotyping Center Consortium. Standard operating procedures for describing and performing metabolic tests of glucose homeostasis in mice. Dis Model Mech. 2010;3:525–34. doi: 10.1242/dmm.006239. [DOI] [PMC free article] [PubMed] [Google Scholar]
- 18.Furman BL. Streptozotocin-induced diabetic models in mice and rats. Curr Protoc Pharmacol. 2015;70:5.47.1–5.47.20. doi: 10.1002/0471141755.ph0547s70. [DOI] [PubMed] [Google Scholar]
- 19.Adinortey M. Biochemicophysiological mechanisms underlying signs and symptoms associated with diabetes mellitus. Adv Biol Res. 2017;11:382–90. [Google Scholar]
- 20.Anand BK, Chhina GS, Singh B. Effect of glucose on the activity of hypothalamic “feeding centers”. Science. 1962;138:597–8. doi: 10.1126/science.138.3540.597. [DOI] [PubMed] [Google Scholar]
- 21.Boden G, Laakso M. Lipids and glucose in type 2 diabetes: what is the cause and effect? Diabetes Care. 2004;27:2253–9. doi: 10.2337/diacare.27.9.2253. [DOI] [PubMed] [Google Scholar]
- 22.Goldberg IJ. Clinical review 124: diabetic dyslipidemia: causes and consequences. J Clin Endocrinol Metab. 2001;86:965–71. doi: 10.1210/jcem.86.3.7304. [DOI] [PubMed] [Google Scholar]
- 23.Vergès B. Pathophysiology of diabetic dyslipidaemia: where are we? Diabetologia. 2015;58:886–99. doi: 10.1007/s00125-015-3525-8. [DOI] [PMC free article] [PubMed] [Google Scholar]
- 24.Howard BV. Lipoprotein metabolism in diabetes mellitus. J Lipid Res. 1987;28:613–28. [PubMed] [Google Scholar]
- 25.Koletsky P. The glucose tolerance test as a laboratory tool with clinical implications. IntechOpen. 2012. [Last accessed on 17th September 2019]. 105772/54785, Available from: https://wwwintechopencom/books/glucose-tolerance/the-glucose-tolerance-test-as-a-laboratory-tool-with-clinical-implications .
- 26.Akinmokun A, Selby PL, Ramaiya K, Alberti KG. The short insulin tolerance test for determination of insulin sensitivity: a comparison with the euglycaemic clamp. Diabet Med. 1992;9:432–7. doi: 10.1111/j.1464-5491.1992.tb01813.x. [DOI] [PubMed] [Google Scholar]
- 27.Patarrão RS, Wayne Lautt W, Paula Macedo M. Assessment of methods and indexes of insulin sensitivity. Revista Portuguesa de Endocrinologia, Diabetes e Metabolismo. 2014;9:65–73. [Google Scholar]
- 28.Wallace TM, Levy JC, Matthews DR. Use and abuse of HOMA modeling. Diabetes Care. 2004;27:1487–95. doi: 10.2337/diacare.27.6.1487. [DOI] [PubMed] [Google Scholar]
- 29.Chen H, Sullivan G, Quon MJ. Assessing the predictive accuracy of QUICKI as a surrogate index for insulin sensitivity using a calibration model. Diabetes. 2005;54:1914–25. doi: 10.2337/diabetes.54.7.1914. [DOI] [PubMed] [Google Scholar]
- 30.Katz A, Nambi SS, Mather K, Baron AD, Follmann DA, Sullivan G, et al. Quantitative insulin sensitivity check index: a simple, accurate method for assessing insulin sensitivity in humans. J Clin Endocrinol Metab. 2000;85:2402–10. doi: 10.1210/jcem.85.7.6661. [DOI] [PubMed] [Google Scholar]
- 31.Dabla PK. Renal function in diabetic nephropathy. World J Diabetes. 2010;1:48–56. doi: 10.4239/wjd.v1.i2.48. [DOI] [PMC free article] [PubMed] [Google Scholar]
- 32.Brownlee M. The pathobiology of diabetic complications: a unifying mechanism. Diabetes. 2005;54:1615–25. doi: 10.2337/diabetes.54.6.1615. [DOI] [PubMed] [Google Scholar]
- 33.Fakhruddin S, Alanazi W, Jackson KE. Diabetes-induced reactive oxygen species: mechanism of their generation and role in renal injury. J Diabetes Res. 2017;2017:8379327. doi: 10.1155/2017/8379327. [DOI] [PMC free article] [PubMed] [Google Scholar]
- 34.Tervaert TW, Mooyaart AL, Amann K, Cohen AH, Cook HT, Drachenberg CB, et al. Renal Pathology Society. Pathologic classification of diabetic nephropathy. J Am Soc Nephrol. 2010;21:556–63. doi: 10.1681/ASN.2010010010. [DOI] [PubMed] [Google Scholar]


