

Abstract
Diffuse intrinsic pontine glioma (DIPG) is an incurable brain tumor of childhood characterized by histone mutations at lysine 27, which results in epigenomic dysregulation. There has been a failure to develop effective treatment for this tumor. Using a combined RNAi and chemical screen targeting epigenomic regulators, we identify the polycomb repressive complex 1 (PRC1) component BMI1 as a critical factor for DIPG tumor maintenance in vivo. BMI1 chromatin occupancy is enriched at genes associated with differentiation and tumor suppressors in DIPG cells. Inhibition of BMI1 decreases cell self-renewal and attenuates tumor growth due to induction of senescence. Prolonged BMI1 inhibition induces a senescence-associated secretory phenotype, which promotes tumor recurrence. Clearance of senescent cells using BH3 protein mimetics co-operates with BMI1 inhibition to enhance tumor cell killing in vivo.
Keywords: DIPG, RNAi screen, BMI1, PTC 028, BH3 mimetics, senescence, SASP, H3K27M mutant, H3WT
Graphical Abstract
Highlights
-
•
An integrated RNAi and drug screen identifies BMI1 as a target in H3K27M-mutant DIPG
-
•
H3K27M mutation alters histone modifications at the BMI1 promoter
-
•
Inhibition of BMI1 exerts an anti-tumor effect by driving senescence
-
•
Clearance of senescent cells using BH3 mimetics enhances the efficacy of BMI1 inhibition
Balakrishnan et al. identify BMI1 as an oncogenic target using a combinatorial RNAi and drug screen in diffuse intrinsic pontine glioma. Genetic and pharmacological inhibition of BMI1 decreases cell self-renewal by driving senescence in vitro and in vivo. Clearance of these senescent cells prolongs survival in the patient-derived xenograft model.
Introduction
Diffuse intrinsic pontine glioma (DIPG) is an aggressive, malignant pediatric brain tumor and is one of the leading causes of brain-tumor-related death in children (Bartels et al., 2011; Grimm and Chamberlain, 2013). DIPGs demonstrate an infiltrative pattern of growth within the pons that cannot be resected (Bartels et al., 2011; Jansen et al., 2012). Combination chemotherapy and unselected single-agent targeted therapy trials have not improved outcomes, whereas radiotherapy provides only palliative benefits (Bartels et al., 2011; Jansen et al., 2012). Genetic analysis of these tumors demonstrated that a somatic Lys27Met substitution in histone H3.3 (H3.3K27M mutation) or histone H3.1 (H3.1K27M mutation) occurs in more than 85% of patients with DIPG and is associated with aggressive tumor growth and poor survival (Schwartzentruber et al., 2012; Sturm et al., 2014; Warren et al., 2012; Wu et al., 2012).
A Lys27Met substitution in histone H3 (H3K27M mutation) results in global hypomethylation at histone H3 lysine 27 trimethylation (H3K27me3)-bound promoters, with consequent transcriptional de-repression of these loci (Chan et al., 2013). Although the H3K27M driver mutation has been shown to have an oncogenic role, overexpression of the H3K27M transgene by itself does not induce DIPG tumors in murine brain stem cells (Halvorson et al., 2015; Lewis et al., 2013). Clearly, dysregulation of the epigenome is a key factor in DIPG tumorigenesis, but the exact mechanisms are not well understood. We hypothesized that other key epigenetic regulators are required to provide DIPG cells with a survival advantage in the presence of the H3K27M mutation. To identify additional epigenetic regulators that cooperate with H3K27M to sustain cells in a transformed state, we performed an RNAi-based pooled library screen targeting 408 epigenetic genes in DIPG combined with a complementary drug screen targeting epigenetic regulators. These paired studies identified BMI1 as a target that severely affected DIPG cell growth.
Polycomb repressive complex 1 (PRC1) proteins are essential for normal gene regulation during embryonic development and are dysregulated in many cancers (Scelfo et al., 2015). BMI1 is a core component of PRC1, where it acts as an epigenetic chromatin modifier to regulate complex genomic programs in stem cells and cancer cells (Sauvageau and Sauvageau, 2010). In particular, BMI1 associates with other PRC1 partners to remodel chromatin through histone H2A lysine 119 monoubiquitination (H2AubK119, or H2Aub) (Li et al., 2006; Sauvageau and Sauvageau, 2010). We and others have shown that chemical inhibition of BMI1 can attenuate DIPG cell growth in vitro, but the mechanisms are unclear (Kumar et al., 2017; Venkataraman et al., 2016).
Here we show that increased expression of BMI1 is a direct product of H3K27M mutation. Inhibition of BMI1 drives DIPG cells into senescence and activates the senescence-associated secretory phenotype (SASP). Recent studies show that induction of senescence in tumor cells is beneficial only transiently, whereas accumulation of senescent cells is detrimental in long-term treatments (Muñoz-Espín and Serrano, 2014; Sun et al., 2012). We show that clearance of senescent DIPG cells with BH3 (B cell lymphoma homology 3) mimetics that possess senolytic effects synergizes with BMI1 inhibition to induce cell death in vitro and improve anti-tumor efficacy in vivo.
Results
Complimentary RNAi and Drug Screens Targeting Epigenetic Genes Identify BMI1 as a Key Regulator of H3K27M-Mutant DIPG Cell Growth
To test our hypothesis that other key epigenetic regulators are required to provide DIPG cells with a survival advantage in the presence of H3K27M, we performed an RNAi-based functional genomic short hairpin RNA (shRNA) screen in DIPG cells. SU-DIPG04 (H3K27M) and histone H3 wild-type (WT) VUMC-DIPG10 cells were transduced with the lentivirus expressing a pool of shRNAs targeting different regions within each of the epigenetic genes. To eliminate off-target effects, non-targeting shRNAs were included. Sequencing results were analyzed by comparing the shRNAs present on day 0 (72 h after transduction) with those present on day 21, with false discovery rates (FDRs) of 0.5 and 0.1, respectively, to identify shRNAs that were depleted at 21 days (∼7 to 8 passages) after transduction (Figures 1 A, 1B, S1A, and S1F). To identify potential drug targets, we performed a complimentary drug screen consisting of 211 small-molecule inhibitors of epigenetic genes (Figures 1A, 1C, S1B, and S1C).
Figure 1.

Complimentary Functional shRNA and Drug Screens Targeting Epigenetic Genes to Identify Crucial Regulators of the H3K27M-Mutant DIPG Tumor Cell Growth
(A) Schematic of the epigenetic shRNA and drug screen performed.
(B) Fold changes in depleted shRNAs (blue), unchanged shRNAs (black), and enriched shRNAs (red) targeting epigenetic genes from the shRNA pool. Blue dots show shRNAs corresponding to the set of genes when knockdown inhibits SU-DIPG04 cell proliferation, black dots represent shRNAs with no change, and red dots identify tumor-suppressor genes that, when inhibited, promote cell proliferation. The x axis shows shRNA representation for each gene.
(C) Percentage of cell viability of SU-DIPG04 cells after indicated individual drug treatments from the drug screen pool for 5 days at 3 μM compared with DMSO-treated cells (100%).
(D) Secondary validation using individual shRNAs of the top hits identified from the primary pooled-shRNA screen using SF8628 cells. Data represent mean ± SEM.
(E) Venn diagram summarizes the number of genes with the highest fold change (FDR = 0.5) that were depleted in the two complementary screens using SU-DIPG04 cells.
(F) Overlap of seven sets of genes significantly depleted in both screens.
In H3K27M-SU-DIPG04 cells, our analysis identified shRNAs targeting 80 genes with significant loss at day 21. Several top-hit genes, including AFF4, HDACs, BRDs, and JMJDs, have already been shown as crucial targets in DIPG, validating our target identification (Dahl et al., 2020; Grasso et al., 2015; Hashizume, 2017; Piunti et al., 2017). Target genes depleted in at least 3 replicates and scored in the top 25% of the depleted shRNAs for each significant gene were considered top hits. The fold change of these leading-edge genes is shown in Figure S1D. PCGF2/Mel18 and BMI1, both core members of PRC1 that have similar biological and biochemical functions, were among the key targets in the RNAi screen (Figures 1B and S1E). Additional validation of gene targets identified in the primary screen was performed with shRNAs targeting individual genes in SF8628 (H3K27M), which confirmed BMI1 as a crucial regulator of DIPG cell growth (Figure 1D). The fold change in all identified top-hit shRNAs targeting genes in H3K27M and in H3 WT-DIPGs are shown in Table S1. Importantly, BMI1 was not identified as a top hit in the H3 WT VUMC-DIPG10 cells (Figure S1F).
Ten genes functionally annotated to three major biological processes (histone modification, chromatin remodeling, and cell-cycle regulation) were common vulnerabilities between H3K27M-mutant and WT pontine tumor cells (Figure S1G). BMI1 was specific to the H3K27M-DIPG cells.
In the complimentary epigenetic drug screen, only ∼35 drugs targeting 22 genes significantly suppressed cell viability to less than 40% compared with control (DMSO) cells (Figure 1C). Complete fold change in cell viability with all drugs in the screen is given in Figure S1H and Table S1. The combined screens identified seven chromatin-associated genes and their corresponding chemical inhibitors as the key regulators of H3K27M-mutant DIPG cell growth (Figure 1E; Table S1). As expected, not all top-hit genes were the same in both screens. The seven identified key regulators of DIPG cell growth included histone deacetylases, bromodomains, and lysine demethylases (Jumonji demethylases, JDMs); BMI1; and methyltransferases including PRMTs (protein arginine methyltransferases), EHMTs (euchromatic histone-lysine N-methyltransferases), and DNMTs (DNA methyltransferases) (Figure 1F). Many of these were previously validated as targets in DIPG (Grasso et al., 2015; Hashizume, 2017; Piunti et al., 2017). We chose to further investigate the role of BMI1 in H3K27M-mutant DIPGs, because it was common to both shRNA and drug screen in H3K27M cells, but not WT cells.
BMI1 and BMI1-Catalyzed H2Aub Is Overexpressed in DIPG
BMI1 mRNA expression was significantly elevated in a local cohort of DIPG patient samples (Figure S1I) and a publicly available larger cohort of DIPG patients compared with normal pons (Figure S1J). To examine whether BMI1 was clinically relevant, we evaluated the expression of BMI1 protein in a cohort of DIPG tumor specimens. These specimens demonstrated the typical histological features of DIPG (Figure 2 Ai). BMI1 protein is highly expressed in a panel of DIPG patient samples (Figure 2Aii) expressing positive H3K27M-mutant staining (Figure 2Aiii) with reduced expression of H3K27me3 (Figure 2Aiv). The relative expression of BMI1 in the H3 WT-DIPG patient sample is lower than that in H3K27M-DIPGs as seen by immunohistochemistry (IHC), although this finding was limited by the number of available specimens because of the rarity of H3 WT-DIPGs (Figure S2A).
Figure 2.

IHC and ChIP-Seq Analysis of Indicated Proteins in H3K27M-DIPGs and Normal Cells
(A) DIPG patient tumors and normal pons tissue section staining for H&E, BMI1, H3K27M, H3K27me3, and H2Aub. Positive control is the SU-DIPGXIII cell pellet sections stained for different proteins. Scale bar, 50 μm.
(B and C) Scoring of BMI1, ∗∗∗p < 0.003 DIPG versus pons (B), and H2Aub, ∗p < 0.04 DIPG versus pons (C), from the IHC slides of pons and DIPG patient samples. Data represent mean ± SEM.
(D) Western blot of BMI1 protein in DIPG cell lines.
(E) Genome tracks of H3K27ac at the BMI1 promoter in OPCs, in different brain regions, and in H3K27M-DIPGs. The x axis represents the BMI1 genomic location, and the y axis represents the RPM (reads per million) value.
BMI1 mediates transcriptional repression of target genes through H2Aub (Cao et al., 2005; Morey et al., 2015). Consistent with these observations, the H3K27M-DIPG patient tissues with high BMI1 also showed increased H2Aub protein expression (Figure 2Av), suggesting that increased expression of BMI1 is correlated with its increased functional activity. BMI1 and H2Aub expression was semiquantitatively assessed, and both scored significantly higher in the H3K27M-DIPG patient tissues compared with normal pons (Figures 2B and 2C). Similarly, DIPG cell lines revealed higher expression of BMI1 at the protein level compared with the normal pons (Figure 2D). Cell lines expressing the H3K27M mutant showed increased H2Aub protein and increased mRNA expression of BMI1 compared with normal pons and other cancer cell lines (Figures S2B and S2C).
Because H3K27M is associated with increased levels of histone H3 lysine 27 acetylation (H3K27ac), which in turn increases gene transcription, we examined the occupancy of H3K27ac marks at the BMI1 promoter in different cell lineages within the context of DIPG. Increased enrichment of H3K27ac marks was noted at the BMI1 promoter in H3K27M-DIPG tumor cells compared with both oligodendrocyte precursor cells (OPCs) and cells from different regions of normal brain (Figure 2E) (Nagaraja et al., 2019). These data together suggest that the increased expression of BMI1 is correlated to that of H3K27M-mutant expression in DIPGs.
Expression of H3K27M Mutation Upregulates BMI1 in Cells
To investigate whether the high expression of BMI1 in DIPG was a result of H3K27M histone mutation, we developed isogenic DIPG model cell lines and normal human astrocytes (NHA) (see STAR Methods): HSJD-GBM01+H3K27M, VUMC-DIPG10+H3K27M, NHA+H3K27M, and HSJD-DIPG-007+H3.3 WT. Expression of the H3K27M transgene in the histone WT cells resulted in an increase in BMI1 level (Figures 3Ai–3Aiii and 3Bi–3Biii) and in H2Aub protein (Figures 3 Ci–3Ciii). These changes were accompanied by increased cell proliferation (Figures 3Di–3Diii) (Funato et al., 2014), as well as a decrease in H3K27me3 and an increase in H3K27M proteins (Figures 3Ci–3Ciii). In contrast, HSJD-DIPG-007 cells transduced with H3.3 WT transgene showed a significant decrease in the BMI1 expression (Figures 3Aiv and 3Biv), a decrease in H2Aub (Figure 3Civ), and a decrease in cell proliferation (Figure 3Div), accompanied by a moderate increase in H3K27me3 (Figure 3Civ). Although NHA+H3K27M cells showed high H3K27M protein expression, we found no significant change in cell proliferation, suggesting the need for additional transforming factors or that NHA may not recapitulate DIPG-like tumors in the presence of H3K27M (Figure 3Dii).
Figure 3.

Impact of H3K27M Mutation on BMI1 Demonstrated Using Isogenic Model Cell Lines
(A–C) Expression of BMI1 mRNA (A), BMI1 protein (B), and histone proteins (C).
(D) Cell proliferation measured by XCELLigence.
(E) Enrichment plot from GSEA for BMI1- and Mel18-related gene sets in H3.3K27M-mutant overexpression in HSJD-GBM01 (left) and in H3.3 WT overexpression in HSJD-DIPG-007 (right).
(F) H3K27ac, H3K27me3, and total H3 ChIP-seq tracks at the BMI1 promoter in HSJD-DIPG-007 and H3.3 WT transduced cells. See also Figure S2D.
(G) Effect of CRISPR-CAS9-mediated H3K27M-KO in SU-DIPGXIII on the expression of (i) BMI1 mRNA, (ii) BMI1 protein, (iii) histones in the parental and H3K27M-KO cells, and (iv) genome browser tracks showing changes in H3K27ac and H3K27me3 marks at the BMI1 promoter in these cells. Pairwise comparisons; ∗p < 0.05, ∗∗p < 0.01, ∗∗∗p < 0.001 by Student’s t test. See also Figures S2D and S2E. Data represent mean ± SEM.
RNA sequencing (RNA-seq) and gene set enrichment analysis (GSEA) of the isogenic cell lines showed predominant changes in BMI1 pathway genes. Genes that depended on BMI1 for its function were upregulated in HSJD-GBM01+H3K27M cells compared with HSJD-GBM01 WT cells. There was a clear shift in the gene expression upon transduction of the H3K27M transgene into WT glioma cells (Figure 3E).Those same sets of genes were all downregulated in HSJD-DIPG-007+H3.3WT-expressing cells compared with its isogenic paired line (Figure 3E). These changes were reflected at the chromatin level: expression of H3.3 WT in H3K27M-HSJD-DIPG-007 cells increased the repressor H3K27me3 occupancy while decreasing the activating H3K27ac mark at the BMI1 promoter (Figure 3F).
To validate our findings in another model, we used the CRISPR-CAS9-mediated H3K27M-mutant knockout (H3K27M-KO) SU-DIPGXIII cells that were previously established (Harutyunyan et al., 2019). H3K27M-KO significantly reduced expression of BMI1 and its associated functional partner H2Aub compared with the original mutant SU-DIPGXIII cells (Figures 3Gi–3Giii). Furthermore, analyzing the publicly available chromatin immunoprecipitation sequencing (ChIP-seq) dataset for these CRISPR-modified cells (Harutyunyan et al., 2019) clearly showed that this reduction in BMI1 in the H3K27M-KO cells is associated with a decrease in the enrichment of H3K27ac marks and concomitant increase in the repressive H3K27me3 marks at the BMI1 promoter region (Figure 3Giv). These findings suggest that the H3K27M mutation directly regulates repressive and activating marks at the BMI1 promoter to control its gene expression. More interestingly, a similar decrease in the enrichment of H3K27ac marks wasseen at the promoter regions of other leading-edge genes that we identified in Figures 1F and S1D in the H3K27M-mutant edited DIPG cells (Figures S2D and S2E). This suggests that H3K27M increases the expression of these genes to change the global epigenetic landscape, thus promoting tumorigenesis.
BMI1 Is Required for Cell Self-Renewal and Maintenance of H3K27M-Mutant DIPG Cells in a Stem-like State
Because BMI1 controls stem cell self-renewal (Park et al., 2004; Siddique et al., 2013), we next examined whether BMI1 is required for DIPG cell self-renewal. We stably transduced multiple H3K27M-DIPG cells with lentivirus-expressing shRNAs targeting BMI1 or with non-targeting shRNAs (shNull) (Figure S3A). Depletion of BMI1 significantly decreased the neurosphere size (Figures S3B and S3C) and attenuated the frequency of neurosphere formation significantly as measured by limiting-dilution assay (Figure S3D). These data show that the tumor initiating capacity of H3K27M-DIPG cells was significantly decreased by depleting BMI1.
To confirm the influence of BMI1 on the stemness of H3K27M-DIPGs, we examined the expression of neuroglial stem cell markers OLIG2, SOX2, and NESTIN (Anderson et al., 2017; Misuraca et al., 2016; Xu et al., 2017). Expression of these markers decreased with BMI1 knockdown (Figure S3E), which is consistent with the reduction in neurosphere formation.
To explore the impact of BMI1 depletion in DIPG, RNA-seq was performed on these cells. GSEA of the RNA-seq data show decreased E2F1 accompanied by a decrease in cell mitosis and increased cellular senescence gene programs (Figure S4A). In line with this, we observed a significant decrease in the colony-forming ability of BMI1-depleted DIPG cells (Figures S4B and S4C). Downregulated genes mapped to cancer-promoting pathways, including cell proliferation and cell cycle (Figure S4D), whereas upregulated genes mapped to cell differentiation pathways (Figure S4E). These data suggest that BMI1 inhibition suppresses pro-tumorigenic pathways activated by the H3K27M mutation and promotes differentiation gene programs.
Small-Molecule Inhibitors of BMI1 Decrease H3K27M-Mutant DIPG Cell Proliferation
High-throughput screening of small-molecule inhibitors identified PTC (post-translational control) compounds that inhibit the function of BMI1 and cell proliferation as promising targets in DIPG. These compounds, developed by PTC Therapeutics, inhibit BMI1 activity and decrease BMI1 protein expression (Dey et al., 2018; Wang et al., 2017). PTC209 and PTC028 both decreased BMI1 expression and significantly inhibited H3K27M-DIPG cell growth in a dose-dependent manner with low nanomolar concentrations (Figures 4 Ai, S5A, and S5Bi). We then examined whether the KO of the H3K27M mutation in DIPG alters sensitivity to BMI1 inhibition. CRISPR-CAS9-mediated H3K27M-KO and their paired isogenic H3K27M-mutant cells were treated with varying concentrations of PTC028 for 5 days, and the half maximal inhibitory concentration, IC50 values of growth inhibition were determined. H3K27M-KO DIPG cells were less sensitive to BMI1 inhibition compared with their parental cells (Figures 4Aii and S5Bii). Conversely, ectopic expression of H3K27M in the NHA cells (NHA+H3K27M), resulted in increased sensitivity to PTC028 compared with the parental NHA cells (Figures 4Aii and S5Bii). These findings also suggest that the differential increase in BMI1 because of the presence of H3K27M mutation is functionally contributing to DIPG tumor growth. Both PTC compounds significantly impaired the self-renewal capacity of H3K27M-DIPG cells (Figures 4B and S5C). We then treated a H3K27M-DIPG primary tumor short-term culture (UPN-1285, high BMI1) with PTC028. There was a significant decrease in cell viability, suggesting that inhibiting BMI1 can be an effective treatment in DIPG (Figure 4C).
Figure 4.

In Vitro and In Vivo Anti-tumor Effects of BMI1 Inhibition in DIPGs
(A) Growth inhibitory IC50 values of BMI1 small-molecule inhibitors (i) in DIPG cell lines using PTC209 and PTC028 and (ii) in H3K27M-mutant-modified lines (+H3K27M is mutant transduced, and H3K27M-KO is the CRISPR-CAS9 KO of the mutant) using PTC028. See also Figure S5B.
(B) Neurosphere size was measured by live-cell imaging with DIPG cells treated with PTC drugs, using Incucyte at day 12 after treatment. By ANOVA, DMSO versus PTC (three groups), p = 0.0034 (SU-DIPGXIII) and p = 0.0048 (SF8628). Pairwise comparison; ∗p < 0.01, ∗∗p < 0.002, ∗∗∗p < 0.0001; DMSO versus PTC treatments by Student’s t test. See also Figure S5C. Data represent mean ± SEM
(C) Cell viability measured using a primary DIPG patient-derived cell, UPN1285, treated with 100 nM of PTC028 for 3 days. Pairwise comparison; ∗∗∗p < 0.004; ∗DMSO versus PTC treatments by Student’s t test. Data represent mean ± SEM.
(D) (i) Tumor implant and treatment protocol, (ii) Kaplan-Meier survival plot of the animals treated with either vehicle or PTC028 (n = 7 each group), and (iii) IHC analysis of p16, p21, and GLB1 expression of the treated tumor tissue. See also Figure S5D.
(E) Volcano plot, with a heatmap adjacent to it, showing the differentially expressed genes detected by RNA-seq in PTC028-treated SF8628 cells compared with DMSO control. Genes highlighted in orange are expressed with an FDR = 0.05 and are associated with cell proliferation, differentiation, or tumor-suppressor pathways. See also Figure S5E.
(F) GSEA from the RNA-seq data obtained from SF8628 cells treated with PTC028 (IC50) compared with DMSO-treated cells annotated to multiple signaling pathway gene sets. See Figure S5F.
Previous studies established that both PTC209 and PTC028 spare normal cells while targeting tumor cells (Bakhshinyan et al., 2019). Therefore, we extended our studies in vivo to validate the anti-tumor effect of PTC028. BT245-luc2-GFP (H3K27M) cells were implanted into the murine pons to form xenografts and then treated with PTC028 (Figure 4Di). The Kaplan-Meier survival estimate showed that PTC028 treatment significantly increased animal survival rate when the median survival in PTC028-treated mice (33 days) was compared with that in control mice (22 days) (∗∗p = 0.0074) (Figure 4Dii). BT245 xenograft tumors were tested for the expression of H3K27M and morphology to confirm fidelity to human DIPG tumors (Figure S5D). Given that the oncogenic role of BMI1 is to repress the transcription of tumor suppressors, including p21 and p16, with the latter as the best-known target for cell growth arrest and senescence (Jacobs et al., 1999), we hypothesized that this increased survival could result from increase in tumor suppressors. Therefore, we analyzed these proteins in the tumor tissues exposed to PTC028 treatment and in the vehicle-treated controls by IHC. There was an increase in p16, p21, and their associated senescent β-galactosidase (β-gal) protein, GLB1 (Wagner et al., 2015), in the PTC028-treated tumor tissues, indicating effective inhibition of BMI1 in vivo (Figure 4Diii).
This is the first demonstration of in vivo activity of BMI1 inhibition in a murine pontine DIPG model. These data are critical, because they support the current clinical trial of BMI1 inhibition in children with DIPG (NCT03605550), which was initiated in the absence of in vivo preclinical studies.
To understand the molecular mechanisms of PTC028-induced growth arrest, and to test whether chemical inhibition phenocopies the genetic inhibition of BMI1, we performed RNA-seq to study the transcriptomic changes induced by the inhibition of BMI1 function (Figures 4E and S5E). Analysis of the resultant data in two cell lines showed 48 and 39 genes were downregulated and 152 and 120 genes were upregulated in PTC028-treated SF8628 and SU-DIPG04 cells, respectively (∗p < 0.05). Further analysis of these genes shows that similar to genetic knockdown of BMI1, PTC028 treatment decreased the expression of certain crucial proliferative (E2F1 and KRAS) and stem cell markers (NESTIN and SOX2) while increasing the expression of tumor-suppressor genes (p21) and differentiation markers (GFAP) (Figures 4E and S5E). GSEA identified networks associated with cell proliferation and stemness as significantly downregulated and networks associated with oligodendrocyte differentiation and senescence as upregulated by PTC028 (Figures 4F and S5F).
PTC028 Treatment Reverses BMI1 and H2A Ubiquitination-Mediated Repression of Differentiation-Related Genes
Gene enrichment analysis from RNA-seq data showed that inhibition of BMI1, by both shRNA and PTC028, induced differentiation in DIPG cells (Figures 4F and S5F). A recent single-cell RNA-seq study on H3K27M-DIPGs identified two distinct cell populations: astrocytic and oligodendrocytic (Filbin et al., 2018). We therefore investigated whether PTC028 treatment changed the chromatin status of the genes involved in the differentiation of these two cell lineages. Because BMI1 catalyzes H2Aub for repression of target genes, we asked whether BMI1 and H2Aub occupy the same differentiation gene loci and whether PTC028 treatment alters their chromatin occupancy.
BMI1 occupies chromatin throughout the genome but is enriched at transcription start sites (TSSs) (Figures 5 A, S6A, and S6B). Analysis of genes associated with BMI1 occupancy reveals numerous processes involving neuronal differentiation pathways (denoted by an asterisk) enriched in BMI1 occupancy (Figure 5B). A heatmap view of the ChIP-seq read intensity confirmed significant loss of BMI1 binding with PTC028 treatment across the genome in SU-DIPG04 (Figure 5C) and SF8628 (Figure S6C). The BMI1 peak count ± 3 kb surrounding the TSS was significantly attenuated in the PTC028-treated SU-DIPG04 cells (Figures 5C and 5D) and SF8628 cells (Figures S6C and S6D), both with p < 0.01. The average levels of H2Aub peaks were decreased to a lesser extent with PTC028 treatments (Figures 5C, 5E, S6C, and S6E). Importantly, pathway analysis of genes with high promoter BMI1 binding revealed a decrease in BMI1 binding with PTC028 treatment, including differentiation-related genes (Figure 5F, denoted by an asterisk).
Figure 5.

BMI1 and H2Aub Genomic Distribution and Changes in Its Enrichment at Specific Genomic Regions with Chemical Inhibition of BMI1
(A and B) ChIP-seq heatmap analysis of BMI1-enriched genomic loci (A) and KEGG pathway enrichment for BMI1 peaks (B) in SU-DIPG04 and SF8628 cells.
(C) ChIP-seq heatmaps of BMI1 and H2Aub in SF8628 cells treated with DMSO (blue) or PTC028 (orange).
(D and E) Average profiles of BMI1 peaks (D) and H2Aub (E) in SU-DIPG04 cells treated with DMSO (green) or PTC028 (orange).
(F) KEGG pathway changes in BMI1 peak enrichment in SU-DIPG04 cells after treatments.
(G) Genome browser views representing the results of ChIP-seq for BMI1 and H2Aub and the results of RNA-seq for the genes GLUL, PTGDS, and SFRP2 in SU-DIPG04 cells.
All ChIP-seq peaks are relative to TSS (±3 kb). Asterisks indicate pathways of differentiation. See also Figure S6.
We then examined the BMI1 and H2Aub occupancy at promoters of three genes that are known to be involved in the differentiation of astrocytes and oligodendrocytes, namely, GLUL, PTGDS, and SFRP2 (Jin et al., 2017; Tcw et al., 2017; Zhao et al., 2015). The chromatin occupancy of BMI1 and H2Aub decreased in PTC028-treated cells compared with DMSO-treated cells (Figure 5G). The decreased occupancy was associated with a concomitant increase in the expression levels of these genes after PTC028 treatment (Figure 5G). We then tested whether similar binding of BMI1 and H2Aub would be seen in a biopsy-derived cell line H3K27M-SF8628 to control for possible effects of radiation treatment on BMI1 (Ginjala et al., 2011). We found a similar binding peak for both BMI1 and H2Aub in SF8628 cells, as well as that PTC028 treatment increased the expression of the same set of differentiation genes seen in SU-DIPG04 cells (Figure S6Fi). Compared with normal cells, these differentiation genes are expressed at lower levels in DIPG patient tumors, as shown in Figure S6Fii. These data suggest that BMI1 contributes to the undifferentiated state of H3K27M-DIPG cells by directly occupying promoters of differentiation-related genes in both astrocytic and oligodendrocytic lineages. In addition, although there were prominent changes in BMI1 enrichment after drug treatment, the change in H2Aub occupancy was subtle (Figures 4 and 5). Although BMI1 is a key player for the canonical PRC1 that deposits H2AK119 ubiquitylation, other paralogs of PRC1 have similar functions, especially Ring 1A/B, which shows enzymatic activity toward H2A monoubiquitylation (Vidal and Starowicz, 2017; Wang et al., 2004). In addition, the existence of non-canonical PRC1 components like BCOR and L3MBTL2 catalyze H2A monoubiquitylation (Gearhart et al., 2006; Trojer et al., 2007). Therefore, functional redundancy and compensation by other paralog genes of PRC1 may account for the less prominent changes observed in H2Aub occupancy after BMI1 inhibition.
Inhibition of BMI1 Facilitates Cellular Senescence in DIPG
Our RNA-seq transcriptomic analysis revealed enrichment in senescence pathway genes with both genetic and chemical inhibition of BMI1 (Figures 4F, S4A, and S5F). These changes were accompanied by a phenotypic increase in senescence in both RNAi-mediated depletion and chemical inhibition of BMI1 (Figures 6 A, 6B, and S7A). Two well-known mechanisms of BMI1 to control cell proliferation and inhibit senescence are repression of p16 (Meng et al., 2010; Wang et al., 2012) and repression of p21 (Subkhankulova et al., 2010). Both genetic and pharmacological inhibition of BMI1 upregulated p16 and p21 (Figures 6C, 6D, S7Bi, S7Bii, S7C, and S7D). Interestingly, in one of our model cell lines, HSJD-GBM01+H3K27M, in which there was an increase in BMI1 levels as a result of H3K27M expression, a complete loss of p16 protein expression was observed (Figure S7Biii). These results highlight the co-dependence of the oncohistone H3K27M on BMI1 to suppress p16 and p21 and to promote tumorigenesis.
Figure 6.

Senescence and Senescence-Associated Gene Expressions and Secretory Phenotype (SASP) with BMI1 Inhibition and Impact of BH3 Mimetics on BMI1-Inhibition-Induced Cellular Senescence and Apoptosis
(A and B) Representative pictures of SA-β-gal (senescence associated beta galactosidase) staining with genetic inhibition of BMI1 (A) and with BMI1 inhibitors (B) in SF8628. Adjacent graphs show the quantification of the number of cells with blue staining normalized to the total number of cells. By ANOVA, the p value within the three groups was p < 0.0001 (A) and p = 0.0037 (B).
(C) Western blot analysis of p16 and p21 in SU-DIPG04 cells transduced with shBMI1.
(D) Western blot analysis of p16 and p21 in SF8628 cells treated with PTC028.
(E–G) Concentration of SASP factors released by DIPG cells after treatment with either PTC209 (E) or PTC028 (F) and after genetic knockdown of BMI1 (G).
(H) Changes in BMI1 and H2Aub genome tracks at the specific gene locations indicated in SU-DIPG04 cells after PTC028 treatment. The x axis represents genome locations, and the y axis represents the RPM for the indicated genes. For RNA-seq tracks, the increase in gene expression with PTC028 treatment is visualized by greater transcript tag density over the exons of the indicated genes (exons are the horizontal bars, and the direction of transcription is indicated by arrows shown below ChIP-seq tracks).
(I) Representative pictures of neurospheres and sub-spheres (red arrows) formed in short- and long-term exposure of DIPG cells to PTC028, with quantification of size and number of neurospheres formed shown adjacently.
(J) SASP factors measured in SU-DIPG04 with long-term exposure to PTC209.
(K) Western blot showing changes in anti-apoptotic proteins after short- and long-term exposure of cells to PTC drugs.
(L) Dose-response curve on cell viability (MTS (viability asassay endpoint) of SF8628 cells treated with PTC028 and ABT263 either alone or in combination. MTS assay is a viability assay based on cell metabolic activity.
(M) Real-time measurement of proliferation of HSJD-DIPG-007 shBMI1 or shNull cells with ABT263 (250 nM).
(N) Representative pictures of SA-β-gal staining of BT245 cells, with different treatment conditions shown.
(O) Flow cytometry analysis of annexin V-PI/7AAD as a measure of apoptosis in HSJD-DIPG-007 cells treated with PTC028 and obatoclax. By ANOVA, ∗∗∗∗p < 0.0001. Pairwise comparisons; ∗p < 0.05, ∗∗p < 0.012, ∗∗∗∗p < 0.001; control versus treatment by Student’s t test. Data represent mean ± SEM.
See also Figures S7 and S8.
p16 is one of the direct targets of BMI1, and some brain tumors harbor deletion of p16, although it has been shown to be rarely deleted at the genomic level in human DIPGs (Paugh et al., 2011; Wu et al., 2012; Zarghooni et al., 2010). We tested whether inhibition of p16 rescues DIPG cells from BMI1 inhibitors. Small interfering RNA (siRNA)-mediated silencing of p16 in SF8628 (with moderate p16 expression) decreased the stability of p16 mRNA and partially rescued cells from PTC028-treatment-induced cell death (Figure S7E). This partial rescue of cells in the absence of p16 could result from the compensatory mechanism of other BMI1 targets, including p19 and p21 tumor suppressors, that are strongly induced after PTC028 treatment; otherwise, the tumor cell growth could be controlled by other CDKN2A-independent pathways (Douglas et al., 2008). It is also possible that although PTC028 specificity to BMI1 inhibition has been well established (Bakhshinyan et al., 2019; Siddique et al., 2013), these small-molecule inhibitors can have other downstream effects beyond BMI1 inhibition (Li et al., 2014).
Senescent cells secrete chemokines, inflammatory cytokines, and growth factors commonly known as SASP (Watanabe et al., 2017). We also found that BMI1 inhibition showed a moderate increase in the release of several SASP factors (interleukin [IL]-6, IL-8, VEGF [Vascular Endothelial Growth Factor], and CXCLs [Chemokine C-X-C motif Ligands]) in both PTC028-treated cells and BMI1 knockdown cells (Figures 6E–6G). Secretion of the prominent cytokine IL-6 was increased in cells treated with increasing concentrations of PTC028, and these cells showed a concomitant increase in the senescence cell marker GLB1 (Figure S7F). To investigate whether the induction of senescence and the secretion of SASP factors are direct effects of BMI1, we analyzed BMI1 occupancy, along with its co-functional partner H2Aub, at SASP factor-related gene promoters in DIPG cells.
We identified direct binding of BMI1 and H2Aub at promoters of genes that are involved in activating senescence in cells (p19 and p21) at the CTGF (Connective Tissue Growth Factor) and at the IL-6 promoters (SASP factors). PTC028 treatment significantly reduced the promoter binding of BMI1 and H2Aub in these gene loci, with a concomitant increase in their mRNA expression (Figures 6H and S7G). The corresponding mRNA expression of these genes in DIPG patient samples is shown below the genome tracks (Figure S7H). These data strongly suggest that BMI1 directly binds to and suppresses the expression of these genes in DIPG cells and that inhibiting BMI1 in these cells thus promotes SASP factors.
Clearance of Senescent Cells with BH3 Mimetics Enhanced the Anti-tumor Efficacy of BMI1 Inhibition In Vitro
Although induction of senescence inhibits tumor cell growth, long-term maintenance of senescent cells can promote a pro-tumorigenic environment, implicating them in making tumor cells resistant to targeted therapy (Coppé et al., 2008; Freund et al., 2010; Muñoz-Espín and Serrano, 2014). Studies have shown that therapy-induced senescence can act as a key mechanism of tumor recurrence (Saleh et al., 2019; Schosserer et al., 2017). We tested whether accumulation of these BMI1-inhibition-induced senescent cells had adverse effects on DIPG growth. Neurosphere formation assay showed that prolonged treatment of DIPG cells with PTC209 resulted in an increased cell self-renewal frequency, as evident from the formation of larger spheres (Figure 6I), and an increasing number of sub-spheres (Figure 6I, red arrows) compared with cultures that underwent short-term treatment. Concomitantly, there was a significant increase in SASP factors in these cells (Figure 6J). A prolonged culture with genetic inhibition of BMI1 also showed increased cell proliferation rate (Figure S8A). These results suggest that the cells have gained tumorigenic potential in long-term drug exposure.
To identify pharmacological compounds that will have a synergistic effect with BMI1 inhibition, thereby preventing a therapy-induced adverse effect, we performed meta-analysis using the differentially enriched gene sets in PTC028 relative to DMSO-treated cells from RNA-seq data. One of the top predicted agents was obatoclax, a BH3 mimetic (Figure S8B). BH3 mimetics are compounds that bind to the anti-apoptotic BCL2 family of proteins and induce apoptosis in cells (Cragg et al., 2009). BH3 proteins mediate the survival of senescent cells (Delbridge and Strasser, 2015; Moncsek et al., 2018). We established that BH3 proteins were re-expressed with prolonged PTC209 drug exposure, leading to decreased apoptosis (Figure 6K).
To test whether anti-BH3 agents would affect DIPG cells, we first sequentially treated SU-DIPG04 cells with PTC028 for 5 days, followed by treatment with ABT263, a well-characterized BH3 mimetic (Faber et al., 2015). Combination treatment with ABT263 induced greater cell killing (Figure 6L), with a corresponding decrease in BH3 protein levels (Figure S8C). A similar decrease in cell growth was observed in the shRNA-mediated BMI1 knockdown cells treated with ABT263 (Figure 6M). Importantly, the combination of PTC028 with ABT263 was highly synergistic (Figure S8D). Treatment with obatoclax or ABT263 significantly cleared the BMI1-inhibition-induced senescent cells and increased cell killing (Figures 6N and S8E). There was an associated decrease in BH3 proteins and the senescent protein GLB1 in cells after this combination treatment (Figures S8C and S8F). DIPG cells treated with the sequential combination of PTC028 and obatoclax significantly increased the cell apoptotic index, suggesting that clearance of senescent cells enhances cell killing (Figure 6O). These results suggest that targeting senescent cells enhances the anti-tumor effect of PTC drugs.
Increased Anti-tumor Effect of PTC028 in Combination with BH3 Mimetics during In Vivo DIPG Treatment
We next tested the impact of BH3 mimetics in combination with BMI1 inhibition in vivo. Obatoclax was chosen for the in vivo studies based on its ability to cross the blood-brain barrier (BBB), resulting in optimal tumor inhibition in pediatric brain tumor models (Bakhshinyan et al., 2019; Cruickshanks et al., 2012). Pons tumor-bearing mice were treated with PTC028 (oral gavage, 12.5 mg/kg), obatoclax (intraperitoneal, 3 mg/kg), or a combination of PTC028 and obatoclax, as detailed in Figure 7 A. MRI of the axial plane (Figure 7B) and the sagittal plane (Figure S9A) shows the anatomic location of the tumor in the pons and the changes in the tumor volume with treatment. Two weeks after initiation of treatment, vehicle-treated mice showed a larger tumor volume (median = 10.8 mm3) compared with animals that received either PTC028 alone (median = 1.3 mm3) or obatoclax alone (median = 0.9 mm3) (Figure 7C). MRI of animals receiving both drugs showed minimal tumor growth (median = 0.2 mm3) (Figure 7C). MRI taken one week after treatments were stopped demonstrated an increase in the tumor size in animals treated with PTC028 alone or obatoclax alone. In contrast, animals receiving combination therapy continued to show minimal tumor even after the treatment was stopped (Figures 7B, 7C, S9A, and S9B). Bioluminescence imaging (IVIS) was performed once a week to track tumor growth (Figure 7D). A decrease in tumor volume, as evident from the luminescence flux intensity, was seen during the individual drug treatments. A more significant decrease was observed with the combination treatments (Figures 7D and S9B). The Kaplan-Meier survival estimate showed that all drug treatment groups increased their survival rate compared with the vehicle-treated group. The median survival in the control group was 22 days. Survival time with PTC028 alone was a median of 33 days (∗∗p = 0.0074), whereas with median survival time with obatoclax treatment was 35 days (∗∗p = 0.0020). The combination treatment group demonstrated a significant prolongation of survival compared with both the control group and the single-agent treatment groups, with a median survival of 46 days (∗∗∗p = 0.0002) (Figure 7E). There was a significant loss in animal body weight in the vehicle-treated group, and the animals died from rapid tumor growth. However, in the treatment groups that received PTC028 alone or obatoclax alone, there was no significant decrease in animal weight during the treatments, and weight loss was seen only 2 weeks after the treatments were stopped (Figure S9C). An increase in body weight was observed in animals receiving combination therapy, suggesting the combination treatments were effective in decreasing the tumor burden, thereby leading to prolonged animal survival (Figure 7E). Although tumor regrowth was evident during the drug-free period, a delay in regrowth of tumors with the combination treatment was observed (Figure 7D).
Figure 7.

In Vivo Effects of PTC028 and Obatoclax Either Alone or in Sequential Combination in DIPG Xenografts, and Overall Results from This Study
(A) Schematics illustrating the experimental in vivo drug treatment schedule. After tumor establishment in mouse pons, the animals were randomized into four treatment groups: (i) vehicle alone, (ii) PTC028 alone, (iii) obatoclax alone, and (iv) sequential treatment with PTC028 and obatoclax.
(B) Representative axial MRI of intracranial pons tumor in mice at the 2nd week of the indicated treatment and at the 4th week (a week after treatment was stopped). X denotes those animals that reached the endpoint.
(C) Quantification of tumor volume from the MRI. Data represent mean ± SEM.
(D) Representative in vivo bioluminescence images of the Luc-expressing BT245 tumor cells before, after, and during the treatments specified. The scale bar adjacent to the image displays bioluminescence counts (photons per second).
(E) Kaplan-Meier survival plot of the animals exposed to the different drug treatments specified.
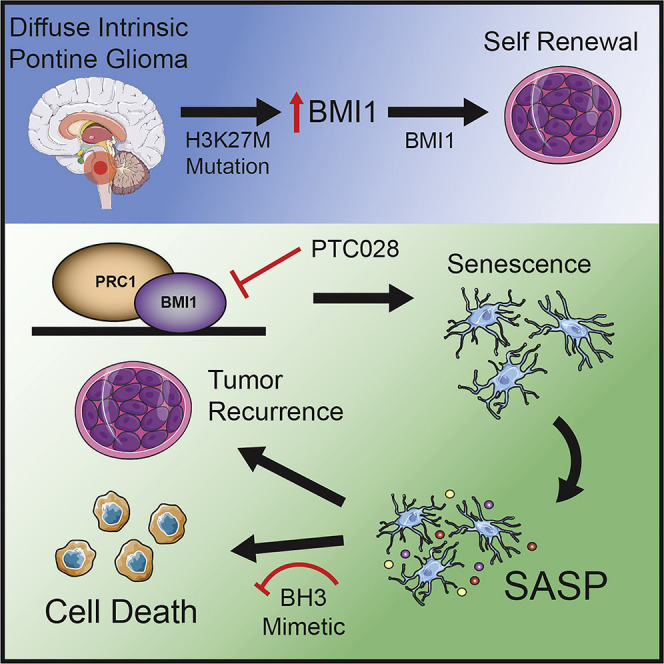
(F) Graphical representation highlighting the overall outcome of this study.
See also Figure S9.
Complete blood cell (CBC) analysis from mice collected immediately after the animal’s sacrifice showed no significant toxicity associated with either obatoclax alone or in combination with PTC028 (Figure S9D). Although an increase in some CBC parameters was seen with the PTC028 treatment, no noticeable toxicity was observed. IHC of these mice tumors after the endpoint showed a decrease in the number of proliferating cells (Ki67) and BMI1. There was a greater increase in p16, p21, and GLB1 in the tumor tissue of mice treated with PTC028 compared with vehicle treatment. This increase in senescent-related proteins was abrogated in the combination treatment with obatoclax (Figure S9E). Tumors treated with obatoclax or with the combination of drugs had increased levels of cleaved caspase. IHC of the normal tissue adjacent to the murine pons tumor showed no toxicity, as measured by cleaved caspase-3, in response to different treatments (Figure S9E).
Discussion
DIPG is a uniformly fatal brain tumor of childhood characterized by the oncohistone H3K27M mutation that induces chromatin dysregulation and tumorigenesis in H3K27M-DIPGs (Chan et al., 2013). Single-cell analysis of primary DIPG tumors demonstrated that most H3K27M-mutant-expressing glioma cells are arrested in an aggressively proliferating, undifferentiated state (Filbin et al., 2018). Using genetically driven models, Larson and colleagues showed that the H3K27M mutation drives changes in bivalent promoters and affects expression of genes associated with neural development (Larson and Baker, 2019; Larson et al., 2019). Therefore, identification of genes responsible for blocking differentiation that can be best exploited therapeutically is an urgent need for DIPG.
We found BMI1 to be a major epigenetic vulnerability in H3K27M-DIPG cells. It was identified as a distinctive common target between the two complimentary screens performed. Several research laboratories have demonstrated in in vitro that chemical inhibition of BMI1 decreases tumor cell self-renewal, proliferation, and metastatic potential in tumors, including pediatric brain tumors (Bakhshinyan et al., 2019; Kumar et al., 2017). We found similar effects with both genetic and chemical inhibition of BMI1 in DIPG. In addition, because small-molecule inhibitors of BMI1 have been shown to inhibit BMI1 function through indirect pathways, our study highlights the importance of using genetic inhibition of BMI1 models to decipher key phenotypic changes. More importantly, we demonstrate for the first time that chemical inhibition of BMI1 with the PTC series of compounds attenuates DIPG tumor growth in vivo. These data will be critical in helping to evaluate the results of the ongoing phase 1 clinical trial.
Using model cell lines, we demonstrate that expression of the H3K27M transgene in histone WT cells increased BMI1 expression and that this increase was associated with increased H3K27ac active histone marks at the BMI1 promoter. A reciprocal change in the H3K27ac activation mark and the H3K27me3 repressive mark at the BMI1 promoter was seen when the H3 WT transgene was transduced in H3K27M-DIPG cells and in CRISPR-CAS9-mediated H3K27M-KO cells. These data, along with others, strongly suggest that the H3K27M mutation changes the chromatin landscape to lock in the gene transcription that is required for tumor progression and that BMI1 is one such oncogene in histone-mutant DIPGs. A recent study demonstrated that most gene signaling pathways regulated by the two mutant variants (H3.1K27M and H3.3K27M) are common (Nagaraja et al., 2019). Our data, with respect to BMI1 and its co-functional partner H2Aub, revealed no variation in their chromatin occupancy and gene transcription between H3.1 and H3.3 tumor subtypes, suggesting that the increase in BMI1 is a product of histone lysine 27 mutation and that its induction promotes a stem-like state in cells with either histone mutation. Although BMI1 is expressed in DIPG tumor cells irrespective of histone mutation status, the presence of either of the histone mutations increased the basal levels of BMI1, making the cells more sensitive to BMI1 inhibition compared with WT histone-expressing cells.
A study using murine models of DIPG demonstrated that the H3K27M mutation accelerates tumorigenesis by suppressing the tumor-suppressor protein p16, and as expected, most DIPG tumors harboring the H3K27M have low levels of p16 expression (Cordero et al., 2017). Our data suggest that the low levels of p16 in DIPGs could result from the increased BMI1 activity orchestrated by the oncohistone H3K27M, which together at least partly contribute to tumorigenesis.
Our study, along with others, suggests that the suppression of BMI1 results in increased p16 and p21 expression that induces senescence in cells, thereby repressing cell growth (Bhattacharya et al., 2015; Dimri et al., 2002). Although induction of senescence is important in arresting tumor cell growth, it has been shown that chronic overexpression of p16 and p21 induced senescence and that accumulation of these senescent cells can promote cell replication and tumorigenesis (Kim et al., 2017). Senescent cells are not quiescent but rather metabolically active cells that secrete multiple pro-inflammatory cytokines and chemokines, which can promote malignant phenotypes (Coppé et al., 2008; Freund et al., 2010; Muñoz-Espín and Serrano, 2014). We found that BMI1 inhibition decreased self-renewing ability and induced senescence but that these senescent cells eventually reactivated to promote tumor growth. Several senolytic BH3 mimetic agents have been used to clear senescent cells as a therapeutic strategy for multiple disease models, including cancer, as well as for aging (Chang et al., 2016; Kim et al., 2017; Lujambio, 2016). Here we used obatoclax in combination with PTC028 to show the combinatorial increased anti-tumor effect in vivo. There was a significant decrease in tumor volume with combination therapy with PTC028 and no detectable toxicity. Although in this study we performed preclinical validation using one of the BMI1 inhibitor analogs PTC028, different analogs can exert their pharmacological activity through different pathways. Nevertheless, this study provides the proof of principle that monotherapy with BMI1 inhibitors will be beneficial only temporarily; when administered in combination with BH3 mimetics, the approach could provide a long-term survival advantage in DIPG patients. This is because DIPG cells exposed to PTC028, although effective in cell growth inhibition, become resistant to this treatment over time due to their own pro-inflammatory, anti-apoptotic microenvironment. Hence, the combination of PTC028 with the senolytic drug obatoclax, which removes this pro-inflammatory, anti-apoptotic microenvironment, is a promising therapeutic strategy for DIPG.
Based on our data and that of others, we propose the model shown in Figure 7F. The onset of oncogenic H3K27M in DIPG precursor stem cells changes BMI1 expression that is induced to maintain the cells in a primitive undifferentiated state. BMI1 inhibition leads to tumor growth arrest by downregulating cell proliferation and inducing senescence in DIPG cells. This repression in tumor cell growth, although encouraging, is a temporary effect because of reactivation of senescent cells. Clearance of senescence with BH3 mimetics attenuates tumor growth and prolongs survival. In summary, the H3K27M mutation co-opts with BMI1 to promote tumorigenesis and DIPG tumor cell killing is enhanced by combining epigenetic inhibition of BMI1 with senolytic compounds. Future clinical trials should include strategies combining these agents to target DIPG efficiently.
Limitations of Study
This article highlighting the impact of H3K27M mutation on the BMI1 oncogene and the effect of the inhibition of BMI1 on DIPG cell growth was submitted to Cell Reports for considerations in December 2019. The reviewers’ comments were received in March 2020, during the coronavirus disease 2019 (COVID-19) outbreak. With the major nationwide lockdown, we were not able to fully address some reviewer suggestions. We have addressed most points raised by reviewers. However, we have identified the following limitations to our study. First, although we have shown in one DIPG mouse model that the anti-tumor effect of the combination of PTC028 with obatoclax results in increased animal survival, a reviewer asked us to repeat the study using additional DIPG mouse models. Second, we performed ChIP-seq analysis to show changes in BMI1 and H2Aub occupancy in the H3K27M-DIPG cells from PTC028 treatment. One of the reviewers suggested performing a similar experiment using H3 WT-DIPGs. These studies are valuable and will be pursued soon.
STAR★Methods
Key Resources Table
| REAGENT or RESOURCE | SOURCE | IDENTIFIER |
|---|---|---|
| Antibodies | ||
| BMI1 | Cell Signaling | Cat#6964S RRID:AB_10828713 |
| p21 | Cell Signaling | Cat#2947S RRID:AB_823586 |
| p16ARC | Abcam | Cat#51243 RRID:AB_2059963 |
| p53 | Abcam | Cat#179477 RRID:AB_2737134 |
| Caspase 3 | Cell Signaling | Cat#9662S RRID:AB_331439 |
| PARP | Cell Signaling | Cat#9542S RRID:AB_2160739 |
| BCL2 | Cell Signaling | Cat#2872S RRID:AB_10693462 |
| MCL1 | Cell Signaling | Cat#5453S |
| BCL-XL | Cell Signaling | Cat#2764S RRID:AB_2228008 |
| β-Galactosidase (GLB1) | Proteintech | Cat#15518-1-AP RRID:AB_2263448 |
| IL6 | Cell Signaling | Cat#12153 RRID:AB_2687897 |
| α-Tubulin | Cell Signaling | Cat#3873S RRID:AB_1904178 |
| β-Actin HRP | Cell Signaling | Cat#12262S RRID:AB_2566811 |
| H3.3K27M | Millipore | ABE419(Discontinued) |
| H3.3K27M | RevMab BioSciences | Cat#31-1175-00 RRID:AB_2716432 |
| H3K27me3 | Cell Signaling | Cat#9733S RRID:AB_2616029 |
| H2AubK119 | Cell Signaling | Cat#8240S RRID:AB_10891618 |
| H3 | Abcam | Cat#1791 RRID:AB_302613 |
| BMI1 | Novus | Cat#NBP2-22204 |
| Ki67 | Cell Signaling | Cat#9449 RRID:AB_2797703 |
| Cleaved Caspase-3 | Cell Signaling | Cat#9661 RRID:AB_2341188 |
| p21 | Novus | Cat#NBP2-48351 |
| BMI1 | Cell Signaling | Cat#5856 RRID:AB_10838137 |
| ubiquityl-histone H2A | EMD Millipore | Cat#05-678 RRID:AB_309899 |
| H3K27ac | Abcam | Cat#ab4729 RRID:AB_2118291 |
| Biological Samples | ||
| UPN1285 | University of Colorado / Morgan Adams Foundation tumor bank | N/A |
| Chemicals, Peptides, and Recombinant Proteins | ||
| Triton X-100 | Sigma Aldrich | Cat#93443 |
| Tween20 | Fisher Scientific | Cat#BP337-500 |
| Restore Plus Stripping Buffer | Thermo Scientific | Cat#46430 |
| Luminata ECL Plus Substrate | Millipore | Cat#WBLUF0500 |
| Dimethyl Sulphoxide | Sigma Aldrich | Cat#D2650 |
| Kolliphor | Sigma Aldrich | Cat#S5135 |
| Sodium Vanadate | Fisher Scientific | Cat#S454-50 |
| Sodium Molybdate | Sigma Aldrich | Cat#243655 |
| RIPA Buffer | Thermo Scientific | Cat#87787 |
| Polybrene | Sigma | Cat#TR-1003-G |
| PTC209 | Sigma | Cat#1143 |
| PTC028 | Biorbyt | Cat#Orb181369 |
| ABT263 | APExBIO | Cat#A3007 |
| Obatoclax Mesylate | Selleck Chem | Cat#GX15-070 |
| Protease Inhibitor Cocktail tablets | Roche | Cat#11836153001 |
| Heparin | Stem Cell Technologies | Cat#07980 |
| EGF | Shenandoah Technologies | Cat#100-26 |
| FGF | Shenandoah Technologies | Cat#100-146 |
| PGDF-AA | Shenandoah Technologies | Cat#100-16 |
| PGDF-BB | Shenandoah Technologies | Cat#100-18 |
| Critical Commercial Assays | ||
| RNeasy Plus mini Kit | QIAGEN | Cat #74136 |
| DNeasy Blood and Tissue Kit | QIAGEN | Cat #69504 |
| High Capacity cDNA Reverse Transcription Kit | Thermo Fisher | Cat #4368814 |
| Senescence β-Galactosidase Staining Kit | Cell Signaling | Cat#9860 |
| Milliplex Map human cytokine/chemokine magnetic bead panel kit | Millipore | Cat#HCYTOMAG-60K-PX41 |
| Signal Silence p16(INK4A) siRNA | Cell Signaling | Cat#6598 |
| Lipofectamine RNAiMAX Transfection Reagent | Thermo Fisher | Cat#13778100 |
| Deposited Data | ||
| ChIP Sequencing data | https://www.ncbi.nlm.nih.gov/geo/query/acc.cgi?acc=GSE140768 | GEO: GSE140768 |
| RNA-Seq data | https://www.ncbi.nlm.nih.gov/geo/query/acc.cgi?acc=GSE140768 | GEO: GSE140768 |
| Experimental Models: Cell Lines | ||
| Human: Patient-derived cell cultures | Refer Table S2 | |
| Experimental Models: Organisms/Strains | ||
| 6-week old Athymic Female Nude Mice (Nude-Foxn1) | Jackson Laboratory | 007850JNU |
| Oligonucleotides | ||
| BMI1 | Thermo Fisher Scientific | 1726196 |
| OLIG2 | Thermo Fisher Scientific | 1714797 |
| p21 | Thermo Fisher Scientific | 171842 |
| p16 | Thermo Fisher Scientific | 4331182 |
| NESTIN | Thermo Fisher Scientific | 1590813 |
| MAP2 | Thermo Fisher Scientific | 1475471 |
| SOX2 | Thermo Fisher Scientific | 1753592 |
| GFAP | Thermo Fisher Scientific | 1415273 |
| GAPDH | Thermo Fisher Scientific | 1712565 |
| Software and Algorithms | ||
| ELDA program for Limiting dilution assay | http://bioinf.wehi.edu.au/software/elda/ | N/A |
| Metascape program | http://metascape.org | N/A |
| Cytoscape Tool | Shannon et al., 2003 | N/A |
| RNA-Sequencing Analysis - Trimmed and clipped for quality control | Trimmomatic (v0.36) | N/A |
| RNA-Sequencing Analysis - Read quality was checked | FastQC v0.10.1 | N/A |
| RNA-Sequencing Analysis – High Quality Reads imported | STAR (v2.4.0.1) for alignment into BAM files. | N/A |
| RNA-Sequencing Analysis - Count the reads from BAM files. | Genomic Alignments package (v1.16.0) | N/A |
| RNA-Sequencing Analysis - Differential expression genes on the raw counts | DESeq (v1.32.0) | N/A |
| ChIP-Sequencing – Bowtie 2; Version 2.3.2 | http://bowtie-bio.sourceforge.net/bowtie2/index.shtml | N/A |
| ChIP-Sequencing - Samtools; Version 1.9 | http://samtools.sourceforge.net/ | N/A |
| ChIP-Sequencing - MACS2; Version v2.1.1.20160309 | https://github.com/macs3-project/MACS/wiki/Install-macs2 | N/A |
| ChIP-Sequencing - ChIPseeker; Version 1.20.0 | https://www.bioconductor.org/packages/release/bioc/html/ChIPseeker.html | N/A |
| R2 Genomics analysis and Visualization platform | https://hgserver1.amc.nl/cgi-bin/r2/main.cgi | N/A |
| Illustrator 23.0.3 | Adobe | N/A |
| GraphPad Prism 8.1.1 | GraphPad | N/A |
| Servier Medical Art; Creative Commons 3.0 | https://smart.servier.com/ | N/A |
Resource Availability
Lead Contact
Further information and requests for resources and reagents should be directed to and will be fulfilled by the lead contact, Sujatha Venkataraman (sujatha.venkataraman@cuanschutz.edu).
Materials Availability
This study did not generate any new reagents.
Data and Code Availability
No unpublished custom code, software or algorithm was used in this study. The accession number for the RNA-Seq and ChIP-Seq data reported in this paper is GEO: GSE140768. https://www.ncbi.nlm.nih.gov/geo/query/acc.cgi?acc=GSE140768.
Experimental Model and Subject Details
Clinical specimens
Clinical samples used in this study include both biopsy and autopsy tissues. A smaller cohort of DIPG patient tumor tissues and normal pons used in this study were collected at Children’s hospital of Colorado (CHCO) under the approved IRB protocol (IRB-9500). Biopsy samples of pons tumor tissue were collected from patients during surgery with the approved protocol and consent. Tissue specimens were prepared for microarray gene expression analysis, RNA sequencing, protein analysis, sectioning and staining for different proteins, while part of the tissue specimens was stored by flash freezing. Autopsy samples were collected with proper consent and prepared similar to biopsy samples. Pathological slides used in this study were obtained from different patients diagnosed with DIPG that were collected at CHCO, and other centers including VU Medical Center (VUMC), Netherlands. Please see Table S2 for DIPG patient age, sex and tumor mutation status.
Cell lines and cell cultures
The complete list of cell lines used in this study along with the source obtained given in the Key Resources Table and Table S2. All cultures were grown as either tumor neurospheres or as monolayer with the media with supplements as described in previous studies and given in Table S2 (Nagaraja et al., 2019). CRISPR/CAS9 mediated KO of H3K27M and parental BT245 and SU-DIPGXIII cell lines were obtained from Dr. Jabado, and these cells were cultured using plates coated with poly-L-ornithine (0.01%) (Sigma) and laminin (0.01 mg/mL) (Sigma). Later these cells were grown as neurospheres in ULA plates for further studies. Cell cultures were periodically validated using DNA fingerprinting and routinely checked for mycoplasma contamination.
Mouse Xenograft model and drug testing
Human DIPG tumor cells were implanted into the pons of 6-week-old female athymic nude mice. A suspension of ∼100,000 BT245-luc2-GFP (H3.3K27M mutant) cells in a total volume of 2 μl serum-free media was injected at a rate of 400 nL/min into the brain at a site 0.800 mm lateral to midline, 4.700 mm posterior to bregma, and 4.500 mm ventral to the surface of the skull. Tumor formation was monitored by bioluminescent imaging (BLI) once per week using the IVIS Xenogen 2500 imaging machine.
Monotherapy and sequential treatment of PTC028 with Obatoclax was considered as a therapeutic regime in this experiment. After tumor establishment in the pons, animals were randomized into 4 treatment groups as follows: 1) Control vehicle alone, n = 7; 2) PTC028 alone, n = 7 (12.5mg/Kg/day administered orally); 3) Obatoclax alone, n = 7 (3mg/Kg/day administered intraperitoneally); and 4) combination of PTC028 (12.5mg/Kg/day) and Obatoclax (3mg/Kg/day), n = 7. The schematic of the experimental drug treatment protocol followed in this study is shown in Figure 7A. Compound PTC028 dosing was decided based on the acute toxicity study we previously performed in mice. The vehicle used to deliver the PTC028 has the composition of 0.5% Hydroxypropyl Methylcellulose and 0.1% Tween 80 in distilled water, and Obatoclax was dissolved in 5% DMSO with 5% Kolliphor (Sigma) and diluted in sterile 1XPBS. The Obatoclax dosing that was shown to be non-toxic in a glioblastoma model was used (Karpel-Massler et al., 2015). Tumor growth and response to therapy were determined biweekly by bioluminescence imaging as previously described (Hashizume et al., 2014) and by magnetic resonance imaging (MRI) of the mouse brain. Bioluminescence counts (acquired on an IVIS200 optical scanner) for each animal at each time point were normalized against corresponding readings obtained at the beginning of the therapy. High-resolution T2-turboRARE MRI of both sagittal and axial planes was acquired on a Bruker 9.4 Tesla BioSpec MRI scanner using a mouse head array coil. The tumor volumes (mm3) were calculated by placing a region of interest (ROI) on each anatomical slice and multiplying their sum by the slice thickness (0.7 mm). The tumor volumes were calculated by the radiologist.
Body weight was measured twice a week and mice were monitored daily and euthanized at endpoints which included irreversible neurological deficit, body condition score less than 2, or weight loss of greater than 20%. Mouse survival was closely monitored till the end of the experiments.
The drug toxicity was measured at the end of the experiments; aliquots of blood was collected in EDTA coated tubes from the animals immediately after sacrifice to measure hematological parameters using a CBC (complete blood counts) instrument Heska, Element HT5 Veterinary Hematology Analyzer, USA.
Method Details
Lentiviral production and target cell transductions
Lentiviral particles for transductions were made from a pooled shRNA library (transOMIC technologies, #TRH6110), from individual shRNAs targeting BMI1, from pCDH-EF1-MCS-IRES-PURO-H3.3K27M, -H3.3 Wt, and -empty vector plasmids. For lentiviral production, HEK293FT cells were co-transfected with the packaging plasmids; psPAX, pMD2.G and shERWOOD-Ultramir-GFP-shRNAs library by using Lipofectamine 3000 reagent. Single target knock down, mutant or Wt histone lentiviruses were made with similar packaging of plasmids using HEK293FT cells. The target cells were transduced with the lentiviral vectors using 8 ng/ml of polybrene and the transduced cells were selected with up to 2 μg/mL puromycin (Sigma-Aldrich). Additionally, cells were sorted by flow cytometry for GFP-positivity to isolate the pure population of transduced cells with the shRNA transductions. The effects of all transductions were determined by western blotting for specific proteins.
Functional Genomic shRNA screening
The H3.1K27M-mutated SU-DIPG04 cell line was transduced with a pooled lentiviral shRNA library consisting of ∼4200 shRNAs targeting 408 epigenetic genes (Human LVX-ZsGreen lentiviral shRNA-mir Epigenetics-related genes, transOMIC, TRH6110). The pool contained around 4-10 shRNAs per gene (4200 total shRNAs). Lentiviral particles of the pooled shRNA library were made as described above. DIPG cells were seeded and 24 hours after seeding these cells were infected with the pooled shRNA lentiviral library with a MOI of 0.3 using polybrene (n = 4). Seventy two hours after transduction (day 0), one aliquot (control, before puromycin) of cells were collected for isolating genomic DNA and the rest of the transduced cells were reseeded. These cells were reseeded and 24 hours after seeding, cells were selected with puromycin (2μg/ml) treatment to select for the pure populations of cells expressing the transduced histones. These cells were maintained in culture medium for a further 21days (day 21) (passaging every 3 days). Cells were passaged to maintain an MOI of 0.3 at all times to ensure that each transduced cell had a single genomic integration from the shRNA expressing the same gene in the presence of puromycin. The cells were then collected at 21 days (∼7-8-doubling times of the cell) after transduction. Genomic DNA was isolated and processed to amplify individual shRNAs with two rounds of PCR and sequenced with an Illumina HiSeq 3000/ HiSeq 4000 instrument. The sequencing reads were aligned to the shRNA library using Bowtie and the ambiguous reads were excluded from the analysis. Only reads that matched exactly to the adaptor sequence and the shRNA library sequence were considered for analysis and the best alignment was noted. Reads were filtered that did not have at least 3 replicates. Resulting read counts per shRNA were analyzed using R-based package by comparing the shRNAs present on day 0 to day 21, with FDRs of 0.5 and 0.1. These experiments were performed multiple times (n = 4) to check for reproducibility. Genes were considered as a top hit when there was increased shRNA depletion at the end of 21 days compared to day 0 and this occurred in at least 3 of the 4 replicates. Figure S1A shows the schematics of this method, similar to a previously reported method (Sroczynska et al., 2014).
Epigenetic chemical drug screening
Drugs included in this panel targeting different chromatin modifiers are given in Figure S1C. This epigenetic screening was performed using two separate sets of chemical probes targeting chromatin modifiers; one from the SGC (#17748) and the second one from the Cayman Chemicals (#11076) for a total of 211 drugs targeting various regulators. Briefly, SU-DIPG04 cells (2000 cells/well) were seeded in the middle 60 wells of a 96-well plate and the surrounding wells were filled with sterile PBS thus preventing media evaporation. 24 hours after seeding, these cells were treated with 3 μM of each of the 211 chemical probes in the two screen panels using DMSO as a control. The media and drug was changed after 48 hours, and replenished with same concentration of the drugs, and the treatment was continued for 5 days. The cell viability was measured on day 5 using the CellTiter 96® AQueous One Solution Cell Proliferation Assay kit (MTS) (#3581, Promega, USA). The number of viable cells was determined by measuring the absorbance at 492nm with a plate reader spectrometer. The cell viability was reported after normalizing the absorbance values from cells treated with each of the chemical probes to that of DMSO treated (control) cells.
Making of syngeneic model cell lines
The H3.3 Wt cell lines; VUMC-DIPG10, HSJD-GBM01, and NHA (normal human astrocytes), were made to stably express the H3K27M mutant transgene by transducing these cells with the lentiviral H3K27M mutant transgene or empty vector. Similarly, the H3K27M mutant HSJD-DIPG-007 cells were stably transduced with the Wt H3.3 lentiviral plasmid. Briefly, the cells (∼100,000/well) were seeded onto a 6-well plate and the cells were transduced with the lentiviral plasmids using polybrene (polybrene final concentration of 8 ng/ml). These plasmids were kindly gifted by Dr. C. David Allis, Rockefeller University, NY (Lewis et al., 2013). Pure populations of transduced cells were selected using puromycin. The overexpression of these histone transgenes was confirmed by western blotting of histone proteins isolated by acid extraction. These model cell lines will be referred in this study as the following: HSJD-GBM01+H3K27M; VUMC-DIPG10+H3K27M, NHA+H3K27M and HSJD-DIPG-007+H3.3Wt.
Stable knock down of BMI1 gene
Stable knock down of genes was carried out using shRNAs targeting different genes. Briefly, the cells (∼100,000/well) were seeded onto a 6-well plate and the cells were transduced with the lentiviral shRNA using polybrene (polybrene final concentration of 8 ng/ml). Transduced cells were selected using puromycin (2μg/ml) and the cells were routinely maintained in the cell culture medium containing 1μg/ml of puromycin. shRNAs targeting BMI1 was obtained from transOMIC technologies and from the Functional Genomic Core Facility at the University of Colorado, Denver.
Cell transfection with siRNA directed to p16
The signal silence® siRNA inhibiting p16 was obtained from Cell Signaling Technologies (# 6598). A scrambled siRNA was used as a negative control (siNC). The H3K27M-SF8628 DIPG cells were seeded (∼100,000 cells) per well in 3-wells of a 6-well plate for each of the siRNAs. After 24 hours, the cells were transfected with siRNA with final concentrations of 30 and 60 pmol. The cells were transfected using Lipofectamine RNAiMAX reagent (Invitrogen, Life Technologies, Carlsbad, CA) according to manufactures protocol using serum-free opti-MEM. After 72 hours of transfections, the cells were split for growth assays with drug treatment studies and for isolating RNA to test for p16 mRNA expression by QRT-PCR.
Cell proliferation and cell growth assays
Transduced cells were seeded on day 1 and allowed to grow for 3-cell doubling time after which MTS reagent was added to each well and the absorbance was measured at 492nm wavelength using a plate reader to determine the changes in the cell proliferation. Cell growth was assessed using an XCELLigence real-time measurement machine. Cells (∼2000/well) were seeded on day 1 on a gold-plated 96-well E-plate and the impedance of cells was measured in real-time. Slopes were calculated as a measure of the rate of cell growth using the RTCA software program.
Similarly, the cell proliferation assay was performed as described above after individual drug treatments. The drugs used in this study were all dissolved in DMSO to make stock concentrations to use in in vitro experiments. Cells (∼2500 cells) were seeded on a 96 well plate. After 24 hours, cells were treated with varying concentration of the drugs, then after 5 days of drug treatment, the cell viability was measured by MTS assay. Using the GraphPad Prism, the IC50 for each drug treatment and for each cell line used was determined.
The cell viability assay was performed on one of the primary patient DIPG tumors, UPN-1285, that was collected from the surgery at our CHCO. The tumor cells (confirmed by H&E staining) were isolated from the tumor tissue as single cells and sorted by flow cytometry for live populations of cells. The live cells were counted, seeded and treated with the control DMSO or PTC028 (100nM) for 3 days. The viability of the cells after 3 days of treatment was measured by Trypan Blue dye exclusion assay.
Western blot analysis
Protein analysis was done with both the whole cell lysate and with isolated histone proteins from cells. Whole-cell protein lysates were harvested in RIPA lysis buffer (Thermo Fisher Scientific) supplemented with protease inhibitor (Roche), Sodium vanadate and Sodium molybdate.
Histone proteins, on the other hand, were isolated by acid extraction from cells. Briefly, the cells were lysed with 15-minute incubation in 100 μL of lysis buffer (1X PBS + 0.5% Triton X-100) on ice followed by vortexing four times intermittently for every 5 minutes. The cell lysate was centrifuged at 10,000 rpm at 4°C for 10 mins and the supernatant was discarded. The cell pellet was washed with 50 μL of lysis buffer, centrifuged at 10,000 rpm at 4°C for 10 mins and the supernatant was discarded. Finally, the cell pellet was incubated in 10-15 μL of 0.2N HCl overnight at 4°C followed by centrifuging for 10 mins at 4°C and the clear supernatant was collected and used for histone protein analysis.
The protein concentrations were determined by BCA assay for which the protein standards were made with RIPA buffer or with buffer containing 0.2N HCl to determine the concentrations of whole cell lysates and histone protein lysates respectively. ∼25-50 μg of whole cell lysate proteins or ∼1-3 μg of histone proteins were used for western blotting. The proteins were separated on 4%–20% PROTEAN TGX Gels (Biorad) and blotted using the wet transfer system (Biorad) as previously described (Alimova et al., 2012). The lists of primary antibodies used to detect different proteins are given in the Key Resources Table.
Cell Senescence assay
Cellular senescence was measured using a β-Galactosidase (β-gal) staining assay kit (Cell Signaling) following manufacturer’s instruction. Briefly, cells (∼10,000) at their lowest passage were seeded in a 6-well plate and allowed to proliferate. For the genetic knockdown cell, after 7-10 days, cells were fixed and stained with β-gal reagent at pH 6.0, overnight at 37°C. Development of a blue color indicative of senescing cells was visualized and quantified under a Nikon microscope. Similarly, to measure senescence in cells treated with different drugs, 24 hours seeding the cells, were treated with drugs, cultured and fixed and stained at different time points as follows:
Senescence using single agent: Cells were treated with their IC50 of the PTC drug for 7 days after which drug was removed and fresh media was replaced. After 2 days, the cells were fixed and stained for β-gal.
Senescence using combination treatment: Cells were treated with IC50 of the PTC drugs for 5 days followed by ABT263 (250nM) or Obatoclax (50nM) treatment for additional 3 days and cells were then fixed and stained for β-gal.
Immunohistochemistry (IHC)
Human DIPG tumor and normal tissues were fixed in formalin, paraffin embedded and sectioned. Hematoxylin-Eosin (H&E) staining for IHC was performed at the pathology core facility at UCD. Staining for proteins were done using monoclonal antibodies as listed in the Key Resources Table. IHC of pons tumor tissues from both experimental and control mice were also done as described above. The IHC staining was analyzed and the pictures were taken using an Olympus BX40 microscope with 40X objective lens. The protein staining was scored from 0 to 3 (maximum staining) based on the level of staining. The scoring included several microscopic fields and the fields with no staining are scored as zero; staining from 1 to 25% was scored as 1; from 25 to 75% was scored 2 and; the fields with greater than 75% staining was scored 3 and the scores was verified by a pathologist at the Children’s Hospital Colorado, Aurora). Each slide was scored on at least three different H&E positive staining sections for each sample and the average value is plotted.
In vitro extreme limiting dilution assay and neurosphere assay
The limiting dilution assay was performed as described previously (Sieburg et al., 2002; Tropepe et al., 1999; Hu and Smyth, 2009). Briefly, cells were seeded onto round bottom ultra-low attachment plates in proliferating medium containing no serum. A series of numbers ranging from 1 cell to 500 cells were seeded onto each of the 96-well plate. On day 12 after seeding, the number of wells containing spheres in each cell number seeding conditions was counted and analyzed using the ELDA program, (http://bioinf.wehi.edu.au/software/elda/). This program measures the self-renewing ability of a given cell at a given dilution.
For the neurosphere assay to estimate the cell self-renewal capacity, 50 to 100 cells were seeded as above and allowed to grow for 10 to 12 days. The neurosphere forming ability of cells was visualized, and the neurosphere size was measured using the Incucyte™ live cell imaging analysis system as previously described (Veo et al., 2019). These primary neurospheres were then dissociated, centrifuged at a low speed of 100 rpm for 5 minutes to remove all the dead cells. The live cells were then counted and reseeded in low-attachment plates with serum free proliferating media as above to determine the secondary neurosphere forming ability of the cells.
Drug Combination Index assay
The combination index study was carried out using small-molecule inhibitors, two BMI1 inhibitors (PTC209 and PTC028) and the BH3 mimetics, ABT263. The PTC028 concentrations ranged from 5nM to 50nM and PTC209 concentrations ranged from 0.25 μM to 5 μM. Each of these concentrations was combined with 100nM to 1000nM of ABT263. The cells were also treated with each of these drugs alone, as controls for this combination index measurement. Briefly, cells (∼2000) were seeded onto a 96 well plate and allowed to grow adherently. After 24 hours, the cells were treated with different concentrations of the drugs as indicated in each experiment. After 5 days, media was replaced with fresh medium containing MTS reagent and the viability of the remaining live cells was measured as absorbance at 492nm using a plate reader. The resulting combination index (CI) theorem of Chou-Talalay was used to calculate quantitatively whether the combination of drugs resulted in an additive (CI = 1), synergistic (CI < 1), or antagonistic (CI > 1) effect (Ashton, 2015; Chou, 2010).
Clonogenic Survival assay
BMI1 knock down cells along with the control cells were seeded (∼250-500 cells) onto a 6 well plate and allowed to form colonies for 14 days. For SF8628 cells alone, cells were seeded onto a 6-well plate that was previously coated with 0.1% gelatin and the cells were seeded as described above. After 14 days, colonies were fixed with 4% PFA (Paraformaldehyde) and stained with 0.25% Crystal violet in methanol and the colonies with greater than 40 cells were counted.
ChIP and ChIP-Sequencing
The ChIP procedure was essentially done as previously described (Szak et al., 2001) with appropriate modifications. DIPG cells were treated with respective IC50 of PTC028 or DMSO for 5 days. The growth medium was aspirated from cells at 70% confluence and replaced with a 1% formaldehyde in 1X DPBS for 10 mins at room temperature. The cross-linking was terminated by addition of glycine to a final concentration of 0.125M and incubated for 5 min. The cells were washed twice with cold PBS and scraped in RIPA buffer (50 mM Tris-HCl [pH 8.0], 150 mM NaCl, 5 mM EDTA, 1.0% NP-40, 0.5% deoxycholate, 0.1% SDS, 1 mM PMSF, and a protease inhibitor cocktail). The cell lysates were sonicated to yield chromatin fragments with DNA length ranging between 250 to 500 bp as assayed by agarose gel electrophoresis. After removing the debris, chromatin extracts were collected, and protein concentration was determined by BCA protein assay reagents (Pierce). For immunoprecipitation, chromatin extracts with 1 mg protein for each sample were pre-cleared with 40 μl of protein A/G agarose beads (pre-washed in RIPA buffer) at 4°C for 1 hour. The agarose beads were pelleted by centrifugation and the supernatants were recovered in a fresh tube. 2 μg of primary antibody and fresh protein A/G agarose beads were added to the pre-cleared chromatin extracts and incubated overnight at 4°C with slow rotation. The immunoprecipitates were washed successively with 1 mL of low salt buffer (20mM Tris-HCl [pH 8.0], 150mM NaCl, 0.1% SDS, 1% Triton X-100, 2mM EDTA), high salt buffer (20mM Tris-HCl [pH 8.0], 500mM NaCl, 0.1% SDS, 1% Triton X-100, 2mM EDTA), LiCl washing buffer (10mM Tris-HCl [pH 8.0], 250mM LiCl, 1.0% NP40, 1.0% deoxycholate, 1 mM EDTA) and twice with TE buffer. The DNA-protein complexes were eluted with 200 μl of IP elution buffer (1% SDS, 0.1 M NaHCO3). The eluents were pooled together, and the cross-links were reversed by adding NaCl (a final concentration 0.2M) into the eluents and incubating them at 65°C for 5 hours. DNAs was recovered by proteinase K and RNase A digestion, followed by phenol/chloroform extraction and ethanol precipitation. Pellets were resuspended in 100 μl of 10 mM Tris-HCl (pH 8.0) and submitted for sequencing.
Cell apoptosis measurement
Cell apoptosis was measured using flow cytometer (Guava Easycyte 8HT) with Annexin V-PE and 7AAD binding buffer. Briefly, cells were seeded on a 96 well plate and treated with drugs at different concentration. Treated cell suspensions (100μl) in PBS+1%FBS flow buffer at the indicated time points were mixed with 100 μl of Annexin-V containing 7-AAD reagent (Millipore) and incubated for 30 minutes. These cells were then analyzed using the flow cytometer. The Annexin-V and 7-AAD positive stained cells were considered apoptotic and both negatively stained cells were considered as live cells.
Senescence associated secretory phenotype (SASP) factors measurement
DIPG cells with and without different treatments were analyzed using a Milliplex Map human cytokine/chemokine magnetic bead panel kit according to the manufacturer’s instructions. This kit contains analytes for different cytokines and chemokines. The cell supernatant media was collected and was used for this assay. The final readouts using the Luminex’s xMAP MAGPIX® instrument and the analyte concentrations were quantified with the standard curves. These assays were performed in duplicates.
Quantification and Statistical Analysis
Statistical analysis
Results were subjected to statistical analysis using the GraphPad Prism software. Statistical significance (p < 0.05) was computed using one-way ANOVA for three or more conditions and two-tailed and parametric Student’s t tests for two conditions. Patient samples were compared with normal pons samples using non-parametric Mann-Whitney t test. Survival curves were analyzed using Kaplan-Meier method and statistical significance (p < 0.05) was computed using Gehan-Breslow-Wilcoxon tests, with groups compared by respective median survival or number of days taken to reach 50% morbidity. For the shRNA screen with 3 replicates, targets with both standard p < 0.05 and lenient p < 0.1, using Student’s t test was considered as targets.
Gene Expression: Microarray, RNA sequencing, QRT-PCR and Gene ontology analysis
Patient-tumor samples were processed, homogenized using a hand-homogenizer. RNA from the homogenized tumor tissues or from cell lines were extracted with an RNeasy Plus RNA kit (QIAGEN) and the purity of the RNA isolated was examined using an Agilent 2100 Bioanalyzer. Microarray analysis was performed using the Human Genome U133plus2 Array (Affymetrix) platform. The microarray data was generated and analyzed as previously described (Birks et al., 2011a, 2011b; Knipstein et al., 2012). RNA sequencing was done on the RNA isolated from patient tissue samples and cell lines. Two sets of RNA-sequencing were done using the cell lines; RNA isolated from cells after genetic knockdown of BMI1 and RNA isolated from the cells treated with BMI1 inhibitor PTC028 (respective cells IC50 concentrations) or vehicle (DMSO) for 5 days. mRNA libraries were made from the isolated pure RNA and RNA sequencing was performed using Nova-Seq. Both microarray analysis and RNA sequencing were performed in the Genomics and Microarray core facility at the University of Colorado, Denver. Gene expressions from public dataset was obtained using the R2 program, R2: Genomics Analysis and Visualization Platform (https://hgserver1.amc.nl/cgi-bin/r2/main.cgi).
Gene set enrichment analysis (GSEA) was done comparing samples using tools available from the Broad Institute Molecular Signatures Database, (http://www.broadinstitute.org/gsea/msigdb) (Subramanian et al., 2005). From the sequenced gene profiling data, differential expression of significant genes (> 2-fold) between paired samples were identified using DSEQ2 (Love et al., 2014).
The relationship between the differentially expressed genes with respect to their functional pathways was also identified by using a network map generated from the Metascape program (http://metascape.org) (Tripathi et al., 2015), and the network mapping was visualized using the online Cytoscape tool (Shannon et al., 2003). Briefly, the set of gene clusters from the RNA sequencing data was uploaded in the Metascape program which gives the enrichment network among the genes, which can be visualized using the Cytoscape visualization tool where the same-color circles represent gene terms from the same cluster.
To specifically identify compounds that synergizes with PTC028, we used enrichment analysis in the Metascape program and the network displays compounds that significantly reverses the gene functional pathways.
Volcano plots were made with the RNA sequencing data using the R program for visualizing the differential gene expressions. These are plots showing the gene counts on the X- axis and the -fold change between the paired samples of comparison (-log 10 of the p value) on the y axis. The genes that are dysregulated, either high or low expressing genes, are seen either to the right or to the left of the plot, and the significant genes are usually seen at the top of the plot.
For QRT-PCR, the isolated RNAs were reverse transcribed using Taqman reverse transcriptase (Applied biosystems). The purity of the RNA was checked using a nanodrop with an absorbance 260:280 greater than 1.8. The relative quantitation of the expression of the gene of interest was determined by ΔΔCT method using the Applied Biosystems STEPONEPLUS Real Time PCR system and the software. The list of gene probes used are given in the Key Resources Table.
ChIP-Seq data processing and analysis
ChIP-Seq libraries were sequenced on the Illumina HiSeq 2500 platform. Bowtie2 was used to align the 50bp single-end sequencing reads to a reference human genome (hg19) downloaded from the UCSC Genome Browser. Unmapped and mapped reads were removed, and PCR duplicate reads were removed using Sam tools version 1.5. Peaks were called using MACS2 (v2.1.1.20160309) (Zhang et al., 2008) with default parameters. Peak locations were further annotated according to the known genes in hg19 and 3000 bp of upstream and downstream of transcription start sites (TSS) considered as promoter regions using the R/Bioconductor package ChIP seeker (Yu et al., 2015). Additional ChIP-Seq data were processed and analyzed from the previously published dataset (Nagaraja et al., 2019; Piunti et al., 2017).
Data and Software Availability
RNA and ChIP Sequencing data have been deposited in the National Center for Biotechnology Information Gene Expression Omnibus (GEO) database and are publicly accessible through GEO: GSE140768.
Acknowledgments
This work was supported by the DOD (CA 160704), the Morgan Adams Foundation, ACS-IRG, the Laya Dance Academy, and the Luke Morin and Marc Jr. Foundations. Thanks to Drs. Mitra and Mulcahy-Levy, Mr. Harris, and Ms. Griesinger (UCD) for suggestions. Thanks to Dr. Masanori and Mr. Bodlak for their help in testing the H3K27M mutation status of cells using droplet PCR. Thanks to Drs. Sidharth and Perumal (University of Nebraska) for their timely help with IHC staining of slides. Thanks to Anitha Ponnuswami (Stanford University) for inputs on culturing DIPG cells. Thanks for research help provided by the Functional Genomics, Histology (especially to Ms. E. Smith, A. Quador, and J. Arnold), Genomics Microarray and Animal Imaging, and University of Colorado Cancer Center core facilities funded by NCI (P30CA046934).
Author Contributions
I.B., S.V., K.M., N. Davidson and A.P. performed in vitro and in vivo experiments. E.D. performed ChIP-seq. I.B., K.M., and R.L. performed the combination index study. D.W., B.S., D.K.B., and K.J. performed bioinformatic analysis. M.M., N.G., A.M.C., C.H., and R.H. provided cell lines. T.V. and A.D. performed the cytokine assay. S.F. made plasmids and viruses. A. Gillani evaluated pathology slides. J.S. and N.J.S. analyzed MRI data. I.S. and I.A. performed the apoptosis assay. E.H., D.S.M., and M.H.M. provided IHC of VUMC samples. N.F. and A. Green served as project advisors. S.V. and R.V. provided ideas, grants, and project leadership. Help with Metascape analysis was provided by N. Dahl CRISPR KO cells were provided by N.J. Figures were made by I.B. and K.M. The manuscript was written by S.V. Manuscript input was given by N. Dahl and E.H.
Declaration of Interests
The authors declare no competing interests.
Published: October 20, 2020
Footnotes
Supplemental Information can be found online at https://doi.org/10.1016/j.celrep.2020.108286.
Supplemental Information
Spreadsheet providing top hits from the epigenetic shRNA and drugs screens in DIPG cells.
References
- Alimova I., Venkataraman S., Harris P., Marquez V.E., Northcott P.A., Dubuc A., Taylor M.D., Foreman N.K., Vibhakar R. Targeting the enhancer of zeste homologue 2 in medulloblastoma. Int. J. Cancer. 2012;131:1800–1809. doi: 10.1002/ijc.27455. [DOI] [PMC free article] [PubMed] [Google Scholar]
- Anderson J.L., Muraleedharan R., Oatman N., Klotter A., Sengupta S., Waclaw R.R., Wu J., Drissi R., Miles L., Raabe E.H. The transcription factor Olig2 is important for the biology of diffuse intrinsic pontine gliomas. Neuro-oncol. 2017;19:1068–1078. doi: 10.1093/neuonc/now299. [DOI] [PMC free article] [PubMed] [Google Scholar]
- Ashton J.C. Drug combination studies and their synergy quantification using the Chou-Talalay method–letter. Cancer Res. 2015;75:2400. doi: 10.1158/0008-5472.CAN-14-3763. [DOI] [PubMed] [Google Scholar]
- Bakhshinyan D., Venugopal C., Adile A.A., Garg N., Manoranjan B., Hallett R., Wang X., Mahendram S., Vora P., Vijayakumar T. BMI1 is a therapeutic target in recurrent medulloblastoma. Oncogene. 2019;38:1702–1716. doi: 10.1038/s41388-018-0549-9. [DOI] [PubMed] [Google Scholar]
- Bartels U., Hawkins C., Vézina G., Kun L., Souweidane M., Bouffet E. Proceedings of the diffuse intrinsic pontine glioma (DIPG) Toronto Think Tank: advancing basic and translational research and cooperation in DIPG. J. Neurooncol. 2011;105:119–125. doi: 10.1007/s11060-011-0704-4. [DOI] [PubMed] [Google Scholar]
- Bhattacharya R., Mustafi S.B., Street M., Dey A., Dwivedi S.K. Bmi-1: At the crossroads of physiological and pathological biology. Genes Dis. 2015;2:225–239. doi: 10.1016/j.gendis.2015.04.001. [DOI] [PMC free article] [PubMed] [Google Scholar]
- Birks D.K., Barton V.N., Donson A.M., Handler M.H., Vibhakar R., Foreman N.K. Survey of MicroRNA expression in pediatric brain tumors. Pediatr. Blood Cancer. 2011;56:211–216. doi: 10.1002/pbc.22723. [DOI] [PubMed] [Google Scholar]
- Birks D.K., Donson A.M., Patel P.R., Dunham C., Muscat A., Algar E.M., Ashley D.M., Kleinschmidt-Demasters B.K., Vibhakar R., Handler M.H., Foreman N.K. High expression of BMP pathway genes distinguishes a subset of atypical teratoid/rhabdoid tumors associated with shorter survival. Neuro-Oncol. 2011;13:1296–1307. doi: 10.1093/neuonc/nor140. [DOI] [PMC free article] [PubMed] [Google Scholar]
- Cao R., Tsukada Y., Zhang Y. Role of Bmi-1 and Ring1A in H2A ubiquitylation and Hox gene silencing. Mol. Cell. 2005;20:845–854. doi: 10.1016/j.molcel.2005.12.002. [DOI] [PubMed] [Google Scholar]
- Chan K.M., Fang D., Gan H., Hashizume R., Yu C., Schroeder M., Gupta N., Mueller S., James C.D., Jenkins R. The histone H3.3K27M mutation in pediatric glioma reprograms H3K27 methylation and gene expression. Genes Dev. 2013;27:985–990. doi: 10.1101/gad.217778.113. [DOI] [PMC free article] [PubMed] [Google Scholar]
- Chang J., Wang Y., Shao L., Laberge R.M., Demaria M., Campisi J., Janakiraman K., Sharpless N.E., Ding S., Feng W. Clearance of senescent cells by ABT263 rejuvenates aged hematopoietic stem cells in mice. Nat. Med. 2016;22:78–83. doi: 10.1038/nm.4010. [DOI] [PMC free article] [PubMed] [Google Scholar]
- Chou T.C. Drug combination studies and their synergy quantification using the Chou-Talalay method. Cancer Res. 2010;70:440–446. doi: 10.1158/0008-5472.CAN-09-1947. [DOI] [PubMed] [Google Scholar]
- Coppé J.P., Patil C.K., Rodier F., Sun Y., Muñoz D.P., Goldstein J., Nelson P.S., Desprez P.Y., Campisi J. Senescence-associated secretory phenotypes reveal cell-nonautonomous functions of oncogenic RAS and the p53 tumor suppressor. PLoS Biol. 2008;6:2853–2868. doi: 10.1371/journal.pbio.0060301. [DOI] [PMC free article] [PubMed] [Google Scholar]
- Cordero F.J., Huang Z., Grenier C., He X., Hu G., McLendon R.E., Murphy S.K., Hashizume R., Becher O.J. Histone H3.3K27M Represses p16 to Accelerate Gliomagenesis in a Murine Model of DIPG. Mol. Cancer Res. 2017;15:1243–1254. doi: 10.1158/1541-7786.MCR-16-0389. [DOI] [PMC free article] [PubMed] [Google Scholar]
- Cragg M.S., Harris C., Strasser A., Scott C.L. Unleashing the power of inhibitors of oncogenic kinases through BH3 mimetics. Nat. Rev. Cancer. 2009;9:321–326. doi: 10.1038/nrc2615. [DOI] [PubMed] [Google Scholar]
- Cruickshanks N., Hamed H.A., Bareford M.D., Poklepovic A., Fisher P.B., Grant S., Dent P. Lapatinib and obatoclax kill tumor cells through blockade of ERBB1/3/4 and through inhibition of BCL-XL and MCL-1. Mol. Pharmacol. 2012;81:748–758. doi: 10.1124/mol.112.077586. [DOI] [PMC free article] [PubMed] [Google Scholar]
- Dahl N.A., Danis E., Balakrishnan I., Wang D., Pierce A., Walker F.M., Gilani A., Serkova N.J., Madhavan K., Fosmire S. Super Elongation Complex as a Targetable Dependency in Diffuse Midline Glioma. Cell Rep. 2020;31:107485. doi: 10.1016/j.celrep.2020.03.049. [DOI] [PubMed] [Google Scholar]
- Delbridge A.R., Strasser A. The BCL-2 protein family, BH3-mimetics and cancer therapy. Cell Death Differ. 2015;22:1071–1080. doi: 10.1038/cdd.2015.50. [DOI] [PMC free article] [PubMed] [Google Scholar]
- Dey A., Xiong X., Crim A., Dwivedi S.K.D., Mustafi S.B., Mukherjee P., Cao L., Sydorenko N., Baiazitov R., Moon Y.C. Evaluating the Mechanism and Therapeutic Potential of PTC-028, a Novel Inhibitor of BMI-1 Function in Ovarian Cancer. Mol. Cancer Ther. 2018;17:39–49. doi: 10.1158/1535-7163.MCT-17-0574. [DOI] [PMC free article] [PubMed] [Google Scholar]
- Dimri G.P., Martinez J.L., Jacobs J.J., Keblusek P., Itahana K., Van Lohuizen M., Campisi J., Wazer D.E., Band V. The Bmi-1 oncogene induces telomerase activity and immortalizes human mammary epithelial cells. Cancer Res. 2002;62:4736–4745. [PubMed] [Google Scholar]
- Douglas D., Hsu J.H., Hung L., Cooper A., Abdueva D., van Doorninck J., Peng G., Shimada H., Triche T.J., Lawlor E.R. BMI-1 promotes ewing sarcoma tumorigenicity independent of CDKN2A repression. Cancer Res. 2008;68:6507–6515. doi: 10.1158/0008-5472.CAN-07-6152. [DOI] [PMC free article] [PubMed] [Google Scholar]
- Faber A.C., Farago A.F., Costa C., Dastur A., Gomez-Caraballo M., Robbins R., Wagner B.L., Rideout W.M., 3rd, Jakubik C.T., Ham J. Assessment of ABT-263 activity across a cancer cell line collection leads to a potent combination therapy for small-cell lung cancer. Proc. Natl. Acad. Sci. USA. 2015;112:E1288–E1296. doi: 10.1073/pnas.1411848112. [DOI] [PMC free article] [PubMed] [Google Scholar]
- Filbin M.G., Tirosh I., Hovestadt V., Shaw M.L., Escalante L.E., Mathewson N.D., Neftel C., Frank N., Pelton K., Hebert C.M. Developmental and oncogenic programs in H3K27M gliomas dissected by single-cell RNA-seq. Science. 2018;360:331–335. doi: 10.1126/science.aao4750. [DOI] [PMC free article] [PubMed] [Google Scholar]
- Freund A., Orjalo A.V., Desprez P.Y., Campisi J. Inflammatory networks during cellular senescence: causes and consequences. Trends Mol. Med. 2010;16:238–246. doi: 10.1016/j.molmed.2010.03.003. [DOI] [PMC free article] [PubMed] [Google Scholar]
- Funato K., Major T., Lewis P.W., Allis C.D., Tabar V. Use of human embryonic stem cells to model pediatric gliomas with H3.3K27M histone mutation. Science. 2014;346:1529–1533. doi: 10.1126/science.1253799. [DOI] [PMC free article] [PubMed] [Google Scholar]
- Gearhart M.D., Corcoran C.M., Wamstad J.A., Bardwell V.J. Polycomb group and SCF ubiquitin ligases are found in a novel BCOR complex that is recruited to BCL6 targets. Mol. Cell. Biol. 2006;26:6880–6889. doi: 10.1128/MCB.00630-06. [DOI] [PMC free article] [PubMed] [Google Scholar]
- Ginjala V., Nacerddine K., Kulkarni A., Oza J., Hill S.J., Yao M., Citterio E., van Lohuizen M., Ganesan S. BMI1 is recruited to DNA breaks and contributes to DNA damage-induced H2A ubiquitination and repair. Mol. Cell. Biol. 2011;31:1972–1982. doi: 10.1128/MCB.00981-10. [DOI] [PMC free article] [PubMed] [Google Scholar]
- Grasso C.S., Tang Y., Truffaux N., Berlow N.E., Liu L., Debily M.A., Quist M.J., Davis L.E., Huang E.C., Woo P.J. Functionally defined therapeutic targets in diffuse intrinsic pontine glioma. Nat. Med. 2015;21:827. doi: 10.1038/nm0715-827a. [DOI] [PubMed] [Google Scholar]
- Grimm S.A., Chamberlain M.C. Brainstem glioma: a review. Curr. Neurol. Neurosci. Rep. 2013;13:346. doi: 10.1007/s11910-013-0346-3. [DOI] [PubMed] [Google Scholar]
- Halvorson K.G., Barton K.L., Schroeder K., Misuraca K.L., Hoeman C., Chung A., Crabtree D.M., Cordero F.J., Singh R., Spasojevic I. A high-throughput in vitro drug screen in a genetically engineered mouse model of diffuse intrinsic pontine glioma identifies BMS-754807 as a promising therapeutic agent. PLoS One. 2015;10:e0118926. doi: 10.1371/journal.pone.0118926. [DOI] [PMC free article] [PubMed] [Google Scholar]
- Harutyunyan A.S., Krug B., Chen H., Papillon-Cavanagh S., Zeinieh M., De Jay N., Deshmukh S., Chen C.C.L., Belle J., Mikael L.G. H3K27M induces defective chromatin spread of PRC2-mediated repressive H3K27me2/me3 and is essential for glioma tumorigenesis. Nat. Commun. 2019;10:1262. doi: 10.1038/s41467-019-09140-x. [DOI] [PMC free article] [PubMed] [Google Scholar]
- Hashizume R. Epigenetic Targeted Therapy for Diffuse Intrinsic Pontine Glioma. Neurol. Med. Chir. (Tokyo) 2017;57:331–342. doi: 10.2176/nmc.ra.2017-0018. [DOI] [PMC free article] [PubMed] [Google Scholar]
- Hashizume R., Andor N., Ihara Y., Lerner R., Gan H., Chen X., Fang D., Huang X., Tom M.W., Ngo V. Pharmacologic inhibition of histone demethylation as a therapy for pediatric brainstem glioma. Nat. Med. 2014;20:1394–1396. doi: 10.1038/nm.3716. [DOI] [PMC free article] [PubMed] [Google Scholar]
- Hu Y., Smyth G.K. ELDA: extreme limiting dilution analysis for comparing depleted and enriched populations in stem cell and other assays. J. Immunol. Methods. 2009;347:70–78. doi: 10.1016/j.jim.2009.06.008. [DOI] [PubMed] [Google Scholar]
- Jacobs J.J., Kieboom K., Marino S., DePinho R.A., van Lohuizen M. The oncogene and Polycomb-group gene bmi-1 regulates cell proliferation and senescence through the ink4a locus. Nature. 1999;397:164–168. doi: 10.1038/16476. [DOI] [PubMed] [Google Scholar]
- Jansen M.H., van Vuurden D.G., Vandertop W.P., Kaspers G.J. Diffuse intrinsic pontine gliomas: a systematic update on clinical trials and biology. Cancer Treat. Rev. 2012;38:27–35. doi: 10.1016/j.ctrv.2011.06.007. [DOI] [PubMed] [Google Scholar]
- Jin L., Cao Y., Yu G., Wang J., Lin X., Ge L., Du J., Wang L., Diao S., Lian X. SFRP2 enhances the osteogenic differentiation of apical papilla stem cells by antagonizing the canonical WNT pathway. Cell. Mol. Biol. Lett. 2017;22:14. doi: 10.1186/s11658-017-0044-2. [DOI] [PMC free article] [PubMed] [Google Scholar]
- Karpel-Massler G., Shu C., Chau L., Banu M., Halatsch M.E., Westhoff M.A., Ramirez Y., Ross A.H., Bruce J.N., Canoll P. Combined inhibition of Bcl-2/Bcl-xL and Usp9X/Bag3 overcomes apoptotic resistance in glioblastoma in vitro and in vivo. Oncotarget. 2015;6:14507–14521. doi: 10.18632/oncotarget.3993. [DOI] [PMC free article] [PubMed] [Google Scholar]
- Kim Y.H., Choi Y.W., Lee J., Soh E.Y., Kim J.H., Park T.J. Senescent tumor cells lead the collective invasion in thyroid cancer. Nat. Commun. 2017;8:15208. doi: 10.1038/ncomms15208. [DOI] [PMC free article] [PubMed] [Google Scholar]
- Knipstein J.A., Birks D.K., Donson A.M., Alimova I., Foreman N.K., Vibhakar R. Histone deacetylase inhibition decreases proliferation and potentiates the effect of ionizing radiation in atypical teratoid/rhabdoid tumor cells. Neuro-Oncol. 2012;14:175–183. doi: 10.1093/neuonc/nor208. [DOI] [PMC free article] [PubMed] [Google Scholar]
- Kumar S.S., Sengupta S., Lee K., Hura N., Fuller C., DeWire M., Stevenson C.B., Fouladi M., Drissi R. BMI-1 is a potential therapeutic target in diffuse intrinsic pontine glioma. Oncotarget. 2017;8:62962–62975. doi: 10.18632/oncotarget.18002. [DOI] [PMC free article] [PubMed] [Google Scholar]
- Larson J.D., Baker S.J. Engineering Inducible Knock-In Mice to Model Oncogenic Brain Tumor Mutations from Endogenous Loci. Methods Mol. Biol. 2019;1869:207–230. doi: 10.1007/978-1-4939-8805-1_18. [DOI] [PMC free article] [PubMed] [Google Scholar]
- Larson J.D., Kasper L.H., Paugh B.S., Jin H., Wu G., Kwon C.-H., Fan Y., Shaw T.I., Silveira A.B., Qu C. Histone H3.3 K27M Accelerates Spontaneous Brainstem Glioma and Drives Restricted Changes in Bivalent Gene Expression. Cancer Cell. 2019;35:140–155. doi: 10.1016/j.ccell.2018.11.015. [DOI] [PMC free article] [PubMed] [Google Scholar]
- Lewis P.W., Muller M.M., Koletsky M.S., Cordero F., Lin S., Banaszynski L.A., Garcia B.A., Muir T.W., Becher O.J., Allis C.D. Inhibition of PRC2 activity by a gain-of-function H3 mutation found in pediatric glioblastoma. Science. 2013;340:857–861. doi: 10.1126/science.1232245. [DOI] [PMC free article] [PubMed] [Google Scholar]
- Li Z., Cao R., Wang M., Myers M.P., Zhang Y., Xu R.M. Structure of a Bmi-1-Ring1B polycomb group ubiquitin ligase complex. J. Biol. Chem. 2006;281:20643–20649. doi: 10.1074/jbc.M602461200. [DOI] [PubMed] [Google Scholar]
- Li Z., Wang Y., Yuan C., Zhu Y., Qiu J., Zhang W., Qi B., Wu H., Ye J., Jiang H. Oncogenic roles of Bmi1 and its therapeutic inhibition by histone deacetylase inhibitor in tongue cancer. Lab. Invest. 2014;94:1431–1445. doi: 10.1038/labinvest.2014.123. [DOI] [PubMed] [Google Scholar]
- Love M.I., Huber W., Anders S. Moderated estimation of fold change and dispersion for RNA-seq data with DESeq2. Genome Biol. 2014;15:550. doi: 10.1186/s13059-014-0550-8. [DOI] [PMC free article] [PubMed] [Google Scholar]
- Lujambio A. To clear, or not to clear (senescent cells)? That is the question. BioEssays. 2016;38(Suppl 1):S56–S64. doi: 10.1002/bies.201670910. [DOI] [PubMed] [Google Scholar]
- Meng S., Luo M., Sun H., Yu X., Shen M., Zhang Q., Zhou R., Ju X., Tao W., Liu D. Identification and characterization of Bmi-1-responding element within the human p16 promoter. J. Biol. Chem. 2010;285:33219–33229. doi: 10.1074/jbc.M110.133686. [DOI] [PMC free article] [PubMed] [Google Scholar]
- Misuraca K.L., Hu G., Barton K.L., Chung A., Becher O.J. A Novel Mouse Model of Diffuse Intrinsic Pontine Glioma Initiated in Pax3-Expressing Cells. Neoplasia. 2016;18:60–70. doi: 10.1016/j.neo.2015.12.002. [DOI] [PMC free article] [PubMed] [Google Scholar]
- Moncsek A., Al-Suraih M.S., Trussoni C.E., O’Hara S.P., Splinter P.L., Zuber C., Patsenker E., Valli P.V., Fingas C.D., Weber A. Targeting senescent cholangiocytes and activated fibroblasts with B-cell lymphoma-extra large inhibitors ameliorates fibrosis in multidrug resistance 2 gene knockout (Mdr2−/−) mice. Hepatology. 2018;67:247–259. doi: 10.1002/hep.29464. [DOI] [PMC free article] [PubMed] [Google Scholar]
- Morey L., Santanach A., Blanco E., Aloia L., Nora E.P., Bruneau B.G., Di Croce L. Polycomb Regulates Mesoderm Cell Fate-Specification in Embryonic Stem Cells through Activation and Repression Mechanisms. Cell Stem Cell. 2015;17:300–315. doi: 10.1016/j.stem.2015.08.009. [DOI] [PubMed] [Google Scholar]
- Muñoz-Espín D., Serrano M. Cellular senescence: from physiology to pathology. Nat. Rev. Mol. Cell Biol. 2014;15:482–496. doi: 10.1038/nrm3823. [DOI] [PubMed] [Google Scholar]
- Nagaraja S., Quezada M.A., Gillespie S.M., Arzt M., Lennon J.J., Woo P.J., Hovestadt V., Kambhampati M., Filbin M.G., Suva M.L. Histone Variant and Cell Context Determine H3K27M Reprogramming of the Enhancer Landscape and Oncogenic State. Mol. Cell. 2019;76:965–980.e12. doi: 10.1016/j.molcel.2019.08.030. [DOI] [PMC free article] [PubMed] [Google Scholar]
- Park I.K., Morrison S.J., Clarke M.F. Bmi1, stem cells, and senescence regulation. J. Clin. Invest. 2004;113:175–179. doi: 10.1172/JCI20800. [DOI] [PMC free article] [PubMed] [Google Scholar]
- Paugh B.S., Broniscer A., Qu C., Miller C.P., Zhang J., Tatevossian R.G., Olson J.M., Geyer J.R., Chi S.N., da Silva N.S. Genome-wide analyses identify recurrent amplifications of receptor tyrosine kinases and cell-cycle regulatory genes in diffuse intrinsic pontine glioma. J. Clin. Oncol. 2011;29:3999–4006. doi: 10.1200/JCO.2011.35.5677. [DOI] [PMC free article] [PubMed] [Google Scholar]
- Piunti A., Hashizume R., Morgan M.A., Bartom E.T., Horbinski C.M., Marshall S.A., Rendleman E.J., Ma Q., Takahashi Y.H., Woodfin A.R. Therapeutic targeting of polycomb and BET bromodomain proteins in diffuse intrinsic pontine gliomas. Nat. Med. 2017;23:493–500. doi: 10.1038/nm.4296. [DOI] [PMC free article] [PubMed] [Google Scholar]
- Saleh T., Tyutyunyk-Massey L., Gewirtz D.A. Tumor Cell Escape from Therapy-Induced Senescence as a Model of Disease Recurrence after Dormancy. Cancer Res. 2019;79:1044–1046. doi: 10.1158/0008-5472.CAN-18-3437. [DOI] [PubMed] [Google Scholar]
- Sauvageau M., Sauvageau G. Polycomb group proteins: multi-faceted regulators of somatic stem cells and cancer. Cell Stem Cell. 2010;7:299–313. doi: 10.1016/j.stem.2010.08.002. [DOI] [PMC free article] [PubMed] [Google Scholar]
- Scelfo A., Piunti A., Pasini D. The controversial role of the Polycomb group proteins in transcription and cancer: how much do we not understand Polycomb proteins? FEBS J. 2015;282:1703–1722. doi: 10.1111/febs.13112. [DOI] [PubMed] [Google Scholar]
- Schosserer M., Grillari J., Breitenbach M. The Dual Role of Cellular Senescence in Developing Tumors and Their Response to Cancer Therapy. Front. Oncol. 2017;7:278. doi: 10.3389/fonc.2017.00278. [DOI] [PMC free article] [PubMed] [Google Scholar]
- Schwartzentruber J., Korshunov A., Liu X.Y., Jones D.T., Pfaff E., Jacob K., Sturm D., Fontebasso A.M., Quang D.A., Tönjes M. Driver mutations in histone H3.3 and chromatin remodelling genes in paediatric glioblastoma. Nature. 2012;482:226–231. doi: 10.1038/nature10833. [DOI] [PubMed] [Google Scholar]
- Shannon P., Markiel A., Ozier O., Baliga N.S., Wang J.T., Ramage D., Amin N., Schwikowski B., Ideker T. Cytoscape: a software environment for integrated models of biomolecular interaction networks. Genome Res. 2003;13:2498–2504. doi: 10.1101/gr.1239303. [DOI] [PMC free article] [PubMed] [Google Scholar]
- Siddique H.R., Parray A., Zhong W., Karnes R.J., Bergstralh E.J., Koochekpour S., Rhim J.S., Konety B.R., Saleem M. BMI1, stem cell factor acting as novel serum-biomarker for Caucasian and African-American prostate cancer. PLoS ONE. 2013;8:e52993. doi: 10.1371/journal.pone.0052993. [DOI] [PMC free article] [PubMed] [Google Scholar]
- Sieburg H.B., Cho R.H., Muller-Sieburg C.E. Limiting dilution analysis for estimating the frequency of hematopoietic stem cells: uncertainty and significance. Exp. Hematol. 2002;30:1436–1443. doi: 10.1016/s0301-472x(02)00963-3. [DOI] [PubMed] [Google Scholar]
- Sroczynska P., Cruickshank V.A., Bukowski J.P., Miyagi S., Bagger F.O., Walfridsson J., Schuster M.B., Porse B., Helin K. shRNA screening identifies JMJD1C as being required for leukemia maintenance. Blood. 2014;123:1870–1882. doi: 10.1182/blood-2013-08-522094. [DOI] [PubMed] [Google Scholar]
- Sturm D., Bender S., Jones D.T., Lichter P., Grill J., Becher O., Hawkins C., Majewski J., Jones C., Costello J.F. Paediatric and adult glioblastoma: multiform (epi)genomic culprits emerge. Nat. Rev. Cancer. 2014;14:92–107. doi: 10.1038/nrc3655. [DOI] [PMC free article] [PubMed] [Google Scholar]
- Subkhankulova T., Zhang X., Leung C., Marino S. Bmi1 directly represses p21Waf1/Cip1 in Shh-induced proliferation of cerebellar granule cell progenitors. Mol. Cell. Neurosci. 2010;45:151–162. doi: 10.1016/j.mcn.2010.06.006. [DOI] [PubMed] [Google Scholar]
- Subramanian A., Tamayo P., Mootha V.K., Mukherjee S., Ebert B.L., Gillette M.A., Paulovich A., Pomeroy S.L., Golub T.R., Lander E.S., Mesirov J.P. Gene set enrichment analysis: a knowledge-based approach for interpreting genome-wide expression profiles. Proc. Natl. Acad. Sci. USA. 2005;102:15545–15550. doi: 10.1073/pnas.0506580102. [DOI] [PMC free article] [PubMed] [Google Scholar]
- Sun Y., Campisi J., Higano C., Beer T.M., Porter P., Coleman I., True L., Nelson P.S. Treatment-induced damage to the tumor microenvironment promotes prostate cancer therapy resistance through WNT16B. Nat. Med. 2012;18:1359–1368. doi: 10.1038/nm.2890. [DOI] [PMC free article] [PubMed] [Google Scholar]
- Szak S.T., Mays D., Pietenpol J.A. Kinetics of p53 binding to promoter sites in vivo. Mol. Cell. Biol. 2001;21:3375–3386. doi: 10.1128/MCB.21.10.3375-3386.2001. [DOI] [PMC free article] [PubMed] [Google Scholar]
- Tcw J., Wang M., Pimenova A.A., Bowles K.R., Hartley B.J., Lacin E., Machlovi S.I., Abdelaal R., Karch C.M., Phatnani H. An Efficient Platform for Astrocyte Differentiation from Human Induced Pluripotent Stem Cells. Stem Cell Reports. 2017;9:600–614. doi: 10.1016/j.stemcr.2017.06.018. [DOI] [PMC free article] [PubMed] [Google Scholar]
- Tripathi S., Pohl M.O., Zhou Y., Rodriguez-Frandsen A., Wang G., Stein D.A., Moulton H.M., DeJesus P., Che J., Mulder L.C. Meta- and Orthogonal Integration of Influenza "OMICs" Data Defines a Role for UBR4 in Virus Budding. Cell Host Microbe. 2015;18:723–735. doi: 10.1016/j.chom.2015.11.002. [DOI] [PMC free article] [PubMed] [Google Scholar]
- Trojer P., Li G., Sims R.J., 3rd, Vaquero A., Kalakonda N., Boccuni P., Lee D., Erdjument-Bromage H., Tempst P., Nimer S.D. L3MBTL1, a histone-methylation-dependent chromatin lock. Cell. 2007;129:915–928. doi: 10.1016/j.cell.2007.03.048. [DOI] [PubMed] [Google Scholar]
- Tropepe V., Sibilia M., Ciruna B.G., Rossant J., Wagner E.F., van der Kooy D. Distinct neural stem cells proliferate in response to EGF and FGF in the developing mouse telencephalon. Dev. Biol. 1999;208:166–188. doi: 10.1006/dbio.1998.9192. [DOI] [PubMed] [Google Scholar]
- Venkataraman S., Davidson N., Samson J., Balakrishnan I., Birks D., Alimova I., Amani V., Prince E., Donson A., Mulcahy-Levy J. HG-78: Synthetic Lethal Epigenetic Interactions in K27m Mutated Dipg. Neuro Oncol. 2016;18:iii66. [Google Scholar]
- Veo B., Danis E., Pierce A., Sola I., Wang D., Foreman N.K., Jin J., Ma A., Serkova N., Venkataraman S., Vibhakar R. Combined functional genomic and chemical screens identify SETD8 as a therapeutic target in MYC-driven medulloblastoma. JCI Insight. 2019;4 doi: 10.1172/jci.insight.122933. [DOI] [PMC free article] [PubMed] [Google Scholar]
- Vidal M., Starowicz K. Polycomb complexes PRC1 and their function in hematopoiesis. Exp. Hematol. 2017;48:12–31. doi: 10.1016/j.exphem.2016.12.006. [DOI] [PubMed] [Google Scholar]
- Wagner J., Damaschke N., Yang B., Truong M., Guenther C., McCormick J., Huang W., Jarrard D. Overexpression of the novel senescence marker β-galactosidase (GLB1) in prostate cancer predicts reduced PSA recurrence. PLoS ONE. 2015;10:e0124366. doi: 10.1371/journal.pone.0124366. [DOI] [PMC free article] [PubMed] [Google Scholar]
- Wang H., Wang L., Erdjument-Bromage H., Vidal M., Tempst P., Jones R.S., Zhang Y. Role of histone H2A ubiquitination in Polycomb silencing. Nature. 2004;431:873–878. doi: 10.1038/nature02985. [DOI] [PubMed] [Google Scholar]
- Wang Y., Zang X., Wang Y., Chen P. High expression of p16INK4a and low expression of Bmi1 are associated with endothelial cellular senescence in the human cornea. Mol. Vis. 2012;18:803–815. [PMC free article] [PubMed] [Google Scholar]
- Wang Q., Li Z., Wu Y., Huang R., Zhu Y., Zhang W., Wang Y., Cheng J. Pharmacological inhibition of Bmi1 by PTC-209 impaired tumor growth in head neck squamous cell carcinoma. Cancer Cell Int. 2017;17:107. doi: 10.1186/s12935-017-0481-z. [DOI] [PMC free article] [PubMed] [Google Scholar]
- Warren K.E., Killian K., Suuriniemi M., Wang Y., Quezado M., Meltzer P.S. Genomic aberrations in pediatric diffuse intrinsic pontine gliomas. Neuro-oncol. 2012;14:326–332. doi: 10.1093/neuonc/nor190. [DOI] [PMC free article] [PubMed] [Google Scholar]
- Watanabe S., Kawamoto S., Ohtani N., Hara E. Impact of senescence-associated secretory phenotype and its potential as a therapeutic target for senescence-associated diseases. Cancer Sci. 2017;108:563–569. doi: 10.1111/cas.13184. [DOI] [PMC free article] [PubMed] [Google Scholar]
- Wu G., Broniscer A., McEachron T.A., Lu C., Paugh B.S., Becksfort J., Qu C., Ding L., Huether R., Parker M., St. Jude Children’s Research Hospital-Washington University Pediatric Cancer Genome Project Somatic histone H3 alterations in pediatric diffuse intrinsic pontine gliomas and non-brainstem glioblastomas. Nat. Genet. 2012;44:251–253. doi: 10.1038/ng.1102. [DOI] [PMC free article] [PubMed] [Google Scholar]
- Xu C., Liu X., Geng Y., Bai Q., Pan C., Sun Y., Chen X., Yu H., Wu Y., Zhang P. Patient-derived DIPG cells preserve stem-like characteristics and generate orthotopic tumors. Oncotarget. 2017;8:76644–76655. doi: 10.18632/oncotarget.19656. [DOI] [PMC free article] [PubMed] [Google Scholar]
- Yu G., Wang L.G., He Q.Y. ChIPseeker: an R/Bioconductor package for ChIP peak annotation, comparison and visualization. Bioinformatics. 2015;31:2382–2383. doi: 10.1093/bioinformatics/btv145. [DOI] [PubMed] [Google Scholar]
- Zarghooni M., Bartels U., Lee E., Buczkowicz P., Morrison A., Huang A., Bouffet E., Hawkins C. Whole-genome profiling of pediatric diffuse intrinsic pontine gliomas highlights platelet-derived growth factor receptor alpha and poly (ADP-ribose) polymerase as potential therapeutic targets. J. Clin. Oncol. 2010:1337–1344. doi: 10.1200/JCO.2009.25.5463. [DOI] [PubMed] [Google Scholar]
- Zhang Y., Liu T., Meyer C.A., Eeckhoute J., Johnson D.S., Bernstein B.E., Nusbaum C., Myers R.M., Brown M., Li W., Liu X.S. Model-based analysis of ChIP-Seq (MACS) Genome Biol. 2008;9:R137. doi: 10.1186/gb-2008-9-9-r137. [DOI] [PMC free article] [PubMed] [Google Scholar]
- Zhao W., Jiang B., Hu H., Zhang S., Lv S., Yuan J., Qian Y., Zou Y., Li X., Jiang H. Lack of CUL4B leads to increased abundance of GFAP-positive cells that is mediated by PTGDS in mouse brain. Hum. Mol. Genet. 2015;24:4686–4697. doi: 10.1093/hmg/ddv200. [DOI] [PubMed] [Google Scholar]
Associated Data
This section collects any data citations, data availability statements, or supplementary materials included in this article.
Supplementary Materials
Spreadsheet providing top hits from the epigenetic shRNA and drugs screens in DIPG cells.
Data Availability Statement
No unpublished custom code, software or algorithm was used in this study. The accession number for the RNA-Seq and ChIP-Seq data reported in this paper is GEO: GSE140768. https://www.ncbi.nlm.nih.gov/geo/query/acc.cgi?acc=GSE140768.
RNA and ChIP Sequencing data have been deposited in the National Center for Biotechnology Information Gene Expression Omnibus (GEO) database and are publicly accessible through GEO: GSE140768.