

Abstract
The productivity of computational biologists is limited by the speed of their workflows and subsequent overall job throughput. Because most biomedical researchers are focused on better understanding scientific phenomena rather than developing and optimizing code, a computing and data system implemented in an adventitious and/or non-optimized manner can impede the progress of scientific discovery. In our experience, most computational, life-science applications do not generally leverage the full capabilities of high-performance computing, so tuning a system for these applications is especially critical. To optimize a system effectively, systems staff must understand the effects of the applications on the system. Effective stewardship of the system includes an analysis of the impact of the applications on the compute cores, file system, resource manager and queuing policies. The resulting improved system design, and enactment of a sustainability plan, help to enable a long-term resource for productive computational and data science.
We present a case study of a typical biomedical computational workload at a leading academic medical center supporting over $100 million per year in computational biology research. Over the past eight years, our high-performance computing system has enabled over 900 biomedical publications in four major areas: genetics and population analysis, gene expression, machine learning, and structural and chemical biology. We have upgraded the system several times in response to trends, actual usage, and user feedback. Major components crucial to this evolution include scheduling structure and policies, memory size, compute type and speed, parallel file system capabilities, and deployment of cloud technologies. We evolved a 70 teraflop machine to a 1.4 petaflop machine in seven years and grew our user base nearly 10-fold. For long-term stability and sustainability, we established a chargeback fee structure.
Our overarching guiding principle for each progression has been to increase scientific throughput and enable enhanced scientific fidelity with minimal impact to existing user workflows or code. This highly-constrained system optimization has presented unique challenges, leading us to adopt new approaches to provide constructive pathways forward. We share our practical strategies resulting from our ongoing growth and assessments.
Keywords: high performance computing, computational biology, genomics, system optimization, scheduling, parallel file systems, cloud technologies, sustainability
I. Introduction
In May 2012, the Scientific Computing team unveiled Minerva, the first high-performance computer at the Icahn School of Medicine at Mount Sinai in New York, NY (hereafter “Sinai”). This machine consisted of 120 Dell C6145 nodes (7,680 AMD 2.3-GHz Interlagos cores with 256 GB of memory/node) and 1.5 petabytes (PB) of DDN SFA10K storage. The evolution of Minerva’s compute partitions is shown in Table 1a and the storage in Table 1b. Though it was the first supercomputer at Mount Sinai, Minerva was swiftly accepted as an essential and integral part of scientific discovery and was used primarily for genetic and genomic sciences and molecular dynamics simulations. Accordingly, researchers rapidly devised more sophisticated experiments and simulations with increased fidelity to expand and accelerate progress on their scientific investigations.
Table 1a.
Minerva compute and 1b Minerva storage evolution
| Compute Partition |
Lifetime | Core Type | # of Cores |
|---|---|---|---|
| AMD | 2012-2019 | AMD Interlagos | 7,680 |
| Intel | 2014-2019 | Intel IvyBridge | 2,508 |
| BODE | 2014-2019 | Intel Haswell | 2,484 |
| Chimera | 2019- | Intel Platinum | 14,304 |
| BODE2 | 2019- | Intel Platinum | 3,840 |
| Total | Available | in 2020 | 18,144 |
| GPFS Name | Lifetime | Storage Type | Raw PB |
| SFA10K | 2012-2019 | DDN SFA10K | 1.5 |
| Orga | 2014- | IBM ESS BE | 3 |
| Orga | 2014-2017 | IBM FlashSystems | 0.16 |
| Orga | 2014- | DDN SFA12K | 5 |
| Orga | 2017- | IBM Flash 840 | 0.24 |
| Hydra | 2017- | IBM ESS LE | 4 |
| Arion | 2019- | Lenovo DSS | 14 |
| Arion | 2019- | Lenovo G201 flash | 0.15 |
| Total | Available | in 2020 | 29 |
In February 2014, Minerva was expanded with new, state-of-the-art Intel processors consisting of 209 IBM NeXtScale Intel Xeon IvyBridge (E5-2643 v2) nodes (2,508 3.5-GHz cores with 64 GB/node), 3 petabytes (PB) of IBM GSS BE (big endian), and 160 terabytes (TB) of IBM FlashSystems solid state disk. In this same year the National Institutes of Health (NIH) funded a Big Omics Data Engine (BODE) supercomputer in 2014. By the end of 2014, there was a total of over 400 servers, comprising 12,672 cores, 60 TB of RAM, and 11 PB of raw storage capacity [1].
However, by 2017 the GSS and solid state disk were out of warranty and limited in the version of the Spectrum Scale general parallel file system (GPFS) that could run on these subsystems. Therefore, we replaced these in 2017 with 4 PB of IBM ESS LE (little endian) and 248 TB of flash storage.
In 2019, we again refreshed the machine for a total of 1.4 petaflops of compute power, with 18,144 Intel Gold 8168 24C, 2.7-GHz compute cores (48 cores/node with two sockets/node) with 192 GB of memory per node in 286 nodes, 80 TB of total memory, 350 TB of solid state storage, 48 V100 GPUs and 29 PB of raw storage. This includes a second BODE2 funded by NIH in 2019 to enable computationally and data intensive workflows for NIH-funded projects. Although we have identified compute partitions by specific names and queues with certain access policies, the overall machine is called Minerva. As of 2020, we have two partitions: Chimera and BODE2, with BODE2 only accessible to NIH-funded research in accordance with our NIH S10 award. We have three separate GPFS file systems mounted on compute nodes: Orga at GPFS 4.x, Hydra at GPFS 5.x and Arion at GPFS 5.x. Arion, which was funded by the S10 award, contains only NIH-funded research data.
Minerva has been a productive platform for biomedical researchers at Sinai and their external collaborators. The total number of users has grown almost 10 times over seven years as shown in Table 2. Some of the increase has been driven by the expansion in the number of NIH-funded consortia that rely on Minerva. In 2013, there were only five consortia, and in 2019 there are now nine: Accelerating Medicines Partnership-Alzheimer’s Disease (AMP-AD), Autism Sequencing Consortium (ASC), CommonMind, Library of Integrated Network-based Cellular Signatures (LINCS), Pediatric Cardiac Genomics, Porphyria Rare Disease Clinical Research, Psych Encyclopedia of DNA Elements (PsychENCODE), Psychiatric Genomics, and Systems Biology Center New York [2-10].
Table 2.
Minerva user growth and engagement over time
| 2013 | 2019 | |
|---|---|---|
| Total # of users | 339 | 2,484 |
| # of external users | 62 | 550 |
| # of external institutions | 27 | 75 |
| # of projects | 11 | 312 |
| # of tickets | 287 | 3,454 |
II. Computational Biomedical Research at Mount Sinai
Minerva and our team provide infrastructure, partnership and expertise for over $100 million dollars in yearly NIH funding. This mix of biomedical applications has evolved over time as shown in Table 3. Figure 1 illustrates the overarching research workflow and specific applications utilized on Minerva by different biomedical fields. We categorized Minerva’s research projects into similar scientific approaches and identified four main biomedical research areas: genetics and population analysis, gene expression, machine learning and structural and chemical biology. These basic science areas work towards better understanding and treatment for many diseases including autism, insulin resistance in diabetics, schizophrenia and related neurobehavioral disorders, cardiac care, the origins of drug addiction and depression, and cancer progression. External collaborators work with various institutes and departments at Sinai, with selected institutes represented in the diagram.
Table 3.
Evolution of biomedical applications over time
| Biomedical Field | % usage 2013 |
% usage 2019 |
|---|---|---|
| Genetics and Genomic Sciences | 65% | 69% |
| Structural and Chemical Biology | 32% | 10% |
| Machine Learning | 0% | 10% |
| Other | 3% | 11% |
Figure 1.
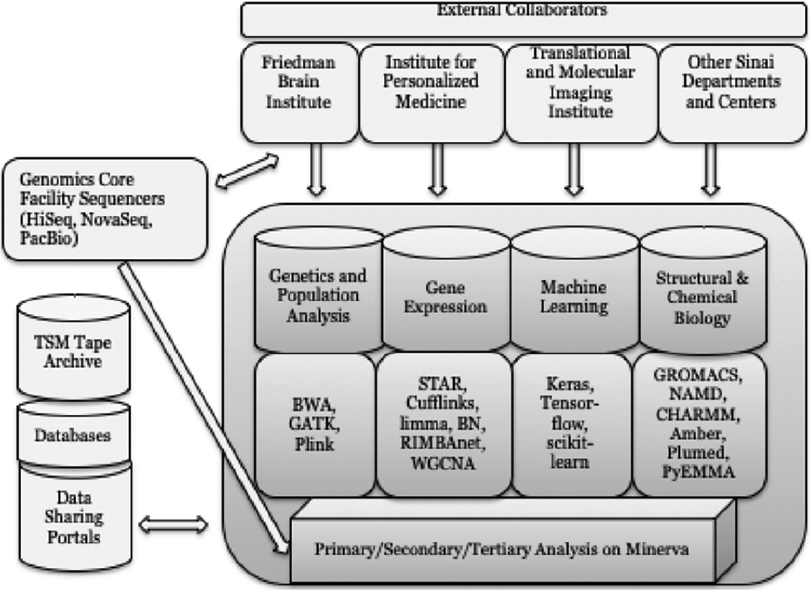
Research workflow and dominant applications
The arrows in Figure 1 indicate the major flows of data, with the largest data motion being driven by our genomics sequencing systems and the transmission of inputs/results to/from national databases for data sharing. An additional major data flow is the archiving of data on tape via Tivoli Storage Manager (TSM). The specific research topics are listed along with the approaches and types of analyses/models used and some of the major software packages that support this work. We are committed to NIH’s Findability, Accessibility, Interoperability and Reusability (FAIR) principles, and work closely with researchers to help carry out these precepts [11]. Many of the research results are deposited in national data-sharing repositories.
Genetics, population analysis and gene expression benefit from the initial computational processing from the genomic sequencing, as shown in Figure 2: (1) primary analysis from the processing of samples through the genomics sequencing core facility, (2) secondary analysis (primarily genome alignment) for these samples performed by the genomics sequencing core, (3) tertiary analysis (variant calling, validation and annotation of variances, and differential expression) from these samples performed by the genomics sequencing core, and (4) biomedical interpretation with many different styles of statistical and network analysis performed by researchers directly. These biomedical interpretation analyses are performed with the aim of identifying genes and networks of genes/proteins that associate with human disease and/or disrupted animal models. While steps 1-3 are usually predictable in terms of their computational and storage requirements, the costs of step (4), biomedical interpretation, can vary and grow substantially. These steps can involve simulations and network analyses of high computational complexity.
Figure 2.

Typical computational genomic workflow.
A. Genetics and Population Analysis
The study of genetic differences between and within populations has always been a core expertise at Sinai. This research includes segregation analysis, linkage analysis, association analysis, map construction, population simulation, haplotyping, linkage disequilibrium, pedigree drawing, marker discovery, power calculation, and genotype calling. Identifying genomic variants, such as single nucleotide polymorphisms (SNPs) and DNA insertions and deletions (indels), can provide important insight into complex diseases and disorders, and lead to other scientific discoveries among the population. To this end, Sinai’s geneticists are actively developing and running pipelines for rapidly identifying and annotating variants. The scientific workflow for this is shown in Figure 2. To robustly associate more genes with diseases, geneticists must study more patients and different data types, such as structural data on hundreds of individuals and RNA-seq and whole exome sequencing data on thousands of samples, as well as developing improved statistical techniques that achieve greater statistical power.
The top application packages utilized by these researchers are Burrows-Wheeler Alignment Tool (BWA) for sequence alignment, the genome analysis toolkit (GATK) for variant calling, and PLINK for whole genome association analysis [12-13]. Geneticists at Sinai utilize these tools for statistical analyses.
B. Gene Expression
Gene expression is the process by which genetic information is used to direct protein synthesis. This research topic measures expression of biological quantities through approaches including microarrays (nucleic acid, protein, comparative genome hybridization, genome tiling, and others), RNA-seq, proteomics, and mass spectrometry. As such the work requires statistical analysis of differential gene expression, expression-based classifiers, and regulatory networks; pathway analysis; integration of expression data; expression-based annotation (e.g., Gene Ontology) of genes and gene sets; and so on.
Software most used by these research groups are differential expression analysis tools such as limma, Cufflinks, and DEseq, and network modeling such as BN, WGCNA, and RIMBAnet. With these expression analyses, researchers are seeking to identify genes and networks of genes/proteins that associate with human disease and/or disrupted animal models such as schizophrenia, bipolar disorder, and melanoma.
C. Machine Learning
Machine learning uses statistical approaches to progressively improve on a given task without being explicitly programmed to do so. Recent advances in the field of genomics have the potential to yield unprecedented insight into the biology of human disease. Large-scale efforts have generated massive datasets combining genetics, gene expression, and epigenetics from many cell types, tissues, patients, and diseases. Yet, the promise of improved understanding of the molecular etiology of human disease, the development of novel treatments, and the application of personalized medicine are currently limited by the ability to interpret these data. Machine learning methods are increasingly used by geneticists at Sinai to aid the analysis of those large, heterogeneous data sets. Such approaches have proven useful in a variety of problems in genetics and genomics, such as annotating genomic sequence elements to recognize patterns within high-volume genetic data sets, processing gene expression data to identify potentially valuable disease biomarkers, assigning functional annotations to genes, and understanding the mechanisms underlying gene expression. For example, non-coding variants contribute to disease risk by regulating gene expression, and this effect is driven in large part by the genetic regulation of transcription factor binding and histone modification. Predicting the functional effect of non-coding variants on the epigenome will distinguish benign variants from variants with the potential to confer disease risk. Deep convolutional neural networks have recently been used to develop predictive models linking the genome sequence to splicing, protein binding, and the discrete presence or absence of a signal from epigenomic assays.
The tools used by these research groups are varied depending on the specific problem. General software includes Python, scikit-learn, Lua, Torch, Keras, and TensorFlow for implementation of deep convolutional neural networks.
D. Structural and Chemical Biology
Structural and chemical biologists strive to uncover how proteins interact. Researchers focus on the biological mechanisms underlying complex physiology and pathophysiology, and translating biological knowledge into new therapeutics. Biological processes are studied at the molecular, cellular, tissue, and organismal levels to understand how these processes function and how they can be modulated for therapeutic purposes. Studies involve analysis of interactions of exogenous and endogenous substances with biological systems and the development of new therapeutics based on the understanding of cellular and molecular interactions. These perspectives provide a continuum of thought and research in understanding the origins and mechanisms underlying complex diseases and how they can be treated. Research projects in this group are seeking to understand the molecular mechanisms underlying the physiological function of complex protein systems (e.g. G protein-coupled receptors (GPCRs) as prominent drug targets for pain management, drug abuse/addiction, and mood disorders; integrins; and membrane proteins), applying electron microscopy to protein structure determination, and determining the causes of thyroid autoimmune disease with the TSH receptor as the key molecule of interest.
The main computationally-intensive software packages utilized in these programs are molecular dynamics-based ones such as GROMACS, NAMD, CHARMM, Amber, Plumed, and PyEMMA. Specifically, GROMACS, a versatile package to perform molecular dynamics simulations, is efficiently parallelized on CPUs. Computational efficiency can be maximized by employing an optimal combination of Message Passing Interface (MPI) tasks and OpenMP threads depending of the architecture, available resources, and details of the simulation algorithm. Computationally-intensive parts of the code, specifically non-bonded kernels, as well as partial-mesh Ewald, bonded force calculations, and neighbor searching, employ Single Instruction Multiple Data (SIMD) intrinsic acceleration for a variety of architectures, including SSE (2 and 4.1), Intel Sandy+Ivy Bridge and Intel Haswell/Haswell-E, Skylake, and AVX-AVX-512. Plumed provides an efficient way to customize molecular dynamics codes (including GROMACS) to tailor the integration algorithm by adding biases that enhance the sampling of molecular conformations during the simulation. The calculation of computationally-intensive order parameters is partly parallelized using OpenMP. PyEMMA and High-Throughput Molecular Dynamics (HTMD) are, respectively, a comprehensive Python library to perform Markov Modeling analysis and a programmable Python environment to handle and simulate large molecular systems using an adaptive sampling strategy that exploits Markov modeling to enhance the sampling of relevant degrees of freedom.
E. Other Applications
We also have a large group of other projects that require high-performance computing and storage, but their usage doesn’t fall easily into the other three categories. In some cases, Minerva supports their cumulative substantial need for storage of their data, and enables both the sharing of data and compute among their communities. For example, researchers in the radiological imaging department need a common place to hold and compute on their 40 TB of Human Connectome Project images. Users in the group access and process the shared data for different procedures and study aims.
III. The Minerva High-Performance Computing System Design
Computational and data scientists at Sinai are empowered through a full-featured high-performance computing (HPC) and data ecosystem as shown in Figure 3. Capabilities include high performance, striped file transfer with GridFTP and Globus Online, MySQL and Mongo databases, over 400 researcher controlled websites for lab pages and data sharing, over 1,000 professionally managed applications, and TSM archival storage.
Figure 3.

Minerva configuration
As the mix of biomedical applications has evolved, we have also adapted and upgraded Minerva to be responsive and efficient for these applications. Our overarching design goal and intent for each system-wide change has been to accelerate scientific discovery by (a) maximally improving the throughput of our workload through optimal compute core selection and streamlined queue policies, and (b) maximally increasing both the performance and size of file system. These twin objectives are of paramount importance when planning for the greatest useful lifetime of a computational and data instrument.
When exploring system improvements, we chose the specifications, features, and vendor based on a balance of the following factors: (1) a needs analysis from our users including responses to our annual user surveys, (2) an examination of actual Minerva usage, (3) performance of benchmarks, (4) observation of application trends, (5) projected use over the next five years, and (6) the maximum amount of nodes and storage that vendors would agree to provide for a fixed cost. Although there have been efforts in the community to leverage HPC approaches for reduced time to solution for genomic applications [14-19], we have found that most biomedical researchers at our institution utilize off-the-shelf code. For this reason, we have invested significant effort into optimizing the system to be as efficient as possible for our workload. We selected the applications consuming the most compute core time on Minerva to benchmark to identify the “next” compute cores with the highest efficiency for our workload. Table 4 shows a subset of the data we collected and analyzed to better understand Minerva’s workload. Armed with these data plus the other specifications from the previous paragraph, we applied our findings to configure an upgraded Minerva: (1) increased memory per node, (2) increased cores/node, (3) increased storage, and (4) adding cloud technologies for containers and virtual machines.
Table 4.
Minerva usage over time
| Minerva Usage 2013 |
Minerva Usage 2019 |
|
|---|---|---|
| Number of files | 54,026,071 | 2,351,357,662 |
| Total storage used | 0.7 PB | 8.1 PB |
| Number of zero-length files | 1,731,148 | 52,394,913 |
| Amount of archival storage used for two copies | 1 PB | 18 PB |
| Max memory used per core | 787 GB | 960 GB |
| Average memory used per core | 885 MB | 2.95 GB |
| Median memory used per core | 320 MB | 470 MB |
| Average memory used per job | 1.8 GB | 3.8 GB |
| Median memory used per job | 651 MB | 675 MB |
| Number of jobs run | 2,560,896 | 52,190,640 |
| Max core hours used per job | 22,161 | 59,511 |
| Average core hours used per job | 4.2 | 2.05 |
| Max job run time (hours) | 205 | 336 |
| Avg job run time (hours) | 1.6 | 1.42 |
| Median job run time (hours) | 0.08 (5 min) | 0.08 (5 min) |
A. Memory
Most genomic applications including GATK and RNA-seq are memory and I/O intensive, with an average of 50% idle CPU time. These pipelines use varying amounts of memory throughout their workflow, submitting groups of 10,000-20,000 jobs at a time, which accounts for the idle CPU time and the need for a scheduler that can handle a large number of jobs in the queue. The idle-time ratio is lower for CPU-intensive applications such as molecular dynamics simulations, but those jobs form a smaller percentage of Minerva’s workload. We found memory starvation due to only 64 GB total memory available per node.
Table 4 also shows how job usage on Minerva has evolved over time: The average and median memory used per core and per job have all increased to some extent over the years, as the average per job and per core memory usage have more than doubled. GPFS alone uses 8 GB for page pooling, and the kernel and NFS caching contribute an additional 4 GB, leaving only 52 GB for these 12-core nodes (4.3 GB per core). Firstly, the memory-intensive jobs (> 52 GB) including serial and multi-threaded shared memory jobs cannot be run on those nodes. Some of them can be done with extra effort on truncating the input data and pipeline procedures, while others are simply blocked. There is growth of genomic analyses with whole genome data, making the portion of memory-intensive jobs non-negligible. Secondly, there are many jobs requiring more than 4.3 GB of memory per core, which is another blocker for overall throughput of the whole nodes, since the one-core job occupies most of memory in the node, leaving other cores idle. This makes the whole cluster very inefficient from a throughput perspective, as sometimes the whole cluster can be taken up by several users running similar jobs if there is no memory-related limitation or priority set on the scheduler.
B. Compute
Genomics analysis projects are typically based on a standard set of computational tools, on top of which researchers build and configure their own pipelines for their projects. The most used computational software packages on Minerva, for instance, include a representative set of these tools: samtools, BWA, GATK, BN, Cufflinks, Bowtie, Pindel, TopHat, Picard, STAR, Bedtools, and PLINK. For each component of the genomics pipeline, depending upon the application, one or more of the core components can function as the rate-limiting step. It is therefore crucial that adequate performance testing be completed to establish the most efficient possible system configuration.
The genomics workflow for both RNA and DNA analysis typically proceeds as a three-step process. First, the primary analysis involves concatenating the data that come from the genomic sequencers into primary input files. This step is computationally trivial. However, the storage requirements are significant. Each run of an Illumina sequencer, for example, produces approximately one-half TB of raw data. Currently, Sinai has 10 Illumina sequencers each performing 2 runs a week, producing 10 TB/week of raw data during primary analysis. Adding the other sequencers available at Sinai, this value rises to 12 TB/week in raw, primary data. With this relatively large volume of raw data, it is crucial that the bandwidth between sequencers and Minerva be as fast as possible, which requires that both instruments be onsite, as opposed to using cloud-based resources. Since cloud resources charge not only for the space used, but also for data movement out of the cloud, the costs quickly become prohibitively expensive both in terms of time and money.
Secondary analysis involves aligning a sequence to a reference genome and calling variants. Alignment of millions of short reads to a large reference genome with many complex regions is a challenging task and is the most computationally intense portion of the genomics workflow for both RNA and DNA analyses. For this reason, we chose to benchmark these applications to guide our choice for a new Minerva compute architecture. This step also has large storage requirements – it nearly doubles the total data storage requirement after primary analysis.
Tertiary analysis includes the whole genome, whole exome, RNA-Seq and genome assembly pipelines. It includes the downstream variant calling, pathway analysis, expression profiling, network modeling and genome assembly.
In the DNA pipeline, the principal limiting factor is the choice of CPU architecture. Modern computer architectures have multiple cores: two or more independent processing units that can run instructions in parallel. In 2018 as we were preparing for our latest upgrade, we evaluated the latest mainstream Advanced Micro Devices (AMD) and Intel x86 CPUs available at the time. The technologies behind their respective designs are similar, but they have significant differences as well as various advanced features that are better suited to some applications over others. We tested the performance (time to solution) scaling as a function of the number of cores used during the calculation for each architecture using the multi-threaded BWA program, which is the software responsible for initially generating the aligned genome sequence. We found that BWA exhibits close to linear scaling of the throughput rate with the number of threads up to 32 cores as shown in Figure 4a. In addition, a considerable reduction is achieved by Intel Gold in both the single-core execution time and the number of core-hours required for the DNA alignment. Specifically, the Intel Xeon Gold offers a speedup of over 2x over AMD on a single core, and about 25% average performance improvement over the Intel “Haswell” Xeon E5. Perhaps most importantly, a whole Gold node offers over 2x speedup over a whole Haswell node for the BWA alignment, which allows for the design of a system with a more efficient, moderate number of cores to achieve superior performance, faster turnaround, and higher total throughput out of the node.
Figure 4a.

BWA and 4b STAR benchmarking
In the RNA pipeline shown in Figure 1, approximately 85% of the wall time of the pipeline is the secondary alignment step. This process can be accomplished with different utilities such as Tophat, Bowtie, and STAR. With STAR as the most frequently utilized (> 150,000 times loaded) on Minerva, we performed the RNA alignment with the multi-threaded STAR program on the same three architectures as above, and results are shown in Figure 4b. Similarly, Intel Xeon Gold offers greater than twofold speedup over AMD on a single core, and about 30% performance improvement over the Intel Haswell Xeon E5. This means that 1 core hour on Gold is equivalent to more than 2 to ~4 core hours on the current AMD chip, and about 1.5 core hours on the previous Minerva chip. Additionally, STAR exhibits good linear scaling of the throughput rate with the number of threads, and only starts to lose some performance for larger processors, for example, about 20% of per thread mapping speed when the number of threads is further doubled (i.e., increased from 16 to 32 on the AMD processor). We selected the Intel Gold processor architecture (eventually receiving the more modem Platinum) with 24 or more cores per node as best suiting the needs of the genomics pipelines in 2018. Both of the DNA and RNA pipelines have been executing efficiently with this configuration in 2019, and specifically provide both the fastest time to solution for a single task and the greatest throughput out of the node for our workload.
Although the MPI-based molecular dynamic simulation applications comprise a smaller part of the job mix, we chose to keep the processors throughout the machine to be the same, so that we have the greatest flexibility in scheduling all of the biomedical jobs on all of the nodes. We also added 12 nodes with 4X V100 GPUs each to accelerate some of the structural and chemical biology and machine learning codes, which comprise a small but growing segment of our applications.
C. Scheduling Job Mix and Queue Structure
Queue structure and scheduling policies are a throttle for jobs. The nature of the genomic workload is bursty, with 10,000-20,000 jobs submitted to the queue per user at a time. This means that we sometimes have two million jobs waiting to run at a time. Rarely, we have had up to five million jobs in the queue. We selected IBM’s Platform Load Sharing Facility (LSF) because it can handle the large number of jobs in the queue at a time [1].
Since the majority of our jobs are single or low-core count jobs as shown in Figure 5, we schedule Minerva’s jobs on a per core basis rather than by node. This is different from how most HPC systems are scheduled, with only one job allowed per node. Researchers can still request the entire node on Minerva, but packing multiple single- and low-core count jobs into a node is obviously a more efficient use of the computational resources.
Figure 5.

Minerva job mix
We continually analyze job statistics and request and receive guidance from our advisory committee and users in an effort to improve our queue structure and incentive system to optimize overall job throughput. The evolution in job run time statistics is shown in Table 4. Over time, we have implemented many incarnations of the queue structure, with the intent of maximizing throughput and maximizing flexibility for researchers to determine the urgency of their jobs. We have structured our queues to enable users to select their own job priority, from premium (2x charge to their allocation, 6 days) to low (zero charge to their allocation, 6 days) if they have time-independent jobs and choose a low-priority queue, and a premium fee for their jobs to run “next”. With this scheme, we have effectively “reserved” the machine for the most urgent jobs and reward researchers for selecting to run at a lower priority. Since we have a large quantity of short-running jobs, we have an express queue with dedicated nodes to help expedite these jobs, to prevent them from waiting behind longer-running jobs. We also have an interactive queue with a 12 hour maximum time limit and a GPU queue with a 6 day maximum time limit, a queue for private nodes that is unlimited and a long queue for two weeks that is limited to four nodes.
D. File System
For Minerva, we focused on parallel file systems because NFS and other file systems simply cannot scale to the number of nodes or provide performance for the sheer number of files that the genomics workload entails. We originally selected GPFS over Lustre because it has advantages that are specifically useful for this workload such as parallel metadata, tiered storage, and sub-block allocation. Metadata is the information about the data in the file system. Each file has a piece of metadata stored somewhere within the file system that specifies the location, name, and other attributes for the file so it can be retrieved later. Whenever a user requests a file to read or write, an additional operation must first be performed on the metadata to locate the file. If the workload is I/O intensive and the metadata server is not well sized or designed, it can become a bottleneck for the entire file system’s performance [1]. For our workload, the ability to recall and traverse files quickly is key. As shown in Table 4, the majority of our files are tiny. Having a parallel metadata server that can distribute, access, and serve the file information across many parallel disk arrays at once is critical to efficient computing for our users.
Also critical to our workload is the ability to store files directly in metadata itself. This saves the additional lookup time of finding the file on disk, and also saves disk space. GPFS allows inodes to be up to 4 kilobyte in size, which is large enough to store many of our files.
Sub-block allocation is the ability of the file system to give a small chunk of space to small files and many small or large chunks of space to larger files. In some file systems, there is a large minimum space that a file may take. Often file systems will make the minimum size, 1 MB. On such a system, a file that takes up 1/10th MB would still consume 1 MB of space. After analysis of our existing file use patterns on Minerva, we found that >80% of our files are less than 1 MB. Sub-block allocations allows small files to take small amounts of space, while still allowing large files to allocate the entire block for efficiency. Without GPFS in our workload, much more disk space would be wasted.
The advantages of using GPFS and GPFS Native Raid (GNR) lie in the “declustered” RAID6 (8+2P) that uses arbitrarily-sized disk arrays, while also reducing the overhead to clients when recovering from disk failures. To accomplish this, the user data, redundancy information, and spare storage are spread across all of the disks in a declustered array, rather than in a fixed size on specific disks. GPFS also has sophisticated file placement policies, quotas, and security features that enable only associated groups to create and modify data in project directories. This system allows for file migration policies based on GPFS pools, so projects can be seamlessly migrated to the newer disks without any downtime or impact to users. We have used this feature extensively, migrating over 6 PB of data to different storage pools and underlying storage since 2015.
Although most of our jobs are not tightly coupled or use MPI, a high-bandwidth, low-latency network is still necessary to serve the file system to the nodes. We are currently using Infiniband HDR100 (100 Gb/s) as the interconnect between the nodes and storage to provide the necessary throughput.
As shown in Table 4, our online, fast storage requirements have grown at the rate of over a petabyte a year. The only dip in usage was in the middle of 2017, after the implementation of a chargeback fee and major push of files to archival storage because we had run out of storage space. These data argued for a massive increase in online storage for an upgraded Minerva.
In 2019, we planned to incorporate the DSS into the existing GPFS file system as a new storage pool, and leverage the existing flash storage serving the ESSs and the DDNs. However in 2019, IBM did not support a mixed vendor solution. With the enormous number of tiny files in our workload, along with a small team of six staff, it was impractical to pursue a path of mixing storage from different vendors. We worked with Lenovo to add flash storage to hold the metadata for this new DSS GPFS file system. We migrated the files from the DDN and ESS BE pools to the DSS pool using Active File Management (AFM), so users would not have to spend time transferring files. We then mounted the new DSS GPFS on all of the compute nodes.
E. Archival Storage
Only files stored in NFS are automatically backed up, and any files that a researcher wants to save must be moved to archival storage. TSM encrypts and saves copies of data on tape to two geographically disparate locations for disaster recovery. The TSM archive system consists of a server node with 49 TB disk cache, an IBM 3584 tape library with an extended frame, for a total of 12 LTO5 tape drives and 690 tape cartridges slots. As we have 9,726 total tapes, most are kept on shelves outside the library. The TSM server node is connected to Minerva via two 10 Gb/s Ethernet and to the tape library via 8 GB/s Fiber Channel. Operators perform daily tasks including loading/unloading tapes and sending/retrieving tapes to/from offsite. Currently, we have a total 9 PB of unique data with 873,222,126 files, for a total of 18 PB data (two copies of tape). In 2019, 106 users invoked TSM commands 23,065 times, with 63 users retrieving files 7,910 times, and 7.5% of the data being recalled. Tapes are automatically kept for six years, with longer periods possible in accordance with project-specific requirements.
F. Cloud Technologies
Every year we ask our users to complete a four-question survey, with the first three questions on their satisfaction with our systems, policies and support. The last question is open-ended, collecting any comments and suggestions. All feedback is saved anonymously. 63 users responded to last year’s formal survey, and we received direct feedback from informal conversations with users. Users were highly satisfied with our overall queue structure and management of the compute and storage resources as well as software environment and our operations (documentation, ticketing system, responsiveness of the staff). But, as the number of users and computational and data workload increased after the 2017 survey, we received comments about shortage of computing resources (crowded queues) and storage as well as a request for support of containers, virtual machines, and other cloud technologies. As a result, we deployed Singularity [20]. Singularity provides an advantage over Docker by automatically providing volume (GPFS or NFS) mounts and mapping all user privileges in a secure environment. The use of containers is not for performance, but it is useful as a blueprint for reproducibility and portability. Since deployment, users have been leveraging a full stack of ready-to-use containers from the Broad Institute for genomic pipelines and others for use with deep learning. Singularity has enabled users to provision the infrastructure and pull desired containers without any requirements for administrative and privileged access. In one year, about 2% of our users are now regularly computing with Singularity. We also provide Apache Spark-based technologies via GPFS’s Hadoop for those who would like to leverage this technology [21]. GPFS’s Hadoop solution does not need a dedicated installation or additional licensing, and it can reuse the existing GPFS file system and still support the Spark API.
G. Cloud Costs
To ensure that our plans for an upgraded machine in 2019 were cost-effective, we compared our costs with Amazon Web Services (AWS) and Microsoft Azure. We estimated the costs using our actual compute core hours and storage used by researchers on Minerva for the preceding three years (~73% of the total available compute core hours) and 50% of the total available storage over that same period, as a minimal baseline.
To make the most careful comparison between the services, we chose cloud compute instances with the same or slower configurations than Minerva. Although AWS compute cycles can be cost-effective with the “spot” pricing option, it is unpredictable as to when a desired price will be available, as this market fluctuates. This option is only suitable for researchers who have jobs that are time-flexible and interruption-tolerant. Therefore, we only priced out “reserved” instances, as our researchers need dependable, regularly available cycles to get their work done. AWS’s three-year reservation option with upfront payment offers a significant discounted hourly rate (up to 75%) compared to on-demand pricing, but there is no refund if you do not use all of the reserved cycles. We selected this option for the comparison, as we know there will be always be computing needed. For simplicity, we did not include any of the AWS or Azure costs for file operations, file synchronization, data transfers, or archival storage as it is difficult to predict exactly how much data will be affected. We used the pricing for throughput-optimized HDD (st1) from AWS and Azure Files from Azure. We found that 70-90% of the total cloud cost was for storage.
We also did not include any staff time or software expenses in our estimates since these costs are independent of remote cloud usage. We found the cloud costs to be approximately three times higher than the cost of hosting the infastructure ourselves. At our scale of computing and storage usage, the cloud is cost-prohibitive if remote cloud vendors are utilized.
H. Sustainability
Sinai measures sustainability primarily in two ways: (1) enhancement of its reputation through publications and community engagement, and (2) the development and maintenance of a renewable budget that does not rely chiefly on funds from Sinai to support its activities over time. These two factors help to assess the efficacy and return on investment for core facilities. Non-financial benefits of computing investments by research institutions can also be quantified [22].
As shown in Table 5, Minerva and our team have facilitiated over 900 publications in the last seven years. Twice a year we request that the research community notify us about the publications that Minera has enabled. About half of all active projects respond to our request.
Table 5.
Minerva-enabled publications over time
| Year | # of pubs |
|---|---|
| 2012 | 54 |
| 2013 | 59 |
| 2014 | 64 |
| 2015 | 121 |
| 2016 | 151 |
| 2017 | 171 |
| 2018 | 152 |
| 2019 | 176 |
| Total | 948 |
To ensure the lifetime of financial support for Minerva and our team, we utilize a chargeback scheme to ensure sustainability. The funds for our operating budget is dervived from two-thirds from facilities and Administration (F&A) fees as a result of NIH-funded grants. The remaining one-third is passed on to our researchers, who largely pay for this amount from their NIH awards. Because storage has been our most scarce resource, we worked with our Finance and Compliance departments to develop a fee-for-storage based on the one-third not covered by F&A. Initially we developed and implemented a model based on compute core hours, but since core hours were not in contention, and jobs submitted to the lowest priority queue were not charged, we found this model not effective at balancing the usage on the system or collecting fees.
This storage fee is currently $109 per terabyte per year in 2019, and includes access to compute cycles, GPUs, large shared memory nodes, and archival storage. Users are only billed for their actual usage. We do not invoice for amounts less than 1 terabyte nor require allocations for running at the lowest possible priority, thus ensuring basic access for graduate students, new faculty and unfunded experimentation. The fee is re-calculated yearly by Finance and Compliance, in accordance with our actual costs of maintaining and supporting the system. When the fee was implemented, many users moved data they were not actively using to archival storage and/or deleted files, which helped free storage space for all users and reduce overall contention for storage. PIs are sent a monthly report showing their group’s usage along with the cost. We invoice twice a year, and if invoices are not paid within 30 days we lock their files and then lock all accounts associated with the project in 60 days and notify the department chair and associated dean. In some cases, departments or institutes will cover the invoices. Interestingly, our advisory board did not support extensions or exceptions to this policy. The advisory board recognized that peer pressure is an effective way approach for collecting funds. With these actions, we recover approximately 90% of our actual costs, making this a sustainable financial model for Sinai.
IV. Future Work
Plans for 2020 include new capabilities including the implementation of Rstudio Connect to enable users to publish their R and Python work and share Shiny applications, R Markdown reports and Jupyter Notebooks. We also will setup Open OnDemand for better web and visualization access to Minerva. We are close to satisfying Sinai’s interpretation of the Health Insurance Portability and Accountability Act (HIPAA) on Minerva. With Sinai’s approval, Minerva will be able to hold Protected Health Information (PHI), which will facilitate new applications such as feature extraction from identified radiological images and machine learning on raw Electronic Health Record (EHR) data. Currently, all users must agree not to place PHI on Minerva before they can get an account. We have taken the initial steps towards creating a data commons that will hold phenotypic and genotypic information from publicly available data sets in addition to also Sinai-specific ones. This computational and data biomedical ecosystem will simplify the incorporation of multi-modal data for big data analyses.
V. Conclusions
In summary, we have employed strategies to characterize and understand our usage and growth for biomedical applications over the last seven years. Our analysis of these data enabled us to optimize scheduling, compute, memory, parallel file systems, cloud technologies to add new capabilities and capacity for our changing and expanding workload. We have implemented approaches to make our efforts sustainable, cost-effective and with a high return on investment for our institution and our computational biomedical community.
Acknowledgments
Research reported in this paper was supported by the Office of Research Infrastructure of the National Institutes of Health under award numbers S10OD018522 and S10OD026880. The content is solely the responsibility of the authors and does not necessarily represent the official views of the National Institutes of Health.
Contributor Information
Patricia Kovatch, Genetics and Genomic Sciences, Icahn School of Medicine at Mount Sinai, New York, USA.
Lili Gai, Office of the Dean, Icahn School of Medicine at Mount Sinai, New York, USA.
Hyung Min Cho, Office of the Dean, Icahn School of Medicine at Mount Sinai, New York, USA.
Eugene Fluder, Office of the Dean, Icahn School of Medicine at Mount Sinai, New York, USA.
Dansha Jiang, Office of the Dean, Icahn School of Medicine at Mount Sinai, New York, USA.
References
- [1].Kovatch P, Costa A, Giles Z, Fluder E, Cho H, and Mazurkova S, Big Omic Data Experience, SC’15: Proceedings of the International Conference for High Performance Computing, Networking, Storage and Analysis, November 2015. [DOI] [PMC free article] [PubMed] [Google Scholar]
- [2].Hodes R, Buckholtz N, Accelerating Medicines Parnership: Alzheimer’s Disease (AMP-AD) Knowledge Portal Aids Alzheimer’s Drug Discovery through Open Data Sharing, Expert Opinion on Therapeutic Targets, 20:3, 389–391. [DOI] [PubMed] [Google Scholar]
- [3].Buxbaum J, Daly M et al. , The Autism Sequencing Consortium: Large-Scale, High-Throughput Sequencing in Autism Spectrum Disorders, Neuron, Volume 76, Issue 6, 20 December 2012, pages 1052–1056. [DOI] [PMC free article] [PubMed] [Google Scholar]
- [4].Hoffman GE, Bendl J, Voloudakis G et al. CommonMind Consortium provides transcriptomic and epigenomic data for Schizophrenia and Bipolar Disorder. Sci Data 2019;6:180. [DOI] [PMC free article] [PubMed] [Google Scholar]
- [5].Keenan A, Jenkins S, Jagodik K et al. , The Library of Integrated Network-Based Cellular Signatures NIH Program: System-Level Cataloging of Human Response to Perturbations, Cell Systems, Volume 6, Issue 1, 24 January 2018, pages 13–24. [DOI] [PMC free article] [PubMed] [Google Scholar]
- [6].Gelb B, Brueckner M, et al. , The Congenital Heart Disease Genetic Network Study, Circulatio Research, Volume 112, Number 4, 15 February 2013. [DOI] [PMC free article] [PubMed] [Google Scholar]
- [7].Bonkovsky H, Maddukuri V, Yazici C et al. , Acute Porphyrias in the USA: Features of 108 Subjects from Porphyrias Consortium, The American Journal of Medicine, Volume 127, Issue 12, December 2014, pages 1233–1241. [DOI] [PMC free article] [PubMed] [Google Scholar]
- [8].Akbarian S, Liu C, Knowles J et al. The PsychENCODE project. Nat Neurosci 2015;18:1707–1712 (2015). [DOI] [PMC free article] [PubMed] [Google Scholar]
- [9].Visscher P, Wray N, Zhang Q, Sklar P, McCarthy M, Brown M, Yang J, 10 Years of GWAS Discovery: Biology, Function, and Translation, American Journal of Human Genetics, Volume 101, Issue 1, 6 July 2017, pages 5–22. [DOI] [PMC free article] [PubMed] [Google Scholar]
- [10].Berger S, Iyengar R, Role of systems pharmacology in understanding drug events, WIREs Systtems Biology and Medicine, Volume 3, Issue 2 Mar-Apr 2011, pages 129–135. [DOI] [PMC free article] [PubMed] [Google Scholar]
- [11].Wilkinson MD, Dumontier M, Aalbersberg IJ, et al. The FAIR Guiding Principles for scientific data management and stewardship [published correction appears in Sci Data. 2019 Mar 19;6(1):6]. Sci Data. 2016;3:160018 Published 2016 March 15. doi: 10.1038/sdata.2016.18. [DOI] [PMC free article] [PubMed] [Google Scholar]
- [12].Van de Auwera G et al. , From FastQ Data to High-Confidence Variant Calls: The Genome Analysis Toolkit Best Practices Pipeline. Current Protocols in Bioinformatics. 43:11.10.1–11.10.33. [DOI] [PMC free article] [PubMed] [Google Scholar]
- [13].Purcell S et al. , PLINK: A Tool Set or Whole-Genome Association nd Popultion-Based Linkage Analyses. American Journal of Human Genetics, Volume 81, Issue 3, September 2007, pages 559–575. [DOI] [PMC free article] [PubMed] [Google Scholar]
- [14].Al-Ali R, Kathiresan N, El Anbari M, Schendel E, Abu Zaid T, Workflow optimization of performance and quality of service for bioinformatics application in high performance computing. J Computat Sci 2016;15:3–10. [Google Scholar]
- [15].Godhandaraman T, Pruthviraj N, Praveenkumar V, Banuprasad A and Karthick K, Big data in genomics. 2017 International Conference on Algorithms, Methodology, Models and Applications in Emerging Technologies. [Google Scholar]
- [16].Kathiresan N, Al-Ali R, Jithesh PV, AbuZaid T, Temanni T and Ptitsy A, Optimization of data-intensive next generation sequencing in high performance computing. 2015 IEEE 15th International Conference on Bioinformatics and Bioengineering. [Google Scholar]
- [17].Bumgardner VKC, Marek V, Hickey CD and Nandakumar K, Constellation: A secure self-optimizing framework for genomic progressing. 2016 IEEE 18th International Conference on e-Health Networking, Applications and Services. [Google Scholar]
- [18].Yeo H and Crawford CH. Big Data: Cloud computing in genomics applications. 2015 IEEE International Conference on Big Data. [Google Scholar]
- [19].Li H, Durbin R, Fast and accurate short read alignment with Burrows–Wheeler transform, Bioinformatics, Volume 25, Issue 14, 15 July 2009, Pages 1754–1760. [DOI] [PMC free article] [PubMed] [Google Scholar]
- [20].Kurtzer GM, Sochat V, Bauer MW (2017) Singularity: Scientific containers for mobility of compute. PLoS ONE 12(5): e0177459. [DOI] [PMC free article] [PubMed] [Google Scholar]
- [21].Li X, Tan G, Zhang C, Li X, Zhang Z and Sun N, Accelerating large-scale genomic analysis with Spark. 2016 IEEE International Conference on Bioinformatics and Biomedicine. [Google Scholar]
- [22].Stewart C, Apon A, et al. , Assessment of non-financial returns on cyberinfrastructure: A survey of current methods. In Proceedings of the Humans in the Loop: Enabling and Facilitating Research on Cloud Coputing (HARC ’9) Association for Computing Machinery, New York, NY, USA, Article 2, 1–10. [Google Scholar]