Abstract
For more than a decade, living cells and biomaterials (typically hydrogels) are printed via laser-assisted bioprinting. Often, a thin metal layer is applied as laser-absorbing material called dynamic release layer (DRL). This layer is vaporized by focused laser pulses generating vapor pressure that propels forward a coated biomaterial. Different lasers with laser wavelengths from 193 to 1064 nanometer have been used. As a metal DRL gold, silver, or titanium layers have been used. The applied laser pulse durations were usually in the nanosecond range from 1 to 30 ns. In addition, some studies with femtosecond lasers have been published. However, there are no studies on the effect of all these lasers parameters on bioprinting with a metal DRL, and on comparing different wavelengths and pulse durations – except one study comparing 500 femtosecond pulses with 15 ns pulses. In this paper, the effects of laser wavelength (355, 532, and 1064 nm) and laser pulse duration (in the range of 8 to 200 ns) are investigated. Furthermore, the effects of laser pulse energy, intensity, and focal spot size are studied. The printed droplet volume, hydrogel jet velocity, and cell viability are analyzed.
Keywords: bioprinting, laser-assisted bioprinting, laser-induced forward transfer, laser absorption layer, laser parametric study
1. Introduction
Printing of proteins, living cells and tissue is a rapidly growing scientific field. Different printing techniques are applied, mainly extrusion techniques (also called robotic dispensing or syringe based techniques), ink-jet printing, and laserassisted bioprinting (also called biological laser printing, laser-induced forward transfer, or matrix-assisted pulsed laser evaporation direct-write (MAPLE-DW)).
For laser-assisted bioprinting (LaBP), a transparent substrate is usually coated with a thin layer of laserabsorbing material and a second thicker layer of biomaterial, typically a hydrogel with embedded cells, to be printed. Laser pulses are focused into the laserabsorbing layer, sometimes called Dynamic-Release-Layer (DRL), which is vaporized in the focal region, generating a vapor bubble (Figure 1). This bubble expands by vapor pressure and propels the adjacent biomaterial forward, which then is deposited as a droplet at a predefined position on a collector slide.
Figure 1.
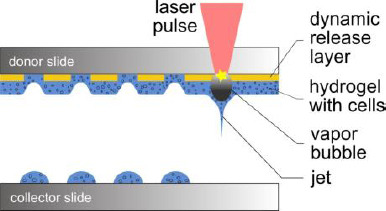
Schematic sketch of the laser-assisted bioprinting technique. The donor slide is coated with a thin laser-absorbing layer and a thicker layer of biomaterial to be transferred, usually a hydrogel with embedded cells. Laser pulses are focused through the donor glass slide into the absorbing layer. The evaporation of this layer in the laser-focused region generates a high vapor pressure that propels the biomaterial underneath towards the collector slide.
As a variant, some groups apply laser printing without dynamic-release layer. Therefore, they use hydrogel (with embedded cells) as the laser-absorbing material; a small part of it is vaporized thereby. Sometimes, they mix the hydrogel with a laser-absorbing material, a matrix material with a high absorption coefficient at the applied laser wavelength, which thereby will also become part of the printed structure. However, DRLs are assumed to enable a printing more softly and gently for the cells with a higher cell vitality after printing.
Several groups in the world have developed self-constructed laser bioprinting setups with different pulsed laser systems. Laser parameters vary in a wide range of wavelengths, pulse durations, pulse energies, and focal spot sizes. For the printing process, lasers with different wavelengths from 193 to 1064 nanometers and different laser pulse durations, mainly in the nanosecond range, are applied (Figure 2). They are combined with different DRL materials, including metals (gold, silver, or titanium), polymers (triazene, polyethylene naphthalate, polyimide, or cyanoacrylate), or hydrogels (gelatin). Most groups using LaBP for printing biomaterials apply ultraviolet (UV) lasers with 3 to 30 nanoseconds pulse durations and 193- nm[1,2], 248-nm[3,4], 266-nm[5], 337-nm[6], or 355-nm [7,8] wavelengths.
Figure 2.
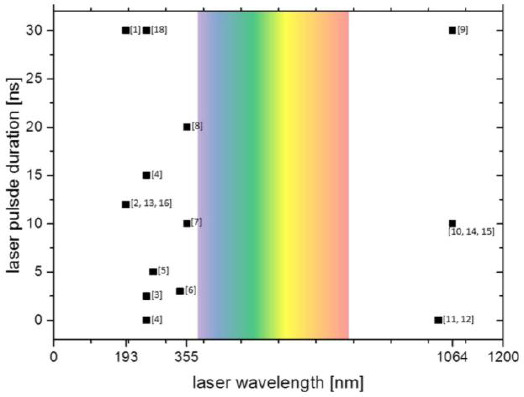
Chart of the laser wavelengths and pulse durations applied for laser-assisted bioprinting by different groups. Numbers in brackets refer to references. Typically, ultraviolet lasers and also some infrared lasers are used, but not lasers in the visible range (ca. 380-780 nm, colored background). Most common are pulse durations in the nanosecond range, but also experiments with femtosecond lasers have been conducted. Nanosecond lasers are usually preferred for their compactness and relatively simple maintenance and low costs.
Alternatively, near-infrared (NIR) lasers with 10 or 30 nanoseconds of pulse duration and 1064-nm[9,10] wavelength are used in combination with metal DRLs (usually gold). Also femtosecond lasers were applied. Duocastella et al.[11] printed a glycerol-water blend using laser with 1027-nm wavelength and 450-fs pulse duration. Desrus et al.[12] printed cell medium and a glycerol-water blend, as well as keratinocytes with cell medium using 1030-nm laser wavelength, and 350-fs and 800-fs pulse durations. Due to the high electro-magnetic forces in the laser focus, these ultra-short pulse lasers are able to induce laser-absorbing plasma in water or hydrogels. Therefore, with laser pulse energy high enough, applying a DRL is not necessary[12].
In spite of this wide range of applied laser parameters, so far, their impact on the transfer process has hardly been analyzed in direct comparison–with the exception of laser pulse energy, laser pulse intensity, and the focal spot size. There is one publication, in which Dinca et al.[4] utilized laser-printed proteins and DNA with 500 femtoseconds of pulse duration at 248-nm wavelength and compared the results with those achieved with 15-ns pulse duration.
To narrow this knowledge gap, we studied the dependences of printed droplet volume and cell survival rate on laser wavelength, pulse duration, pulse power, and laser intensity in the focal spot. We applied two different lasers, a Nd:YAG laser with three different wavelengths (1064 nm, 532 nm, and 355 nm) and a Yb:YAG laser with the pulse durations in the range of 8 to 200 nanoseconds at 1064-nm wavelength.
The effect of laser parameters on the printing process depends on the applied laser-absorbing material. Different materials have individual advantages and disadvantages. If no DRL is applied, the process is (strongly) dependent on the optical properties of the matrix material at the applied wavelength; furthermore, cells near to the substrate might be harmed by laser radiation. Metals are good laser-absorbing materials and offer good wettability, enabling a homogeneous distribution of hydrogel layers. However, during laser printing, some metal debris are also transferred into the printed construct which is undesired for printed tissue, even when gold and titanium are inert and bio- compatible materials.
Polymers as DRLs are hypothesized to be transformed completely into gaseous phase by laser-induced photo-chemical reactions; however, actually also some polymer debris become part of the printed structure. Even if they are nontoxic, they may have an impact on the cell behavior. Additionally, due to our experience, the distribution of hydrogel layers on some polymers is not as homogeneous and reproducible as on metals such as gold.
Alternatively, Schiele et al.[2] used gelatin as a DRL for LaBP at 193-nm laser wavelength. Gelatin is free of growth factors and matrix components that may influence cell behavior. However, the gelatin melted within one hour after printing at 37 °C. This is the typical temperature in human bodies and cell culture. Thus, it is not quite clear if this technique is suitable for 3-D printing, since cell-containing 3-D printed objects would possibly melt before cells could establish intercellular connections to maintain the 3-D cell pattern.
Other groups also applied an absorption layer system that is not completely evaporated, but experience a bulging effect. Lin et al.[13] used cyanoacrylate to glue brass foil on a quartz substrate; then they spread cells in medium on the foil. Laser pulses evaporated the cyanoacrylate and the generated bubble rapidly bulged the foil. The cell-medium compound was accelerated thereby and formed a jet. Brown et al.[8] used a 7-μm thick layer of polyimide, which was only partially evaporated near the quartz substrate as a confined pocket of gas. The vapor pressure forced the remaining polyimide layer away from the glass as a rapidly expanding blister. Thereby, the polyimide surface remains intact. This bulging or blister effect avoids the contamination of the printed structure with debris. So far, only low-viscosity liquids have been printed and it is not quite clear if also small droplets of hydrogels with higher viscosities can be printed by this way.
In this study, a metal layer is used, since it can be evaporated with all laser wavelengths, while polymer layers usually require UV wavelength below 400 nm. As DRL, we apply 60-nm thick layers of gold sputter-coated onto glass slides.
2. Material and Methods
2.1 The Printing Process and Setup
The laser printing device, in general, consists of the pulsed laser source and two horizontal co-planar glass slides (the upper one hereinafter is called the “donor slide” and the lower one is called the “collector slide”). The distance between the two slides is usually set to about 1 millimeter. The donor slide is coated underneath with a thin layer of laser-absorbing material and a thicker layer of biomaterial to be printed, which can be a hydrogel with embedded cells. Laser pulses are focused through the donor slide on the interface between the donor slide and absorption layer. This layer is evaporated in the focal spot, generating a vapor bubble, which rapidly expands. After a few microseconds, the bubble reaches its peak volume expansion and starts re-collapsing. Due to inertia, the accelerated hydrogel continues its motion and flows as a jet towards the collector slide (Figure 1).
The laser focal spot can be moved in x/y direction in the interfacial area between the donor slide and absorption layer. Furthermore, the glass slides can be moved relatively to each other. Thus, any pre-defined two-dimensional pattern and also three-dimensional patterns can be generated layer-by-layer. A more detailed description of the printing process and setup was given by Gruene et al.[14]
2.2 The Applied Lasers
Two pulsed lasers have been applied, a Ytterbium: YAG fiber laser (YLPM-1-A4-20-20, IPG Photonics Corp., Oxford, MA, USA) and a Neodym:YAG diode-pumped solid-state laser (Pulselas P-355-100-HP, Al- phalasGmbh, Gottingen, Germany). The Yb:YAG fiber laser offers 7 different pulse durations in the nanosecond range (8, 14, 20, 30, 50, 100, 200 ns) at a laser wavelength of 1064 nanometer. The repetition rate can be chosen in the range of 1.6 to 1000 kHz, and the maximum power is 20 watt. The maximum pulse energy depends on the pulse duration and repetition rate. The Nd:YAG laser offers three different wavelengths (1064 nm, 532 nm, 355 nm; fundamental wavelength, second, and third harmonics) at repetition rates in the range of 0.4 to 1 kHz. Laser parameters are listed in Table 1.
Table 1.
Parameters of the applied lasers
| Laser | Nd:YAG1 | Yb:YAG2 | ||
|---|---|---|---|---|
| Wavelength [nm] | 355 | 532 | 1064 | 1064 |
| Pulse duration [ns] | 0.5 | 0.52 | 0.75 | 8, 14, 20, 30, 50, 100, 200 |
| Max. pulse energy [μJ] | 8 | 17.5 | 85 | 200 |
PULSELAS-P-355-100-HP, AlphalasGmbh;
YLPM-1-A4-20-20, IPG Photonics Corporation
2.3 Cell Culture
For all cell experiments in this study, murine fibroblast cell line NIH-3T3 was used. Asa cell culture medium, Dulbecco’s Modified Eagle Medium/F12 supplemented with 10% fetal bovine serum and 1% penicillin/streptomycin (all from PAN Biotech, Aidenbach, Germany) was used and exchanged every third day.
2.4 Preparation of the Donor Layer System
For all presented printing experiments, 1-mm thick glass slides (26×26 mm2) were cleaned with acetone and lens cleaning tissue. The slides were coated with a 60-nm thick gold layer by sputter coating (208 HR, Cressington Scientific Instruments Ltd., Watford, England, UK) with argon. Thickness variation on one slide is low due to a planetary gear turning the glass slides while they are coated. The thickness of the coated layers was controlled with a thickness controller (MTM-20, Cressington Scientific Instruments Ltd., Watford, England, UK). All experiments were conducted with several donor slides with the same layer system to avoid that results are affected by one donor slide with potentially different layer thickness.
Onto this gold layer, a hydrogel layer, usually with embedded cells, was dispersed by blade coating. Here, a blend of 1 part 4 wt% alginate (Sigma-Aldrich), dissolved in a 0.15 M NaCl solution and sterilized by filtration with a 0.8-μm pore size filter, and 1 part EDTA blood plasma was applied. Cells were trypsinized, resuspended in a certain volume of cell medium, and counted with a hemocytometer. They were centrifuged at 500×g for 5 min and the supernatant was removed. The pellet, containing 1.5 million cells, was suspended in 45 μL of the alginate EDTA blood plasma blend. This hydrogel suspension was pipetted onto the gold-coated glass slide and dispersed on the gold surface with a blade coater to form a homogeneous layer of approximately 65-μm thickness.
2.5 Preparation of the Collector Slide
As collector slides, 1-mm thick glass slides (26×26 mm2) were cleaned in an ethanol bath and with acetone using lens cleaning tissue and sterilized by irradiating with UV-C light for 1 hour. For determination of the survival rates of printed cells, the collector slides were coated with 45 μL of 2 wt% alginate hydrogel. Primarily, this hydrogel layer prevents the dying of printed cells by drying-up, but it also cushions the impact of the laser printing process. For analyzing printed droplet sizes, uncoated glass slides were used.
2.6 Measuring Droplet Sizes
For measuring the sizes of printed droplets, the same alginate was always printed on uncoated glass surfaces. Therefore, there is a constant relation between the printed droplet diameter and volume. The volume can be calculated from the diameter by consideration of the contact angle. The contact angle of the applied alginate on glass was measured by the sessile drop method with contact angle measuring device OCA 40Micro (DataPhysics Instruments GmbH, Germany) to be 31° ± 4°. The volume of a spherical segment is Vdroplet = π/3.a3.(sinθ)-3-(1-cosθ)2 . (2+cosθ) with radius a of the contact area and contact angle θ. With the contact angle of 31° ± 4°, the volume of the alginate droplets on the glass surface is Vdroplet = (0.45±0.07).a3.
2.7 Characterization of Laser Pulses
The temporal pulse shapes were measured with a photodiode (DET210, ThorlabsGmbh, Dachau, Germany) with a rise time of one nanosecond and an oscilloscope (WaveRunner 62Xi, Teledyne LeCroy GmbH, Heidelberg, Germany). 1000 pulses were averaged for each measurement. The laser pulse energy was determined by measuring the laser power with a laser power meter (Powermax PM10 + Fieldmax II TOP, Coherent Europe BV, Utrecht, The Netherlands) and divided by the laser pulse repetition rate. Spatial pulse shapes were recorded with a beam profiler (Beamstar FX, OphirSpiricon Europe GmbH, Darmstadt, Germany).
2.8 Visualization of the Jetting and Measurement of Jet Velocity
The printing process and the material transfer by formation of a hydrogel jet for some hundred microseconds was visualized and surveyed with an microscopic setup developed in-house with a digital SLR camera (EOS 450D, Canon, Krefeld, Germany), stroboscopic illumination with a flashlamp (Nanolite KL-M, High-Speed Photo-System, Wedel, Germany) with 11 nanoseconds flash duration, and microscope objective (M Plan Apo NIR 20x, Mitutoyo, Neuss, Germany). A full description of this setup has been published before[15].
2.9 Determination of the Survival Rate
The survival rate of printed cells was determined by rinsing most cells from the donor and collector slides separately after printing, staining the dead cells with Trypan Blue, and counting all cells and dead cells within a hemocytometer. The survival rate was calculated as the percentage of vital cells from the collector slide divided by the percentage of vital cells from the donor slide. Cell survival rates were determined for printing with both, the Yb: YAG laser (at 1064-nm wavelength with 8- and 200-ns pulse duration) and the Nd:YAG laser (wavelength/pulse duration: 1064 nm/750 ps; 532 nm/523 ps; 355 nm/500 ps). The laser pulse energy was adjusted to print about 50% of the cells from the donor to the collector slide.
2.10 Determination of Cell Viability after 24 hours
Cell membrane integrity of printed and non-printed NIH-3T3 cells was assessed by measuring the lactate dehydrogenase (LDH) leakage due to cell membrane damage into the culture medium. The amount of LDH released is proportional to the number of cells damaged or lysed. Briefly, cells were seeded at a density of 5×10⁴ cells/well in culture medium into a 24-well culture plate and incubated for 24 hours. Then, the culture medium was removed and the release of LDH into the supernatant was determined by the LDH activity assay according to the online protocol of OPS Diagnostics (Lebanon, NJ, USA). The absorbance was detected at 492-nm wavelength using a microplate reader (Tecan Infinite M200Pro and Tecan i-controlTM software, Crailsheim, Germany). Treatment of cells with 1% Triton-X100 served as a 100% positive control of cell damage. The results are given relative to the positive control, in percent. The metabolic activity of living and healthy cells after printing was assayed using Alamar Blue dye (Sigma-Aldrich, Deisenhofen, Germany). Viable cells are able to reduce resazurin (blue) into resorufin (pink) during a specific time span, providing a method for optical detection of cell metabolic activity. Briefly, 20 hours after cell seeding, Alamar Blue dye (resazurin 20 μg/mL culture medium) was added to the cells. After 4 hours of incubation, the absorbance of the solution was measured at 570 nm, with a reference wavelength of 600 nm on a microplate reader.
3. Results
3.1 Wavelength Variation
The dependence of the printed droplet size on laser wavelength and pulse energy was investigated. There are printing thresholds of 12 μJ at 1064-nm, 6 μJ at 532-nm, and 3 μJ at 355-nm wavelengths. Above the threshold, the printed droplet volume increases with the increasing pulse energy, as depicted in Figure 3. Applying laser pulses with 1064 nm wavelength at the laser pulse energy of 30 μJ a maximum droplet volume of about 2.4 ± 0.4 nL is reached. With further growing laser pulse energy the droplet volume increases only slightly. The same droplet volume can be printed with 532-nm wavelength at the lower laser pulse energy of 17.5 μJ but this droplet volume cannot be reached with 355-nm wavelength due to the limited laser pulse energy, below 8 μJ
Figure 3.
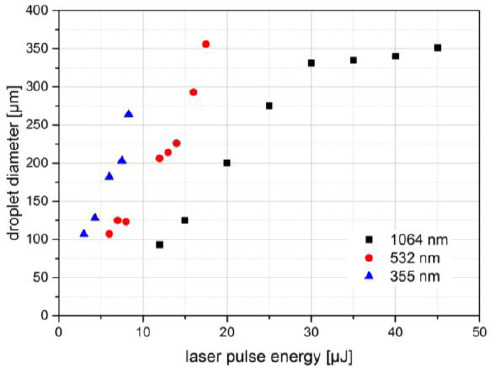
Printed droplet volume dependence on laser wavelength and pulse energy. The size of alginate droplets printed with three different wavelengths and different laser pulse energies. There is an upper droplet size limit (near 350-μm droplet diameter) depending on the hydrogel layer thickness as a limitation of available hydrogel. Since the laser maximum pulse energy for 355 nm (and 532 nm) is much smaller compared to 1064-nm wavelength, the upper droplet size limit has not been reached with 355 nm. Nevertheless, it can be concluded that the achievable droplet size is quite similar for all investigated wavelengths. With 1064 nm, a bit smaller droplets can be printed.
At the same laser pulse energy, but different wavelengths, the printed droplet diameter is about twice as big (the volume is about one order of magnitude higher) at wavelength 355 nm compared to 532 nm, and at 532 nm compared to 1064 nm. With 1064-nm wavelength, slightly smaller droplets can be printed.
Figure 4A depicts stroboscopic images with defined delay relative to the laser pulse impact for the three different wavelengths with different pulse energies of 20 μJ (1064 nm), 12 μJ (532 nm), and 8 μJ (355 nm), which resulted in the same printed droplet volumes (Figure 3). The images are very similar for all wavelengths; with 355-nm wavelength the jet duration is a bit shorter (about 400 μs), while the jet flows for about 500 μs at 532- and 1064-nm wavelengths.
Figure 4.
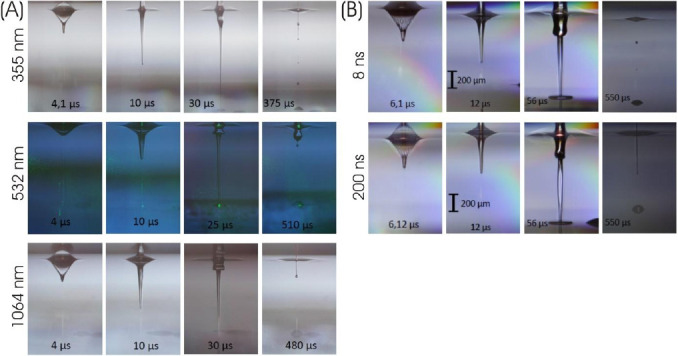
Visualization of the jet dynamics, induced by laser pulses with different (A) wavelengths and (B) pulse durations. Nanosecond stroboscopic illumination was applied to take images at defined delays with respect to the laser pulse impact. There is no substantial dependence of the jet dynamics for metal DRL on laser wavelengths or pulse durations. The process merely is a little bit faster for 355-nm (about 400 μs instead of approximately 500 μs) compared to 532- and 1064-nm wavelengths.
3.2 Pulse Duration Variation
For studying the influence of laser pulse duration on the printing process, it needs to be checked if other laser parameters are changed by varying the pulse duration. Besides the laser pulse energy, this may also affect temporal or spatial pulse shape. Figure 5A shows that the temporal shape of laser pulses is not a real flat top profile; the laser power slightly decreases during the pulse duration. However, the rising edge of laser pulses at all pulse durations is similar and longer pulses largely coincide with shorter one at the beginning. Furthermore, pulse energy variations do not substantially change the temporal pulse shape, as can be seen in Figure 5B for 200-ns pulses. Therefore, the pulse peak power is proportional to the pulse energy for given pulse duration (Figure 5C). The spatial profile of the laser pulse proves to be independent on the pulse duration, as shown for 8- and 200-ns pulses in Figure 5D.
Figure 5.
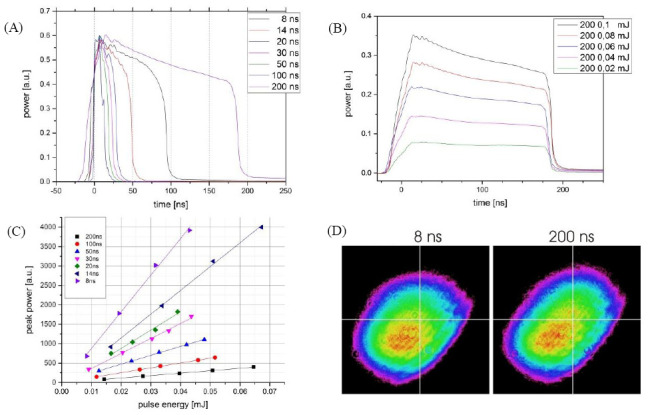
Laser pulse characteristics of the Yb:YAG laser with different:(a, d) pulse durations and (b, c) pulse energies. (A) Pulses with 8- to 200-ns time durations with similar peak power are measured and averaged over 1000 pulses with a photodiode and oscilloscope; (B) The temporal shape of the laser pulses (shown for 200-ns laser pulses) varies only slightly with pulse energies; (C) The relation between the pulse energy and peak power for different pulse durations is nearly proportional; (D) The transversal mode (spatial shape) of the laser pulses is nearly independent on pulse duration (shown for 8 and 200 ns).
Stroboscopic imaging of the printing process depicts that the process and its time scale is independent on different pulse durations from 8 ns to 200 ns (shown in Figure 4B) and also for 750 ps (Figure 4A).
3.3 Variation of the Biomaterial Layer Thickness at Fixed Laser Pulse Energies for Different Pulse Durations
The images in Figure 6A demonstrate that similar droplet volumes (a droplet diameter of 150 μm corresponds to a volume of 190 pL) can be achieved with all applied pulse durations (20 ns is not shown) at different pulse energies and peak powers. To investigate the interrelation between the laser pulse duration, laser pulse energy and biomaterial layer thickness, the laser pulse energies were chosen for 200- and 8-ns pulse durations to transfer the same droplet volume for 65- μm layer thickness (45-μL biomaterial volume). Further printing with these laser pulse energies using different increasing layer thicknesses was conducted. As can be seen in Figure 6B, with 80- and 95-μm thickness (55- and 65-μL biomaterial volume) the transferred droplets are quite similar for both pulse durations. However, with biomaterial layer thicknesses of 120 μm (80 μL) and 130 μm (90 μL), there are still many printed droplets with the shorter pulse duration, but only sporadic (80 (iL) or no droplets with 200-ns pulse duration.
Figure 6.
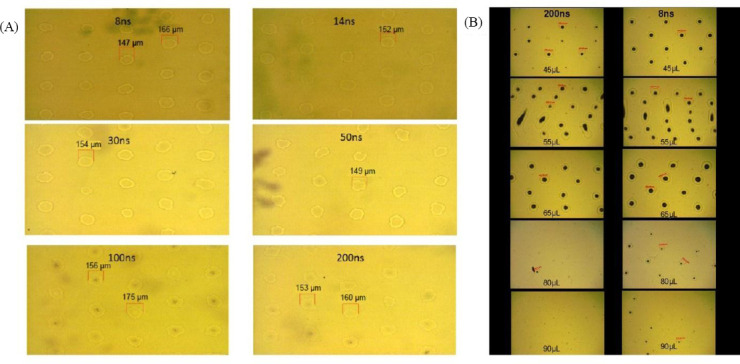
(A) Different combinations of pulse duration, energy, and peak power can result in similar printed droplet sizes; here, alginate droplets with about 150–160 μm diameter were printed with different pulse durations and adjusted energy. (B) Printing with different pulse durations (200 and 8 ns) and alginate layer thickness; the pulse energies were adjusted for similar printed droplet sizes at 65-μm layer thickness (45-μL alginate). Keeping these two pulse energies constant, printing with different layer thicknesses was tested. The printing result was similar for both pulse durations at 80-μm (55 μL) and 95-μm (65 μL) layer thickness. However, nearly no hydrogel was printed with 200-ns pulses at layer thickness above 115 μm (80 μL and 90 μL), while many droplets were printed with 8-ns pulses.
Furthermore, it has been studied whether or not long laser pulses still have an impact on the printing process after inducing generation of plasma and an expanding vapor bubble; probably, there could be a limitation in time for pumping the vapor bubble, thus the last part of a longer pulse has no further effect. Therefore, droplets were printed with the two longest pulse durations 200 and 100 ns at the same peak power. It turned out that even after 100 ns, the plasma still absorbs energy from the (200 ns) laser pulse that contributes to the material transfer. For the applied peak power in Figure 7, no biomaterial was printed with the 100-ns pulse, whereas droplets were printed with 200-ns pulses – although the shorter pulses induced plasma (and thereby a vapor bubble) as well.
Figure 7.

The effect of laser pulse duration at constant peak power. (A) Image of the donor slide after printing: There are eight holes in the gold layer indicating the focal spot position for 100-ns pulses (four smaller holes) and 200-ns pulses (four bigger holes). (B) Image of the collector slide. Four printed hydrogel droplets corresponding to the position of the 200-ns pulses can be seen but no hydrogel droplets printed with 100-ns pulses. (C) Alginate droplets were printed with 100- and 200-ns pulses with the same peak power and similar temporal shapes at the first 80 ns of the laser pulse.
The dependence of the printed droplet volume on pulse duration, pulse energy and peak power is shown in Figure 8. Droplets with the same volume can be printed with very different combinations of these laser parameters (depicted as lines). There is a linear dependency but not a proportionality of the laser pulse energy required to print a certain droplet volume and the pulse duration. The required energy Epulse can be described by the formula Epulse = E0 +m.τpulse Epulse with τpulse pulse being the pulse duration. Taken from Figure 8B, E0 is about 20 μJ and m is in the range of 150 to 300 Watt. Since the laser pulses peak power is proportional to the quotient of laser pulse energy and duration, the required peak power can be calculated as  . Entering the values 20 μJ for E0 and 150 to 300 Watt for m, the calculated peak power is in good agreement with Figure 8(C).
Figure 8.
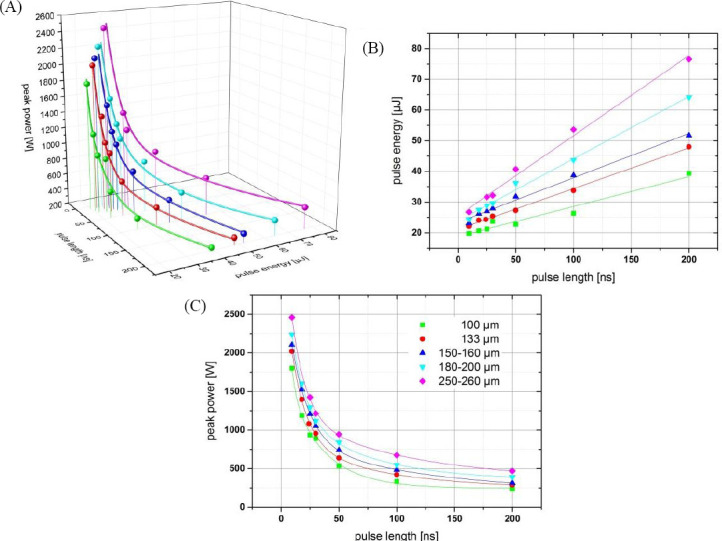
Dependence of the printed droplet size on laser pulse duration, pulse energy, and resulting peak power. Each color represents a different printed droplet size. The measured values are depicted as spheres; the lines represent curves fitted to the measured values. With increasing pulse duration, the required energy increases linear (but not proportional) and the required peak power decreases inversely.
3.4 Focal Spot Size Variation
Besides laser wavelength, pulse duration, energy, and peak power, the printing process might also be affected by the laser focal spot size. One aspect of the printing process, which is influenced by these parameters, is the velocity of the hydrogel jet that might affect the vitality of printed cells. Zhang et al.[16] demonstrated printing with jet velocities down to 10 m/s, while the jet velocities in our study have been about 50 m/s so far. Therefore, printing of alginate droplets with three different focal spot sizes (3000, 4000, and 7500 μm2) and the generated jet velocities have been investigated for different laser pulse energies (Figure 9A). As expected, the jet velocity increases with increasing laser pulse energy. The jet velocity is higher for smaller focal spot sizes at fixed laser pulse energy. More interestingly is the dependence of the jet velocity on the laser intensity (Figure 9B). At lower intensities, the jet velocity is independent or nearly independent on the focal spot size. By increasing the intensity, the jet velocities for the three different spot sizes separate. Above 1 J/cm2 the jet velocity at 7500-μm2 spot size is much higher than the velocities at 3000- or 4000-μm2 spot sizes, which are still nearly equal. Above 1.4 J/cm2 the jet velocity at 4000-μm2 spot size is also higher compared to the velocity at 3000-μm2 spot size.
Figure 9.
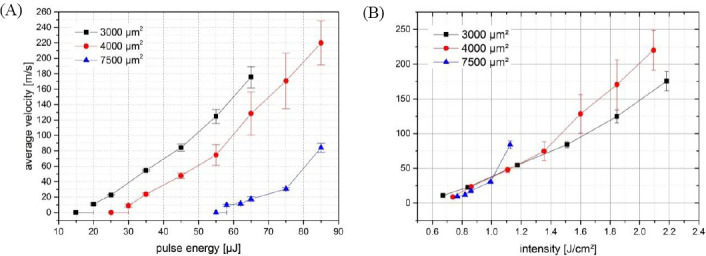
Dependence of the jet velocity on laser pulse energy and intensity. With three different focal spot sizes, the average jet velocity was observed at different pulse energies and intensities. For low energies (and intensities), the jet velocity depends only on the intensity and not on the pulse energy. With increasing intensity, however, pulse energy becomes more important and the jet velocity differs at equal intensity but different focal spot sizes and pulse energy.
3.5 Cell Survival Rates
The cell survival rates are listed in Figure 10A. They have been determined as 97 ± 1.5% (1064 nm wavelength/200 ns pulse duration), 95 ± 3.8% (1064 nm/ 8 ns), 93.5 ± 2.2% (1064 nm/750 ps), 95 ± 4.2% (532 nm/523 ps), and 96 ± 0.4% (355 nm/500 ps). There is no significant difference (p > 0.05) in the cell survival rate at different pulse durations and wavelengths.
Figure 10.
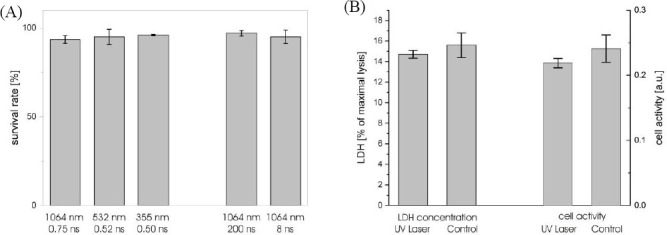
Vitality of fibroblast cells laser-printed with different wavelengths and pulse durations. The survival rate (A) was determined one hour after printing by counting vital and dead cells stained with Trypan Blue. The vitality after 24 hours was analyzed by measuring the amount of LDH (B) in the cell medium as a measure for dead cells and the transformation of Alamar Blue dye as a measure for the metabolic activity of living and healthy cells after printing.
To exclude cell damage by UV radiation that might not directly kill cells, additionally a lactate dehydrogenase (LDH) assay was conducted with cells embedded in alginate and printed at 355-nm wavelength, 500-ps pulse duration, and 8-μJ pulse energy. The enzyme LDH, found in most living cells, is released after cell damage. Thus, it can be used as a quantitative measure for cell damage. Therefore, after 24 hours the amount of LDH in the medium was measured. The results are shown in Figure 10B on the left side. No significant (p = 0.50) difference between the printed and control cells was detected. Additionally, the cell activity was investigated with Alamar Blue assay (Figure 10B, right side). There is also no significant difference (p = 0.34) in the cell activity between the cells printed with UV laser and control cells.
4. Discussion
To our knowledge, this is the first extensive study on the effect of different laser parameters on laser- assisted bioprinting of hydrogel and cells. Of course, the effect of laser pulse energy and focal geometry has been investigated before. Here we studied the role of laser wavelength, pulse duration (in the nanosecond regime), pulse energy, focal spot size, and laser intensity.
The aim of this study was to investigate the dependence of laser-assisted bioprinting on specific laser parameters and identify optimal parameters. To cover a broad range of different parameters, especially of different pulse durations and laser wavelengths, two different lasers were applied.
First, the influence of laser wavelength was studied with gold DRL. If the laser wavelength was varied at fixed pulse energy, there was a substantial effect on printed droplet volume. With shorter wavelengths, less energy was required to print a certain droplet volume. However, this effect can be compensated by adjusting the laser pulse energy. In combination with well- adapted laser pulse energy, the influence of laser wavelength turned out to be very small. At 1064-nm wavelength, droplets with slightly smaller volume could be printed, and at 355 nm, the jet duration was a bit shorter. Thus, applying a gold absorption layer, there is no evidence for an optimal laser wavelength.
Second, printing with different laser pulse durations was investigated. The volume of the printed droplet depends on both laser pulse energy and peak power. At least up to 200-ns pulse duration, the laser pulse still influences the printing process and laser pulse energy irradiating after more than 100 ns can contribute in inducing the jet dynamic.
To achieve the same droplet volumes with different pulse durations, the required energy increases linearly but not proportional with the pulse duration while the required peak power decreases with an inverse proportional part plus a constant minimum peak power.
At shorter pulse durations, the droplet volume increases faster with increasing laser pulse energy. Therefore, statistical variations of the laser pulse energy have a larger impact on the droplet volumes at shorter pulse durations, although the difference is not big. This indicates that a part of the energy of longer laser pulses (a bigger part compared to shorter laser pulses) is not transferred into kinetical energy of the printing process. It is probably transferred into thermal energy, since significant thermal conduction occurs within tens of nanoseconds[17].
A further important parameter for the printing process is the focusing geometry with the focal spot size determining the relation between the laser pulse energy and intensity. Here, we investigated to what extent the printing process is dependent on energy or intensity of the laser pulse. Therefore, the formation and velocity of the hydrogel jet were observed with the stroboscopic imaging system; in general, a low jet velocity stands for low shear forces. It turns out that for low intensities above the threshold for printing at about 0.7 J/cm2, the jet velocity is dependent only on laser pulse intensity and is independent on the focal spot size (at least above 3000 μm2). With increasing intensity the energy becomes a more relevant parameter. Since the droplet volume increases with the laser pulse energy, bigger droplets can be achieved without increasing shear forces. Therefore, the pulse energy has to be increased at constant intensity by increasing the focal spot size.
The influence of the investigated laser parameters, wavelength and pulse duration, on cell survival and vitality has also been studied. As can be seen in Figure 10, the cell survival rate is independent of the applied wavelengths. This might be different if no absorption layer is applied and wavelengths in the deep UV are used. However, studies of other groups demonstrated high survival rates also with such wavelengths.
5. Conclusion
The objective of this study was to investigate the existence of optimal laser parameters for the laser- assisted bioprinting technique and to identify these parameters if indicated. Since an optimum LaBP system should be equipped with a compact and relatively inexpensive laser system, this study is limited to the parameter range of Q-switched solid state lasers with nanosecond and sub-nanosecond pulse durations. Nanosecond lasers are also most commonly applied for laser-assisted bioprinting by other groups. In addition, some studies with femtosecond lasers have been published. However, there are no studies investigating the effect of the usually inalterable laser parameters wavelength and pulse duration on LaBP to an extent that they could serve as a basis for a laser purchase decision. The present study should contribute to remedy of this deficiency.
It turns out that in combination with a metal DRL, a wide range of laser wavelengths and pulse durations can be applied and no optimal parameters really exist. Therefore, other laser parameters can be decisive such as pulse-to-pulse and long-term stability, compactness, or inexpensiveness. However, wavelengths and pulse durations outside the investigated range, especially even longer pulse durations, might be less suitable for LaBP. Furthermore, if other absorption materials such as polymers are used, a significant effect of the applied wavelength would be expected and UV lasers are often preferred. Additionally, investigating the effect of the parameters laser pulse energy, focal spot size, and the resulting pulse intensity also did not identify specific optimal parameters but a complex dependence of droplet volume and jet velocities on focus geometry and pulse energy.
In conclusion, this study does not identify the best laser for LaBP, but demonstrates that a wide variety of lasers can be applied for LaBP with metal DRL.
Conflict of Interest and Funding
No conflict of interest was reported by all authors. The authors acknowledge financial support from Deutsche Forschungsgemeinschaft (DFG), the Cluster of Excellence REBIRTH, and Lower Saxony project Biofabrication for NIFE.
References
- 1.Palla-Papavlu A, Paraico I, Shaw-Stewart J, et al. Liposome micropatterning based on laser-induced forward transfer. Applied Physics A. 2011;102(3):651–659. https://doi.org/10.1007/s00339-010-6114-1. [Google Scholar]
- 2.Schiele NR, Chrisey DB, and Corr DT. Gelatin-based laser direct-write technique for the precise spatial patterning of cells. Tissue Engineering Part C:Methods. 2011;17(3):289–298. doi: 10.1089/ten.tec.2010.0442. https://doi.org/10.1089/ten.tec.2010.0442. [DOI] [PMC free article] [PubMed] [Google Scholar]
- 3.Pirlo RK, Wu P, Liu J, et al. PLGA/hydrogel bi- opapers as a stackable substrate for printing HUVEC networks via BioLP™. Biotechnology and Bioengineer- ing. 2012;109(1):262–273. doi: 10.1002/bit.23295. https://doi.org/10.1002/bit.23295. [DOI] [PubMed] [Google Scholar]
- 4.Dinca V, Farsari M, Kafetzopoulos D, et al. Patterning parameters for biomolecules microarrays constructed with nanosecond and femtosecond UV lasers. Thin Solid Films. 2008;516(18):6504–6511. https://doi.org/10.1016Zj.tsf.2008.02.043. [Google Scholar]
- 5.Othon CM, Wu X, Anders JJ, et al. Single-cell printing to form three-dimensional lines of olfactory ensheathing cells. Biomedical Materials. 2008;3(3):034101. doi: 10.1088/1748-6041/3/3/034101. https://doi.org/10.1088/1748-6041/3/3/034101. [DOI] [PubMed] [Google Scholar]
- 6.Horneffer V, Linz N, Vogel A. Principles of laser-induced separation and transport of lieving cells. Journal of Biomedical Optics. 2007;12(5):054016. doi: 10.1117/1.2799194. https://doi.org/10.1117/1.2799194. [DOI] [PubMed] [Google Scholar]
- 7.Duocastella M, Fernandez-Pradas JM, Morenza JL, et al. Sessile droplet formation in the laser-induced forward transfer of liquids:A time-resolved imaging study. Thin Solid Films. 2010;518(18):5321–5325. https://doi.org/10.1016/j .tsf.2010.03.082. [Google Scholar]
- 8.Brown MS, Brasz CF, Ventikos Y, et al. Impulsively actuated jets from thin liquid films for high-resolution printing applications. Journal of Fluid Mechanics. 2012;709:341–370. https://doi.org/10.1017/jfm.2012.337. [Google Scholar]
- 9.Ali M, Pages E, Ducom A, et al. Controlling laser-induced jet formation for bioprinting mesenchymal stem cells with high viability and high resolution. Biofab- rication. 2014;6(4):045001. doi: 10.1088/1758-5082/6/4/045001. https://doi.org/10.1088/1758-5082/6/4/045001. [DOI] [PubMed] [Google Scholar]
- 10.Taidi B, Lebernede G, Koch L, et al. Colony development of laser printed eukaryotic (yeast and micro- alga) microorganisms in co-culture. International Journal of Bioprinting. 2016;2(2):37–43. https://doi.org/10.18063/IJB.2016.02.001. [Google Scholar]
- 11.Duocastella M, Patrascioiu A, Fernandez-Pradas JM, et al. Film-free laser forward printing of transparent and weakly absorbing liquids. Optics Express. 2010;18(21):21815–21825. doi: 10.1364/OE.18.021815. https://doi.org/10.1364/0E.18.021815. [DOI] [PubMed] [Google Scholar]
- 12.Desrus H, Chassagne B, Catros S, et al. Proceedings of SPIE 9706—Optical Interactions with Tissues and CellsXXVII,97060O, March 7, y2016:Laser assisted bioprinting using a femtosecond laser with and without a gold transductive layer: A parametric study. SPIE Digital Library, USA. 2016 https://doi.org/ 10.1117/12.2209087. [Google Scholar]
- 13.Lin Y, Huang Y, Chrisey DB. Metallic foil-assisted laser cell printing. Journal of Biomechanical Engineering. 2011;133(2):025001. doi: 10.1115/1.4003132. https://doi.org/10.1115/1.4003132. [DOI] [PubMed] [Google Scholar]
- 14.Gruene M, Unger C, Koch L, et al. Dispensing pico to nanolitre of a natural hydrogel by laser- assisted bioprinting. Biomedical Engineering Online. 2011;10:19. doi: 10.1186/1475-925X-10-19. https://doi.org/10.1186/1475-925X-10-19. [DOI] [PMC free article] [PubMed] [Google Scholar]
- 15.Unger C, Gruene M, Koch L, et al. Time-resolved imaging of hydrogel printing via laser-induced forward transfer. Applied Physics A. 2011;103(2):271–277. https://doi.org/10.1007/s00339-010-6030-4. [Google Scholar]
- 16.Zhang Z, Xiong R, Mei R, et al. Time-resolved imaging study of jetting dynamics during laser printing of viscoelastic alginate solutions. Langmuir. 2015;31(23):6447–6456. doi: 10.1021/acs.langmuir.5b00919. https://doi.org/10. 1021/acs.langmuir. 5b00919. [DOI] [PubMed] [Google Scholar]
- 17.Sharma MK. Optimization of laser induced forward transfer by finite element modeling. Master thesis, Royal Institute of Technology-KTH, Stockholm, Sweden, viewed October 2, 2016. 2013 http : //www. diva-portal.org/smash/get/diva2:617570/full text01.pdf> .
- 18.Hopp B, Smausz T, Antal Z, et al. Absorbing film assisted laser induced forward transfer of fungi(Tricho- derma conidia) Journal of Applied Physics. 2004;96(6):34783481. https://doi.org/10.1063/L1782275. [Google Scholar]


